Evaluation of Oasis Sustainability Based on Emergy and Decomposition Analysis


Xinjiang Institute of Ecology and Geography of the Chinese Academy of Sciences, University of the Chinese Academy of Sciences, Urumqi 830011, China
*
Author to whom correspondence should be addressed.
Sustainability 2018, 10(6), 1856; https://doi.org/10.3390/su10061856
Submission received: 21 March 2018
/
Revised: 30 May 2018
/
Accepted: 1 June 2018
/
Published: 3 June 2018
(This article belongs to the Special Issue Advanced Technology for Sustainable Development in Arid and Semi-Arid Regions)
Abstract
:The human welfare and sustainability of oases have received wide attention because of the fragility of the ecological environment and the instability of these systems. In this study, the sustainability level and the driving forces of emergy utilization in the Hotan Prefecture (in the Xinjiang Uygur Autonomous Region, China) from 2005 to 2015 were evaluated using the emergy approach combined with the logarithmic mean Divisia index (LMDI) method. The emergy analysis showed that non-renewable resources (N) accounted for a large proportion of net emergy (U). The Emergy Sustainability Index (ESI) continued to decline in the study period, implying increasing environmental stress. From a long-term perspective, the system’s development is not sustainable. According to the emergy analysis and the LMDI results, it is imperative to pursue the following aims: (1) increase the per capita gross domestic product (GDP) and labor productivity, (2) improve the efficiency of state investment and aid fund utilization, (3) enhance the area’s sustainability level and economic independence, and (4) protect the area’s fragile ecological environment.
1. Introduction
The regional sustainability level is an important yardstick of social development as well as a comprehensive manifestation of economic development and people’s happiness. Nowadays, the regional sustainability level is mainly measured by the following methods: the energy flow method [1,2,3], the lifecycle analysis [4,5,6], and the ecological footprint analysis [7,8,9]. The three methods are widely used for the analysis of regional resource-bearing capacity and environmental accounting. Before the advent of the emergy concept and theory, determining how to reflect the regional sustainability level comprehensively and integrate and mutually convert three types of flow (energy flow, material flow, and currency flow) had been a long-standing issue. Over time, people have been committed to seeking a study scale and method that can be used for quantitative analysis and study by combining the ecological system and the economic system [10]. The emergy approach is such a method; specifically, it is an integrated method rooted in the energy system and ecological economics.
The emergy theory was founded in the 1980s by Odum. Emergy is different from energy. Specifically, emergy refers to the energy required for making a resource, product, or service [11]. The quantity of a type of energy contained in flowing or stored energy is referred to as the emergy of the energy. Emergy is usually measured in terms of solar energy (unit: solar emjoules or sej). For example, when 1 cm³ of rainwater drops on the ground, the emergy is 75,000 sej. In emergy analysis, solar transformity (unit: sej/J or sej/g) is used as the unit of transformation for different types of matter or energy. Namely, the solar emergy per unit energy or matter can be used to transform the different types of energy or matter flowing and stored in an ecological–economic system into the emergy ratio of the same standard. Odum, Brown, Hau, Sciubba, and Ulgiati have published many works about emergy [10,12,13,14,15,16,17,18,19,20,21,22]. They calculated the emergy transformity and discussed its calculation method [23,24,25,26,27,28].
Emergy analysis is used to evaluate the level of system sustainability from different angles and scales. From the angle of ecology and ecosystem service value, Campbell et al. studied the significance of oyster coral reefs to society, concluding that oyster coral reefs are a typical species that transcend their market value, and it is necessary to calculate the welfare of their ecosystem services to mankind [29]. In agricultural, economic, and social studies, Fonseca et al. used the emergy analysis method to evaluate the benefits of cattle breeding on the Montado farm, and offered some suggestions to optimize the system sustainability [30]. In the emergy evaluation for industries and technologies, Li et al. applied the emergy analysis method to the closed-loop recycling process, specifically evaluating the environmental stress of each recycling stage according to the emergy of products [31]. Liu et al. selected two cities and compared their similarities and discrepancies from the perspective of urban metabolism [32].
Decomposition analysis is widely used to study the key driving factors that affect energy consumption, carbon emissions, material consumption, and production demand [33,34,35,36]. Decomposition analysis includes structure decomposition analysis (SDA) and index decomposition analysis (IDA). As a branch of the IDA model, the LMDI model is a decomposition model that is applicable to the circumstance in which there are not many variables and a time series is involved. The LMDI model can do without the data of an input–output table, so it is easy to use and is widely used in many fields.
Although the human welfare and sustainability of oases have received wide attention [37,38,39,40], the comprehensive studies based on emergy and index decomposition mainly focus on developed economic systems or industrial systems [41,42,43,44,45]. However, none of them touch on the sustainability of underdeveloped oases. In previous regional-scale studies, some scholars analyzed the sustainability level of resource-based cities or islands [46,47]. Such papers mainly focused on the resource utilization level, the running status of the economic system, and the evaluation of the regional development level. The Hotan Prefecture is a typical oasis system in northwest China that is characterized by a fragile ecosystem and poor economic extroversion; it is a clustered area of minorities. By using emergy analysis combined with LMDI, this paper evaluated the sustainability level and the driving forces of emergy utilization from 2005 to 2015, which provides an important reference and basis for policy-making in the future.
2. Materials and Methods
2.1. Study Area
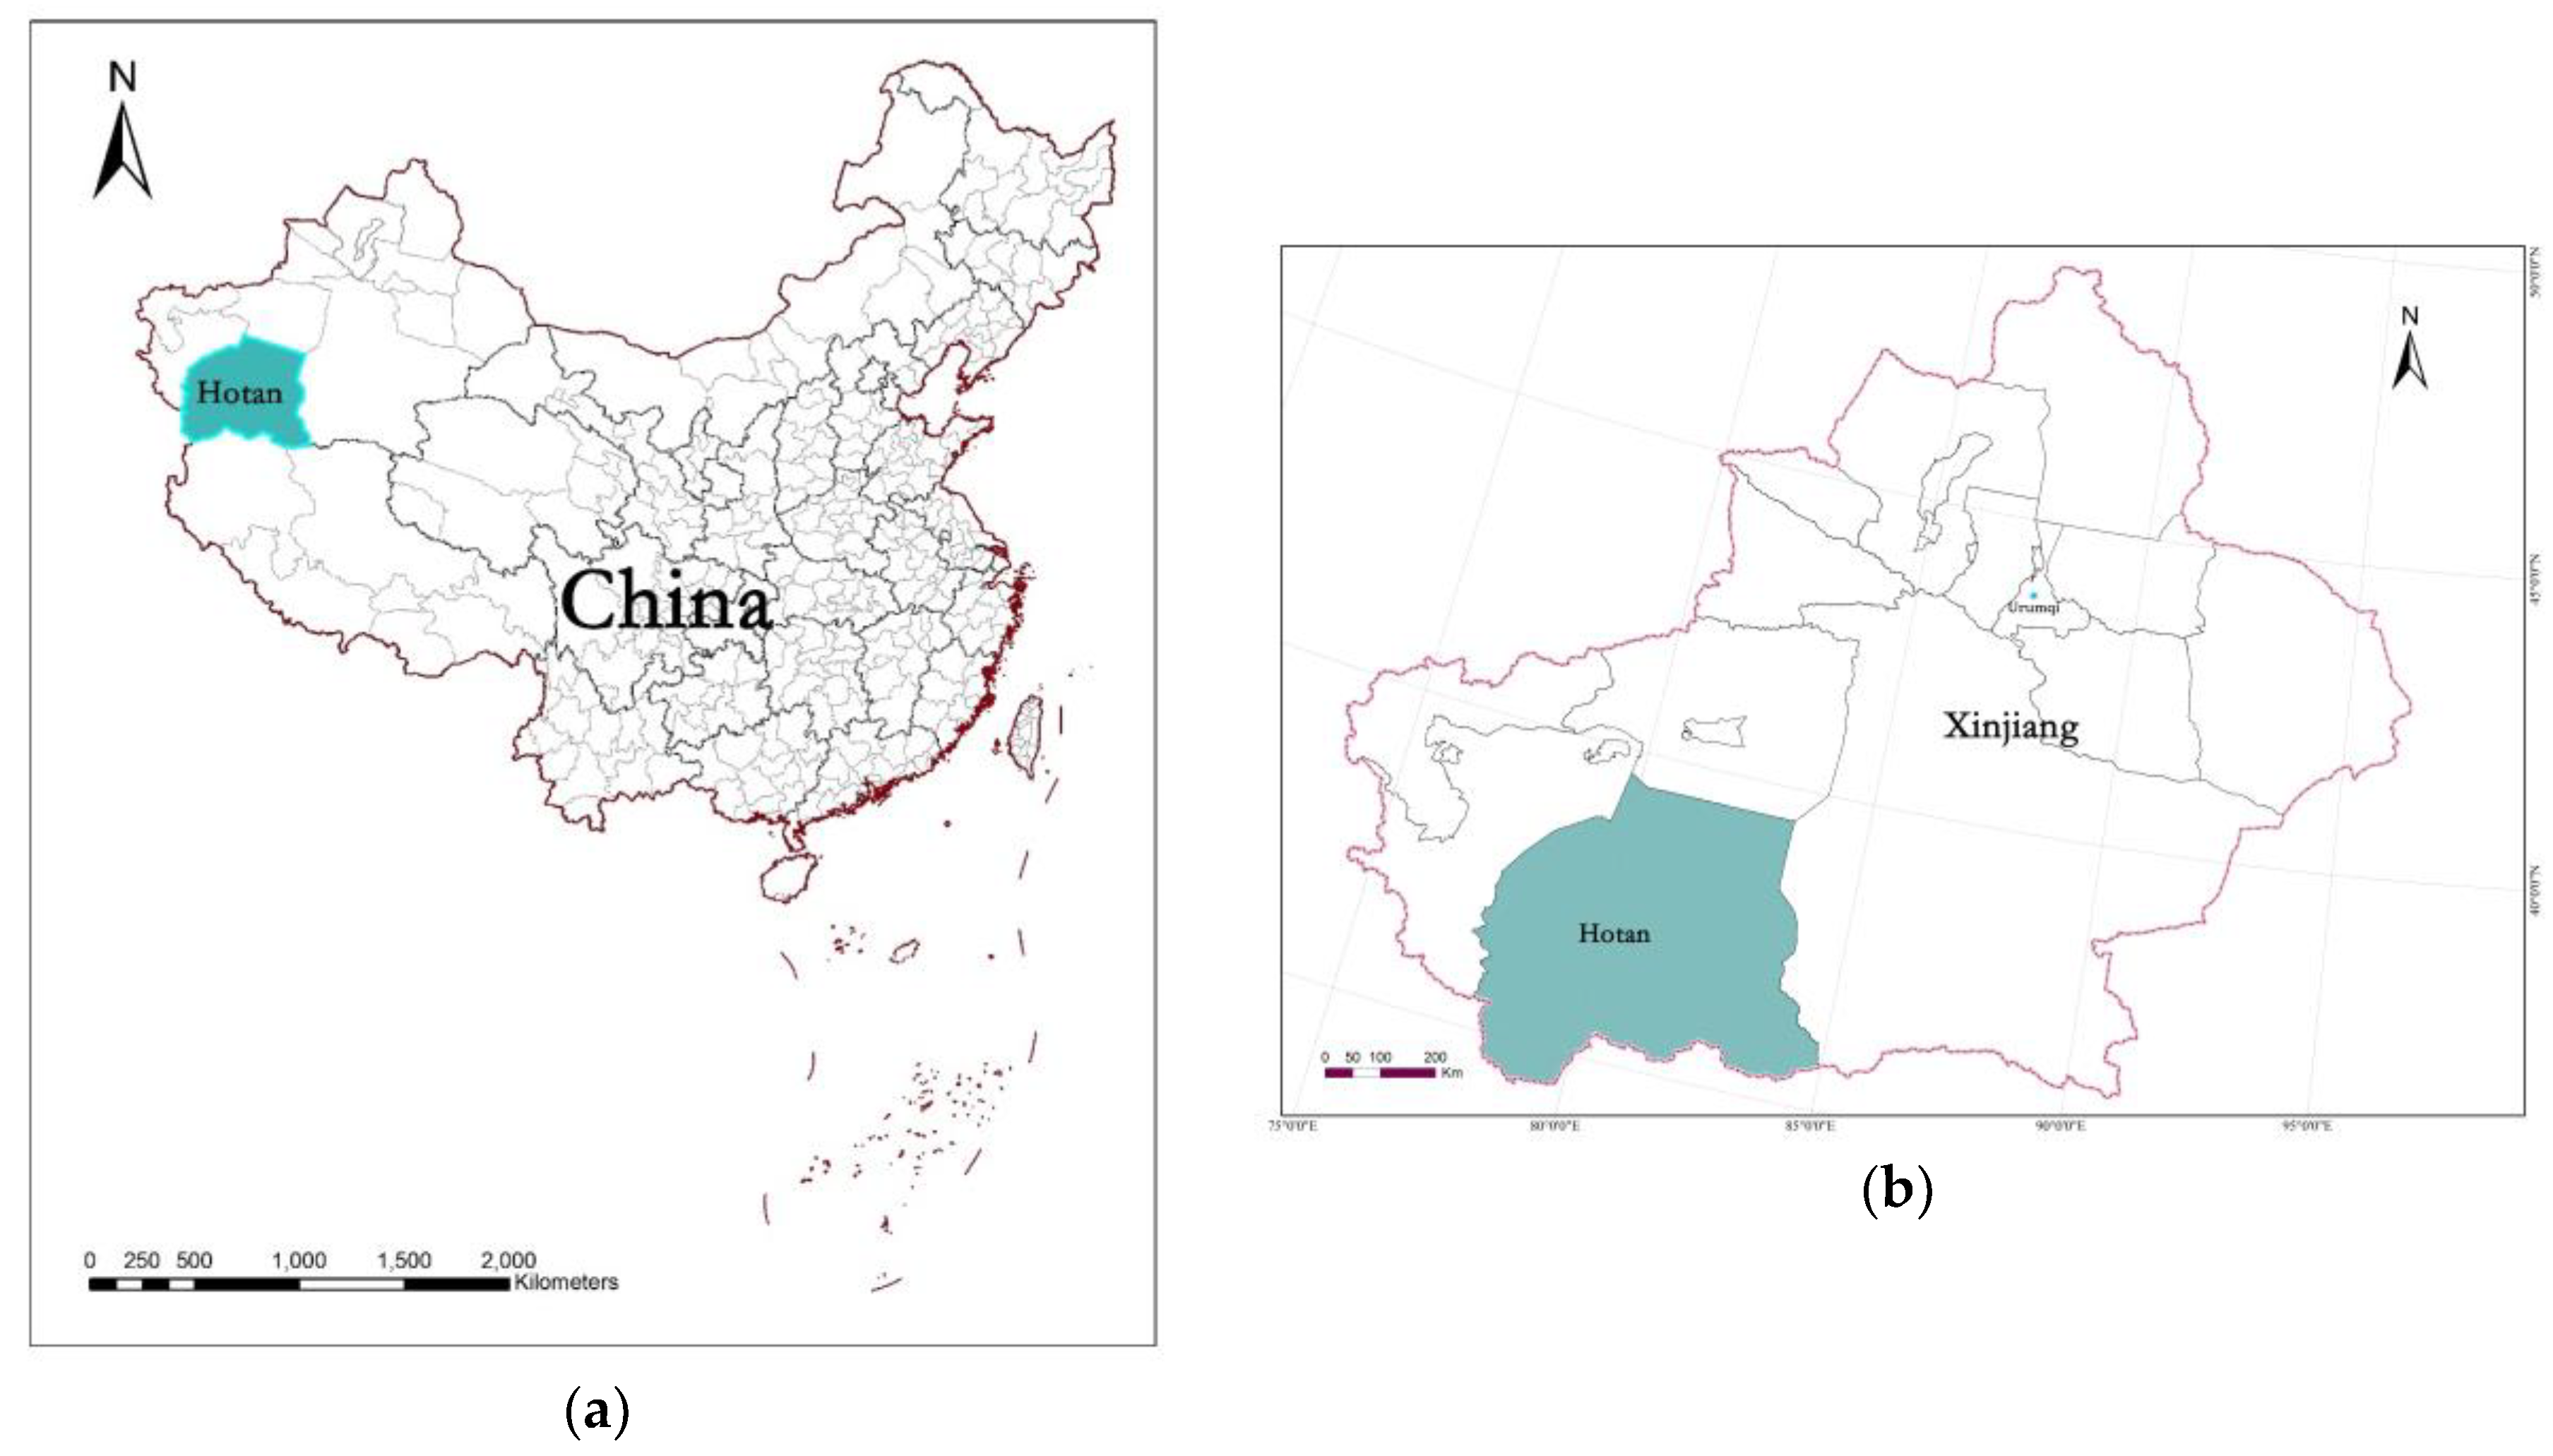
The Hotan Prefecture is in the southeastern Xinjiang Uyghur Autonomous Region (Figure 1). Its center is located at 37°7′12″ N 79°55′12″ E; its average altitude is 1400 m. It administers one city and seven counties: Hotan City, Hotan County, Moyu County, Pishan County, Luopu County, Cele County, Yutian County, and Minfeng County. It occupies approximately 248,100 km2. Hotan City is 1513 km away from Urumqi, which is the capital of the Xinjiang Uyghur Autonomous Region. Of the total area, mountainous lands account for 44.5%, the Gobi and other deserts account for 49.73%, and oases account for only 3.96% [48]. It is dominated by an arid desert climate, with a hot and arid summer and a cold and arid winter. The total amount of solar radiation is very high; for example, the annual amount of solar radiation in the plains areas is 5934 MJ/m2. The annual sunshine duration is 2747–3038 h, the cumulative temperature of 10 °C is 4200 °C, and the annual frostless period (with surface temperature greater than −1 °C and minimum air temperature at least 4 °C) lasts for 170–201 days [49].
In 2015, the study area had a total population of 2,324,300 [21], composed of over 30 ethnicities. In 2015, the gross domestic product (GDP) was $3624 billion, and the per capita GDP was $1573. The ratio of primary, secondary, and tertiary industries was 25.8:16.7:57.5. The manufacturing industry is underdeveloped, and the primary industry plays an important role. The tertiary industry accounts for a high proportion of industries, but mainly focuses on such sectors as building, education, public administration, and social security. The industrial structure is simple, and the economy is underdeveloped. Distinctive agricultural and forest products include red dates and walnuts. In 2015, the yield of red dates was 96,500 tons with a per capita yield of 42.13 kg, and the yield of walnuts was 154,400 tons with a per capita yield of 67.4 kg [49].
The Hotan Prefecture is located within a typical oasis system, which is characterized by a close link between humans and nature and a fragile and unstable ecosystem. In this study, it is used as a typical case for evaluating the sustainability level of an oasis.
2.2. Data Sources
The initial study data herein is available from the statistical yearbook of the Hotan Prefecture (from 2006 to 2016) [49].
2.3. Emergy Approach
2.3.1. Emergy Theory
The oasis emergy system is an integrated system that relates to the economic, social, and natural sustainability of an oasis. By referencing the research findings of other scholars, this paper selected the matter and energy items most closely correlated with the whole oasis system and calculated the energy and emergy of each item, thus composing an oasis emergy system. Table 1 describes the emergy classification, emergy composition, and emergy transformity regarding the oasis system. Emergy transformity was recalculated according to the new global emergy benchmark, 15.83 × 1024 sej/a [19,50].
Renewable resources (R) include renewable environmental resources (R0) and indigenous products (R1). The renewable environmental resources are a manifestation of the natural conditions of the oasis system. To avoid a repetitive calculation of emergy, this paper only took the sum of the earth’s circulation energy and the largest of the following: solar energy, wind energy, potential energy of rainwater, or chemical energy of rainwater [17]. Indigenous products include farming products, livestock products, forest products, and aquatic products. They are derived from environmental resources in the oasis system, and provide the source of food that maintains the survival of humans in the oasis system. Non-renewable resources (N) include environmental non-renewable resources (N0) and locally produced non-renewable resources (N1). Environmental non-renewable resources include the net losses of the surface soil layer. Locally produced non-renewable resources include the main industrial products produced in the oasis system, including raw coal, cement, steel, electric power, and tap water. Import emergy (IMP) refers to all of the energy streams that enter the oasis system from the outside, including the externally inputted goods and services, inbound tourism, investment, aid funds to Xinjiang, and fiscal surplus. Aid funds to Xinjiang account for a considerable proportion of import emergy. Export emergy (EXP) includes the goods and services exported from the oasis system.
2.3.2. Emergy Indices
The following indices were used to evaluate the sustainability level of Hotan’s emergy system.
- (1)
- Aggregate Indices
Net emergy (U) is the total emergy inputted and utilized by the system, and is equal to the sum of R, N, and IMP.
- (2)
- Efficiency Indices
The net emergy yield ratio (EYR) is the ratio of net emergy to import emergy, U/IMP. EYR was used to measure the contribution of externally inputted emergy to economic development in the oasis system. The emergy/currency ratio (EG) is the ratio of net emergy to GDP, U/GDP. For convenience of comparison, the GDP in RMB (China Yuan), which is based on the present prices, was converted into GDP based on comparable prices of a year and then converted into US dollars. Emergy density (ED) is the emergy per unit area of land, U/Area. It is used to measure the intensity of emergy. Emergy per capita (EP) reflects the emergy possessed per capita. The larger the EP value, is, the higher the living standards.
- (3)
- Stress Indices
The environmental load ratio (ELR) is the ratio of the emergy input of non-renewable resources to the emergy input of renewable resources, (N + IMP)/R. ELR is used to measure the degree of environmental stress.
- (4)
- Comprehensive Indices
The ESI was jointly made by Brown and Ulgiati [51]. ESI is the ratio of the system’s emergy yield ratio to the environmental load ratio, EYR/ELR, and is a comprehensive index for measuring the sustainability level of an oasis system.
2.4. Index Decomposition
Some scholars have studied the emergy structure by using the emergy theory combined with the index decomposition method. Using data envelopment analysis and decomposition analysis, Zhang et al. evaluated the system sustainability of Qingyang and its eight constituent districts [41]. In light of the emergy theory, Liu Zhe et al. studied the influencing factors of industrial symbiosis in industrial parks through the human impact population affluence technology (IPAT) equation and the IDA model [42]. Using the emergy theory combined with the LMDI method, Lu Sun et al. analyzed the sustainability level of Shenyang City and determined the driving factors of emergy utilization [43]. Using a combination of the emergy approach and the LMDI method, Xu Tian et al. studied the balance of trade between China and Japan [44]. Using the Kaya equation combined with the IDA model (index decomposition analysis), Liu Zhe et al. analyzed the key factors that affect the sustainability of the Tianjin Economic–Technological Development Area [45]. The published comprehensive studies based on emergy and index decomposition mainly focus on developed economic systems or industrial systems, but rarely touch on the sustainability of an oasis system. The Hotan Prefecture is an economically underdeveloped region whose industrial structure is dominated by agriculture. Its development must rely on national aid funds, and both its emergy structure and sustainability factors are very special. Considering this, it is necessary to analyze its emergy structure and driving factors of efficiency through index decomposition.
Ehrlich and Holdren quantified the environmental impact of mankind. Specifically, the environmental impact is regarded as a function of population, technology, and affluence, i.e., the IPAT model. The function is expressed as follows: I (Environmental impact or stress) = P (Population) × A (Affluence) × T (Technology, indicating the specific technology that supports affluence) [52]. The IPAT model provides an analytical framework by combining the human driving force with the core factors of the environmental issue. Specifically, in a country or region, the impact on the environmental and ecological systems is the outcome of its population and affluence, and is damaged by the specific technology that supports such affluence. This model is also referred to as the environmental stress control model, which is essentially used to measure the imported impact or stress on/to the environment produced by human activities [53].
We used an improved IPAT model in which the net emergy is decomposed as follows:
In Equation (1), R refers to renewable resources, N refers to non-renewable resources, GDP refers to the gross domestic product (measured on the basis of the comparable prices of 2005 and converted to US dollars), and POP refers to the population. For the convenience of calculation and expression, each constituent factor of the net emergy was replaced by the following equation:
In Equation (2), C is the structure factor, indicating the ratio of the system’s total emergy input to the emergy input of local resources.
In Equation (3), E is the efficiency factor, indicating the resource input emergy per unit of GDP. E reflects the efficiency of resource utilization. The smaller the E value, the higher the yield efficiency of input resources.
In Equation (4), G is the economic factor, indicating the ratio of the GDP to the population. G reflects the per capita GDP, namely, the economic scale. To some extent, G reflects the level of affluence of the people in the system.
When other conditions remain constant, a larger population means a larger demand for and consumption of net emergy. Due to the complexity of the demographic factor, the net emergy will be influenced by the structure, movement, regional distribution, and rural–urban differences of the population.
In summary, U is expressed as follows:
According to Equation (5), when other conditions remain constant, U will increase with the rise of the following factors: the ratio of the system’s total emergy input to the emergy input of local resources (C), resource input emergy per unit of GDP (E), per capita GDP or living standard (G), and population size (POP).
In this paper, the addition model of LMDI I was selected to decompose the driving factors of the oasis emergy system, specifically:
In the above equation, refers to the net emergy of Period t, and refers to the net emergy of the base period (2005 is the base period, and 2006 to 2015 are the changing periods). The variation in the net emergy can be decomposed as the sum of variation in all factors:
The contribution of each single factor can be calculated by the following equations:
3. Results
3.1. Emergy Stream Analysis
The Hotan Prefecture is dominated by a dry and scarce rain climate. Therefore, wind energy plays a dominant role compared with solar energy, the potential energy of rainwater, and the chemical energy of rainwater. This is totally different from the research conclusions regarding Guangdong, Tibet, etc. [54]. From 2005 to 2015, the R0 was maintained at 5.97 × 10²² sej, and the R1 increased steadily from 1.02 × 10²² sej (2005) to 1.64 × 10²² sej (2014), which was an increase of 60.78% over 10 years. In 2015, the R1 increased rapidly to 2.89 × 10²² sej, which is 1.76 times the R1 in 2014. This shows that the output of the primary industry increased sharply in 2015. Table 2 describes the emergy flows of the study area.
There was a slight variation in the emergy of environmental non-renewable resources. From 2005 to 2015, there existed three stages regarding the variation in the emergy of locally produced non-renewable resources. From 2005 to 2015, with the increasing consumption of fossil fuels, the emergy of N1 increased remarkably from 3.26 × 1024 sej to 1.32 × 1025 sej. The import emergy increased rapidly from 1.45 × 10²³ sej (in 2005) to 1.31 × 1024 sej (in 2015), which was a ninefold increase.
3.2. Emergy Index Analysis
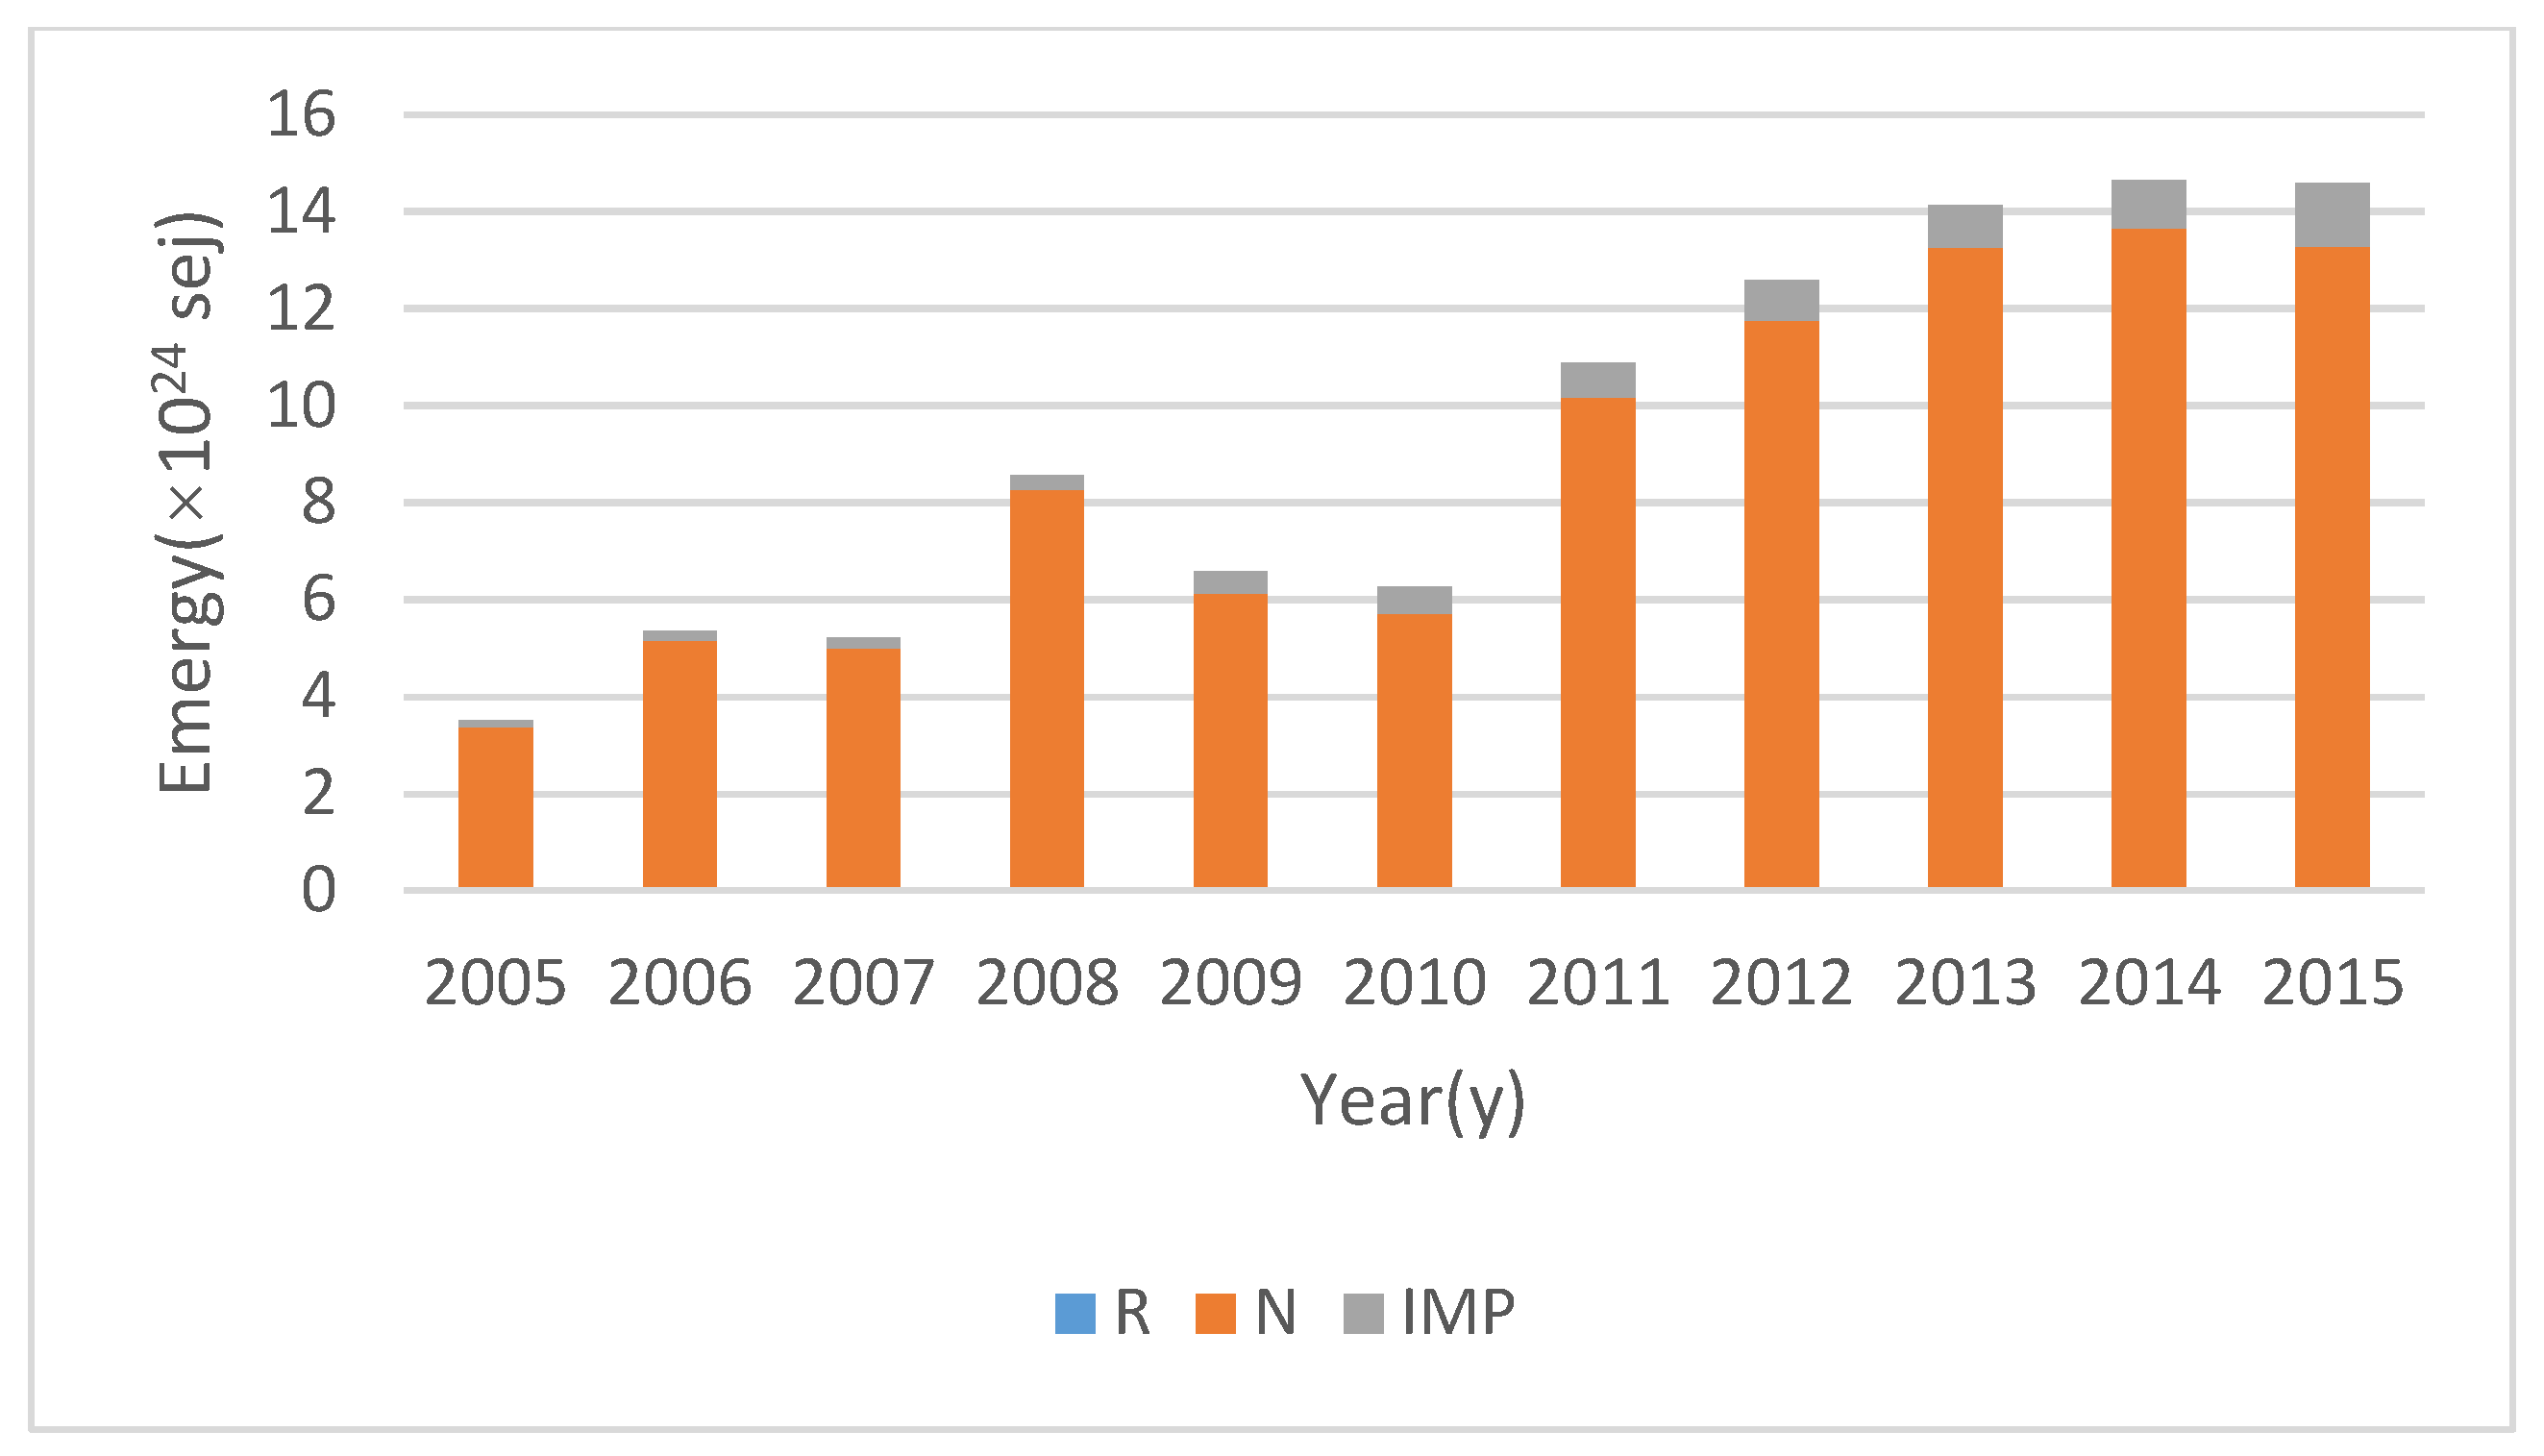
Table 3 shows that emergy indices and indicators for Hotan. From 2005 to 2015, the net emergy increased rapidly from 3.53 × 1024 sej (in 2005) to 1.46 × 1025 sej (in 2015), i.e., by 4.14 times in 11 years (as shown in Figure 2). The net emergy decreased only in 2009 and 2010, and then increased abruptly in 2011. The increase in the net emergy was primarily contributed to by non-renewable resources.
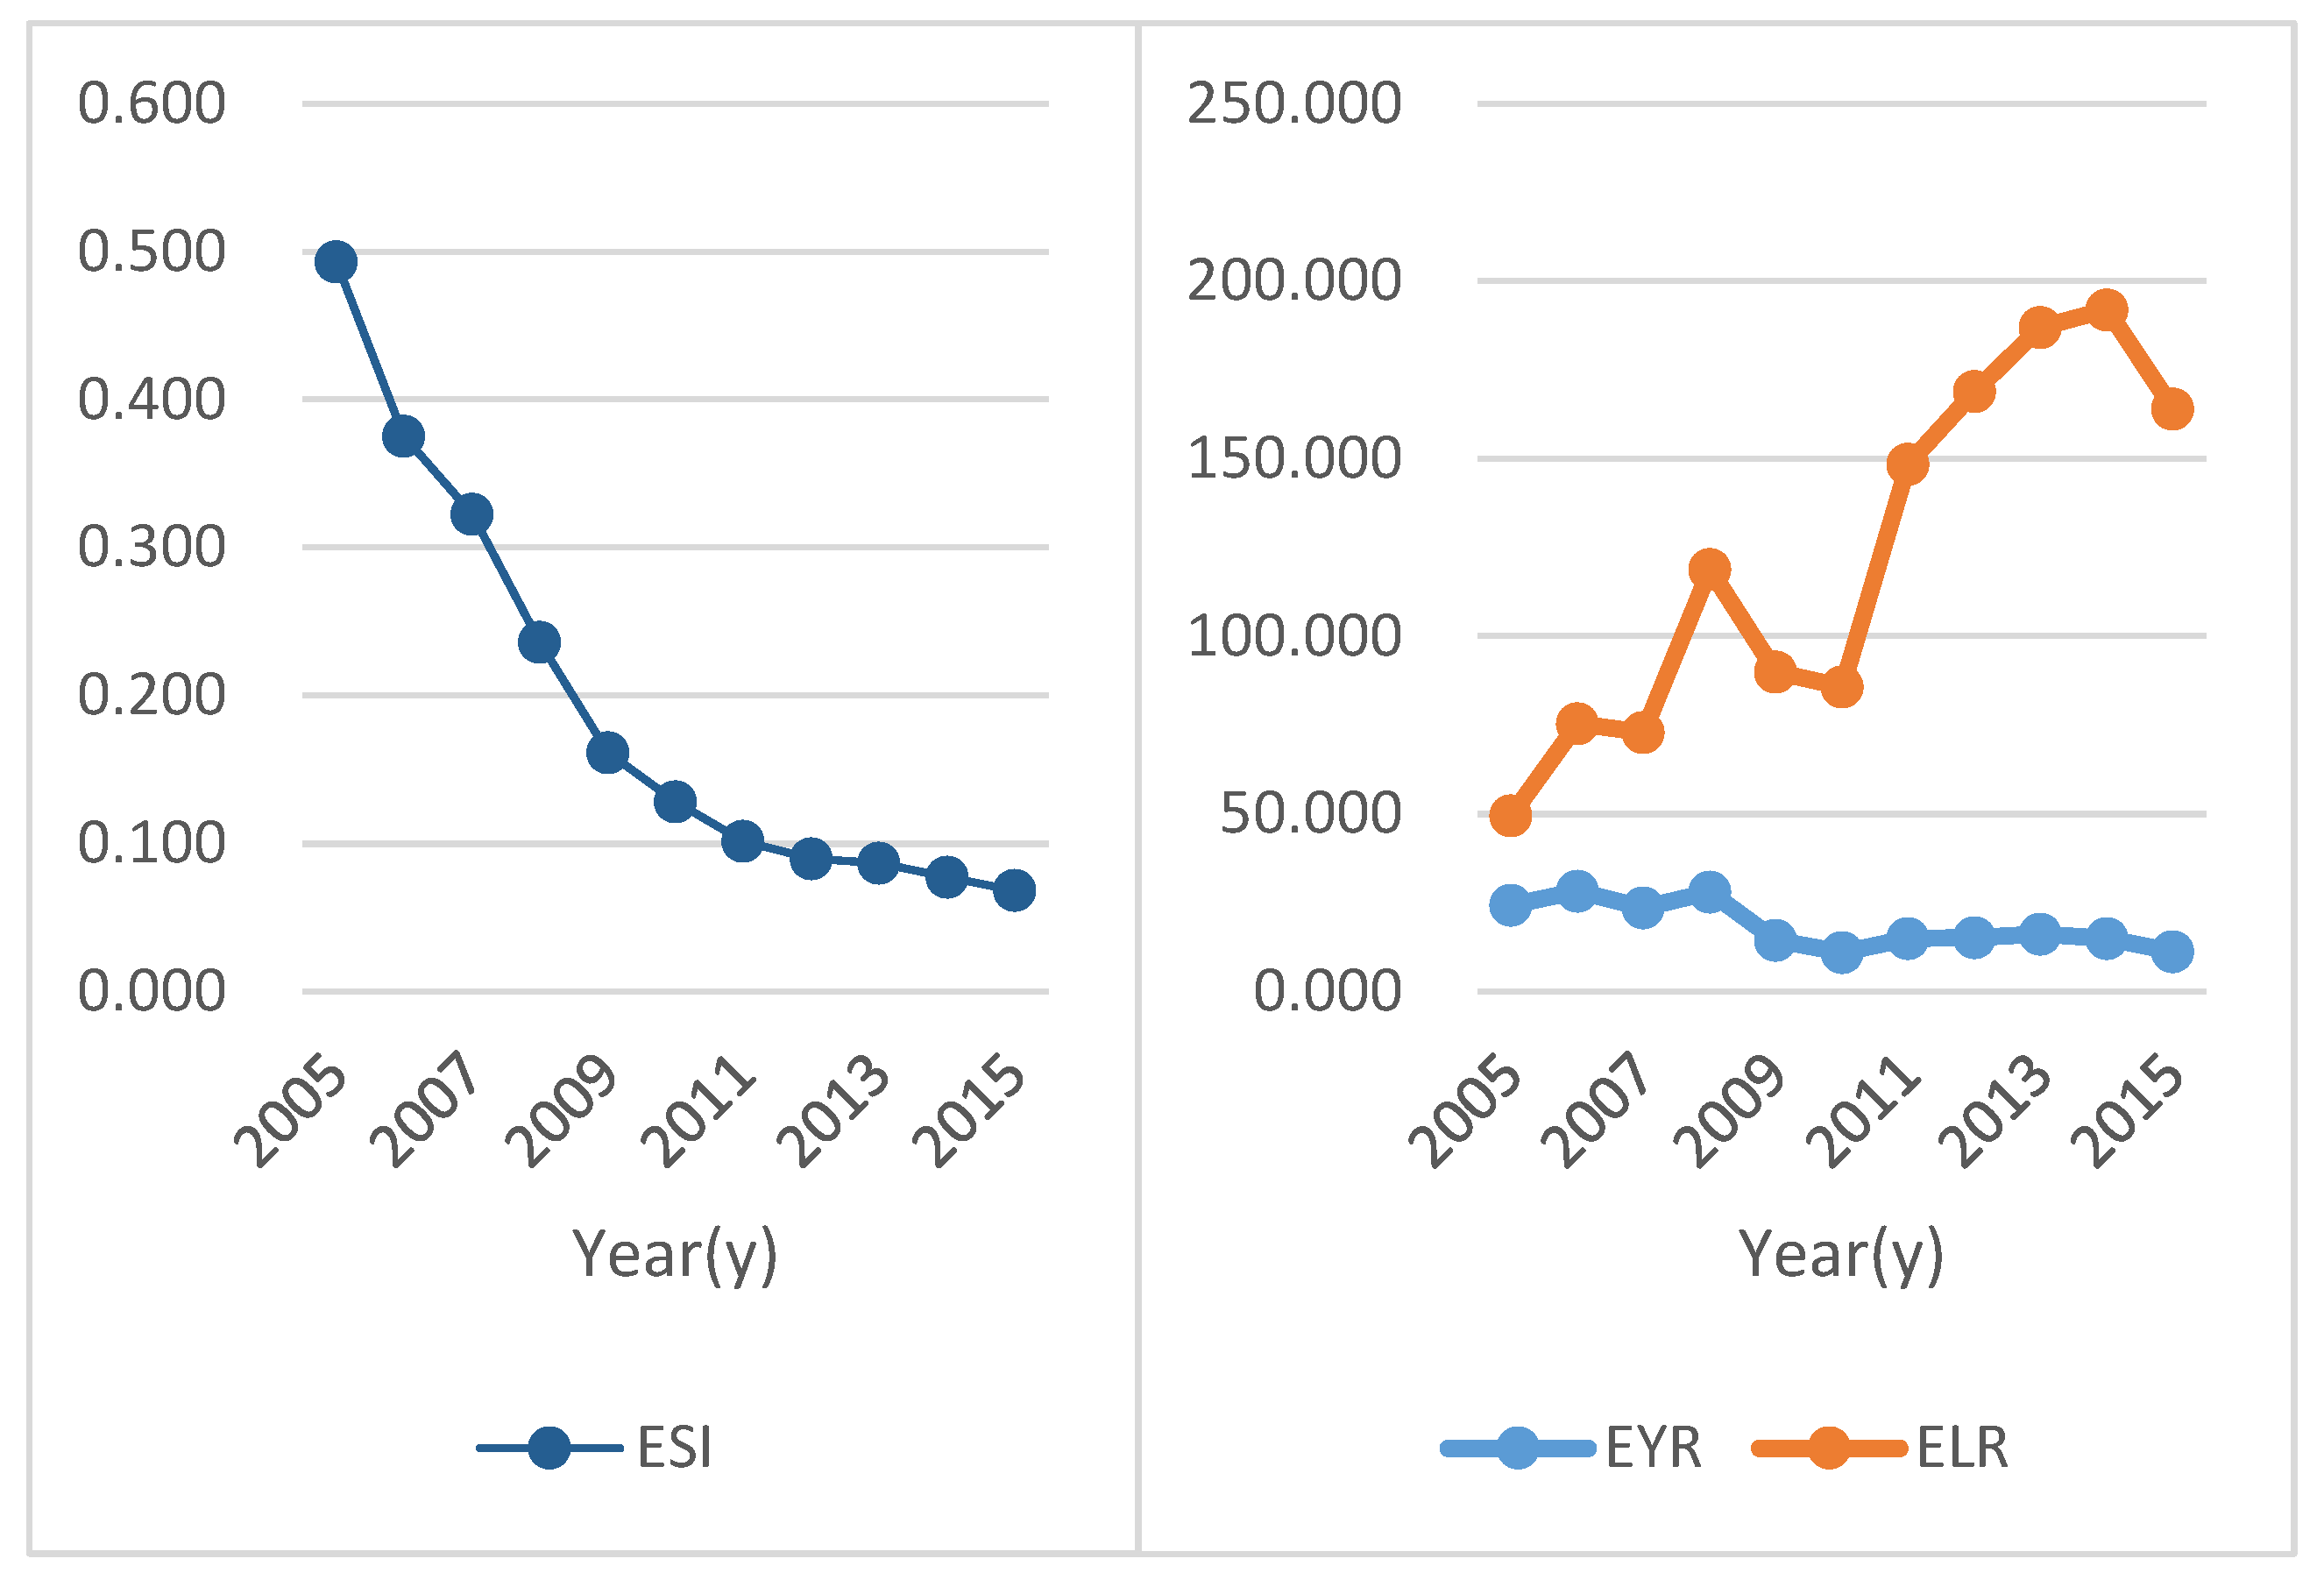
The larger the EYR value, the higher the utilization efficiency of the import emergy. From 2005 to 2015, the EYR tended to decrease overall (as shown in Figure 3). Specifically, the EYR decreased from 24.39 (in 2005) to 11.02 (in 2010), remained stable from 2010 to 2015, and finally reached 11.18 in 2015.
ELR is used to measure the degree of environmental stress. From 2005 to 2015, the ELR increased significantly (as shown in Figure 3). Specifically, it increased by 3.31 times from 49.46 (in 2005) to 164.13 (in 2015).
The ESI continued to decrease from 2005 to 2015 (as shown in Figure 3). Specifically, the ESI in 2005 (0.493) was 7.25 times that in 2015 (0.068).
The emergy/currency ratio is measured in sej/$. For the convenience of comparison, the GDP from 2005 to 2015 was calculated in terms of comparable prices in 2005 and was converted into US dollars according to the exchange rate in 2005. The EG of economically underdeveloped regions is usually high. From 2005 to 2015, the EG experienced four stages: (1) increase, (2) decrease, (3) increase, and (4) decrease. The EG in 2015 was somewhat higher than in 2005, indicating that the Hotan Prefecture is economically underdeveloped.
Emergy density and emergy per capita shared a similar trend: increase, decrease, and continuous increase. ED is used to measure the intensity of emergy, and EP is used to measure the living standard of a region. From 2005 to 2015, the population increased from 1,825,127 to 2,324,287. The increase in ED and EP shows that the Hotan Prefecture has embraced a rapid economic development and is also being confronted with a high environmental stress.
3.3. Driving Factor Analysis
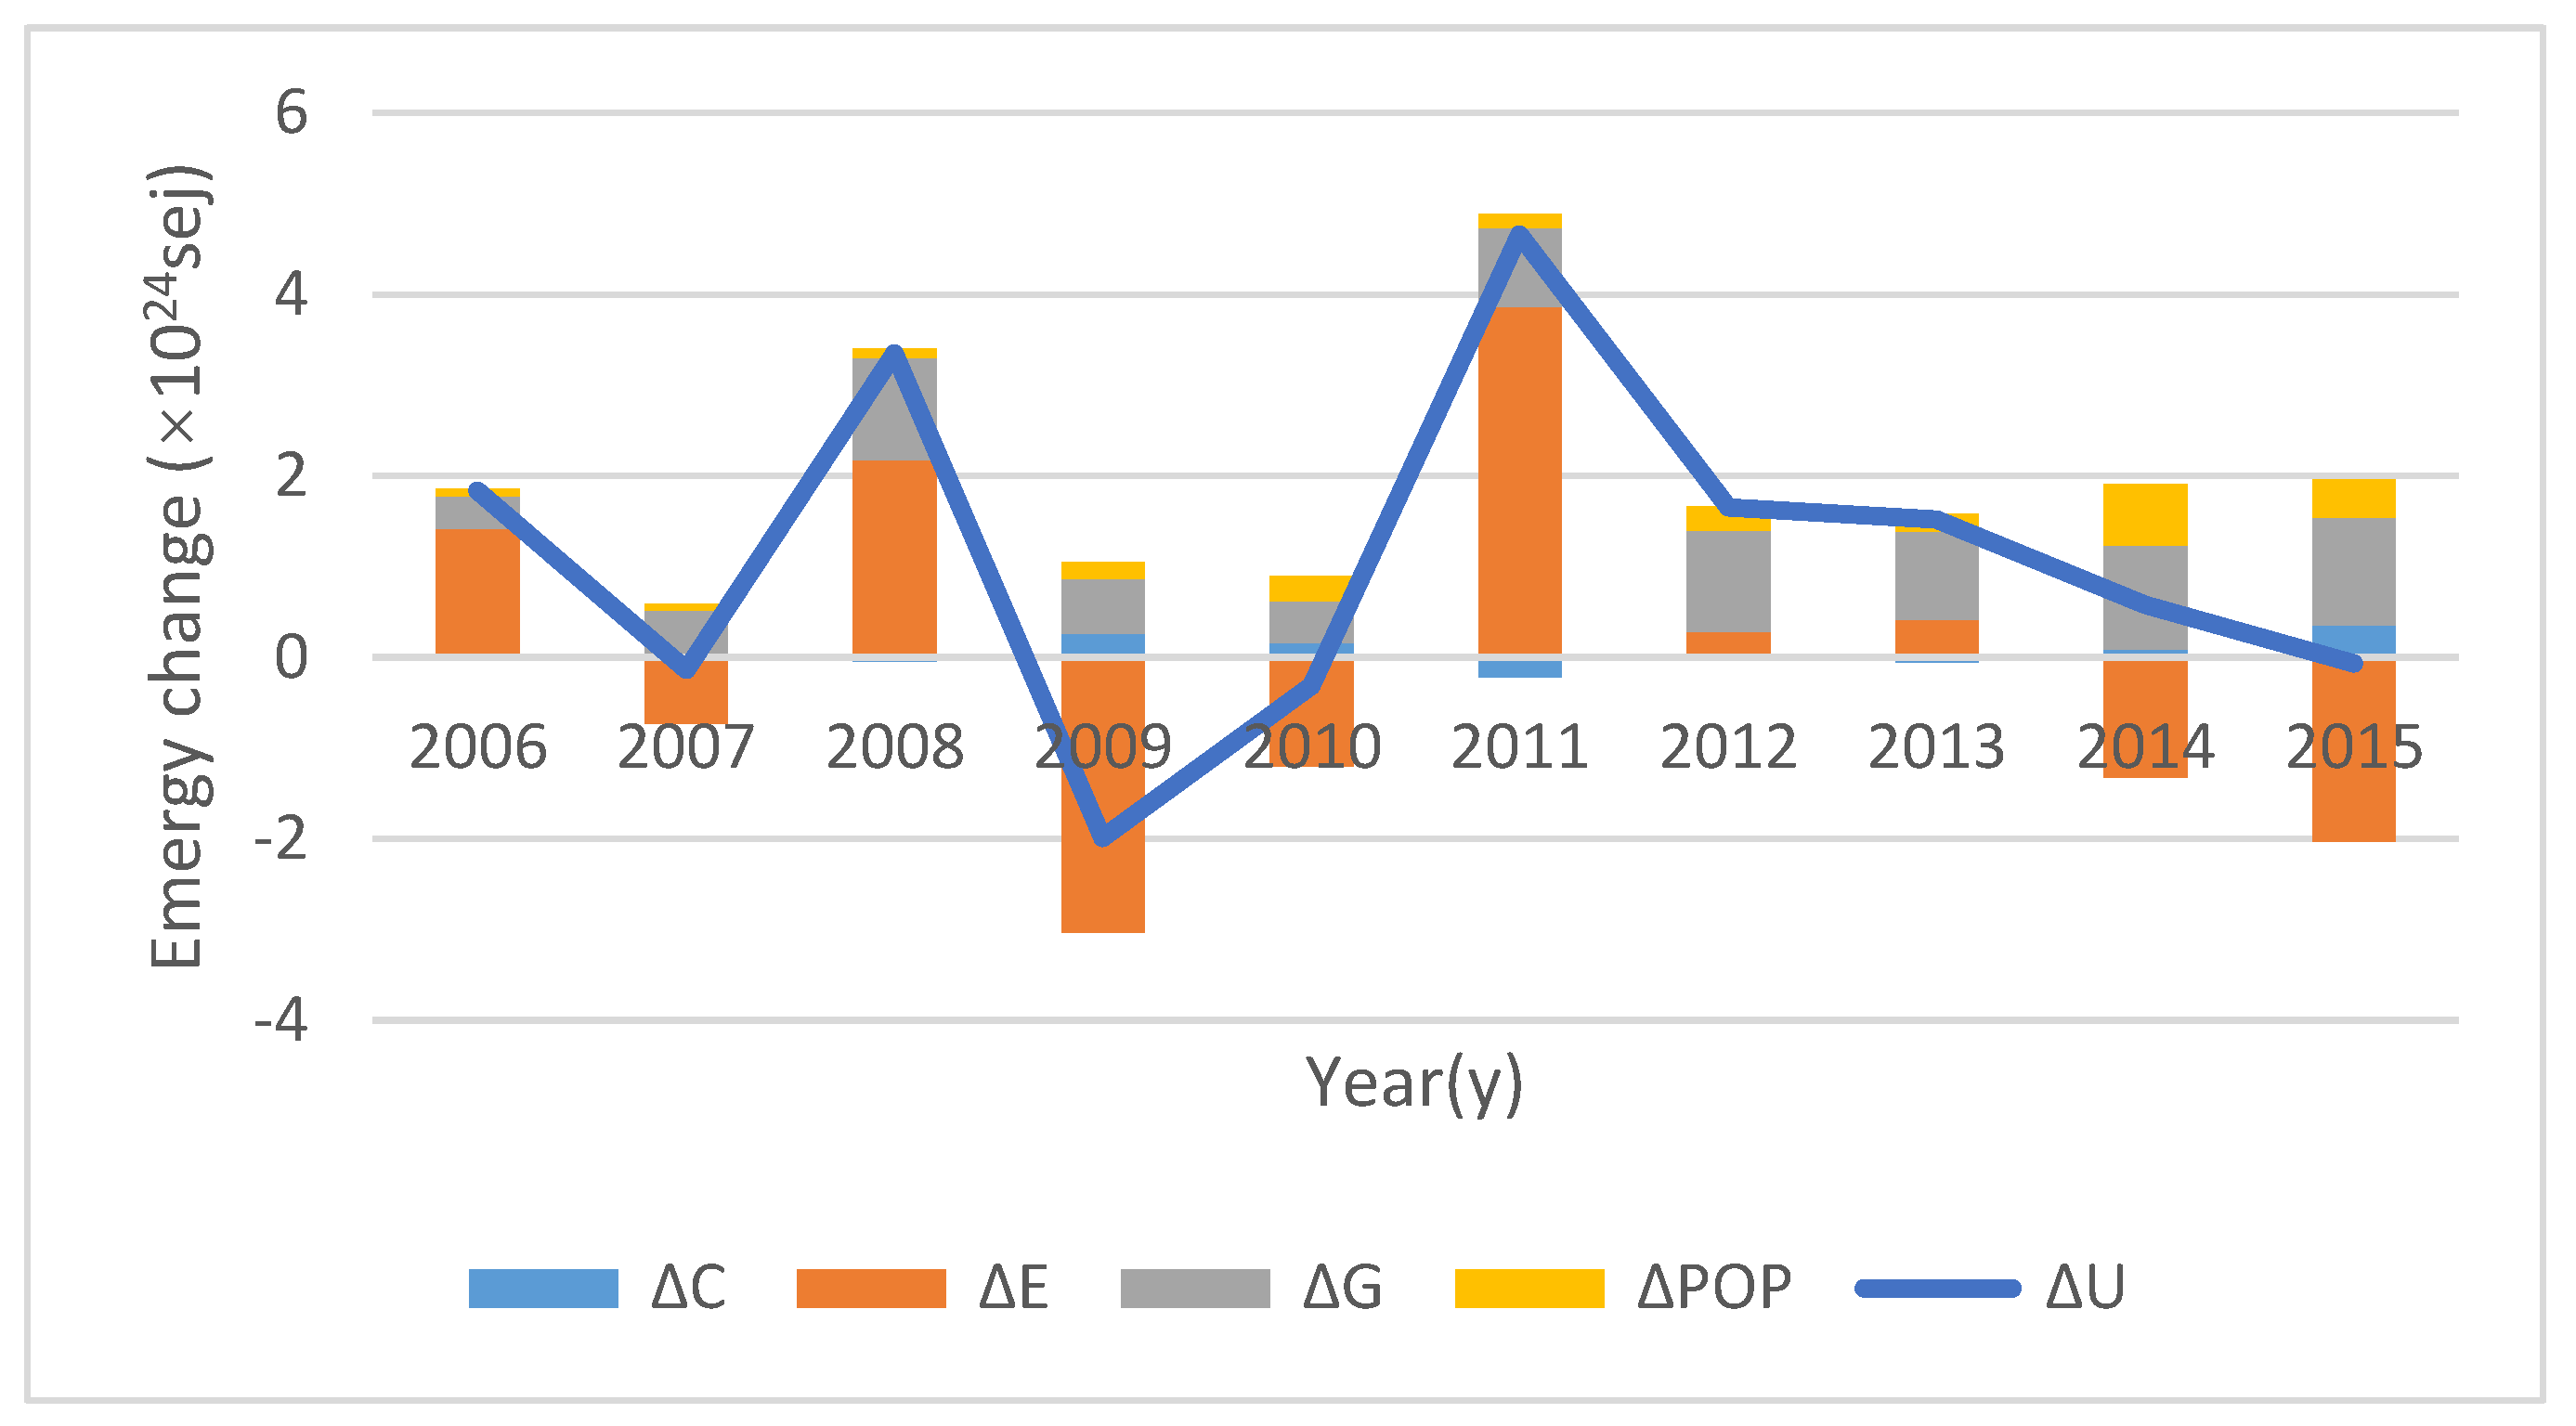
To evaluate the sustainability level, we analyzed the driving factors of net emergy. Figure 4 and Table 4 present the contribution of various driving factors to net emergy from 2006 to 2015.
The variations in the driving factors can be divided into three stages. In the first stage (2006 to 2010), the total effect fluctuated between negative and positive. In the second stage (2011 to 2014), the total effect was positive. During this period, external financial aid was increased, and the Hotan Prefecture actively developed its distinctive forestry and fruit industry. In the third stage (2015), the total effect was negative.
The economic factor was the primary driving factor of the increase in the net emergy, because the economic foundation is very poor. In 2005, its GDP was only $1934 billion (calculated in terms of comparable prices in 2005), and its per capita GDP was $1559.04 (calculated in terms of the prices of the current year). A low GDP implies that the net emergy value is small.
The demographic factor (i.e., POP) ranked second in terms of contribution to the increase in net emergy over the last 10 years, and did not contribute significantly to the increase in net emergy. The Hotan Prefecture has a very high natural population growth rate. In 2015, its natural population growth rate was as high as 17.51%, far higher than the national average (5.8%). Due to the poor structure and resources of the population, however, the ability of the demographic factor to promote emergy input is very limited.
Among all of the driving factors, the structural factor ranked third in terms of contributions to the increase in net emergy. This implies that the import of external resources strengthened the economic vigor of the whole system, but to a very limited extent. The increase in the structure factor shows that the import emergy continued to increase. On one hand, the Hotan Prefecture is gradually ridding itself of the excessive reliance on local resource input; on the other hand, it is increasingly relying on external aid.
The efficiency factor was the primary driving factor of the decrease in net emergy. The role of the efficiency factor is unstable. Specifically, the efficiency factor played a significant positive role in certain years (e.g., 2006, 2008, and 2011), but a significant negative role in other years (e.g., 2009, 2010, 2014, and 2015).
4. Discussion
The Hotan Prefecture is a typical oasis system characterized by economic underdevelopment and simple industrial structure. Over this past decade, similar to other regions of China, it has experienced rapid economic development. It has also been confronted with various problems, including environmental pollution, unreasonable industrial structure, and a widening gap with other regions of China. Using the emergy analysis method combined with the LMDI method, we analyzed the sustainability level and driving factors of emergy.
When the emergy sustainability index (ESI) was first proposed by Brown and Ulgiati, a system was defined as a developed country or region if ESI <1, whereas it was defined as a developing country or region if 1< ESI <10 [51]. However, some researchers have expressed different opinions in recent years. In the emergy analysis for Puerto Rico, González-Mejía et al. pointed out that the larger the ESI value, the higher the system’s sustainability level [47]. Lulu Qu et al. analyzed the sustainability level of Taiyuan City. They argued that the larger the ESI value, the more likely a region is to develop sustainably, with less use of local non-renewable resources and fewer imports. In contrast, a small ESI value implies that a region consumes more non-renewable emergy and imports more emergy, which gradually results in unsustainable development [46]. From 2005 to 2015, the ESI continued to decline, and its interaction with the outside world increased. According to González-Mejía and Lulu Qu, a decrease in the ESI shows that the economic foundation of a system is gradually transforming, moving from agriculture to the manufacturing industry, and its overall sustainability level continues to decrease. If the ESI value is smaller than 1, the system is a resource-consuming and unsustainable system, and is also confronted with high environmental stress [14]. A large IMP is the main reason for a small ESI. This is the peculiarity of Hotan. The export emergy involves the exported goods and services, and was maintained at a low level. The import emergy was far higher than the export emergy. This shows that the local goods and services were not sufficient to support local economic development, and that external financial support was indispensable. It is imperative that the Hotan Prefecture enhances its development sustainability and economic independence, increases its export emergy, develops an export-oriented economy, and improves the deep processing of agricultural products based on the planting of distinctive agricultural products. While developing its economy, it should also protect the fragile ecological environment in the oasis. The ESI index has limitations, and different interpretations tend to reflect different or even converse outcomes [55,56]. Therefore, we used LMDI to analyze the driving forces of emergy utilization.
Judging by the GDP, the economy is dominated by the primary industry, and the output of indigenous products is increasing. Notwithstanding, the rapid development of primary industry (i.e., of the agriculture and forest) is dominated by the production of primary products and is deficient in their deep processing. According to the principle of diminishing marginal utility, this means that economic development will bring about a great marginal utility. As long as the Hotan Prefecture keeps developing steadily, the net emergy will keep increasing remarkably. Economic development will stimulate the demand for regional emergy. Specifically, the development of the manufacturing industry, primary industry, or tertiary industry will bring about a rise in the output of indigenous products, an increase in the input of non-renewable resources, or an increase of external investment. For an underdeveloped region whose economy is dominated by the primary industry, economic development is an effective means of increasing marginal utility. However, the emergy analysis also showed that, in the net emergy, non-renewable resources accounted for a very large proportion, and the import emergy (IMP) accounted for the second largest proportion. Evidently, in this underdeveloped area, people used non-renewable resources extensively (for example, raw coal, cement, and electric power) in a very primitive way, and such non-renewable resources were not satisfactorily transformed into products for industrial development.
To increase the net emergy, it is necessary to increase the per capita GDP and labor productivity. To raise labor productivity, the key is to improve the competence of the population. First, the economy is dominated by the primary industry. In 2015, the agricultural population was 1,705,883, accounting for 73.4% of the total population. In accordance with China’s definition of an impoverished population (i.e., a population with an average annual net income per capita below 944 yuan), the impoverished population was still as large as 504,459. Secondly, among the rural population, the impoverished population accounted for a large proportion. Most of the rural population was engaged in the primary industry in the countryside, and their living and production habits were significantly different from those of the urban population. Due to its limited educational level, this part of the population could hardly transfer to high-emergy industries, e.g., the manufacturing industry and the service industry.
The total effect of the structure factor shows that the Hotan Prefecture is not only gradually ridding itself of its excessive reliance on local resource inputs, it is also increasingly relying on external aid. The import emergy comprises fiscal surplus, attracted investment, and Xinjiang-aiding funds. From 2005 to 2015, China provided great support for south Xinjiang, especially Hotan. The period from 2005 to 2010 was the second five-year period after the implementation of the Great Western Development Strategy of China. After the working conference on pairing assistance for Xinjiang in 2010, China further strengthened aid for Xinjiang. Statistical data shows that, from 2012 to 2015, the paid-in funds to aid the study area had totaled up to 10,907,000,000 yuan (about $1.75 billion) after the working conference. If the on-budget state-allocated funds are counted, the total aiding funds were far greater than the amount of imports. However, the net emergy was not boosted by such a huge external import emergy. This shows that the aid funds have produced a positive influence on the economic development, but have yet to play a greater role in the coming years. China should not only provide aid continuously, it should also improve the utilization efficiency of external investment and aid funds. The intent is to ensure that the external investment and aid funds constantly play a great role and gradually promote the economic development.
The smaller the E value, the higher the yield efficiency of input resources. Usually, the higher the yield efficiency, the lower the required net emergy. With the change in the efficiency factor (e.g., technological advance), the input resources required for the same GDP will decrease. Therefore, the increase in the E value (namely, the decrease in yield efficiency) will lead to an increase in net emergy, and the increase in efficiency will bring about a decrease in net emergy, namely, emergy input. However, this does not mean that efficiency should be reduced. The increase in net emergy arising from the reduction in efficiency is in vain and wasteful. It is not advisable to reduce efficiency because of the quantitative increase in net emergy. In recent years, the resource utilization efficiency has been somewhat improved as a result of the increase in import emergy. The input resources required to achieve the same GDP will decrease only with a change in a certain factor (e.g., technological advance). Therefore, only the increase in net emergy accompanied by higher efficiency will be effective emergy.
5. Conclusions
By empirical analysis and innovative methods, combined with emergy analysis and the LMDI model, this paper evaluated the sustainability of a typical oasis system. The emergy analysis showed that non-renewable resources (N) accounted for a large proportion of net emergy (U). The Emergy Sustainability Index (ESI) continued to decline in the study period, implying increasing environmental stress. From a long-term perspective, the system’s development is not sustainable. According to the emergy analysis and the LMDI results, it is imperative to make efforts pursuing the following aims: (1) increase the per capita gross domestic product (GDP) and labor productivity, (2) improve the efficiency of state investment and aid fund utilization, (3) enhance the area’s sustainability level and economic independence, and (4) protect the area’s fragile ecological environment. The findings will provide a reference for subsequent studies. In the future, emergy analysis may be used to evaluate the sustainability of different regions and different scales from various points of view, providing a useful reference for regional economic development and policy-making.
Supplementary Materials
Supplementary File 1Author Contributions
T.C. conceived and designed this study; T.C. and J.H. retrieved and analyzed the data; F.X. and Z.Z. contributed analysis software; T.C. wrote the paper; D.Y. revised the paper. All authors read and approved the final manuscript.
Acknowledgments
This work was supported by The Study on Oasis Population Evolution and Transfer Way (XBBS-2014-11). Ting Chang wants to thank the encourage from Li Liu. The authors sincerely thank the reviewers and editors.
Conflicts of Interest
The authors declare no conflict of interest.
References
- Decker, E.H.; Elliott, S.; Smith, F.A. Energy and material flow through the urban ecosystem. Annu. Rev. Energy Environ. 2000, 25, 685–740. [Google Scholar] [CrossRef]
- Hawkins, T.; Hendrickson, C.; Higgins, C. A mixed-unit input-output model for environmental life-cycle assessment and material flow analysis. Environ. Sci. Technol. 2007, 41, 1024. [Google Scholar] [CrossRef] [PubMed]
- Andersen, J.P.; Hyman, B. Energy and material flow models for the US steel industry. Energy 2014, 26, 137–159. [Google Scholar] [CrossRef]
- Pfister, S.; Koehler, A.; Hellweg, S. Assessing the environmental impacts of freshwater consumption in LCA. Environ. Sci. Technol. 2009, 43, 4098. [Google Scholar] [CrossRef] [PubMed]
- Pehnt, M. Dynamic life cycle assessment (LCA) of renewable energy technologies. Renew. Energy 2014, 31, 55–71. [Google Scholar] [CrossRef]
- Valente, C.; Spinelli, R.; Hillring, B.G. LCA of environmental and socio-economic impacts related to wood energy production in alpine conditions: Valle di Fiemme (Italy). J. Clean. Prod. 2011, 19, 1931–1938. [Google Scholar] [CrossRef] [Green Version]
- Szigeti, C.; Toth, G.; Szabo, D.R. Decoupling—Shifts in ecological footprint intensity of nations in the last decade. Ecol. Indic. 2017, 72, 111–117. [Google Scholar] [CrossRef]
- Liu, H.; Liu, X.; Yang, J. The ecological footprint evaluation of low carbon campuses based on life cycle assessment: A case study of Tianjin, China. J. Clean. Prod. 2017, 144. [Google Scholar] [CrossRef]
- Wiedmann, T.; Barrett, J. A Review of the Ecological Footprint Indicator—Perceptions and Methods. Sustainability 2010, 2, 1645–1693. [Google Scholar] [CrossRef] [Green Version]
- Odum, H.T. Self-organization, transformity, and information. Science 1988, 242, 1132. [Google Scholar] [CrossRef] [PubMed]
- Scienceman, D.M. Energy and emergy. In Enviromental Economics; Pollet, G., Murota, T., Eds.; Roland Leimgruber: Geneva, Switzerland, 1987; pp. 257–276. [Google Scholar]
- Brown, M.T.; Buranakarn, V. Emergy indices and ratios for sustainable material cycles and recycle options. Resour. Conserv. Recycl. 2003, 38, 1–22. [Google Scholar] [CrossRef]
- Brown, M.T.; Herendeen, R.A. Embodied energy analysis and EMERGY analysis: A comparative view. Ecol. Econ. 19, 219–235. [CrossRef]
- Brown, M.T.; Ulgiati, S. Emergy-based indices and ratios to evaluate sustainability: Monitoring economies and technology toward environmentally sound innovation. Ecol. Eng. 1997, 9, 51–69. [Google Scholar] [CrossRef]
- Brown, M.T.; Ulgiati, S. Emergy evaluations and environmental loading of electricity production systems. J. Clean. Prod. 2002, 10, 321–334. [Google Scholar] [CrossRef]
- Hau, J.L.; Bakshi, B.R. Promise and problems of emergy analysis. Ecol. Model. 2004, 178, 215–225. [Google Scholar] [CrossRef] [Green Version]
- Odum, H.T. Environmental Accounting: Emergy and Decision Making; John Wiley: New York, NY, USA, 1996. [Google Scholar]
- Odum, H.T. Environment, Power, and Society for the Twenty-First Century: The Hierarchy of Energy; Columbia University Press: New York, NY, USA, 2007. [Google Scholar]
- Odum, H.T.; Brown, M.T.; Brandt-Williams, S. Handbook of Emergy Evaluation a Compendium of Data for Emergy Computation Issued in a Series of Folios; Center for Environmental Policy, University of Florida: Gainesville, FL, USA, 2000. [Google Scholar]
- Ulgiati, S.; Brown, M.T.; Bastianoni, S.; Marchettini, N. Emergy-based indices and ratios to evaluate the sustainable use of resource. Ecol. Eng. 1995, 5, 519–531. [Google Scholar] [CrossRef]
- Sciubba, E.; Ulgiati, S. Emergy and exergy analyses: Complementary methods or irreducible ideological options? Energy 2005, 30, 1953–1988. [Google Scholar] [CrossRef]
- Ulgiati, S.; Odum, H.T.; Bastianoni, S. Emergy use, environmental loading and sustainability an emergy analysis of Italy. Ecol. Model. 1994, 73, 215–268. [Google Scholar] [CrossRef]
- Odum, H.T.; Brown, M.T.; Brandt-Williams, S. Folio #1: Introduction and Global Budget. In Handbook of Emergy Evaluation A Compendium of Data for Emergy Computation Issued in a Series of Folios; Center for Environmental Policy, University of Florida: Gainesville, FL, USA, 2000. [Google Scholar]
- Brown, M.T.; Campbell, D.E.; Vilbiss, C.D.; Ulgiati, S. The geobiosphere emergy baseline: A synthesis. Ecol. Model. 2016, 339, 92–95. [Google Scholar] [CrossRef]
- Odum, H.T. Folio #2: Emergy of Global Processes. In Handbook of Emergy Evaluation A Compendium of Data for Emergy Computation Issued in a Series of Folios; Center for Environmental Policy, University of Florida: Gainesville, FL, USA, 2000. [Google Scholar]
- Brown, M.T.; Bardi, E. Folio #3: Emergy of Ecosystems. In Handbook of Emergy Evaluation A Compendium of Data for Emergy Computation Issued in a Series of Folios; Center for Environmental Policy, University of Florida: Gainesville, FL, USA, 2001. [Google Scholar]
- Brandt-Williams, S. Folio #4: Emergy of Florida Agriculture. In Handbook of Emergy Evaluation A Compendium of Data for Emergy Computation Issued in a Series of Folios; Center for Environmental Policy, University of Florida: Gainesville, FL, USA, 2002. [Google Scholar]
- Kangas, R.C. Folio #5: Emergy of Landforms. In Handbook of Emergy Evaluation A Compendium of Data for Emergy Computation Issued in a Series of Folios; Center for Environmental Policy, University of Florida: Gainesville, FL, USA, 2002. [Google Scholar]
- Campbell, D.E.; Wigand, C.; Schuetz, N.B. The Real Wealth Purchased in a Fish Dinner. In Emergy Synthesis 8: Theory and Applications of the Emergy Methodology; Center for Environmental Policy, University of Florida: Gainesville, FL, USA, 2015. [Google Scholar]
- Fonseca, A.M.P.; Marques, C.A.F.; Pinto-Correia, T. Emergy analysis of a silvo-pastoral system, a case study in southern Portuga. Agrofor. Syst. 2015, 90, 1–21. [Google Scholar] [CrossRef]
- Li, L.; Lu, H.; Tilley, D.R.; Qiu, G.; B, L.; R, D.K.; Jamali-Zghal, N. Emergy assessment of the benefits of closed-loop recycling accounting for material losses. Ecol. Model. 2015, 315, 377–387. [Google Scholar] [CrossRef]
- Liu, C.; Shi, X.; Qu, L.; Li, B. Comparative Analysis for the Urban Metabolic Differences of Two Types of Cities in the Resource-Dependent Region Based on Emergy Theory. Sustainability 2016, 8, 635. [Google Scholar] [CrossRef]
- Ang, B.W.; Zhang, F.Q. A survey of index decomposition analysis in energy and environmental studies. Energy 2014, 25, 1149–1176. [Google Scholar] [CrossRef]
- Weinzettel, J.; Kovanda, J. Structural Decomposition Analysis of Raw Material Consumption. J. Ind. Ecol. 2011, 15, 893–907. [Google Scholar] [CrossRef]
- Xu, X.; Ang, B. Index decomposition analysis applied to CO2, emission studies. Ecol. Econ. 2013, 93, 313–329. [Google Scholar] [CrossRef]
- Zhang, F.Q.; Ang, B.W. Methodological issues in cross-country/region decomposition of energy and environment indicators. Energy Econ. 2001, 23, 179–190. [Google Scholar] [CrossRef]
- Seydehme, J.; Lv, G.H.; Nurmemet, I.; Aishan, T.; Abliz, A.; Sawut, M.; Abliz, A.; Eziz, M. Model Prediction of Secondary Soil Salinization in the Keriya Oasis, Northwest China. Sustainability 2018, 10, 656. [Google Scholar] [CrossRef]
- Wei, H.; Liu, H.; Xu, Z.; Ren, J.; Lu, N.; Fan, W.; Zhang, P.; Dong, X. Linking ecosystem services supply, social demand and human well-being in a typical mountain-oasis-desert area, Xinjiang, China. Ecosyst. Serv. 2018, 31, 44–57. [Google Scholar] [CrossRef]
- Alcalá, F.J.; Martín-Martín, M.; Guerrera, F.; Martínez-Valderrama, J.; Marín, P.R. A feasible methodology for groundwater resource modelling for sustainable use in sparse-data drylands: Application to the Amtoudi Oasis in the northern Sahara. Sci. Total Environ. 2018, 630. [Google Scholar] [CrossRef] [PubMed]
- Hao, Y.; Xie, Y.; Ma, J.; Zhang, W. The critical role of local policy effects in arid watershed groundwater resources sustainability: A case study in the Minqin oasis, China. Sci. Total Environ. 2017, 601, 1084–1096. [Google Scholar] [CrossRef] [PubMed]
- Zhang, Z.; Chen, X.; Heck, P. Emergy-Based Regional Socio-Economic Metabolism Analysis: An Application of Data Envelopment Analysis and Decomposition Analysis. Sustainability 2014, 6, 8618–8638. [Google Scholar] [CrossRef] [Green Version]
- Liu, Z.; Geng, Y.; Hung-Suck, P.; Dong, H.; Dong, L. An emergy-based hybrid method for assessing industrial symbiosis ofan industrial park. J. Clean. Prod. 2016, 114, 132–140. [Google Scholar] [CrossRef]
- Sun, L.; Dong, H.; Geng, Y.; Li, Z.; Liu, Z. Uncovering driving forces on urban metabolism—A case of Shenyang. J. Clean. Prod. 2016, 114, 171–179. [Google Scholar] [CrossRef]
- Tian, X.; Geng, Y.; Ulgiati, S. An emergy and decomposition assessment of China-Japan trade: Driving forces and environmental imbalance. J. Clean. Prod. 2017, 141, 359–369. [Google Scholar] [CrossRef]
- Liu, Z.; Geng, Y.; Ulgiati, S.; Park, H.S.; Tsuyoshi, F. Uncovering key factors influencing one industrial park's sustainability: A combined evaluation method of emergy analysis and index decomposition analysis. J. Clean. Prod. 2015, 114, 141–149. [Google Scholar] [CrossRef]
- Qu, L.; Shi, X.; Liu, C.; Yuan, Y. An Emergy-Based Hybrid Method for Assessing Sustainability of the Resource-Dependent Region. Sustainability 2017, 9, 153. [Google Scholar] [CrossRef]
- González-Mejía, A.M.; Ma, X.C. The Emergy Perspective of Sustainable Trends in Puerto Rico from 1960 to 2013. Ecol. Econ. 2017, 133, 11–22. [Google Scholar] [CrossRef]
- Hotan Government Network. Available online: http://www.xjht.gov.cn/article/show.php?itemid=5818 (accessed on 22 April 2018).
- Hotan Bureau of Statistics. Hotan Statistics Yearbook, 2006–2016; China Statistics Press: Beijing, China, 2016.
- Huang, S.L.; Hsu, W.L. Materials flow analysis and emergy evaluation of Taipei’s urban construction. Landsc. Urban Plan. 2003, 63, 61–74. [Google Scholar] [CrossRef]
- Ulgiati, S.; Brown, M.T. Monitoring patterns of sustainability in natural and man-made ecosystems. Ecol. Model. 1998, 108, 23–36. [Google Scholar] [CrossRef]
- Ehrlich, P.R.; Holdren, J.P. Impact of Population Growth. Science 1971, 171, 1212. [Google Scholar] [CrossRef] [PubMed]
- Simon, J.L. The Ultimate Resource; Princeton University Press: Princeton, NJ, USA, 1981. [Google Scholar]
- Yan, M.C.; Odum, H.T. A study on emergy evaluation and sustainable development of Tibetan eco-economic system. J. Nat. Resour. 1998, 13, 20–29. [Google Scholar] [CrossRef]
- Siche, J.R.; Agostinho, F.; Ortega, E. Sustainability of nations by indices: Comparative study between environmental sustainability index, ecological footprint and the emergy performance indices. Ecol. Econ. 2008, 66, 628–637. [Google Scholar] [CrossRef]
- Liu, G.; Brown, M.T.; Casazza, M. Enhancing the Sustainability Narrative through a Deeper Understanding of Sustainable Development Indicators. Sustainability 2017, 9, 1078. [Google Scholar] [CrossRef]
Figure 1.
The geographical location of Hotan (GS (2016) 1600). (a) The geographical location of Hotan in China; (b) The geographical location of Hotan in Xinjiang.
Figure 1.
The geographical location of Hotan (GS (2016) 1600). (a) The geographical location of Hotan in China; (b) The geographical location of Hotan in Xinjiang.

Figure 2.
Net emergy use per year and its components for Hotan. Caption: Renewable resources (R), non-renewable resources (N), and import emergy (IMP).
Figure 2.
Net emergy use per year and its components for Hotan. Caption: Renewable resources (R), non-renewable resources (N), and import emergy (IMP).

Figure 3.
Hotan emergy indicators (2005–2015). Caption: Emergy sustainability index (ESI), net emergy yield ratio (EYR), environmental load ratio (ELR).
Figure 3.
Hotan emergy indicators (2005–2015). Caption: Emergy sustainability index (ESI), net emergy yield ratio (EYR), environmental load ratio (ELR).

Figure 4.
The driving factor of U in Hotan from 2006 to 2015. ΔC is the variation in the structure factor, ΔE is the variation in the efficiency factor, ΔG is the variation in the economic factor, ΔPOP is the variation in population, and ΔU is the variation in the net emergy.
Figure 4.
The driving factor of U in Hotan from 2006 to 2015. ΔC is the variation in the structure factor, ΔE is the variation in the efficiency factor, ΔG is the variation in the economic factor, ΔPOP is the variation in population, and ΔU is the variation in the net emergy.


Table 1.
Emergy items and transformities of the oasis system.
| Flows | Items | Units | Transformity (Sej/Unit) | Reference | |
|---|---|---|---|---|---|
| Renewable resources (R) | Renewable environmental resources (R0) | Solar energy | J | 1 | [17] |
| Wind energy | J | 2.52 × 10³ | [19] | ||
| Chemical energy of rainwater | J | 3.06 × 10⁴ | [19] | ||
| Potential energy of rainwater | J | 1.76 × 10⁴ | [17] | ||
| Rotational energy of the earth | J | 5.71 × 10⁴ | [19] | ||
| Indigenous products (R1) | Farming products | J | 4.44 × 10⁴–1.45 × 10⁶ | [17] | |
| Forest products | J | 7.39 × 10⁴–1.43 × 10⁵ | [17] | ||
| Livestock products | J | 2.86 × 10⁶ | [17] | ||
| Aquatic products | J | 3.36 × 10⁶ | [17] | ||
| Non-renewable resources (N) | Non-renewable resources (N0) | Net losses of the surface soil layer | J | 1.24 × 10⁵ | [19] |
| Locally produced non-renewable resources (N1) | Raw coal | J | 6.72 × 10⁴ | [17] | |
| Cement | g | 5.54 × 10¹⁰ | [17] | ||
| Steel | g | 2.35 × 10⁹ | [17] | ||
| Electric power | J | 2.69 × 10⁵ | [17] | ||
| Tap water | g | 1.29 × 10¹³ | [17] | ||
| Import emergy (IMP) | Goods and services | $ | 9.37 × 10¹² | [19] | |
| Tourism income | $ | 1.66 × 10¹² | [15] | ||
| Money | $ | 9.37 × 10¹² | [19] | ||
| Export emergy (EXP) | Goods and services | $ | 6.34 × 10¹² | [19] | |
Table 2.
Hotan emergy flow summary (2005–2015).
| Variable | Units | 2005 | 2006 | 2007 | 2008 | 2009 | 2010 | 2011 | 2012 | 2013 | 2014 | 2015 |
|---|---|---|---|---|---|---|---|---|---|---|---|---|
| R | ×1022 sej | 6.99 | 7.02 | 7.06 | 7.16 | 7.23 | 7.23 | 7.31 | 7.41 | 7.51 | 7.61 | 8.85 |
| R0 | ×1022 sej | 5.97 | 5.97 | 5.97 | 5.97 | 6.00 | 5.97 | 5.97 | 5.97 | 5.97 | 5.97 | 5.97 |
| R1 | ×1022 sej | 1.02 | 1.05 | 1.10 | 1.19 | 1.23 | 1.27 | 1.35 | 1.44 | 1.54 | 1.64 | 2.89 |
| N | ×1024 sej | 3.31 | 5.10 | 4.93 | 8.20 | 6.06 | 5.64 | 1.01 | 1.17 | 1.32 | 1.36 | 1.32 |
| N0 | ×1022 sej | 5.27 | 5.28 | 5.28 | 5.28 | 4.79 | 4.80 | 4.80 | 4.80 | 4.80 | 4.80 | 4.80 |
| N1 | ×1024 sej | 3.26 | 5.05 | 4.88 | 8.15 | 6.01 | 5.59 | 1.01 | 1.16 | 1.31 | 1.36 | 1.32 |
| IMP | ×1023 sej | 1.45 | 1.30 | 2.22 | 3.05 | 4.53 | 5.70 | 7.27 | 8.28 | 8.72 | 9.87 | 1.31 |
| EXP | ×1019 sej | 1.79 1 | 1.79 | 3.31 | 3.32 | 3.25 | 4.46 | 2.70 | 4.38 | 6.65 | 4.93 | 4.74 |
1 The export data of 2005 is not available, so the export data of 2006 is used instead.
Table 3.
Emergy indices and indicators for Hotan (2005–2015).
| Expression | Unit | 2005 | 2006 | 2007 | 2008 | 2009 | 2010 | 2011 | 2012 | 2013 | 2014 | 2015 | |
|---|---|---|---|---|---|---|---|---|---|---|---|---|---|
| U | U = R + N + IMP | ×1024 sej | 3.53 | 5.36 | 5.22 | 8.58 | 6.59 | 6.28 | 10.9 | 12.6 | 14.1 | 14.7 | 14.6 |
| EYR | U/IMP | 24.386 | 28.275 | 23.528 | 28.076 | 14.550 | 11.024 | 15.051 | 15.199 | 16.184 | 14.879 | 11.180 | |
| EG | U/GDP | ×1015 sej/$ | 5.86 | 8.06 | 7.08 | 9.69 | 6.71 | 5.70 | 8.79 | 9.00 | 9.25 | 8.48 | 7.56 |
| ED | U/Area | ×1013 sej/m2 | 1.42 | 2.16 | 2.11 | 3.46 | 2.64 | 2.53 | 4.41 | 5.08 | 5.69 | 5.92 | 5.89 |
| EP | U/population | ×1018 sej/inh. | 1.93 | 2.89 | 2.77 | 4.49 | 3.37 | 3.08 | 5.27 | 5.93 | 6.55 | 6.51 | 6.29 |
| ELR | (N + IMP)/R | 49.46 | 75.39 | 72.94 | 118.81 | 90.10 | 85.80 | 148.59 | 168.97 | 186.95 | 192.02 | 164.13 | |
| ESI | EYR/ELR | 0.493 | 0.375 | 0.323 | 0.236 | 0.161 | 0.128 | 0.101 | 0.090 | 0.087 | 0.077 | 0.068 | |
| General information | |||||||||||||
| GDP($) | ×108 $ | 6.02 | 6.65 | 7.38 | 8.85 | 9.82 | 1.1 | 1.24 | 1.4 | 1.53 | 1.73 | 1.93 | |
| Area (m2) | ×1011 m2 | 2.48 | 2.48 | 2.48 | 2.48 | 2.49 | 2.48 | 2.48 | 2.48 | 2.48 | 2.48 | 2.48 | |
| Population (inh.) | inh. | 1,825,127 | 1,857,563 | 1,883,894 | 1,910,054 | 1,955,836 | 2,039,601 | 2,075,811 | 2,123,377 | 2,154,462 | 2,258,200 | 2,324,287 | |
Note: Net emergy (U), net emergy yield ratio (EYR), emergy–currency ratio (EG), emergy density (ED), emergy per capita (EP), environmental load ratio (ELR), emergy sustainability index (ESI), and gross domestic product (GDP).
Table 4.
Decomposition results of the driving factor values of U of the Hotan oasis system (2006–2015).
Table 4.
Decomposition results of the driving factor values of U of the Hotan oasis system (2006–2015).
| Year | ΔC | ΔE | ΔG | ΔPOP | ΔU |
|---|---|---|---|---|---|
| 2006 | −2.57 × 10²² | 1.42 × 1024 | 3.60 × 10²³ | 7.72 × 10²² | 1.84 × 1024 |
| 2007 | 3.93 × 10²² | −7.27 × 10²³ | 4.76 × 10²³ | 7.45 × 10²² | −1.37 × 10²³ |
| 2008 | −4.85 × 10²² | 2.17 × 1024 | 1.14 × 1024 | 9.33 × 10²² | 3.35 × 1024 |
| 2009 | 2.63 × 10²³ | −3.03 × 1024 | 6.02 × 10²³ | 1.79 × 10²³ | −1.99 × 1024 |
| 2010 | 1.54 × 10²³ | −1.20 × 1024 | 4.68 × 10²³ | 2.70 × 10²³ | −3.08 × 10²³ |
| 2011 | −2.21 × 10²³ | 3.86 × 1024 | 8.74 × 10²³ | 1.48 × 10²³ | 4.66 × 1024 |
| 2012 | −8.14 × 10²¹ | 2.83 × 10²³ | 1.11 × 1024 | 2.66 × 10²³ | 1.65 × 1024 |
| 2013 | −5.71 × 10²² | 4.14 × 10²³ | 9.71 × 10²³ | 1.94 × 10²³ | 1.52 × 1024 |
| 2014 | 8.34 × 10²² | −1.33 × 1024 | 1.15 × 1024 | 6.77 × 10²³ | 5.76 × 10²³ |
| 2015 | 3.54 × 10²³ | −2.03 × 1024 | 1.19 × 1024 | 4.23 × 10²³ | −6.81 × 10²² |
| Total | 5.33 × 10²³ | −1.69 × 10²³ | 8.33 × 1024 | 2.40 × 1024 | 1.11 × 1025 |
© 2018 by the authors. Licensee MDPI, Basel, Switzerland. This article is an open access article distributed under the terms and conditions of the Creative Commons Attribution (CC BY) license (http://creativecommons.org/licenses/by/4.0/).
Share and Cite
MDPI and ACS Style
Chang, T.; Yang, D.; Huo, J.; Xia, F.; Zhang, Z. Evaluation of Oasis Sustainability Based on Emergy and Decomposition Analysis. Sustainability 2018, 10, 1856. https://doi.org/10.3390/su10061856
AMA Style
Chang T, Yang D, Huo J, Xia F, Zhang Z. Evaluation of Oasis Sustainability Based on Emergy and Decomposition Analysis. Sustainability. 2018; 10(6):1856. https://doi.org/10.3390/su10061856
Chicago/Turabian StyleChang, Ting, Degang Yang, Jinwei Huo, Fuqiang Xia, and Zhiping Zhang. 2018. "Evaluation of Oasis Sustainability Based on Emergy and Decomposition Analysis" Sustainability 10, no. 6: 1856. https://doi.org/10.3390/su10061856
Note that from the first issue of 2016, this journal uses article numbers instead of page numbers. See further details here.