Tendency of Embodied Carbon Change in the Export Trade of Chinese Manufacturing Industry from 2000 to 2015 and Its Driving Factors

1
School of Economics and Management, Shanghai Maritime University, Shanghai 201306, China
2
Collaborative Innovation Center on Forecast and Evaluation of Meteorological Disasters, Nanjing University of Information Science & Technology, Nanjing 210044, China
3
School of Applied Meteorology, Nanjing University of Information Science and Technology, Nanjing 210044, China
*
Author to whom correspondence should be addressed.
Sustainability 2018, 10(6), 1839; https://doi.org/10.3390/su10061839
Submission received: 11 May 2018
/
Revised: 27 May 2018
/
Accepted: 31 May 2018
/
Published: 1 June 2018
(This article belongs to the Special Issue Transition from China-Made to China-Innovation
)
Abstract
:The manufacturing industry is an important part of the national industrial system, and is usually an industry with high carbon content. However, few studies have been carried out on the total amount, structure and the trend of the embodied carbon emission in the international trade of the Chinese manufacturing industry. Based on the input–output method, the thesis proposes the coefficient of direct carbon emission and complete carbon emission and a method for calculating the embodied carbon of the export trade. It also calculates the coefficient of direct carbon emission and complete carbon emission for the Chinese manufacturing sector from 2000 to 2015 and breaks down the embodied carbon change of export trade in the manufacturing industry to a technological effect, structural effect and scale effect by using the method of structural decomposition. Several inspiring conclusions could be drawn from the thesis. For example: (1) the coefficient of both the direct carbon emission and the complete carbon emission has been decreasing significantly, indicating the achievements of the energy saving and emission reduction of the Chinese manufacturing industry. (2) The embodied carbon emission from the manufacturing exports remains high and presents a rising tendency. The main sectors that export the embodied carbon includes “S10 mechanical equipment and instruments”, “S9 metal products”, “S6 chemical industry”, etc., which should be the key sectors on reducing embodied carbon in exports. (3) The driving force of the embodied carbon exports lies in the scale effect of the manufacturing industry, on which the technical effect of the industry has a significant negative effect. The structural effect should have a positive influence that takes on a rising tendency; generally, this effect is only two-thirds of the scale effect. Finally, the corresponding policy suggestions have been made.
1. Introduction
The manufacturing industry is a core component of a country’s industrial system. With the capacity to encourage other industries, promote employment and increase tax income, it has been given priority by governments. As a manufacturing power, China has proposed the initiative of “Made in China 2025”. In 2017, the gross value of the Chinese manufacturing industry is roughly equal to the total value of the US, Japanese and German manufacturing industries [1]. With a significant characteristic of “three highs and one low”, namely, high investment, high consumption, high pollution and low cost, for a long period of time and high carbon content, the Chinese manufacturing industry has become the key department for monitoring in the “Climax-reaching Plan” put forward by the Chinese government in 2014.
The high carbon characteristic of the Chinese manufacturing industry will prompt the government to strengthen the environmental regulations on it and thus affect the future development of the industry. However, the Chinese manufacturing industry is an industry with frequent export trade and the flow of the embodied carbon between trades is significant. Most of the manufacturing industry in China manufactures for the purposes of export and leaves carbon in the country. As Levinson and Minier put it, pollution can flow with trade [2,3]. The emission of carbon can also flow with trade. How much embodied carbon is emitted for the purpose of international trade and how should we calculate it? What changes have taken place during 2000 and 2015? In addition, Fei et al. [4] deconstructed the factors of carbon emission in Guangdong province from 1990 to 2014 from the perspective of energy consumption. Wei et al. [5] studied the dynamic changes of the cost of carbon emission reduction. Lugauer et al. [6] and Zagheni [7] propose that changes of age structure would exert an effect on carbon emission. Therefore, factors that affected the dynamic changes of the embodied carbon in the Chinese manufacturing industry need to be calculated in detail, which, upon completion, could provide empirical evidence for the Chinese government to carry out negotiations on carbon emission reduction with countries, formulate detailed plans for carbon emission reduction and import and export trade and ultimately make contributions to the sustainable development of the Chinese manufacturing industry [8].
Based on the above considerations, the thesis proposes the coefficient of direct carbon emission and complete carbon emission and a method for calculating the embodied carbon of the export trade by applying the input–output method. It also calculates the coefficient of direct carbon emission and complete carbon emission for every Chinese manufacturing sector from 2000 to 2015 and decomposes the embodied carbon change of export trade in the manufacturing industry to technological effect, structural effect and scale effect by using the method of structural decomposition. Corresponding countermeasures and recommendations were proposed for the Chinese manufacturing industry for its transformation from “making” to “creating” and from “three highs and one low” to “sustainable development”.
The rest of the paper is as follows: the second part is the thesis statement; the third part is the model construction; the fourth part is the data source and data processing; the fifth part is the analysis of the calculated embodied carbon; the sixth part is the analysis of the technology, structure and scale effects of the embodied carbon; the final part is the conclusions and further discussion.
2. Literature Review
Judging from current research, the input–output method is used by scholars at home and abroad to calculate the embodied carbon. The study of scholars from different countries can be mainly divided into the following categories:
The first one is the study of embodied carbon in a specific region, for example, Li [9] estimated the embodied carbon in the export trade of Xinjiang Province based on the input–output model of the non-competitive regional environment; Zhang et al. [10] studied the embodied carbon in Beijing’s domestic and foreign trade and its composition, industrial distribution and non-balance degree; Zhong [11] calculated embodied carbon emission in the import and export trade of Guangdong Province by applying the input–output method; Mi et al. [12] studied the embodied carbon emission of Beijing; Hasegawa et al. [13] analyzed the carbon footprint of Japan by using the input–output model. Tian et al. [14] analyzed the carbon footprint of China from the perspective of regional consumption and production.
The second one is the study of carbon emissions in single countries. For example, Thomas et al. [15] calculated the net emissions of CO2 of the United Kingdom from 1992 to 2004 by applying the multi-regional input–output model; Manfred et al. [16] discovered an obvious trend of rising in embodied carbon in the trade of the United Kingdom between 1994 and 2004 by applying the multi-regional input–output model; Yrjö et al. [17] measured the embodied carbon in the trade of the Finnish food industry by using the EIO-LCA model; Yang et al. [18] calculated the embodied carbon content of the Chinese import and export trade between 2000 and 2007 by using the Walras–Cassel model; Song [19] calculated the embodied carbon emission in Chinese export trade between 2006 and 2009 by using the input–output model; Qiu et al. [20] measured the embodied carbon emission of the Chinese import and export trade in the year 2000, 2005 and 2007 by using the input–output method. Yan et al. [21] measured the embodied carbon of Chinese export trade by using the multi-regional input–output model and made a comparison of the responsibilities in production emission and consumption emission. Bin et al. [22] calculated the CO2 emission in China’s international trade by using input–output method, based on competitive imports and non-competitive imports, respectively.
The fourth one is the research on carbon emissions of multiple countries and regions. For example, Glen et al. [23] estimated the embodied trade carbon of 57 economic sectors in 113 countries by using the input–output method; Bin et al. [24] studied the embodied carbon emission in foreign trades of Asian countries by using the multi-regional input–output model. According to Kirsten et al.’s [25] calculation under the guidance of the input–output model, the embodied import carbon of the OECD countries increased 80% from 1995 to 2005. Sheng et al. [26,27,28] developed the inter-regional input–output table of China in 2012 and calculated the flow of the embodied carbon in China’s import and export trade.
From the above analysis, it is observed that the input–output method is both a way to analyze the quantitative dependence between production and consumption of different sectors in the national economy and a research method [21] to connect economic activities with environmental pollution, which can be used in calculating the embodied carbon in the export trades. Furthermore, input–output methods have a simple form, a clear principle, a reliable calculation result and avoid the problems of endogeneity, robustness, uncertain index settings, etc. in the parametric methods such as econometric mode. It is suitable for quantitative calculation of the embodied carbon in the input–output associations among different sectors [29,30,31]. This paper therefore adopts the input–output method for research. From the research perspective, scholars at home and abroad focused mostly on the overall analysis on the national level but few on the analysis of the specific industries, with existing studies directed at industries like agriculture and petroleum but few at the import and export trade of Chinese manufacturing industries. Moreover, most of the existing research calculated CO2 emission of every sector by taking three kinds of primary fossil energy, namely, coal, petroleum and natural gas into account while few are concerning the eight kinds of primary and secondary fossil energy including coal, coke, crude oil, gasoline, kerosene, diesel, and fuel oil. Yang et al. [18] and Wei [32] are the limited scholars who calculated the eight kinds of energy above in their studies, but conducted for all industries.
In addition, most scholars only studied the embodied carbon of trade within the years of the input–output table, which could be disadvantageous in picturing the change of the embodied carbon in the long run. For the above reasons, the thesis proposes a way to calculate the coefficient of direct carbon emission and complete carbon emission and the embodied carbon in the export trade based on the input–output method. Take China’s manufacturing industry, for example—this paper calculated the direct carbon emission, complete carbon emission and the embodied carbon in the export trade of any sector between 2000 and 2015, analyzed the embodied carbon in the export trade from an overall level and a sectoral level, and further analyzed the trend of the driving factors of the embodied carbon changes in the export trade of the manufacturing industry. Finally, the corresponding suggestions of policy are proposed and are expected to provide some reference to the industry.
3. Research Method
3.1. Input–Output Model Building
The input–output method is the approach and method to analyze the quantitative relationship between input and output in a specific economic system. It is also called the industrial inter-sectoral analysis. It was first proposed by the American economist Wassily Leontief in 1936, the theoretical basis of which is Walras’ general equilibrium theory. Based on the equilibrium relationship on input and output tables, an input–output mathematical model can be built between industries:
After tidying up:
Among them, is the direct consumption coefficient or technical coefficient matrix. Each element in the matrix represents the number of products of the sector that need to be consumed as an intermediate product to produce one unit of ; is an identity matrix with all elements on the main diagonal being 1; is Leontief’s inverse matrix, representing the complete consumption coefficients; is the social final product matrix. is the social final product matrix that contains other end products.
The application of input–output analysis can be extended to other areas such as labor, capital, energy, and carbon emissions. By building the input–output model that includes environmental factors, the relationship between export trade and CO2 can be studied. Therefore, the thesis introduces the coefficient of direct carbon emission to construct the coefficient of the complete carbon emission, which is:
Among which, S is one line of vectors , whose element ( represents the total CO2 emission of sector , represents the total output of sector ) represents the CO2 emissions generated by the output of the production unit of sector ; is the coefficient of the complete carbon emission, representing the total amount of the direct and indirect CO2 produced by the output of the production unit.
The total amount of CO2 emission generated to meet the final use:
More than 40–50% of China’s export trade is processing trade. If the effect of the processing trade i.e., intermediate products consumed in the production process is not considered in calculating the embodied carbon in the export trade, the intermediate products needed in the production of the export products will be counted as the domestic production, leading to an overestimation of the embodied carbon in the Chinese export products. Therefore, the input of the domestic production process should be divided into two parts: domestic input and intermediate input in export trade. The corresponding coefficients of the direct consumption are:
Among them, is the import coefficient matrix, the element of which represents the amount of intermediate input in the export trade of sector for every unit of output produced by sector ; is the coefficient of the direct consumption in the domestic input, the element of which represents the amount of intermediate input in the domestic trade of sector for every unit of output produced by sector . The embodied carbon in Chinese export trade can be represented as:
among which, is the direct emission coefficient for China and is the column vector of exports.
3.2. The Building of the Structural Decomposition Analysis Model
In order to measure the driving factors of the embodied carbon changes in the export trade of the Chinese manufacturing industry, the thesis decomposes the embodied carbon changes into technological effect, structural effect and scale effect.
To expand in formula (6):
among which, is the total amount of export, and is the percentage of every sector’s export amount in the total export amount. Letting , , , formula (6) can be rewritten as:
According to formula (8), the embodied carbon changes in the export trade during the two phases (phase 0 and phase 1) can be written as:
Because of “non-unique problems”, the application of structural decomposition in analyzing models could result in different decomposition forms. In order to solve the problem, the bilevel decomposition algorithm is adopted. The algorithm could average the effects of the dependent variables determined by the corresponding independent variables decomposed in both the first phase and the last phase, and finally obtain the effect of independent variables on the dependent variables.
If decomposition starts from the base period (i.e., phase 0), formula (9) could be written as:
If decomposition starts from the calculation period (i.e., phase 1), formula (9) could be written as:
Taking the average of formula (10) and formula (11):
Formula (12) can be simplified as:
among which, is the technological effect, which is the effect of the coefficient of the complete carbon emissions on the changes of the embodied carbon; is the structural effect, which is the effect of the export structure on the changes of the embodied carbon; is the scale effect, which is the effect of the export amount on the changes of the embodied carbon.
4. Data Sources and Processing
According to formula (6), the following data is needed in the calculation of the embodied carbon in the Chinese manufacturing industry: Leontief’s inverse matrix of the domestic input, statistics on export trade and coefficients of the direct carbon emissions from every manufacturing sector.
4.1. Input–Output Tables and Export Trade Statistics
Statistics of Leontief’s inverse matrix of the domestic input and statistics of the export trade are from the OECD database.
Input–Output Table: the input–output table in the database is different from the domestic one. The table in the database divided the domestic production input into two parts: domestic input and import input. The formula of the direct consumption coefficient could therefore be adopted directly to calculate . Given the fact that the Chinese input–output table in the latest OECD database has only been updated to the year 2011 and the production structure and technology of one country changes little in a short period of time, the thesis receives enlightment from the research conducted by Zhong [11], Wei [32], Yan [33], and Guo et al. [34], and replaces the table with that of the available table, i.e., the tables of 2011 to 2015 are replaced by that of 2011. At the same time, the input–output tables for the rest of the years remain unchanged.
Trade data: In order to coordinate with the sectors in the input–output table, the thesis adopts OECD bilateral trade data (BTD) and conducts research on the data selected within the year 2000 and 2015.
4.2. Coefficient of Direct Carbon Emission in the Manufacturing Sector
The so-called coefficient of the CO2 direct carbon emission is the amount of CO2 emitted from the output unit of a certain sector. The statistics of the total output for sectors from 2000 to 2015 come from the Almanac of Chinese industrial economy 2001–2016. The energy consumption data of various industries come from the Chinese statistic almanac 2001–2016. The amount of CO2 emission can be obtained from the total CO2 emissions caused by various amounts of energy consumption. According to the energy consumption data of various industries in the Chinese statistic almanac, the energy consumption of different industries can be divided into nine categories. Given that the electricity energy ultimately comes from coal, oil, natural gas, etc., the thesis mainly measures the CO2 emissions caused by the following eight kinds of energy: Coal, coke, crude oil, gasoline, kerosene, diesel, fuel oil and natural gas.
In order to calculate the amount of CO2 emitted by the above-mentioned eight kinds of energy, the thesis adopts the methodologies proposed in the Guidelines for National Greenhouse Gas Inventories (chapter 6, vol. 2 (energy)) established by the Intergovernmental Panel on Climate Change (IPCC) in 2006:
among which, stands for the CO2 emission of the sector; is the consumption of various energy sources; is the net heating value of energy (the data comes from the average lower heating value in the Guidelines for National Greenhouse Gas Inventories (appendix 4)); is the carbon emission factor (the data comes from the Guidelines for National Greenhouse Gas Inventories (Table 1.3, chapter 1, vol. 2 (energy))); is the carbon oxidation factor, with the default value being 1; is the ratio of the relative molecular weight of carbon to the relative atomic weight of carbon; represent the above-mentioned eight kinds of energy respectively. The value of every kind of energy’s and is shown in Table 1 below:
4.3. Division
The Chinese input–output table in the OECD database contains 18 manufacturing sectors. The OECD bilateral trade database contains 30 manufacturing sectors. The energy consumption data and total output data of various industries contain 30 manufacturing sectors. To ensure the smooth calculation, the manufacturing sectors are summarized and merged into 12 sectors, as shown in Table 2.
5. Results and Analysis of Embodied Carbon Calculation
5.1. Coefficient of Direct Carbon Emission
According to the total CO2 emissions and the total output of various sectors, the direct carbon emission factors of various sectors of Chinese manufacturing industry from 2000 to 2015 can be calculated. The calculation results are shown in Table 3.
Several conclusions can be attained from Table 3.
The coefficient of the direct emission in the same year of different manufacturing sectors could differ greatly with an increasing trend. The sector with the largest coefficient of direct carbon emission for all years is “S5 petroleum, coking, and nuclear fuel processing industries”. The sector with the smallest coefficient of direct carbon emission for all years is “S10 mechanical equipment and instruments”. The largest coefficient was 72.767 times of the smallest coefficient in 2000; the number was 133.647 in 2005, 133.657 in 2010 and 197.667 in 2015, signifying an increasing trend of inter-sectoral direct emission coefficient. Take 2015 as an example: the four sectors with the largest coefficient of direct carbon emission in descending order are: “S5 petroleum, coking, and nuclear fuel processing industries”, “S8 non-metallic mineral products”, “S9 metal products” and “S6 chemical industry”; the four sectors with the smallest coefficient of direct carbon emission in ascending order are: “S10 mechanical equipment and instruments”, “S11 transportation equipment”, “S3 wood and wooden products”, “S7 rubber and plastic products”. Sectors with larger emission coefficients are mostly in the upstream of the industrial chain of the national economy. They provide necessary intermediate products or secondary energy to other sectors to other sectors and emitted more CO2 in the direct production process. Therefore, there is an urgent need to improve their energy use efficiency and emission intensity.
From the perspective of time, the coefficient of direct carbon emission of every manufacturing sector dropped significantly. From 2000 to 2014, the four sectors with the biggest drop in descending order are: “S3 wood and wooden products”, “S11 transportation equipment”, “S10 mechanical equipment and instruments” and “S12 other manufacturing industries”; the four sectors with the smallest drop in ascending order are: “S5 petroleum, coking, and nuclear fuel processing industries”, “S2 textile, clothing, leather and shoe-making”, “S4 papermaking, printing, publishing, culture and education” and “S7 rubber and plastic products”. It can be inferred that the manufacturing sectors have continuously raised the level of production technology and energy use during this period of time and some preliminary results of the energy saving and emission reduction have been achieved in one sector because of China’s gradual emphasis on energy and environment.
5.2. Coefficient of Complete Carbon Emission
The coefficient of complete carbon emission of every manufacturing sector can be calculated according to formula (3), the results are shown in Table 4. Several conclusions could be attained from Table 4: the coefficient of the complete carbon emission in the same year of different manufacturing sectors also differs fairly large with an increasing trend. The sector with the largest coefficient of complete carbon emission for all years is “S5 petroleum, coking, and nuclear fuel processing industries” and the sector with the smallest coefficient being “S1 food, beverage and tobacco”. The largest coefficient was 13.476 times of the smallest coefficient in 2000; the number was 22.701 in 2010 and 27.888 in 2015. Taking 2015 as an example, the four sectors with the largest coefficient of complete carbon emission in descending order are: “S5 petroleum, coking, and nuclear fuel processing industries”, “S8 non-metallic mineral products”, “S9 metal products” and “S6 chemical industry”; the four sectors with the smallest coefficient of complete carbon emission in ascending order are: “S1 food, beverage and tobacco”, “S2 textile, clothing, leather and shoe-making”, “S3 wood and wooden products”, and “S12 other manufacturing industries”. The sectors that have the largest complete emission coefficient coincide with the sectors that have the largest direct emission coefficient. The reason lies in the fact that the complete emission coefficient is the sum of the direct and indirect emission coefficients and the four sectors are the providers of intermediate products and secondary energy for other sectors, thus leading to the domination of the direct emission coefficient and the corresponding increase of the complete emission coefficient.
From the perspective of time, the coefficient of direct carbon emission of every manufacturing sector dropped continuously. From 2000 to 2014, the four sectors with the biggest drop in descending order are: “S1 food, beverage and tobacco”, “S9 metal products”, “S10 mechanical equipment and instruments” and “S12 other manufacturing industries”; the four sectors with the smallest drop in ascending order are: “S5 petroleum, coking, and nuclear fuel processing industries”, “S4 papermaking, printing, publishing, culture and education”, “S8 non-metallic mineral products” and “S2 textile, clothing, leather and shoe-making”. The coefficient of complete carbon emission of every manufacturing sector drops more thanks to the implementation of the energy-saving and emission-reduction policy by a sector and their efforts made in eliminating outdated production capacity, improving energy efficiency, and reducing energy consumption per unit of production.
5.3. The Embodied Carbon in the Export Trade on the Overall Level
According to formulas (6) and (14), the total amount of the embodied carbon in the export trade of the Chinese manufacturing industry from 2000 to 2010 and the total amount of its CO2 emission can be calculated, and the percentage of embodied carbon in the export trade in the total amount of CO2 emission could thus be obtained. The results are shown in Table 5.
Several conclusions can be attained from Table 5.
The CO2 emission in the Chinese manufacturing industry has a rising trend in general. The amount of the emission has risen from 1.9332 billion tons in 2000 to 4.8805 tons in 2015, with an increase of 2.807 times. It is worth mentioning that the CO2 emission of Chinese manufacturing industry increases 1.049 times between 2008 and 2009 under the circumstances of the global financial crisis.
The embodied carbon in the Chinese manufacturing export trade from 2000 to 2008 marks a steady increase from 0.7617 billion tons in 2000 to 2.0992 billion tons in 2008, with an increase of 2.756 times. Influenced by the global economic crisis, the embodied carbon decreased between 2008 and 2009, but continued to creep up again from 2010 to 2015.
The embodied carbon of the Chinese manufacturing industry accounts for more than 35% of the CO2 emission in the manufacturing industry, indicating that more than half of the Chinese CO2 emission is not caused by the Chinese domestic consumption, but the import demand of China’s trading partner countries.
5.4. The Embodied Carbon in the Export Trade on the Sectoral Level
By multiplying the coefficient of the complete carbon emission and the export trade volume of the sectors, the embodied carbon in the export trade of any sector could be calculated, and the results are shown in Table 6.
The following conclusions can be attained from Table 6: the embodied carbon in the export trade of every manufacturing sector from 2000 to 2015 marks an upward trend. It can be concluded that the major sectors for which exports embodied carbon are: “S6 chemical industry”, “S9 metal products” and “S10 mechanical equipment and instruments”. Among them, the embodied carbon of the “S6 chemical industry” increased from 72.4 million tons in 2000 to 0.2135 billion tons in 2015; the embodied carbon of the “S9 metal products” increased from 0.1696 billion tons in 2000 to 0.4012 billion tons in 2015; the embodied carbon of “S10 mechanical equipment and instruments” increased from 0.3102 billion tons in 2000 to 0.8892 billion tons in 2015. Since the embodied carbon in the export trade is the product of a complete carbon emission coefficient and the volume of export trade, it can be concluded that the main export sectors from 2000 to 2015 are: “S10 mechanical equipment and instruments”, “S9 metal products” and the “S6 chemical industry”.
6. The Technological, Structural and Scale Effect of Embodied Carbon
6.1. Three Kinds of Effects of Embodied Carbon
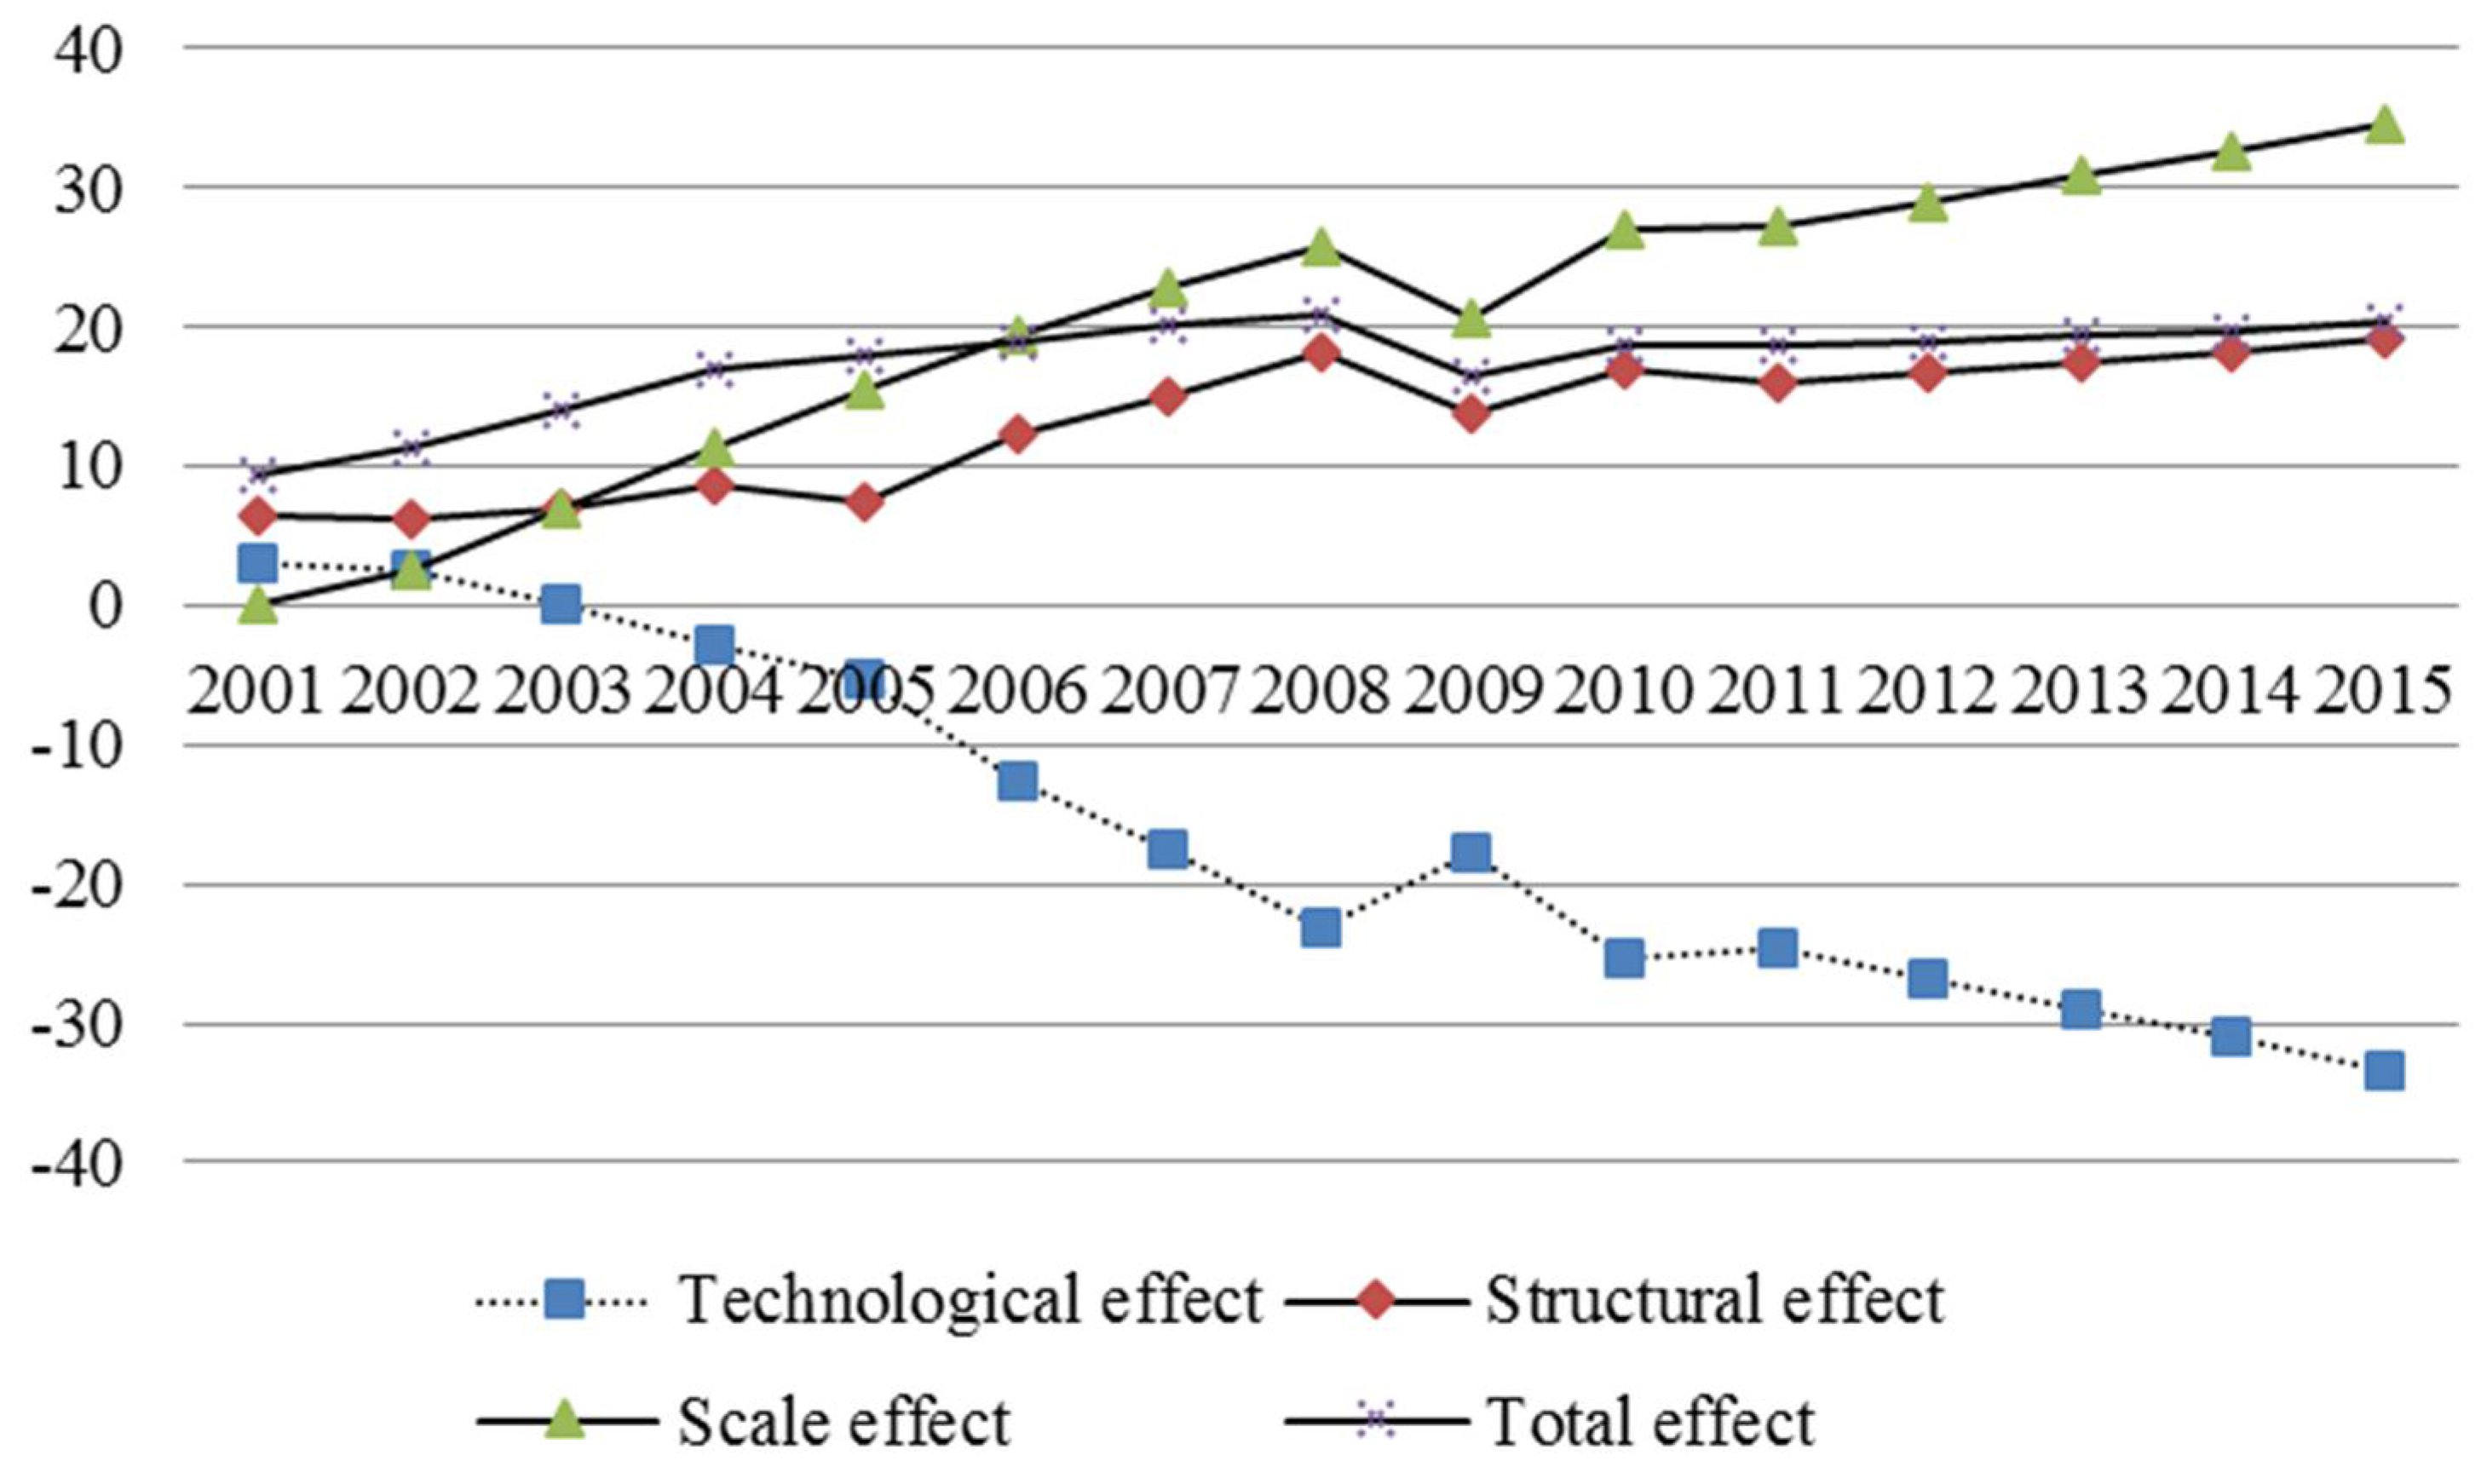
Taking the year 2000 as the base period and 2001–2015 as calculation periods, the values of technological effects, structural effects and scale effects can be calculated respectively according to formula (13). The results are shown in Figure 1.
From 2000 to 2015, the embodied carbon of China’s manufacturing industry rose from 761.7 million tons to 2034.1 million tons, which was an increase of 1272.4 million tons. From Figure 1, the following conclusions can be obtained:
- (1)
- In the past few years, the scale effect has had a positive influence on the changes of the embodied carbon. In other words, the constant expansion of the export scale is the main engine that drives the increase of embodied carbon in the export trade of the manufacturing industry. Even under the impact of the financial crisis in 2009, the scale effect still promoted the growth of embodied carbon as high as 1642.2 million tons.
- (2)
- The improvement of emission coefficient has an offset effect on the increase of embodied carbon in export trades. From 2000 to 2015, the cumulative negative impact of the technological effect on the embodied carbon growth in the manufacturing industry was −24,350.5 million tons. The technological effect measures the influence of the total carbon emission change on the embodied carbon in export trades, which indicates that the improvement of energy saving, emission reduction and productivity brought by production technology is of great benefit to inhibiting the increase of embodied carbon in exports of the manufacturing industry.
- (3)
- In the past few years, structural effect has had a positive influence on the export of embodied carbon, but the influence is weaker than that of the scale effect. From 2000 to 2015, the cumulative influence exerted by structural effect on the embodied carbon growth in exports of the manufacturing industry is 19931.94 million tons. The increasing trend of the structural effect shows that, in the export structure of the manufacturing industry, the proportion contributed by carbon-intensive products to the total export trade volume decreases.
6.2. Decomposition of the Sectoral Structure of Embodied Carbon
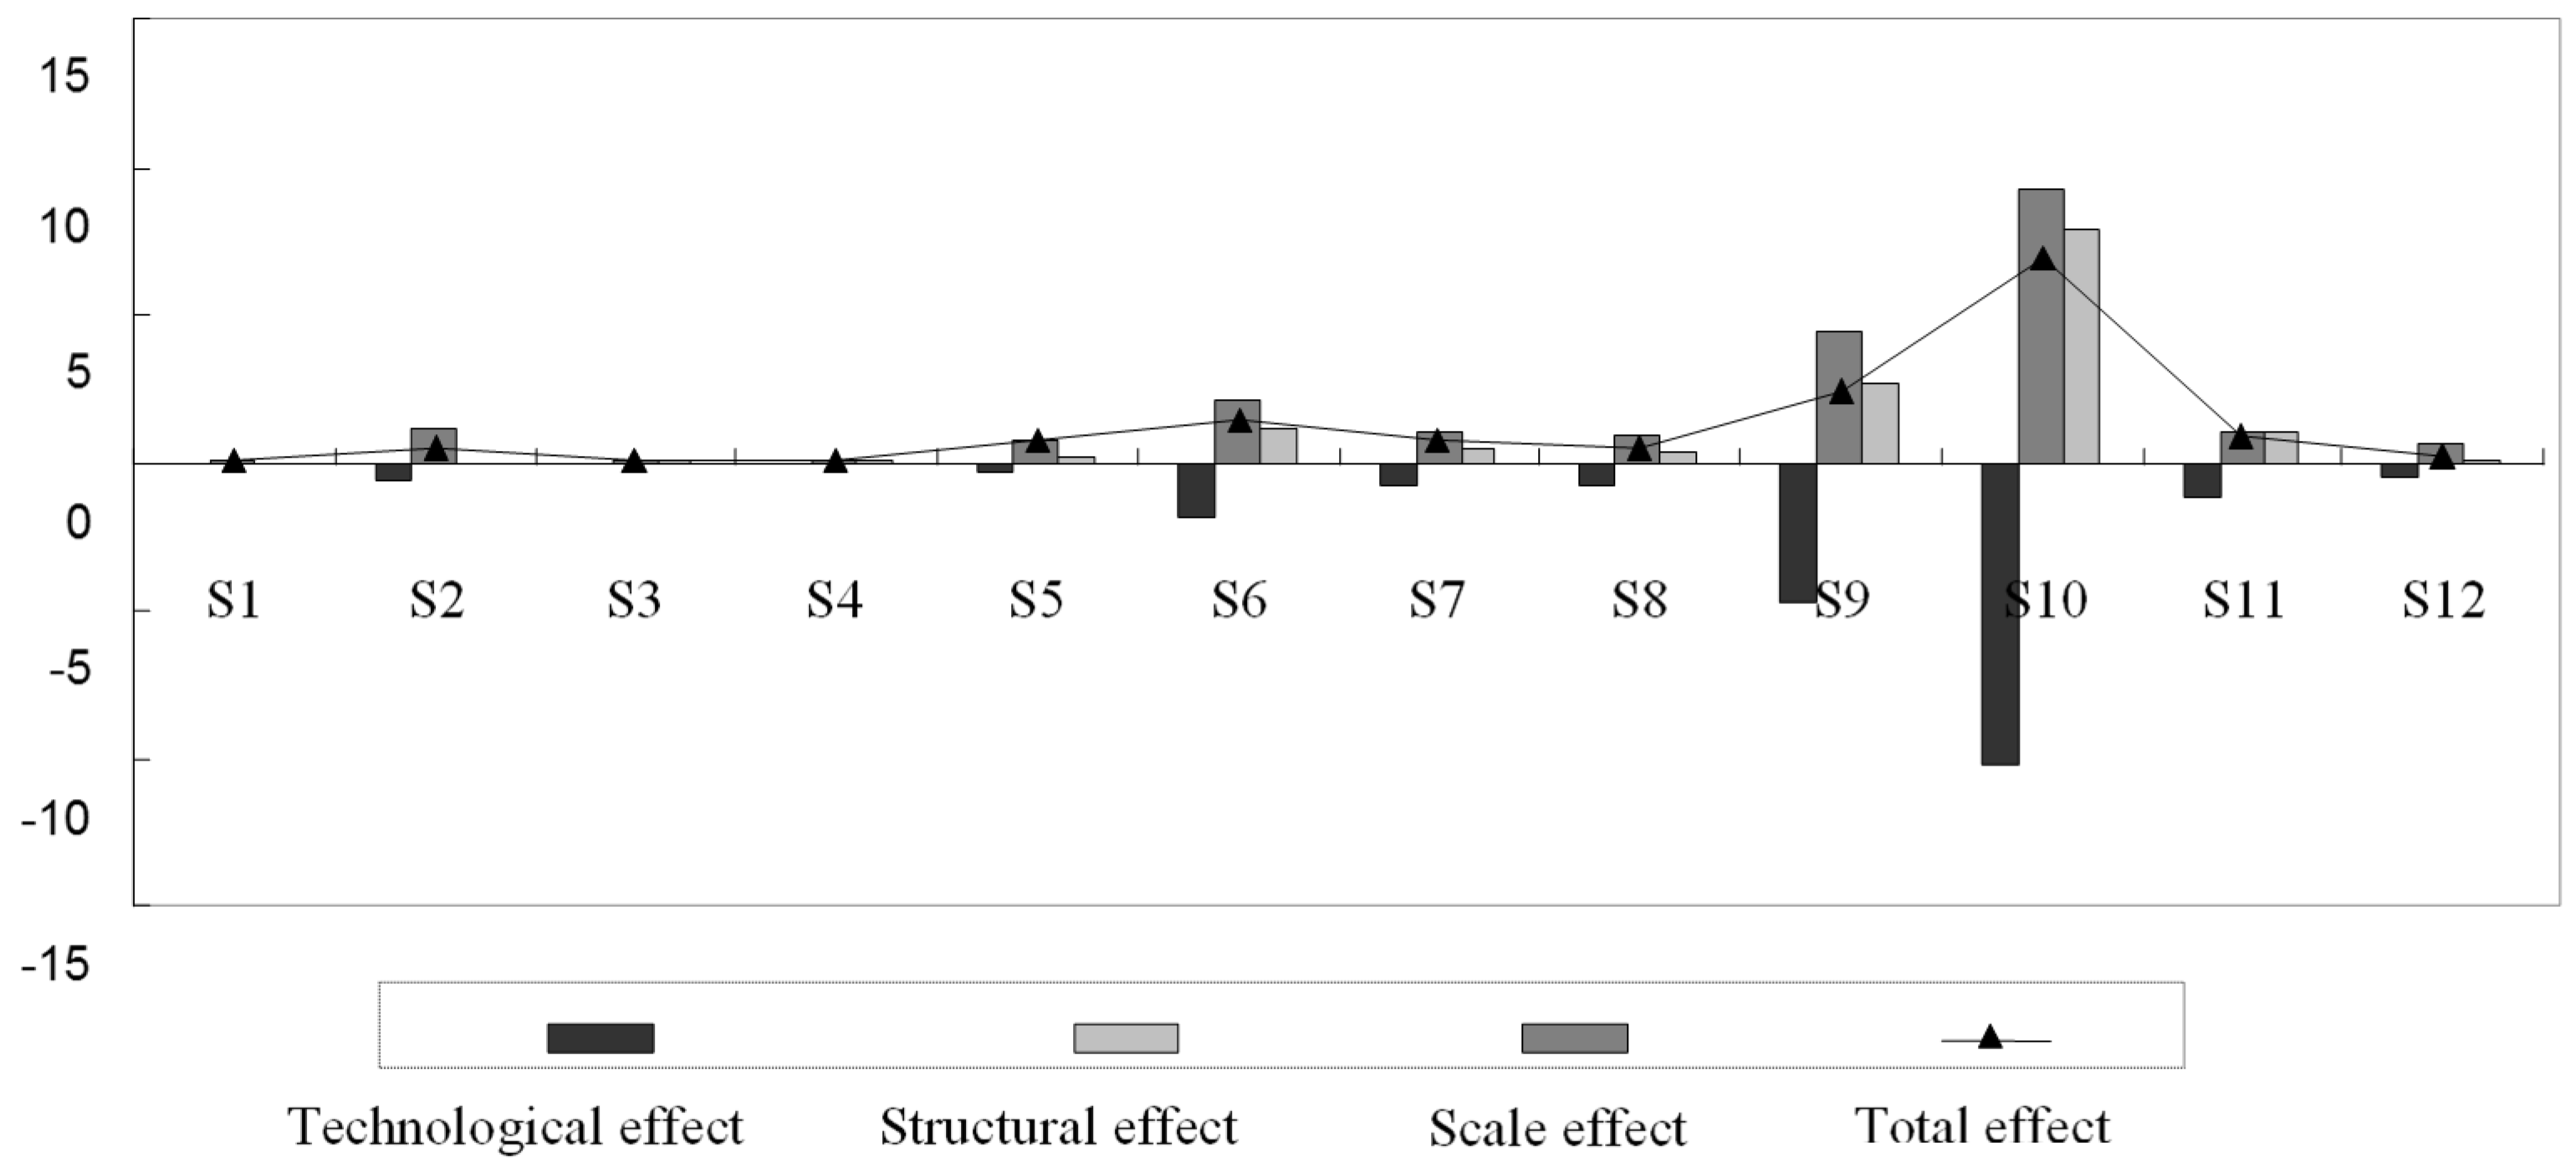
Taking 2000 as the base period and 2015 as the calculation period, this paper, on the level of sectors, decomposes the influence factors of the embodied carbon change in exports of the manufacturing industry into technological effect, structural effect and scale effect. The results are shown in Figure 2.
From Figure 2, the following conclusions can be attained:
- (1)
- From the sector level, the embodied carbon in exports of every manufacturing sector has experienced an increase. Among them, “S10 mechanical equipment and instruments” (698.5 million tons), “S9 metal products” (234.2 million tons) and “S6 chemical industry” (146.6 million tons) are the sectors that have the largest increase in the embodied carbon in export trades.
- (2)
- Scale effect has a positive influence on all manufacturing sectors in terms of the increase of embodied carbon in export trades; the technological effect exerts a negative effect on embodied carbon in export trades of all manufacturing sector. In other words, technological effect contributes to the decrease of embodied carbon in export trades; structural effect has a diverse influence on the embodied carbon in export trades according to different manufacturing sectors. In the three sectors of “S10 mechanical equipment and instruments”, “S9 metal products” and “S6 chemical industry”, the considerable increase of embodied carbon in export trades is mainly due to the joint influence of the scale effect and structural effect. Although the technological effect of the three sectors above can be used as a counterbalance, its influence is far below that of the scale effect and structural effect.
- (3)
- The technological effect and structural effect of “S1 food, beverage and tobacco” and “S2 textile, clothing, leather and shoe-making” are both negative, which is conducive to reducing embodied carbon in export trades; however, their negative effects cannot offset the influence of scale effect, leading to the increased embodied carbon in export trades of these two sectors.
From the above analysis, it can be perceived that, from 2000 to 2015, the scale effect has a positive influence on the embodied carbon in export trades in all manufacturing sectors; the technological effect negatively influences embodied carbon in export trades of all sectors; the influence of structural effect differs according to various sectors. The structural effect indicates the influence of export proportion changes on the embodied carbon in export trades. Since it is inevitable that export proportion rises and falls in different sectors, the influence of the structural effect can be both positive and negative.
7. Conclusions
The input–output method is a common method for evaluating embodied carbon. The thesis adopts an extended input–output method. By using the latest data in the OECD database, it calculates the coefficient of the direct carbon emission and complete carbon emission and the embodied carbon in the export trade of the Chinese manufacturing industry from 2000 to 2015 and decomposes the embodied carbon change of export trade in the manufacturing industry to technological effect, structural effect and scale effect by using the structural decomposition method. Several conclusions can be attained, including that: although the embodied carbon of the Chinese manufacturing industry has shown an increasing trend, the coefficients of the direct carbon emission and complete carbon emission have been declining in manufacturing sector. Scale effect has a positive influence on all manufacturing sectors in terms of the increase of embodied carbon in export trades; technological effect exerts a negative effect on embodied carbon in export trades of all manufacturing sectors. The influence of the structural effect is relatively small, but its overall trend is on the rise.
Based on the above conclusions, the following suggestions are made:
- Optimize energy structure and improve energy efficiency. New energy and renewable resources should be vigorously developed and the proportion of coal and resources alike in energy consumption should be reduced. The east coast regions of China are rich in wind energy and have a high potential of developing and using wind power. Other clean energy sources like the nuclear energy, bio-energy and solar energy also have potential. Furthermore, the whole society should combine the energy structure optimization with the increase of the energy-use efficiency, adopt the technology of energy saving and emission reduction, accelerate the reduction of overdependence that the traditional manufacturing industries have on the energy sources like coal, improve the overall efficiency of the existing energy system, curb the overall consumption of coal continuously, limit and eliminate high-carbon industries and develop low-carbon industries.
- Strengthen technology innovation and introduce clean production mechanism. The government should increase capital investment, encourage independent innovation, adjust the production structure so that the goals of energy saving and emission reduction could be achieved. The abundance of coal in China and its low price made it difficult for changing the coal-based energy consumption structure in China in the short term. Therefore, the technology of energy saving and emission reduction should be promoted and the energy consumption in the production be reduced. Furthermore, it is also necessary to positively introduce the Clean Development Mechanism (CDM) to reduce the carbon emission in the manufacturing industry of China. Developed countries are currently seeking opportunities to work with the CDM of the developing countries in order to achieve their goal of carbon emission reduction. The opportunity should be seized and the CDM program should be actively introduced to increase the efficiency of terminal energy use.
- Transform the mode of trade growth and promote the structural adjustment of import and export products. The governments should control the products with low added value, high energy consumption and high emission at their sources, and lead the product structure of the export products in the Chinese manufacturing industry towards one with high added value and low energy consumption. It is also necessary to encourage product exports of manufacturing industries to embrace low carbon emission and reduce the proportion of product exports in manufacturing industries with high carbon emission. At the same time, efforts should be made to increase the environmental regulations and promote the technical progress of the clean energy to reduce the energy intensity and carbon-emission intensity of exports; to optimize the trade structure to reduce the proportion of energy and pollution-intensive products in the export products and facilitate the transformation in development mode of manufacturing industries from the quantitate expansion to quality-oriented growth; to lead the transformation and upgrade of the processing trade and mitigate the negative effects of the rapid development exerted on the environment.
- Construct the new mechanism of assigning responsibilities for greenhouse gas emission reduction. The current United Nations Framework Convention on Climate Change (UNFCCC) is based on a “producer-based” responsibility sharing mechanism, i.e., the carbon emission of one country contains all of the carbon emissions of all products including those in the exports trade. The trading partner countries of China, while meeting their own consumer needs, bring huge pressure on emission reduction to the Chinese manufacturing industry. Therefore, China should actively participate in international climate change negotiation, promote the upgrading of the responsibility sharing mechanism, i.e., establish the “consumer-based” responsibility sharing mechanism, which could better reflect the principle of equitable distribution and be better accepted by other countries. Under the new mechanism of responsibility sharing, the developed countries should be responsible for their historical consumption and bear more responsibilities for emission reduction.
Author Contributions
J.G. conceived the research, and drafted, edited, and revised the manuscript. L.Z. designed the experiments; X.W. performed the experiments and analyzed the data.
Funding
This research was funded by the National Social and Scientific Fund Program (17BGL142); the Natural Science Foundation of China (91546117, 71373131); the Key Project of the National Social and Scientific Fund Program (16ZDA047); and the Ministry of Education Scientific Research Foundation for the returned overseas students (No. 2013-693, Ji Guo). This research was also supported by the Priority Academic Program Development of Jiangsu Higher Education Institutions.
Conflicts of Interest
The authors declare no conflict of interest.
References
- Gong, Z.; Chen, X. Analysis of Interval Data Envelopment Efficiency Model Considering Different Distribution Characteristics—Based on Environmental Performance Evaluation of the Manufacturing Industry. Sustainability 2017, 9, 2080. [Google Scholar] [CrossRef]
- Ederington, J.; Levinson, A.; Minier, J. Footloose and Pollution-Free. Rev. Econ. Stat. 2005, 87, 92–99. [Google Scholar] [CrossRef]
- Ederington, J.; Levinson, A.; Minier, J. Trade Liberalization and Pollution Havens. B.E. J. Adv. Econ. Anal. Policy 2004, 4, 1–24. [Google Scholar]
- Wang, F.; Wang, C.; Su, Y. Decomposition Analysis of Carbon Emission Factors from Energy Consumption in Guangdong Province from 1990 to 2014. Sustainability 2017, 9, 274. [Google Scholar] [CrossRef]
- Wei, C.; Ni, J.; Du, L. Regional allocation of carbon dioxide abatement in China. China Econ. Rev. 2012, 23, 552–565. [Google Scholar] [CrossRef]
- Lugauer, S.; Jensen, R.; Sadler, C. An Estimate of the Age Distribution’s Effect on Carbon Dioxide Emissions. Econ. Inquiry 2014, 52, 914–929. [Google Scholar] [CrossRef]
- Zagheni, E. The Leverage of Demographic Dynamics on Carbon Dioxide Emissions: Does Age Structure Matter? Demography 2011, 48, 371. [Google Scholar] [CrossRef] [PubMed]
- Yang, B.; Liu, C.; Su, Y. The Allocation of Carbon Intensity Reduction Target by 2020 among Industrial Sectors in China. Sustainability 2017, 9, 148. [Google Scholar] [CrossRef]
- Li, L. Analyses of CO2 emissions embodied in domestic and international trade for an open region: The case of Xinjiang. Shanghai J. Econ. 2012, 2, 13–23. [Google Scholar]
- Zhang, W.; Zhou, Y.Y. Measurement of embodied CO2 emission in trade and analysis on its misalignment of metropolitan area: Case of Beijing. Technol. Econ. 2013, 32, 11–19. [Google Scholar]
- Zhong, F.X. Empirical Study on Estimate of Embodied Carbon in Guangdong Province Foreign Trade and Analysis of Factors; Nanjing University of Information Science & Technology: Nanjing, China, 2013. [Google Scholar]
- Mi, Z.F.; Pan, S.Y.; Yu, H.; Wei, Y.M. Potential impacts of industrial structure on energy consumption and CO2 emission: A case study of Beijing. J. Clean. Prod. 2015, 103, 455–462. [Google Scholar] [CrossRef]
- Hasegawa, R.; Kagawa, S.; Tsukui, M. Carbon footprint analysis through constructing a multi-region input–output table: A case study of Japan. J. Econ. Struct. 2015, 4, 1–20. [Google Scholar] [CrossRef]
- Tian, X.; Chang, M.; Lin, C.; Tanikawa, H. China’s carbon footprint: A regional perspective on the effect of transitions in consumption and production patterns. Appl. Energy 2014, 123, 19–28. [Google Scholar] [CrossRef]
- Thomas, W.; Richard, W.; Jan, C.M.; Manfred, L.; Guan, D.B.; Harris, R. A carbon footprint time series of the UK results from a multi-region input–output model. Econ. Syst. Res. 2010, 22, 19–42. [Google Scholar]
- Manfred, L.; Richard, W.; Thomas, W. Uncertainty analysis for multi-region input–output models—A case study of the UK’s carbon footprint. Econ. Syst. Res. 2010, 22, 43–63. [Google Scholar]
- Yrjö, V.; Sirpa, K.; Merja, S.; Katajajuuri, J.M.; Kirsi, U.; IImo, M.; Johanna, M.; Juha, G.; Ari, N. Carbon footprint of food-approaches from national input–output statistics and a LCA of a food portion. J. Clean. Prod. 2011, 19, 1849–1856. [Google Scholar]
- Yang, H.M.; Wang, Y.; Liu, G.F. A Study on carbon emissions embodied in China’ s import and export in 2002 and 2007. Resour. Sci. 2011, 33, 1563–1569. [Google Scholar]
- Song, Y.Y. Empirical Research on Embodied Carbon Emissions of China’s Exports and Impacting Factors; Shandong University of Technology: Zibo, China, 2012. [Google Scholar]
- Qiu, Q.; Li, Q.Q. Accounting Embodied Carbon in Foreign Trade of China and the Analysis of Influential Factors. Econ. Manag. 2012, 34, 10–18. [Google Scholar]
- Yan, Y.F.; Zhao, Z.X.; Wang, R. China’s Emission Responsibility and Trade-embodied Emissions: A MRIO Approach. World Econ. Study 2013, 6, 54–58. [Google Scholar]
- Bin, S.; Ang, B.W.; Melissa, L. Input-output analysis of CO2 emissions embodied in trade and the driving forces: Processing and normal exports. Ecol. Econ. 2013, 88, 119–125. [Google Scholar]
- Glen, P.P.; Jan, C.M.; Christopher, L.; Weber, O.E. Growth in emission transfers via international trade from 1990–2008. Proc. Natl. Acad. Sci. USA 2011, 108, 8903–8908. [Google Scholar]
- Bin, S.; Ang, B.W. Input-output analysis of CO2 emissions embodied in trade: The feedback effects. Ecol. Econ. 2011, 71, 42–53. [Google Scholar]
- Kirsten, S.; Wiebe, M.B.; Stefan, G.; Christian, L. Calculating energy-related CO2 emissions embodied in international trade using a global input–output model. Econ. Syst. Res. 2012, 24, 113–139. [Google Scholar]
- Mi, Z.; Zhang, Y.; Guan, D.; Shan, Y.; Liu, Z.; Cong, R. Consumption-based emission accounting for Chinese cities. Appl. Energy 2016, 184, 1073–1081. [Google Scholar] [CrossRef] [Green Version]
- Mi, Z.; Meng, J.; Guan, D.; Shan, Y.; Song, M.; Wei, Y.M.; Liu, Z.; Hubacek, K. Chinese CO2 emission flows have reversed since the global financial crisis. Nat. Commun. 2017, 8, 1712. [Google Scholar] [CrossRef] [PubMed]
- Mi, Z.; Meng, J.; Guan, D.; Shan, Y.; Song, M.; Wei, Y.M.; Liu, Z. Pattern changes in determinants of Chinese emissions. Environ. Res. Lett. 2017, 12, 074003. [Google Scholar] [CrossRef] [Green Version]
- Sheng, J.; Wu, Y.; Zhang, M.; Miao, Z. An evolutionary modeling approach for designing a contractual REDD+ payment scheme. Ecol. Indic. 2017, 79, 276–285. [Google Scholar] [CrossRef]
- Sheng, J.; Webber, M. Incentive-compatible payments for watershed services along the Eastern Route of China’s South-North Water Transfer Project. Ecosyst. Serv. 2017, 25, 213–226. [Google Scholar] [CrossRef]
- Sheng, J.; Zhang, S.; Li, Y. Heterogeneous governance capabilities, reference emission levels and emissions from deforestation and degradation: A signaling model approach. Land Use Policy 2017, 64, 124–132. [Google Scholar] [CrossRef]
- Wei, S.C. Eatimate of China’s CO2 Emissions Embodied in Exports and Study on the Influences; Hunan University: Changsha, China, 2012. [Google Scholar]
- Yan, Y. CO2 Emissions Embodied in China’s International Trade; East China Normal University: Shanghai, China, 2011. [Google Scholar]
- Guo, J.; Weimei, Y.E. Measures and Influencing Factors of Embodied Carbon of Manufacturing Industries Export Trade in China. Sci. Technol. Manag. Res. 2015, 329, 214–222. [Google Scholar]
Figure 1.
The technological effect and structural effect and the scale effect on the embodied carbon in the Chinese manufacturing export trade (100 million tons) (Source: Authors’ calculations).
Figure 1.
The technological effect and structural effect and the scale effect on the embodied carbon in the Chinese manufacturing export trade (100 million tons) (Source: Authors’ calculations).

Figure 2.
The technological effect, structural effect and scale effect on the level of sectors from 2000 to 2015 (100 million tons) (Source: Authors’ calculations). Note: (1) in the figure, S1–S12 represents a sector, and the sector name is referenced in Table 2.
Figure 2.
The technological effect, structural effect and scale effect on the level of sectors from 2000 to 2015 (100 million tons) (Source: Authors’ calculations). Note: (1) in the figure, S1–S12 represents a sector, and the sector name is referenced in Table 2.


Table 1.
The value of energy’s and .
| Coal | Coke | Crude Oil | Gasoline | Kerosene | Diesel | Fuel Oil | Natural Gas | |
|---|---|---|---|---|---|---|---|---|
| Gj/kg | Gj/m3 | |||||||
| 0.021 | 0.028 | 0.042 | 0.043 | 0.043 | 0.043 | 0.042 | 0.039 | |
| CEF (kg/Gj) | 26.0 | 29.2 | 20.0 | 20.2 | 19.6 | 20.2 | 21.1 | 15.3 |
Source: Authors’ calculations.
Table 2.
Department consolidation.
| Merged Departments | Input–Output Table of OECD | The Energy Consumption Table | Export Trade Table |
|---|---|---|---|
| S1 food, beverage and tobacco | Food products, beverages and tobacco | Farm and sideline products processing | Food beverages and tobacco |
| Food manufacturing | |||
| Beverage manufacturing | |||
| Tobacco industry | |||
| S2 textile, clothing, leather and shoe-making | Textiles, textile products, leather and footwear | Textile industry | Textiles leather and footwear |
| Textile clothing, shoes, hat manufacturing industry | |||
| Leather, fur, feather (velvet) and its products | |||
| S3 wood and wooden products | Wood and products of wood and cork | Wood processing and wood, bamboo, rattan, brown, grass manufacturing | Wood and cork |
| Furniture manufacturing | |||
| S4 papermaking, printing, publishing, culture and education | Pulp, paper, paper products, printing and publishing | Paper making and paper products industry | Pulp paper printing and publishing |
| The reproduction of printing and recording media | |||
| Educational and sports Goods | |||
| S5 petroleum, coking, and nuclear fuel processing industries | Coke, refined petroleum products and nuclear fuel | Petroleum processing, coking and nuclear fuel processing | Coke refined petroleum and nuclear fuel |
| S6 chemical industry | Chemicals and chemical products | Chemical industry | Chemicals and chemical products |
| Medicine manufacturing industry | Chemicals excluding pharmaceuticals | ||
| Chemical fiber manufacturing | Pharmaceuticals | ||
| S7 rubber and plastic products | Rubber and plastics products | Manufacture of rubber | Chemical rubber plastics and fuel |
| Manufacture of plastics | Rubber and plastics | ||
| S8 non-metallic mineral products | Other non-metallic mineral products | Manufacture of non-metallic mineral products | Non-metallic products |
| Non-ferrous metals | |||
| S9 metal products | Basic metals | Ferrous metal smelting and rolling processing industry | Basic metals and fabricated metal products |
| Fabricated metal products except machinery and equipment | Non-ferrous metal smelting and rolling processing industry | Basic metals | |
| Manufacture of metal products | Iron and steel | ||
| Fabricated metal products | |||
| S10 mechanical equipment and instruments | Machinery and equipment n.e.c | Manufacture of general purpose machinery | Machinery and equipment |
| Office, accounting and computing machinery | General and special equipment manufacturing | Machinery and equipment n.e.c | |
| Electrical machinery and apparatus n.e.c | Manufacture of electrical machinery and equipment | Electrical and optical equipment | |
| Radio, television and communication equipment | Communications equipment, computer and other electronic equipment manufacturing | Office accounting and computing machinery | |
| Electrical machinery and apparatus n.e.c | |||
| Medical, precision and optical instruments | Instrumentation and culture, office machinery manufacturing | Radio TV communication equipment | |
| Medical precision and optical instrument | |||
| S11 transportation equipment | Motor vehicles, trailers and semi-trailers | Transportation equipment manufacturing industry | Transport equipment |
| Motor vehicles trailers and semi-trailers | |||
| Other transport equipment | |||
| Other transport equipment | Shipbuilding | ||
| Aircraft and spacecraft | |||
| Railroad and transport equipment n.e.c | |||
| S12 other manufacturing industries | Manufacturing n.e.c; recycling | Handicraft article and other manufacturing | Manufacturing n.e.c and recycling |
| Waste resources and waste materials recycling and processing industry |
Source: Authors’ calculations.
Table 3.
The coefficient of the direct carbon emission in Chinese manufacturing sectors (kg/USD).
| Year | 2000 | 2001 | 2002 | 2003 | 2004 | 2005 | 2006 | 2007 | 2008 | 2009 | 2010 | 2011 | 2012 | 2013 | 2014 | 2015 | |
|---|---|---|---|---|---|---|---|---|---|---|---|---|---|---|---|---|---|
| Sector | |||||||||||||||||
| S1 | 0.332 | 0.410 | 0.335 | 0.291 | 0.222 | 0.192 | 0.153 | 0.123 | 0.117 | 0.099 | 0.084 | 0.081 | 0.078 | 0.075 | 0.074 | 0.071 | |
| S2 | 0.176 | 0.235 | 0.198 | 0.177 | 0.188 | 0.157 | 0.139 | 0.117 | 0.107 | 0.094 | 0.082 | 0.078 | 0.073 | 0.071 | 0.068 | 0.064 | |
| S3 | 0.289 | 0.301 | 0.253 | 0.242 | 0.204 | 0.116 | 0.124 | 0.092 | 0.089 | 0.074 | 0.058 | 0.042 | 0.031 | 0.026 | 0.024 | 0.021 | |
| S4 | 0.822 | 0.735 | 0.663 | 0.573 | 0.624 | 0.483 | 0.515 | 0.421 | 0.397 | 0.378 | 0.325 | 0.321 | 0.289 | 0.276 | 0.265 | 0.260 | |
| S5 | 6.747 | 8.929 | 9.261 | 8.178 | 7.741 | 7.235 | 5.503 | 5.043 | 4.090 | 4.596 | 3.837 | 3.628 | 3.534 | 3.416 | 3.376 | 3.301 | |
| S6 | 1.731 | 1.964 | 1.906 | 1.659 | 1.238 | 0.858 | 0.968 | 0.797 | 0.736 | 0.656 | 0.507 | 0.407 | 0.386 | 0.372 | 0.364 | 0.358 | |
| S7 | 0.150 | 0.228 | 0.177 | 0.157 | 0.159 | 0.138 | 0.106 | 0.084 | 0.089 | 0.080 | 0.070 | 0.065 | 0.060 | 0.055 | 0.051 | 0.046 | |
| S8 | 3.003 | 3.268 | 2.869 | 2.778 | 2.965 | 4.854 | 1.979 | 1.518 | 1.488 | 1.286 | 0.981 | 0.781 | 0.702 | 0.683 | 0.651 | 0.624 | |
| S9 | 2.624 | 2.951 | 2.888 | 2.509 | 1.848 | 2.009 | 1.608 | 1.294 | 1.044 | 1.139 | 0.995 | 0.872 | 0.762 | 0.685 | 0.603 | 0.545 | |
| S10 | 0.093 | 0.101 | 0.089 | 0.071 | 0.057 | 0.054 | 0.044 | 0.036 | 0.033 | 0.036 | 0.029 | 0.027 | 0.023 | 0.021 | 0.019 | 0.018 | |
| S11 | 0.145 | 0.166 | 0.131 | 0.100 | 0.100 | 0.103 | 0.070 | 0.054 | 0.054 | 0.044 | 0.034 | 0.031 | 0.031 | 0.028 | 0.027 | 0.025 | |
| S12 | 0.300 | 0.551 | 0.388 | 0.387 | 0.459 | 0.134 | 0.223 | 0.152 | 0.138 | 0.110 | 0.086 | 0.075 | 0.072 | 0.070 | 0.065 | 0.062 | |
Source: Authors’ calculations.
Table 4.
The coefficient of the complete carbon emission in Chinese manufacturing sectors (kg/USD).
| Year | 2000 | 2001 | 2002 | 2003 | 2004 | 2005 | 2006 | 2007 | 2008 | 2009 | 2010 | 2011 | 2012 | 2013 | 2014 | 2015 | |
|---|---|---|---|---|---|---|---|---|---|---|---|---|---|---|---|---|---|
| Sector | |||||||||||||||||
| S1 | 0.542 | 0.658 | 0.570 | 0.497 | 0.400 | 0.378 | 0.312 | 0.256 | 0.235 | 0.213 | 0.177 | 0.156 | 0.145 | 0.138 | 0.327 | 0.125 | |
| S2 | 0.709 | 0.876 | 0.808 | 0.712 | 0.647 | 0.552 | 0.508 | 0.428 | 0.384 | 0.357 | 0.296 | 0.287 | 0.275 | 0.264 | 0.242 | 0.223 | |
| S3 | 1.051 | 1.193 | 1.116 | 1.002 | 0.843 | 0.654 | 0.598 | 0.489 | 0.434 | 0.418 | 0.340 | 0.331 | 0.32 | 0.31 | 0.28 | 0.275 | |
| S4 | 1.465 | 1.457 | 1.359 | 1.183 | 1.165 | 1.121 | 1.120 | 0.926 | 0.847 | 0.817 | 0.688 | 0.650 | 0.64 | 0.625 | 0.611 | 0.584 | |
| S5 | 7.301 | 9.645 | 9.995 | 8.826 | 8.343 | 7.590 | 5.778 | 5.291 | 4.293 | 4.820 | 4.023 | 3.824 | 3.753 | 3.654 | 3.586 | 3.486 | |
| S6 | 2.920 | 3.389 | 3.316 | 2.896 | 2.279 | 1.810 | 1.843 | 1.547 | 1.391 | 1.303 | 1.029 | 1.025 | 1.022 | 1.014 | 0.952 | 0.867 | |
| S7 | 1.171 | 1.441 | 1.357 | 1.191 | 1.013 | 1.049 | 0.775 | 0.655 | 0.578 | 0.583 | 0.484 | 0.425 | 0.385 | 0.375 | 0.367 | 0.358 | |
| S8 | 4.283 | 4.794 | 4.360 | 4.111 | 4.188 | 5.578 | 2.510 | 1.970 | 1.877 | 1.685 | 1.310 | 1.285 | 1.254 | 1.184 | 1.175 | 1.64 | |
| S9 | 4.553 | 5.228 | 5.145 | 4.488 | 3.473 | 2.486 | 1.976 | 1.612 | 1.308 | 1.422 | 1.231 | 1.213 | 1.182 | 1.175 | 1.154 | 1.098 | |
| S10 | 1.321 | 1.532 | 1.489 | 1.298 | 1.058 | 0.824 | 0.672 | 0.556 | 0.472 | 0.491 | 0.411 | 0.405 | 0.385 | 0.356 | 0.345 | 0.336 | |
| S11 | 1.330 | 1.555 | 1.479 | 1.274 | 1.066 | 0.910 | 0.736 | 0.605 | 0.520 | 0.525 | 0.437 | 0.427 | 0.415 | 0.405 | 0.385 | 0.376 | |
| S12 | 1.236 | 1.649 | 1.454 | 1.322 | 1.245 | 0.696 | 0.697 | 0.547 | 0.477 | 0.454 | 0.371 | 0.362 | 0.357 | 0.342 | 0.337 | 0.315 | |
Source: Authors’ calculations.
Table 5.
The CO2 emission in the Chinese manufacturing industry and the embodied carbon in the Chinese manufacturing export trade (100 million tons).
Table 5.
The CO2 emission in the Chinese manufacturing industry and the embodied carbon in the Chinese manufacturing export trade (100 million tons).
| Year | 2000 | 2001 | 2002 | 2003 | 2004 | 2005 | 2006 | 2007 | 2008 | 2009 | 2010 | 2011 | 2012 | 2013 | 2014 | 2015 |
|---|---|---|---|---|---|---|---|---|---|---|---|---|---|---|---|---|
| The embodied carbon in Chinese manufacturing export trade | 7.617 | 9.504 | 11.385 | 13.949 | 17.020 | 17.913 | 18.877 | 20.237 | 20.992 | 16.502 | 18.577 | 19.083 | 19.232 | 19.656 | 19.673 | 19.407 |
| The CO2 emission in Chinese manufacturing industry | 19.332 | 19.186 | 20.600 | 23.902 | 29.699 | 33.273 | 37.154 | 39.755 | 42.951 | 45.057 | 48.805 | 50.205 | 51.203 | 52.387 | 53.648 | 54.269 |
| The embodied carbon accounts for the CO2 emission | 39.4% | 49.5% | 55.3% | 58.4% | 57.3% | 53.8% | 50.8% | 50.9% | 48.9% | 36.6% | 38.1% | 38% | 37.6% | 37.5% | 36.7% | 35.8% |
Source: Authors’ calculations.
Table 6.
The embodied carbon in the export trade of Chinese manufacturing sectors (100 million tons).
Table 6.
The embodied carbon in the export trade of Chinese manufacturing sectors (100 million tons).
| Year | 2000 | 2001 | 2002 | 2003 | 2004 | 2005 | 2006 | 2007 | 2008 | 2009 | 2010 | 2011 | 2012 | 2013 | 2014 | 2015 | |
|---|---|---|---|---|---|---|---|---|---|---|---|---|---|---|---|---|---|
| Sector | |||||||||||||||||
| S1 | 0.055 | 0.071 | 0.067 | 0.067 | 0.064 | 0.071 | 0.071 | 0.067 | 0.069 | 0.059 | 0.061 | 0.062 | 0.061 | 0.057 | 0.061 | 0.063 | |
| S2 | 0.479 | 0.609 | 0.643 | 0.709 | 0.778 | 0.801 | 0.906 | 0.903 | 0.884 | 0.747 | 0.775 | 0.785 | 0.796 | 0.802 | 0.812 | 0.823 | |
| S3 | 0.028 | 0.034 | 0.039 | 0.043 | 0.051 | 0.049 | 0.059 | 0.056 | 0.050 | 0.038 | 0.038 | 0.039 | 0.041 | 0.043 | 0.058 | 0.059 | |
| S4 | 0.028 | 0.031 | 0.035 | 0.040 | 0.047 | 0.059 | 0.079 | 0.097 | 0.099 | 0.092 | 0.094 | 0.095 | 0.096 | 0.097 | 0.096 | 0.099 | |
| S5 | 0.249 | 0.336 | 0.380 | 0.519 | 0.714 | 0.732 | 0.586 | 0.711 | 0.931 | 0.683 | 0.828 | 0.836 | 0.834 | 0.851 | 0.808 | 0.906 | |
| S6 | 0.724 | 0.922 | 1.047 | 1.182 | 1.259 | 1.345 | 1.669 | 1.986 | 2.333 | 1.705 | 1.861 | 1.877 | 1.902 | 1.953 | 2.021 | 2.135 | |
| S7 | 0.358 | 0.469 | 0.517 | 0.586 | 0.678 | 0.919 | 0.826 | 0.913 | 1.015 | 0.833 | 0.949 | 0.958 | 1.032 | 1.041 | 1.046 | 1.051 | |
| S8 | 0.344 | 0.393 | 0.428 | 0.536 | 0.817 | 1.382 | 0.905 | 0.799 | 0.860 | 0.586 | 0.633 | 0.642 | 0.615 | 0.623 | 0.642 | 0.651 | |
| S9 | 1.696 | 1.844 | 2.111 | 2.456 | 3.500 | 3.315 | 4.043 | 4.615 | 4.795 | 2.637 | 3.268 | 3.225 | 3.285 | 3.753 | 3.851 | 4.012 | |
| S10 | 3.102 | 4.096 | 5.363 | 6.922 | 8.098 | 8.273 | 8.630 | 8.883 | 8.628 | 7.930 | 8.678 | 8.753 | 8.882 | 8.612 | 8.768 | 8.892 | |
| S11 | 0.316 | 0.377 | 0.404 | 0.506 | 0.566 | 0.648 | 0.719 | 0.834 | 0.939 | 0.864 | 1.051 | 1.125 | 1.134 | 1.205 | 1.215 | 1.225 | |
| S12 | 0.238 | 0.321 | 0.350 | 0.383 | 0.449 | 0.318 | 0.383 | 0.373 | 0.390 | 0.327 | 0.341 | 0.335 | 0.338 | 0.401 | 0.415 | 0.425 | |
Source: Authors’ calculations.
© 2018 by the authors. Licensee MDPI, Basel, Switzerland. This article is an open access article distributed under the terms and conditions of the Creative Commons Attribution (CC BY) license (http://creativecommons.org/licenses/by/4.0/).
Share and Cite
MDPI and ACS Style
Guo, J.; Zhou, L.; Wu, X. Tendency of Embodied Carbon Change in the Export Trade of Chinese Manufacturing Industry from 2000 to 2015 and Its Driving Factors. Sustainability 2018, 10, 1839. https://doi.org/10.3390/su10061839
AMA Style
Guo J, Zhou L, Wu X. Tendency of Embodied Carbon Change in the Export Trade of Chinese Manufacturing Industry from 2000 to 2015 and Its Driving Factors. Sustainability. 2018; 10(6):1839. https://doi.org/10.3390/su10061839
Chicago/Turabian StyleGuo, Ji, Lei Zhou, and Xianhua Wu. 2018. "Tendency of Embodied Carbon Change in the Export Trade of Chinese Manufacturing Industry from 2000 to 2015 and Its Driving Factors" Sustainability 10, no. 6: 1839. https://doi.org/10.3390/su10061839
Note that from the first issue of 2016, this journal uses article numbers instead of page numbers. See further details here.