Predictive Diagnosis of Agricultural Periurban Areas Based on Territorial Indicators: Comparative Landscape Trends of the So-Called “Orchard of Europe”


Department of Civil Engineering, Technical University of Cartagena, CP. 30202 Cartagena, Spain
Sustainability 2018, 10(6), 1820; https://doi.org/10.3390/su10061820
Submission received: 9 May 2018
/
Revised: 25 May 2018
/
Accepted: 29 May 2018
/
Published: 31 May 2018
(This article belongs to the Special Issue Agriculture, Landscape, Ecosystem Services and Biodiversity: New Challenges for Sustainable Development)
Abstract
:The Mediterranean southeastern area of Spain has traditionally been known as the “Orchard of Europe”. This configuration, which is based fundamentally on traditional agriculture in periurban areas, has evolved in recent decades as a consequence of the sophistication of the agrifood processes transforming its landscape. In addition, tourism, the growth of cities, and the impact of the real estate bubble between 1995 and 2007 have configured important alterations which have generated heterogeneous phenomena in these periurban areas. The present article studies this process by analyzing the evolution of the territory and diagnosing its transformation at a large scale. The evolution of three very representative periurban and similar in size environments of this so-called Europe’s orchard will be compared by using different GIS tools: the El Ejido area, the Campo de Cartagena—Mar Menor area and the Huerta de Murcia area. Through the implementation of different territorial indicators, the current issues will be established from an objective and quantifiable perspective. Moreover, possible future scenarios for 2030 will be raised according to the current transformation trends. This approach will lead us to consider the concept of life cycle in the transformation process of a territory.
1. Introduction
The management of periurban areas is a field that is gaining increasing research interest in very different scientific contexts [1,2,3]. The sprawl model of growth in cities is a rising phenomenon that encompasses a varied catalogue of urban configurations. It ranges from cities in emerging countries with high growth rates where the scale of work reaches the regional level [4], to cohabitation phenomena in developed countries where landscape preservation requires more sophisticated strategies [5]. In such periurban territories, agricultural soil transformation processes and landscape impacts generated by changes in land use, as well as the complex management that these “mixed territories” commonly suffer [6], are particularly interesting.
In this field, the retrospective analysis of mature case studies of these territories in a developed country in America [7] or Europe [8] for example can prove very helpful as a learning element for the development of today’s emerging countries. Phenomena such as the accelerated growth of large cities [9,10], rural-urban migrations [11] or the impact of mass tourism [12] are common examples of causes linked to the anthropization, or loss of identity of these territories. Such territories have traditionally been one of the basic livelihoods of cities. Their habitual landscape values are also usually joined in importance as support for the agricultural activity that harbors the food sovereignty of many territories and even countries. Within that subject, a particularly interesting case concerns the evolution of Mediterranean south-eastern Spain territory. This territory is an agricultural environment of high landscape value traditionally called the “Orchard of Europe” for historically supplying fruit and vegetables to the rest of the continent’s countries where the climate did not favor the development of these crops. Currently almost 60% of horticultural products exported by Spain are produced within this territory. Almost 25% of the fresh produce of these characteristics consumed in the northern countries of the European Union comes from that area, with that trend progressively increasing [13]. This increasingly sophisticated and resource-intensive agriculture has also had to cohabit with the rise of mass tourism and urban sprawl in the territory [14].
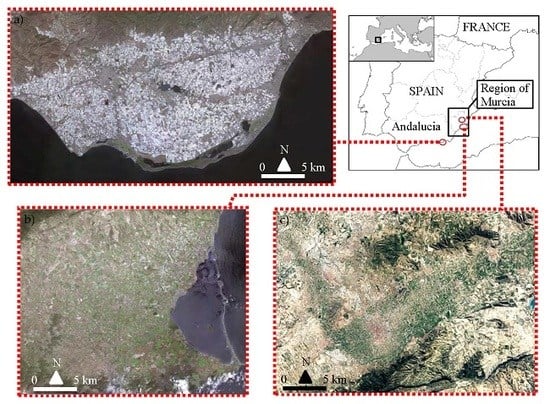
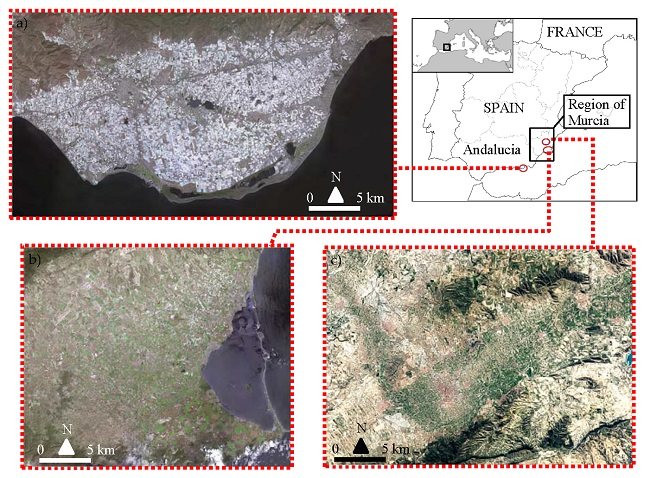
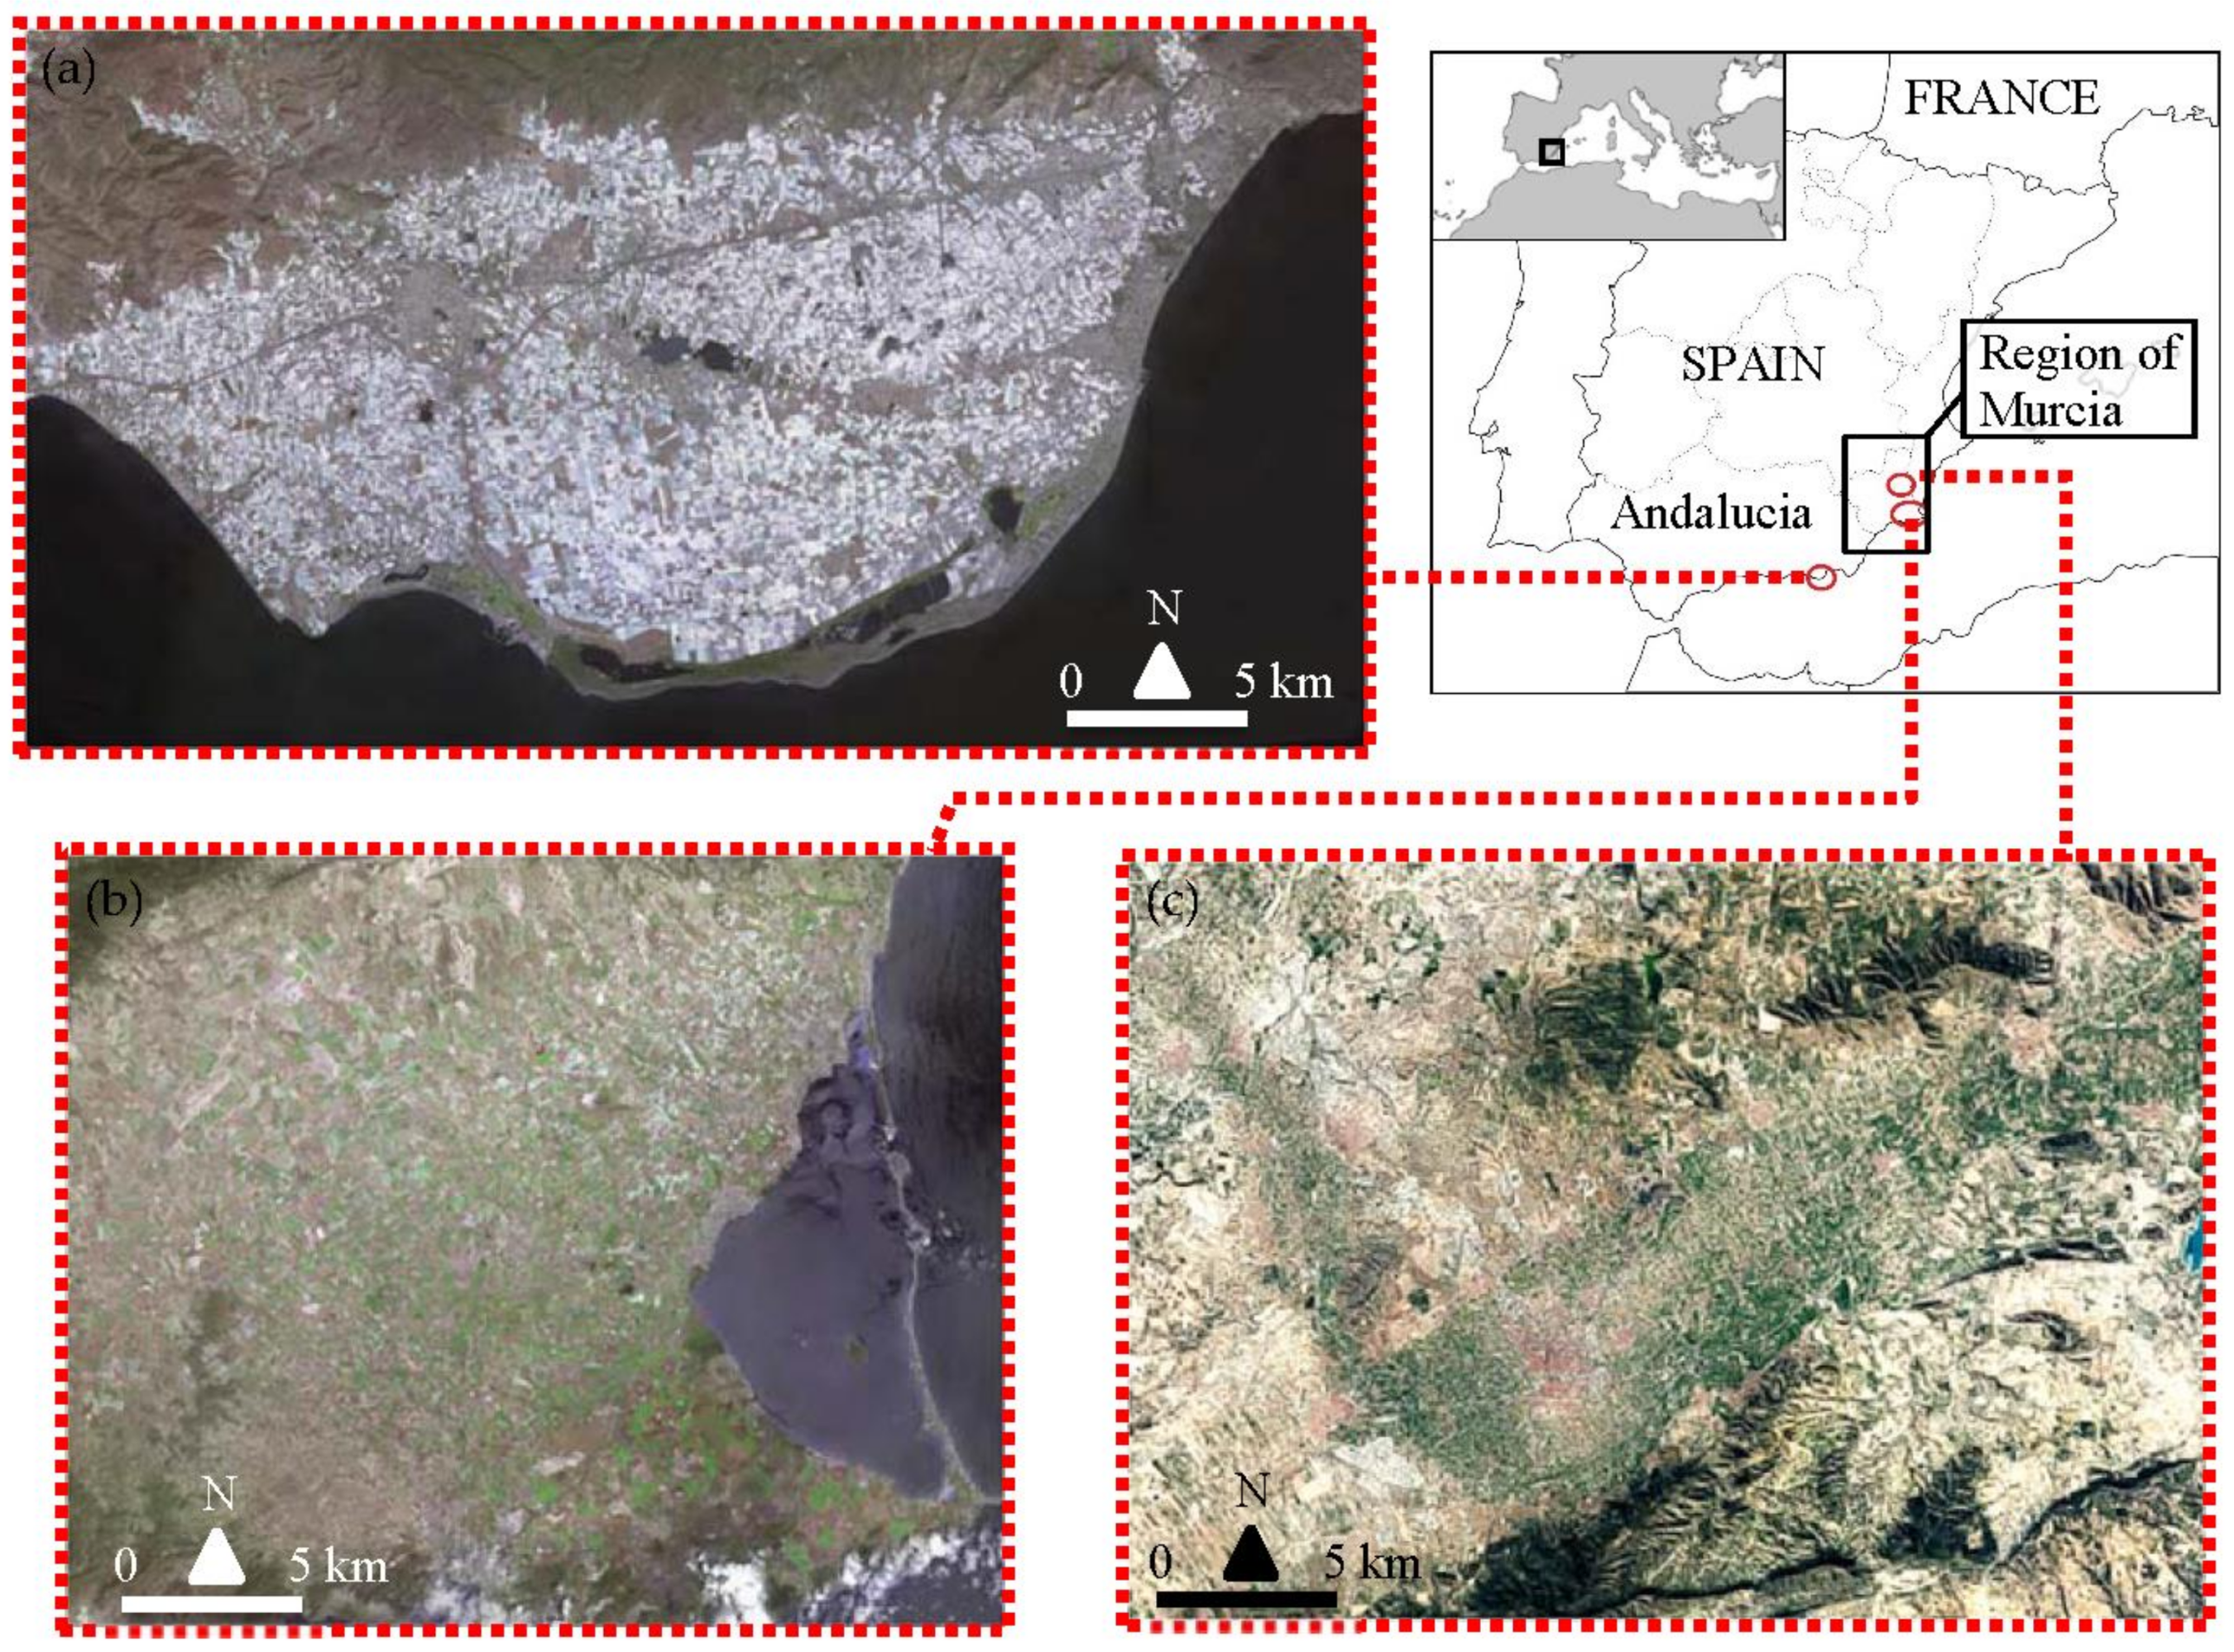
This phenomenon, in combination with other pre-existing issues, has produced an intense process of land transformation in the area, altering the traditional periurban landscape in a substantial way. Nevertheless, it has not been a homogeneous process, when subjected to different variables that seem to throw behavior patterns together with a certain degree of heterogeneity. In this way, urban sprawl and tourism, combined with intensive agriculture, have distorted the landscape of the territory during the last 50 years, configuring a new scenario full of imbalances whose trend evolution must be analyzed accurately. In that context, the progressive development and sophistication of georeferencing techniques and GIS analysis implemented in HRL data can be very useful. For that, in this work, the three periurban areas of the greatest traditional agricultural production of Europe are analyzed and compared through the assessment of GIS indicators: El Ejido-Campo Dalias, the Huerta de Murcia and Campo de Cartagena—Mar Menor areas (Figure 1).
The comparative vision of different territories from a numerical and objective perspective is therefore introduced as a novelty in the scientific field of the analysis of the landscape and territorial transformation of periurban spaces. With this approach, we seek to understand the similarities and differences in the patterns of territorial transformation that the action of man originates in these complex environments. From this comparative perspective, the current issues and future trends that accompany this territorial transformation will be diagnosed. The implementation of these future scenarios at a quantitative level for the three periurban areas analyzed will allow us to establish in an approximate way their situation, in what we have come to call the anthropization life-cycle time of a territory.
2. Materials and Methods
The transformation patterns of these three periurban areas will be analyzed by means of various GIS indicators of land diagnosis and assessment. For that, the GIS program GvSIG v2.3.6 has been used. Based on different Spatial Data Infrastructure (SDI) of public administrations [15,16] performed from the European directive INSPIRE [17,18], the evolution of land consumption for different historical cartographies has been evaluated with precision of up to one meter of spatial resolution. GIS land analysis can be a very effective territorial method in the evaluation of phenomena of anthropization on a large scale [19,20]. The use of landscape diagnosis through GIS tools is in itself not a new methodology (see good examples in [21,22,23]). However, it is their numerical comparative analysis through various territorial dimensionless indicators and the performing of trend evolution scenarios which makes them particularly interesting.
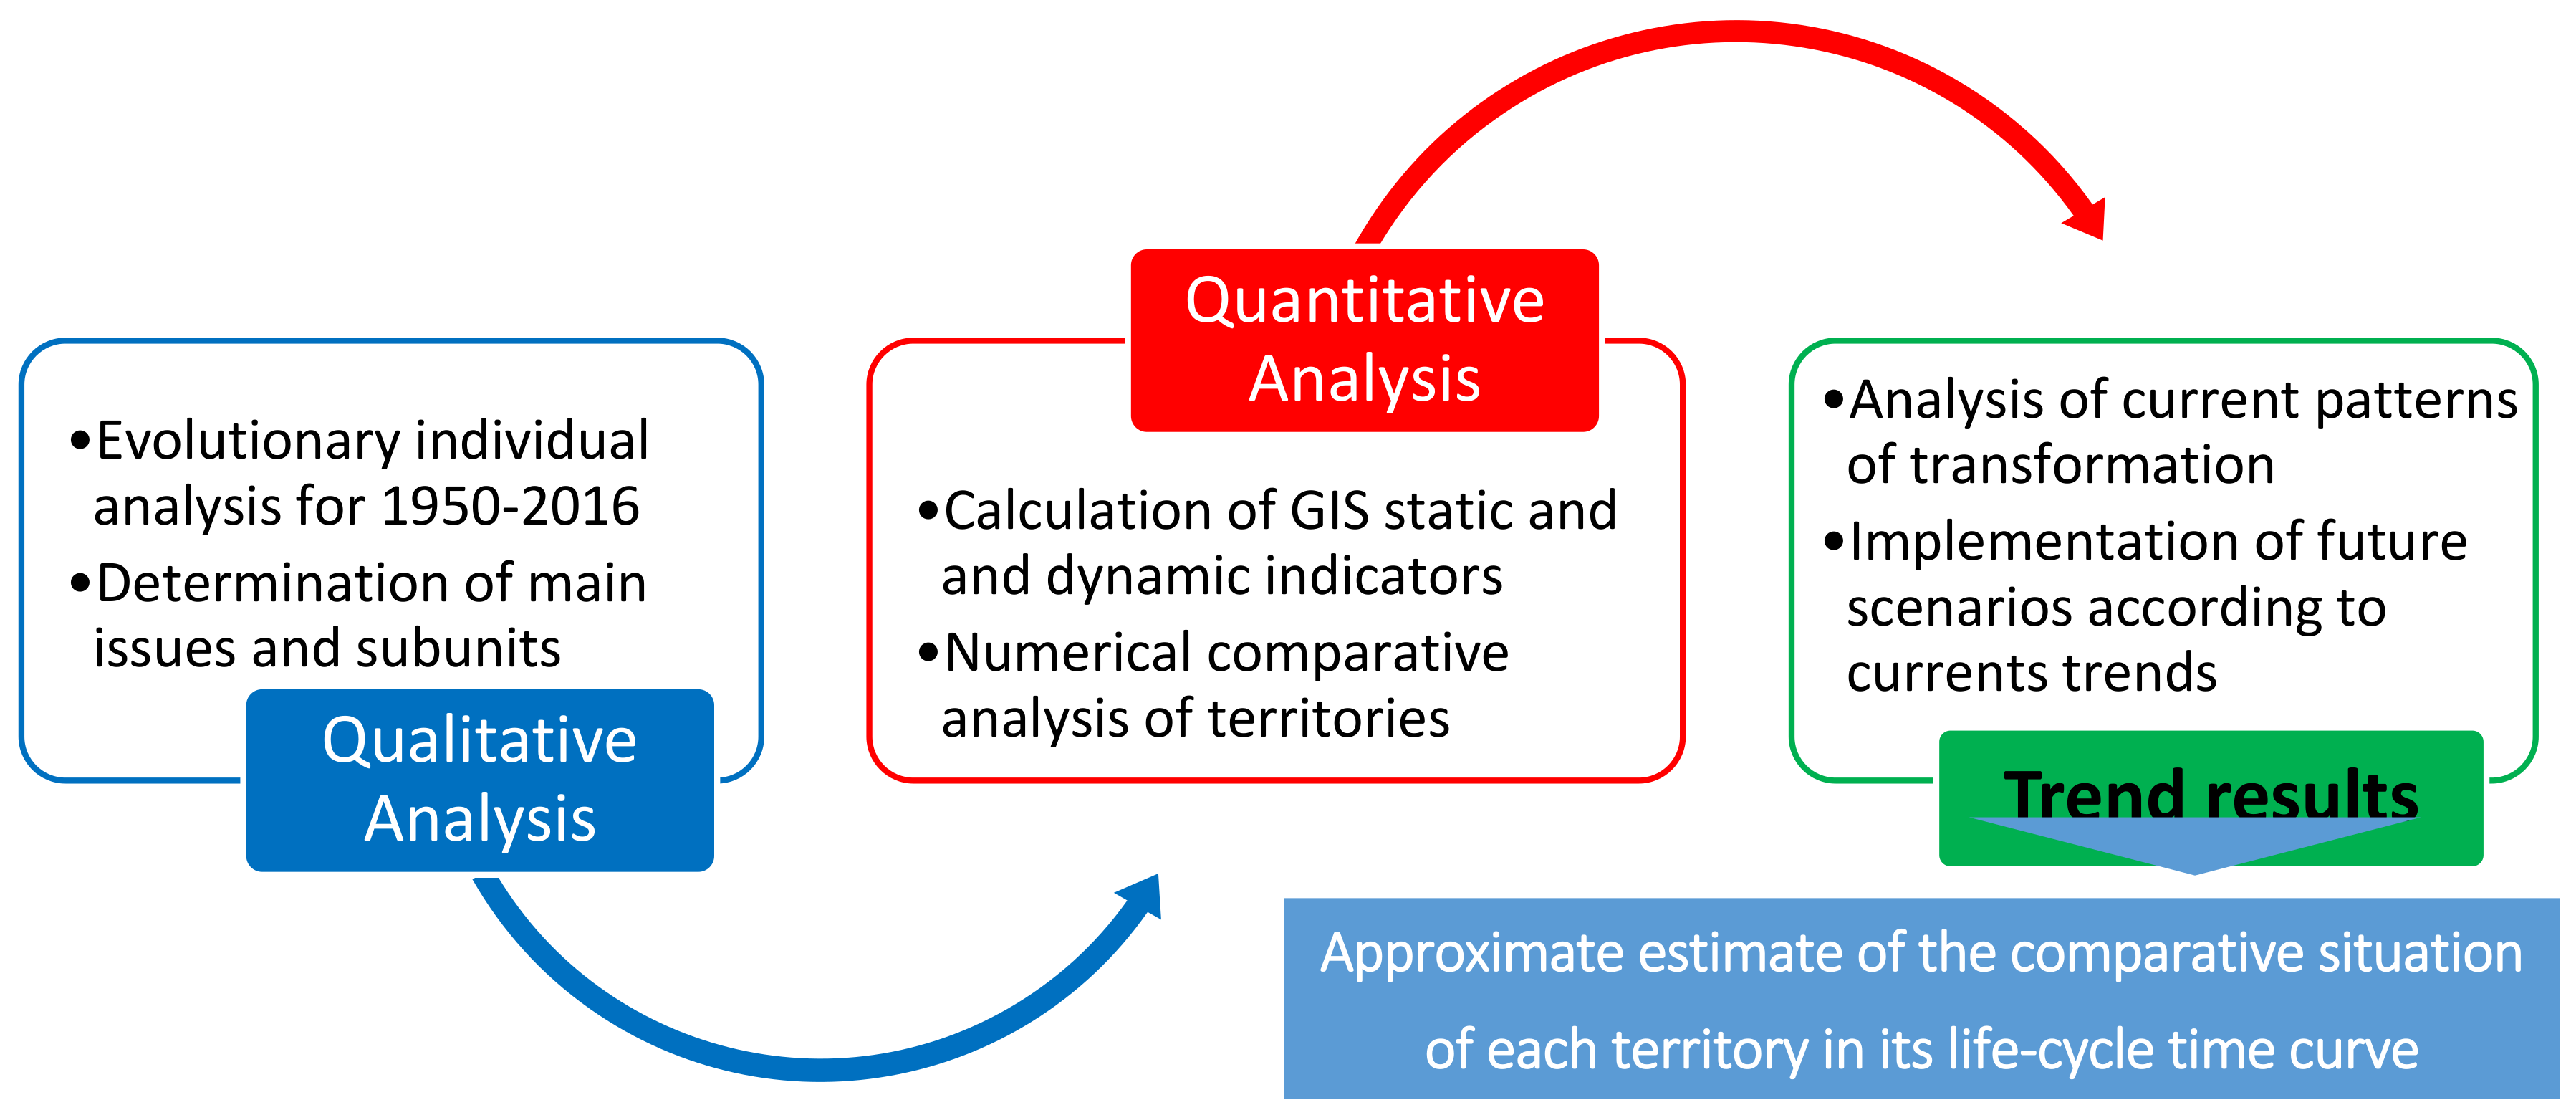
To undertake this, a two-phase work process will be developed on the periurban contours defined for each case study. First, a qualitative analysis of each of the three cases will be carried out based on global diagnoses on their evolution between 1950 and 2016. Here, the main issues and homogenous subunits to analyze each periurban territory will be determined. The subunits are defined according to Corine Land Cover criteria (artificial surfaces, agricultural areas, forest and semi-natural areas, wetlands and water bodies for level 1) from the European Environment Agency [18]. Due to the complex nature of mixed uses in these periurban areas, if the configuration of a subunit as a consequence of anthropization is excessively atomized, the existence of homogenous land cover corresponding to a category of level 2 (15 categories) of 80%, or alternatively, a homogeneous coverage of a level 3 category of 60% (44 items) was defined as a basic characteristic to establish an independent subunit. Second, a comparative numerical analysis based on land transformation indicators will allow us to objectively assess differences between the situation of each case and its trend evolution. This second phase will involve two types of dimensionless parameters in order to enable comparative evaluation. On the one hand, we will have a family of static indicators for the comparative assessment of the current situation of the three areas and to diagnose the issues associated with impacts on the periurban landscape of these transformations. On the other hand, a family of dynamic indicators will be used to generate trend results according to current transformation patterns. Finally, all these results will allow us to discuss the possible future scenarios for these territories and their approximate situation in a hypothetical life-cycle time curve (Figure 2).
2.1. Static Indicators: Current Territory Transformations
The first family of indicators aims to diagnose the current situation of the three cases studied. These elements globally evaluate phenomena such as the transformation of the periurban space into low-quality urban sprawl structures, the fragmentation of the landscape and the incidence of the transformation of natural soils or traditional agriculture areas into spaces dedicated to intensive agriculture. The dimensionless character of these parameters will allow a numerical and objective comparative analysis between the different cases. The indicators of this first family are:
2.1.1. Land “Artificialization” Rate (LAR)
The loss of natural landscapes is a clear example of transformation phenomena [24,25]. In this sense, this global index seeks to highlight transformation processes in periurban areas associated to human actions (urbanization, recent transformation of natural spaces into lands for cultivation, transformation of historical crops into irrigated or greenhouse crops, etc.). Those existing in the territory before 1950 have been considered as historical traditional crops. In essence this is an approximation to a natural landscape indicator of global transformation.
Calculation Method: evaluation of land use changes according to European Inspire Directive criteria [26] in the reference area; the higher the index value the more “artificialized” the periurban area is.
- Sn = Land use changed in a permanent way from 1950 until now (m2)
- Str = territorial surface in reference (m2)
2.1.2. Indicator of Infrastructural Anthropization (IFA)
One of the characteristics of anthropization in periurban areas is the development of fragmented configurations through linear elements that “unstructure” the landscape or directly fracture its homogeneity [27]. In that context, the increase in the density of construction of paths, urban roads or motorways is a clear indicator of atomization phenomena of the parcel structure at agricultural level and the generation of unbalanced urban sprawl in metropolitan environments.
Calculation Method: evaluation of the fragmentation of the territory through the density of paths and urban roads per square meter; the higher the index value the more important and unsustainable the fragmentation is.
- Li = length of agricultural paths, streets, urban roads and motorways (m)
- Str = territorial surface in reference (m2)
2.1.3. Indicator of Urban Fragmentation (UFI)
Poor quality of the periurban landscape is usually associated with mixed areas with dysfunctional plots where urban sprawl grows anarchically [28]. This type of growth is usually linked to a high degree of fragmentation of urban development, deteriorating the rural environments or agricultural spaces of transition to the urban areas. Therefore, certain links can be established between the behavior of this parameter and the existence of unbalanced urban sprawl patterns in a territory.
Calculation Method: fragmentation due to the increase of built-up areas. Evaluation of the fragmentation of territory within urbanized areas, which creates a barrier; the higher the percentage of the index the more important the fragmentation is.
- Li = maximum dimension of urban boundary (m), Ltr = dimension of reference boundary (m)
- Sui = Urbanized territory (m2)
- Str = territorial surface in reference (m2)
2.2. Dynamic Indicators: Landscape Trends towards Future Scenarios
The second family of indicators seeks to analyze the patterns of transformation of the periurban space over time by establishing trend behaviors. These patterns will allow us to propose possible future scenarios for each of the three cases, based on the trend analysis of dynamic indicators. For the development of analyses based on GIS transformations of the past and the establishment of future diagnoses based on trend behaviors of territorial transformation, retro-diagnosis criteria will be used [29]. Dynamic indicators will analyze, from 1950 to the present, the compactness of the global periurban area, the phenomena of transformation of the agricultural land, the incorporation of new low density urban nuclei to the periurban space and the speed of growth of existing urban surfaces. The indicators of this second family are:
2.2.1. Index of Landscape Compactness (LCI)
One of the characteristic features of deteriorated periurban areas is the loss of homogeneity of its landscape units [22]. Agricultural environments sometimes have a tendency for plot atomization as a result of the loss of traditional land uses or the increase in urban sprawl, creating mixed landscapes of poor value. This is reflected on a large scale by perforated surfaces like a “Swiss cheese” with a low index of perimeter compactness. On the other hand, in agricultural environments with a low urban impact, the increase in this index of perimeter homogeneity is usually caused by the substitution of medium traditional crops for large homogeneous areas of intensive agriculture or greenhouses.
Calculation Method: the relationship between the perimeter of the different homogenous land uses and the surface of this area to the circle which has the same surface area as the urban area in consideration. The closer the parameter is to 1, the more compact and homogeneous the global landscape is understood.
- af = perimeter of a homogeneous subunit i of landscape
- Pi = perimeter in reference of the global periurban area i
2.2.2. Urban Sprawl Velocity
One of the main factors of alteration or disappearance of periurban areas close to urban settlements is often the regular dispersed growth of cities [7,9]. However, this phenomenon is neither homogenous nor uniform over time. This index of annual sprawl rate allows us to assess the “velocity of growth” of a city. This field of study is of particular interest in terms of analyzing the relationship, which exists between the intensity of land consumption of buildable territory in the periurban plot and the existing issues of this territory. A phenomenon to be studied in detail may be the extent to which the existence of a high growth rate may imply new unbalanced or unstructured periurban configurations that cause the loss of landscape values of the area, or even the total loss of its identity.
Calculation Method: annual territory consumption expressed in % of consumed territory over a specific period. This calculation requires the measurement of used territory from two different dates for the annual variation to be calculated.
Ti = 100 × [(C2 − C1)/(a × C1)]
- Ti = Average annual rate in the increase of territory consumption (%)
- Ci: value/measurement of urban sprawl consumed territory on the date i
- a: adjustment factor for unequal periods of time (for annual intervals a = 1).
2.2.3. Index of Contribution to New Low Density Urban Cores (ICNUC)
The development of isolated residential urbanizations or low density dispersed urban nuclei in periurban environments is usually one of the first symptoms of urban anthropization and loss of the landscape values of these territories [30]. In this sense, the existence of houses and buildings on not urbanized areas helps to identify this process of unstructured land transformation. The definition of not urbanized areas according to Yue et al. [31] corresponds to those essentially agricultural zones or natural spaces where the density of buildings is reduced, but not low enough to assimilate it to the traditional or historical agricultural uses of the area.
Calculation Method: surface of new low density urban cores developed (outside consolidated or dense development areas and zones in transition connected to them) in relation to the total surface of regular urban sprawl processes in a given period.
ICNUC = Is/Cs
- Is = dispersed building: low density and isolated urban sprawl configuring dispersed urban nuclei (Ha)
- Cs = consumed territory by regular urban sprawl processes of existing settlements (Ha)
2.2.4. Index of Agricultural Transformation (IAT)
Lastly, we have the intrinsic transformations of the periurban areas associated with changes in agricultural land use. These are not usually significant large-scale alterations or affecting the global identity of a territory, but they do involve distortions in the landscape as a consequence of their loss of homogeneity or of some natural values. These changes are evaluated by comparison of two different years for sufficiently significant areas (agricultural crops of 1 Ha have been taken as minimum units of evaluation). Crops are identified using criteria based on Van Vliet et al. [32]. To ensure that these are structural alterations of the landscape, the changes must be permanent and not situational, so annual milestones have been taken at least every 10 years.
Calculation Method: Natural areas or permanent crops transformed into arable land and non-irrigated crops transformed into irrigated crops in comparison to global agricultural periurban areas for a year i.
- ni = Natural areas transformed into arable land or permanent crops for a year i [Ha].
- ai = non-irrigated crops transformed into irrigated ones for a year i [Ha].
- Pi = global agricultural periurban areas for a year i in the reference area of study [Ha].
3. Results
3.1. Analysis of the Three Case Studies
3.1.1. The Huerta de Murcia Área
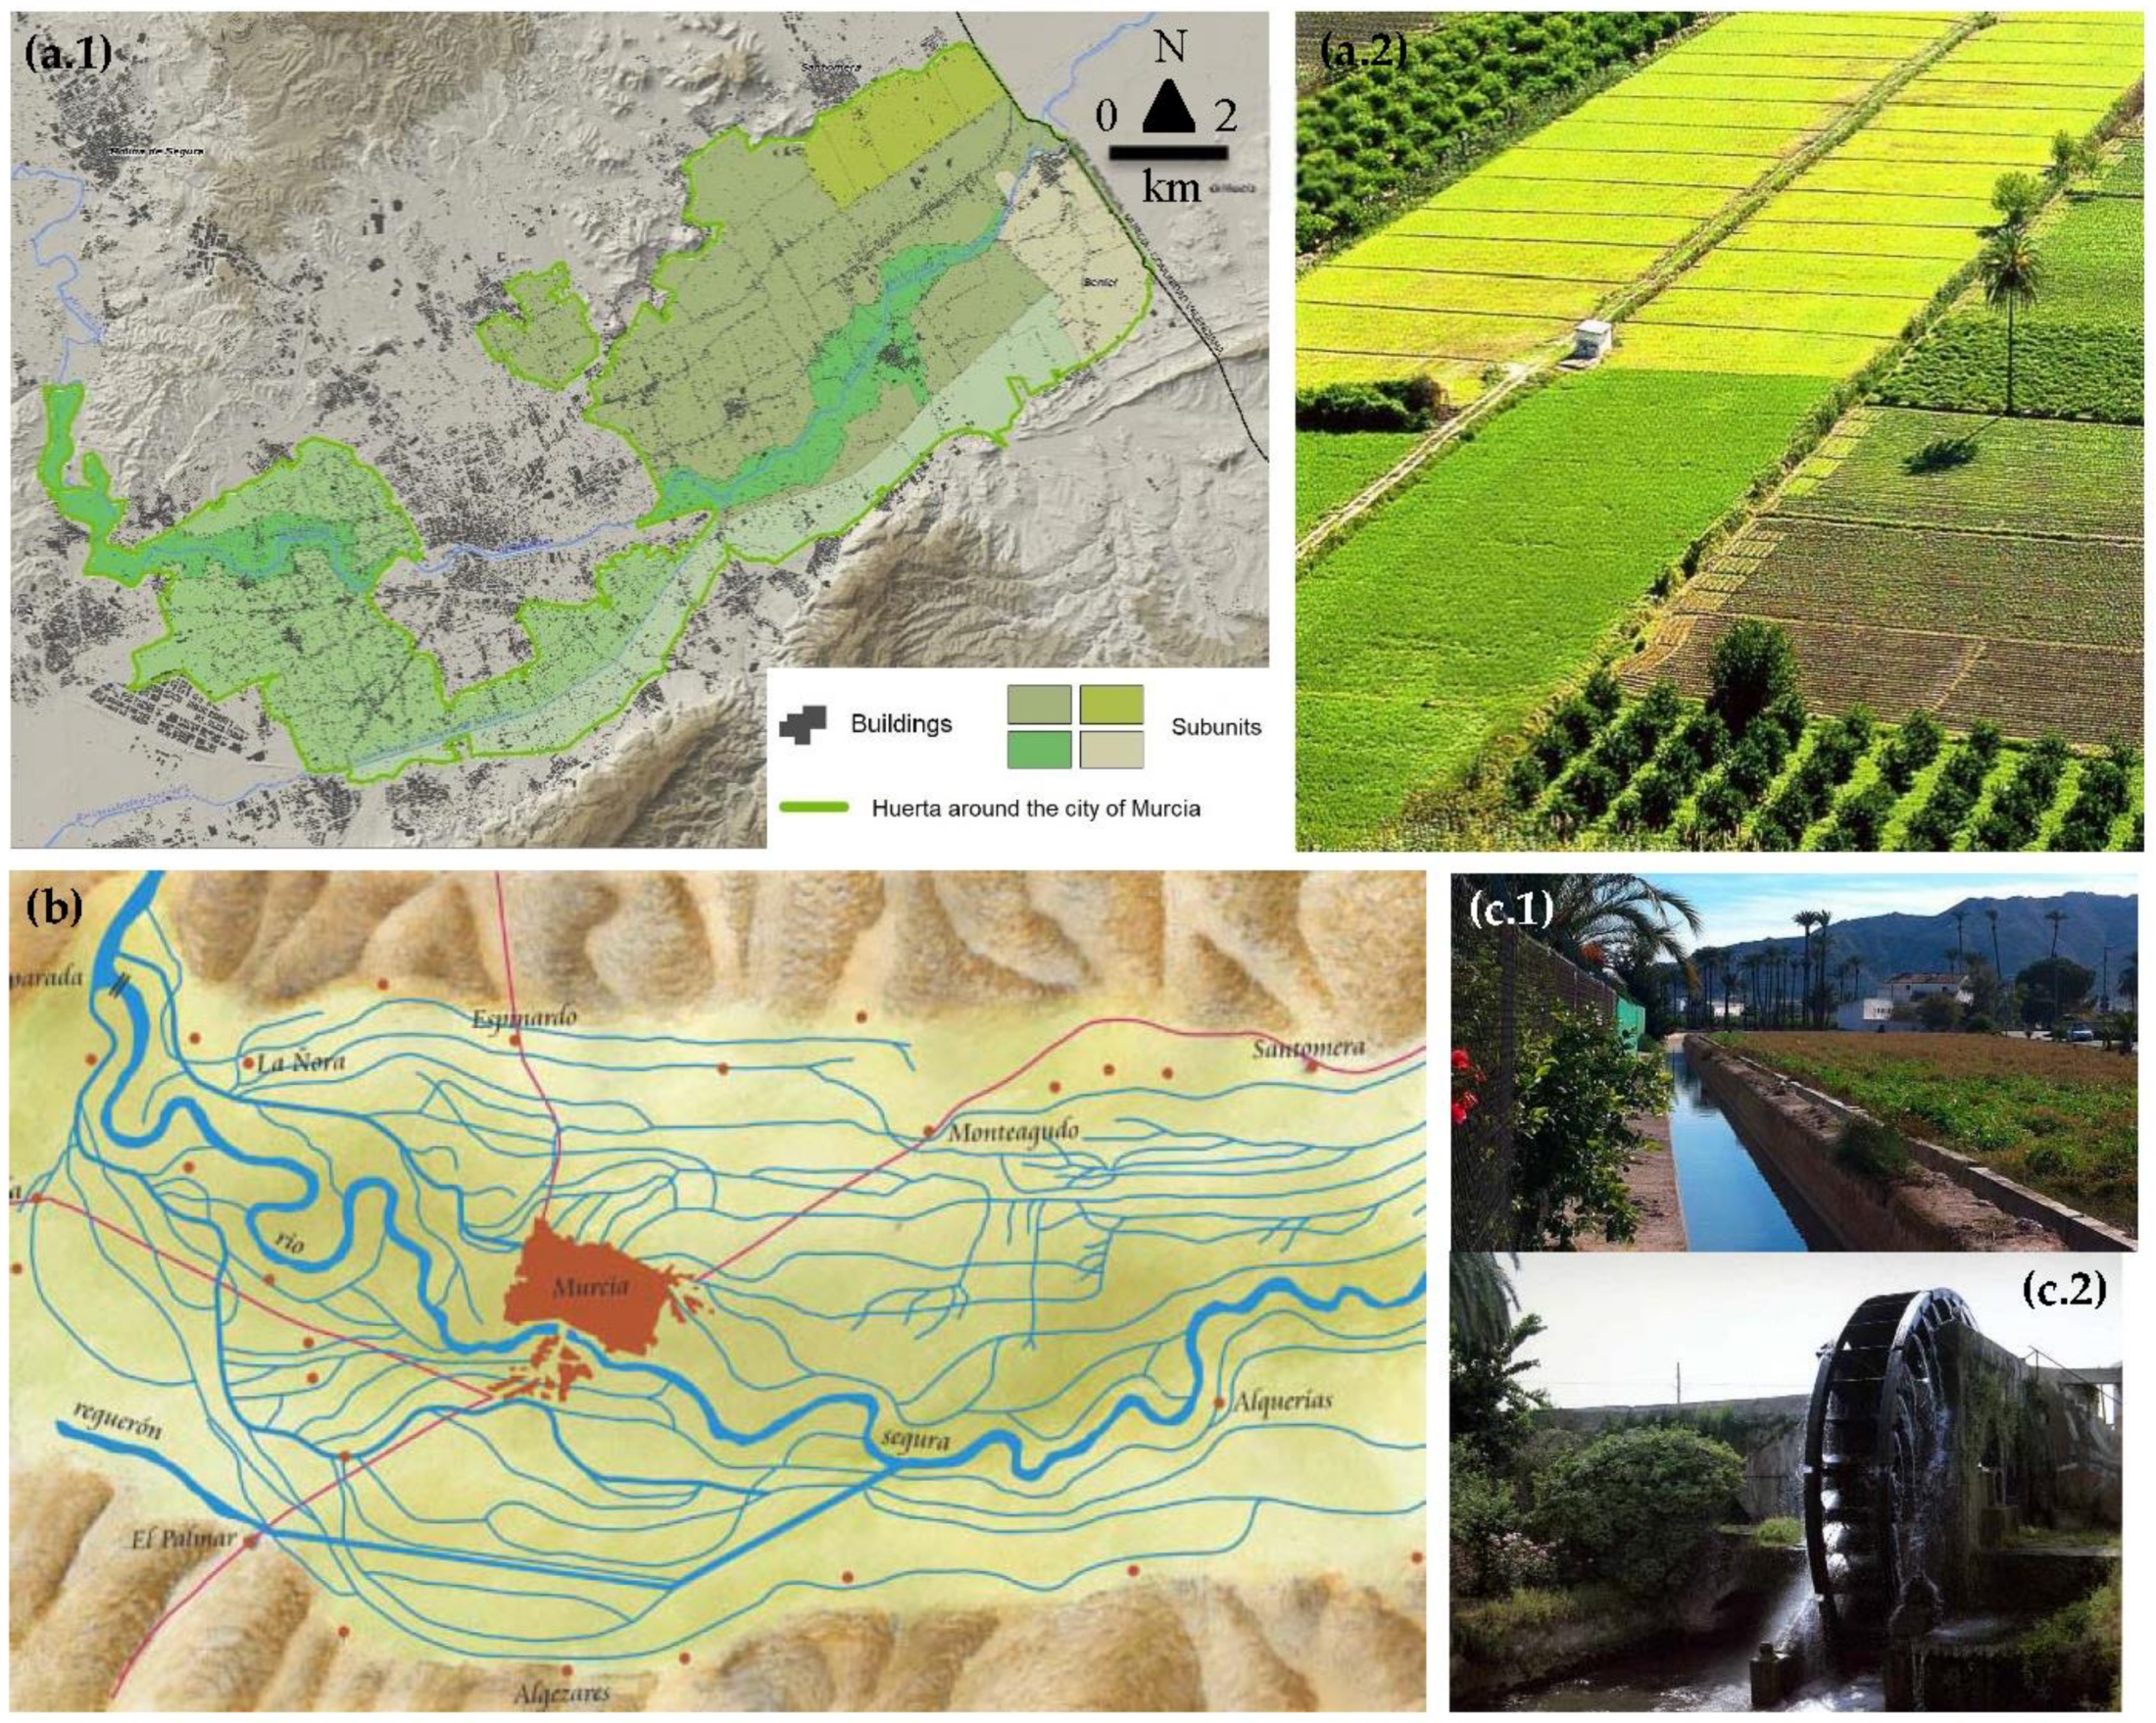
The Huerta de Murcia is a natural 36,000 Ha area with several small satellite urban settlements of 5000–30,000 inhabitants around the city of Murcia (500,000 inhabitants). This main city is crossed by the Segura River, which irrigates the whole farming area all the way to its mouth in the Mediterranean Sea. During the five centuries of the Muslim occupation of the area in the Middle Ages a complex network of traditional agricultural irrigation was developed and remained in the following centuries, creating great agricultural wealth in the area [33]. This advanced hydraulic infrastructure was composed of a hierarchical network of channels or ditches that distributed the river flows throughout the territory with the help of engineering elements such as small weirs and waterwheels. This whole set of great scenic beauty has survived to the present day in a periurban environment that combines urban and agricultural land uses (Figure 3).
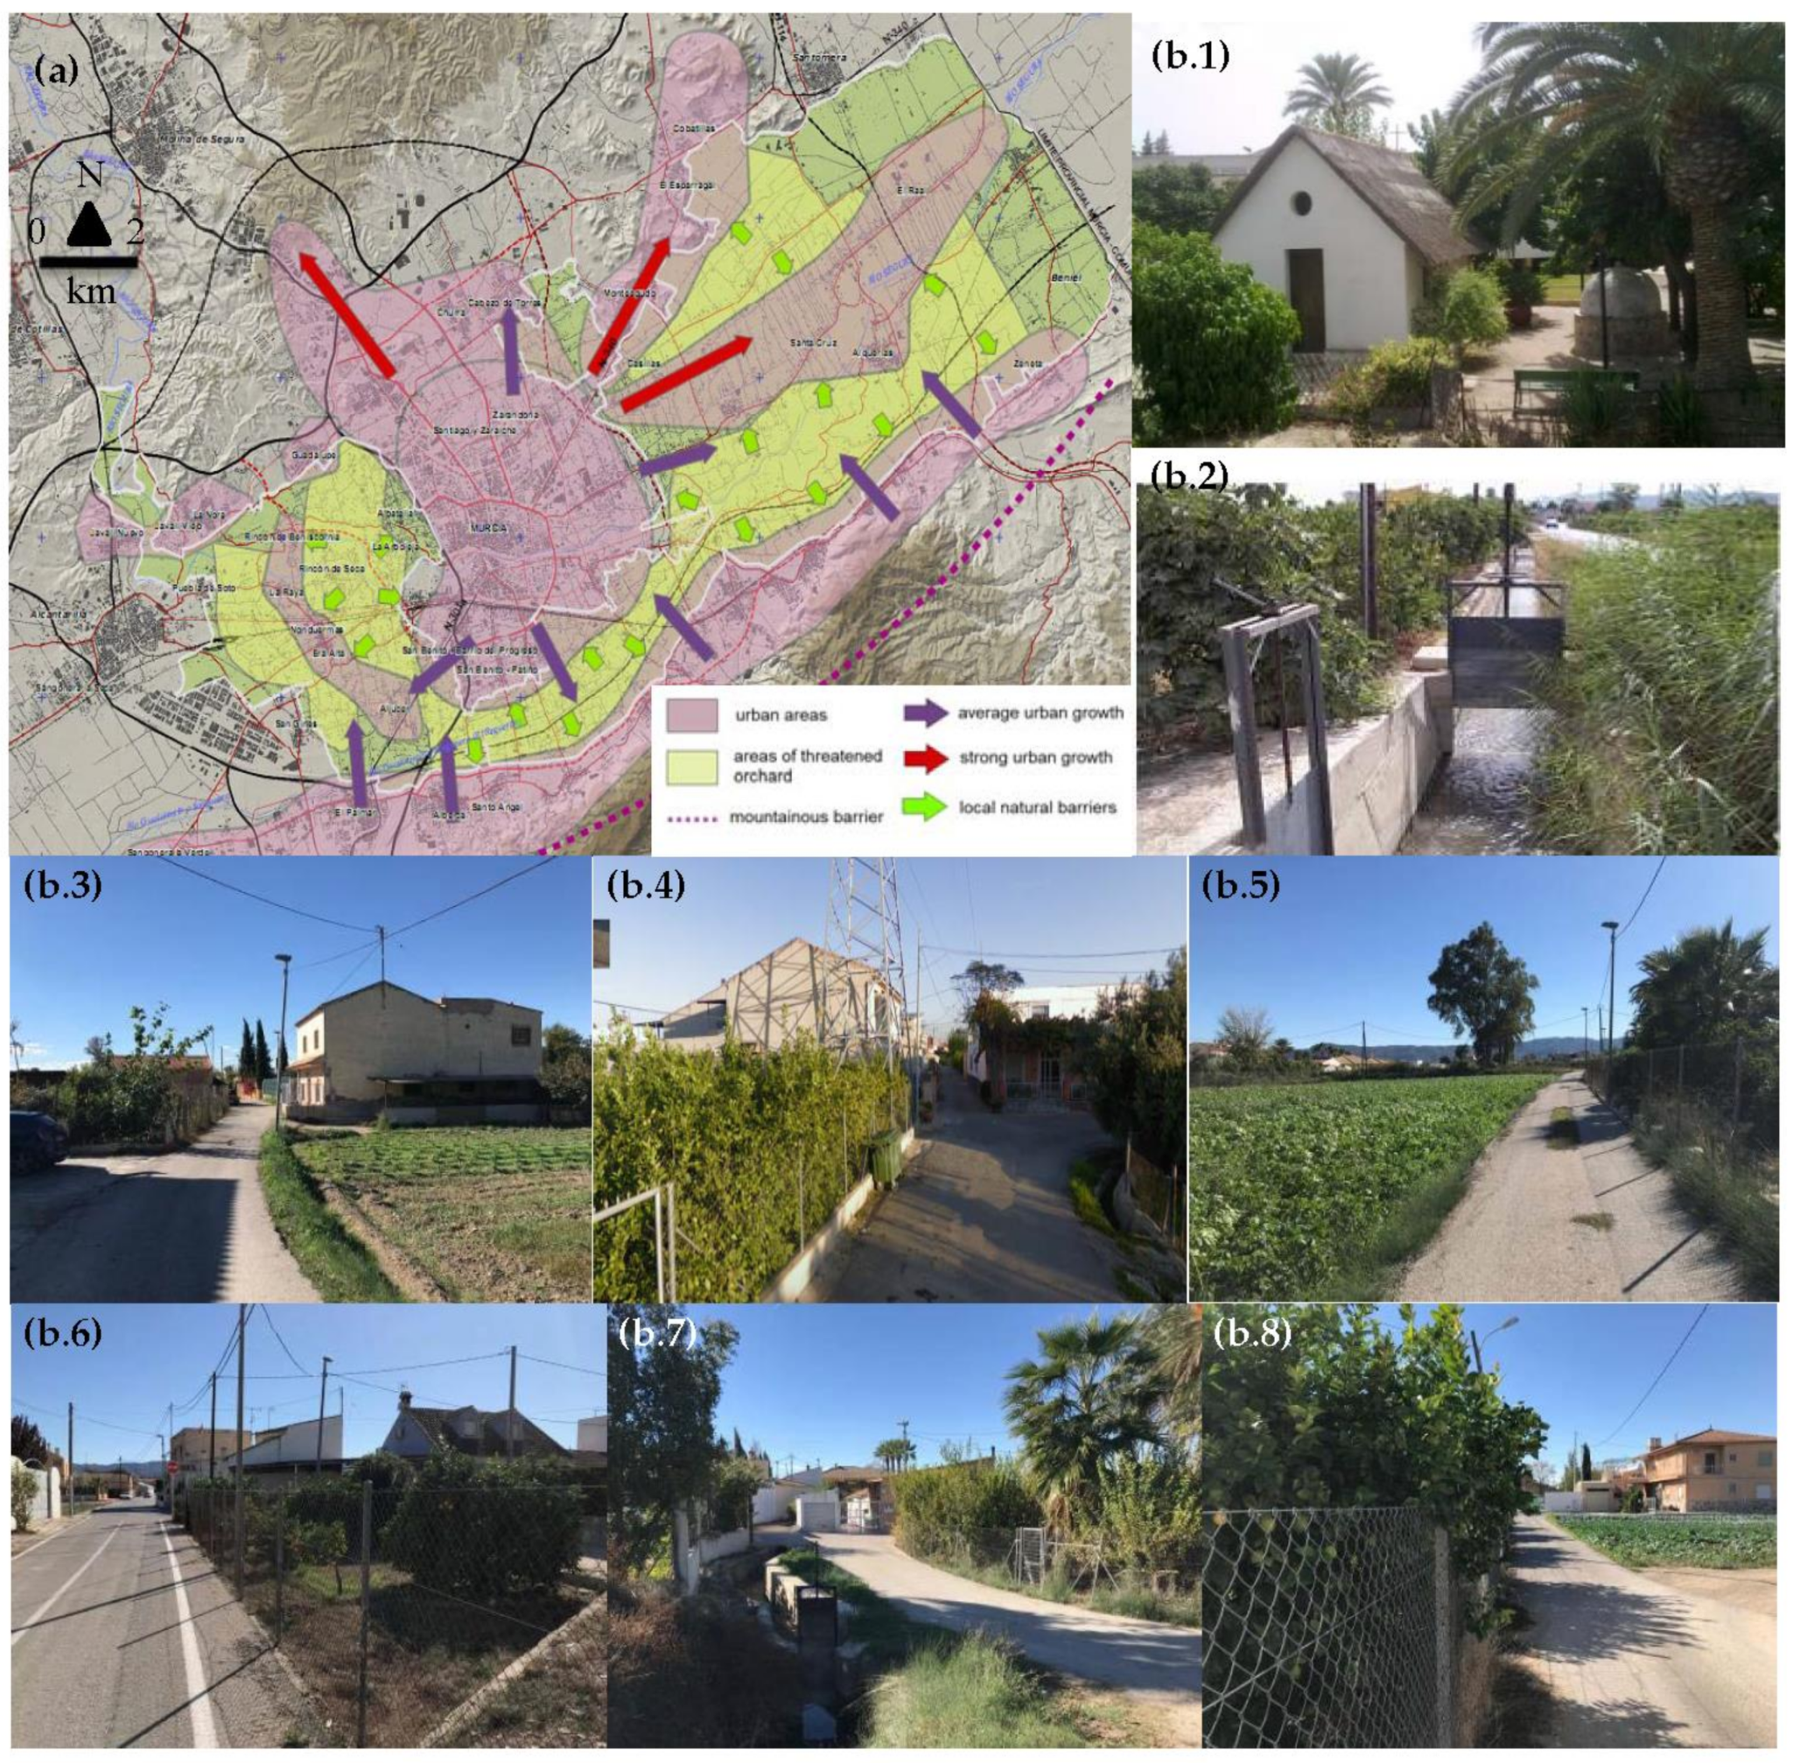
This configuration led to the area being called the “orchard of Europe” from the 20th century because of its great potential for the generation of horticultural products. Nevertheless, the gradual process of transformation that its territory has undergone in recent decades, has actually put this strong agricultural activity into decline [34]. Phenomena such as the urban pressure derived from a model of dispersed growth in the city and the continuous subdivision of the farms, atomizing the size of the agricultural plots, have contributed to diminishing the profitability of agriculture in the territory. This context seems to have partially involved the transfer of agricultural activities to other areas of the nearby Mediterranean basin, but it is also behind the loss of many of the landscape values of the area, which seem an interesting indicator to assess that transformation process. In this sense, as a consequence of the city pressure, different trend phenomena of landscape anthropization are observed such as the pipelining of traditional ditches; the densification and widening of a labyrinth-like pathway; the gradual asphalting of these rural paths; or the appearance in the periurban landscape of urban elements such as houses not adapted to the environment, fences or aerial electric infrastructures that indicate a progressive distortion of the existing status quo (Figure 4).
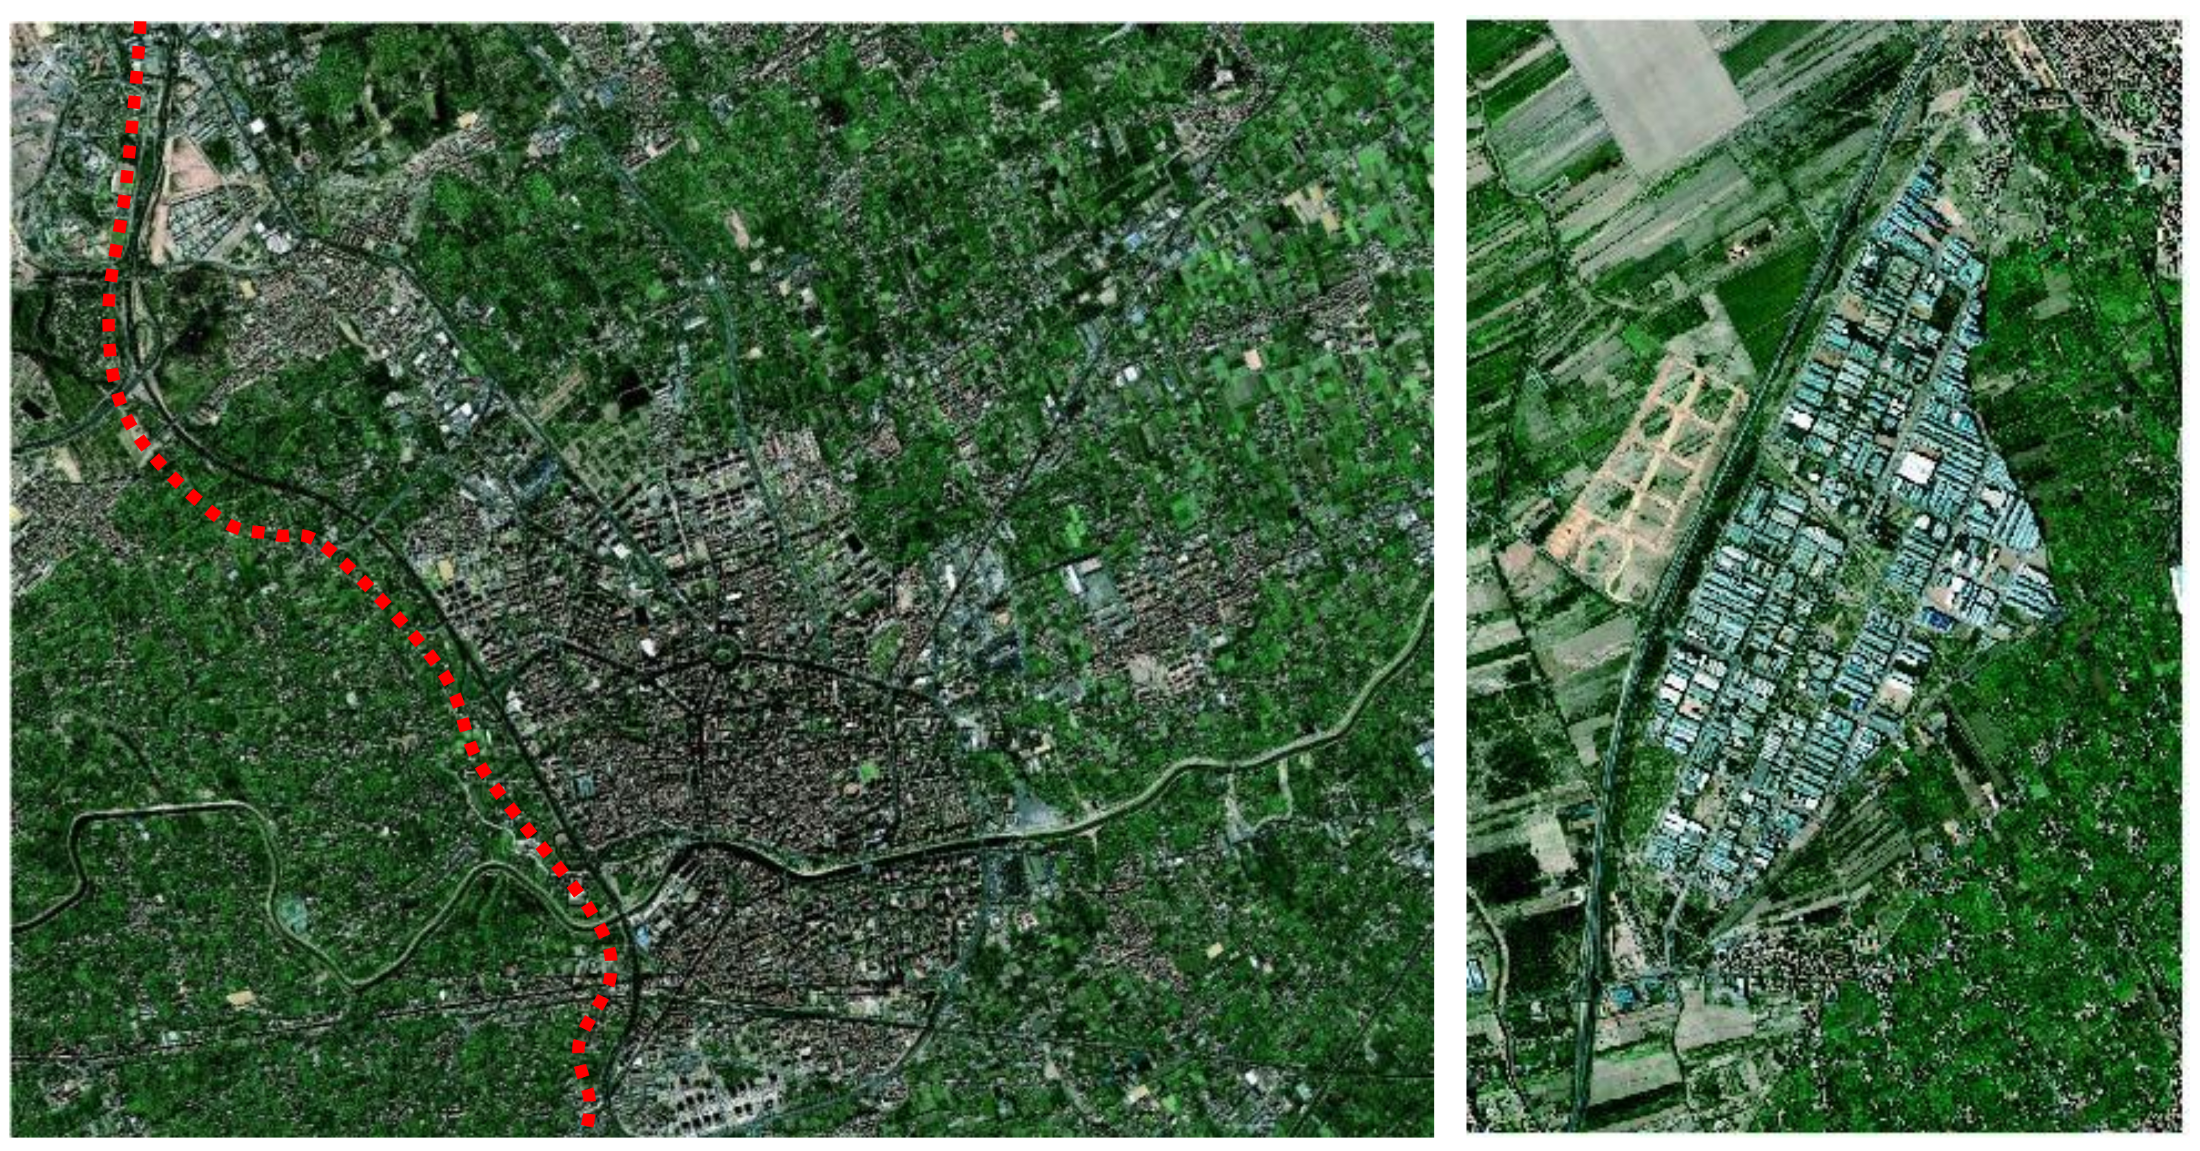
Another interesting phenomenon is the role played by large communication infrastructures (north-south axis for the A-30 motorway and east-west axis for the railroad for example) in the transformation of the periurban landscape. In this sense these elements constitute a “double-edged sword”. In some cases, their strong linear character and transversal separator can constitute a certain barrier effect, constituting a “containment dam” for urban growth and protecting the periurban orchard area from large-scale transformation. However, these same infrastructures can serve as an incentive to the transformation of nearby land as they are also facilitators of economic activity in the territories they communicate (Figure 5).
To diagnose and quantitatively evaluate this whole phenomenon of territorial transformation the historical evolution of the area between 1950 and 2016 has been retrospectively analyzed through cartography and geographic information systems. From the analysis of aggregate global numbers, we can appreciate an important urbanization process in the area that reaches its climax in the 1980s and 1990s as a result of the city’s population increase (Table 1). It is also observed that this increase associated with urban growth is proportionally greater than in the rest of the Region, which remains still but to a lesser extent.
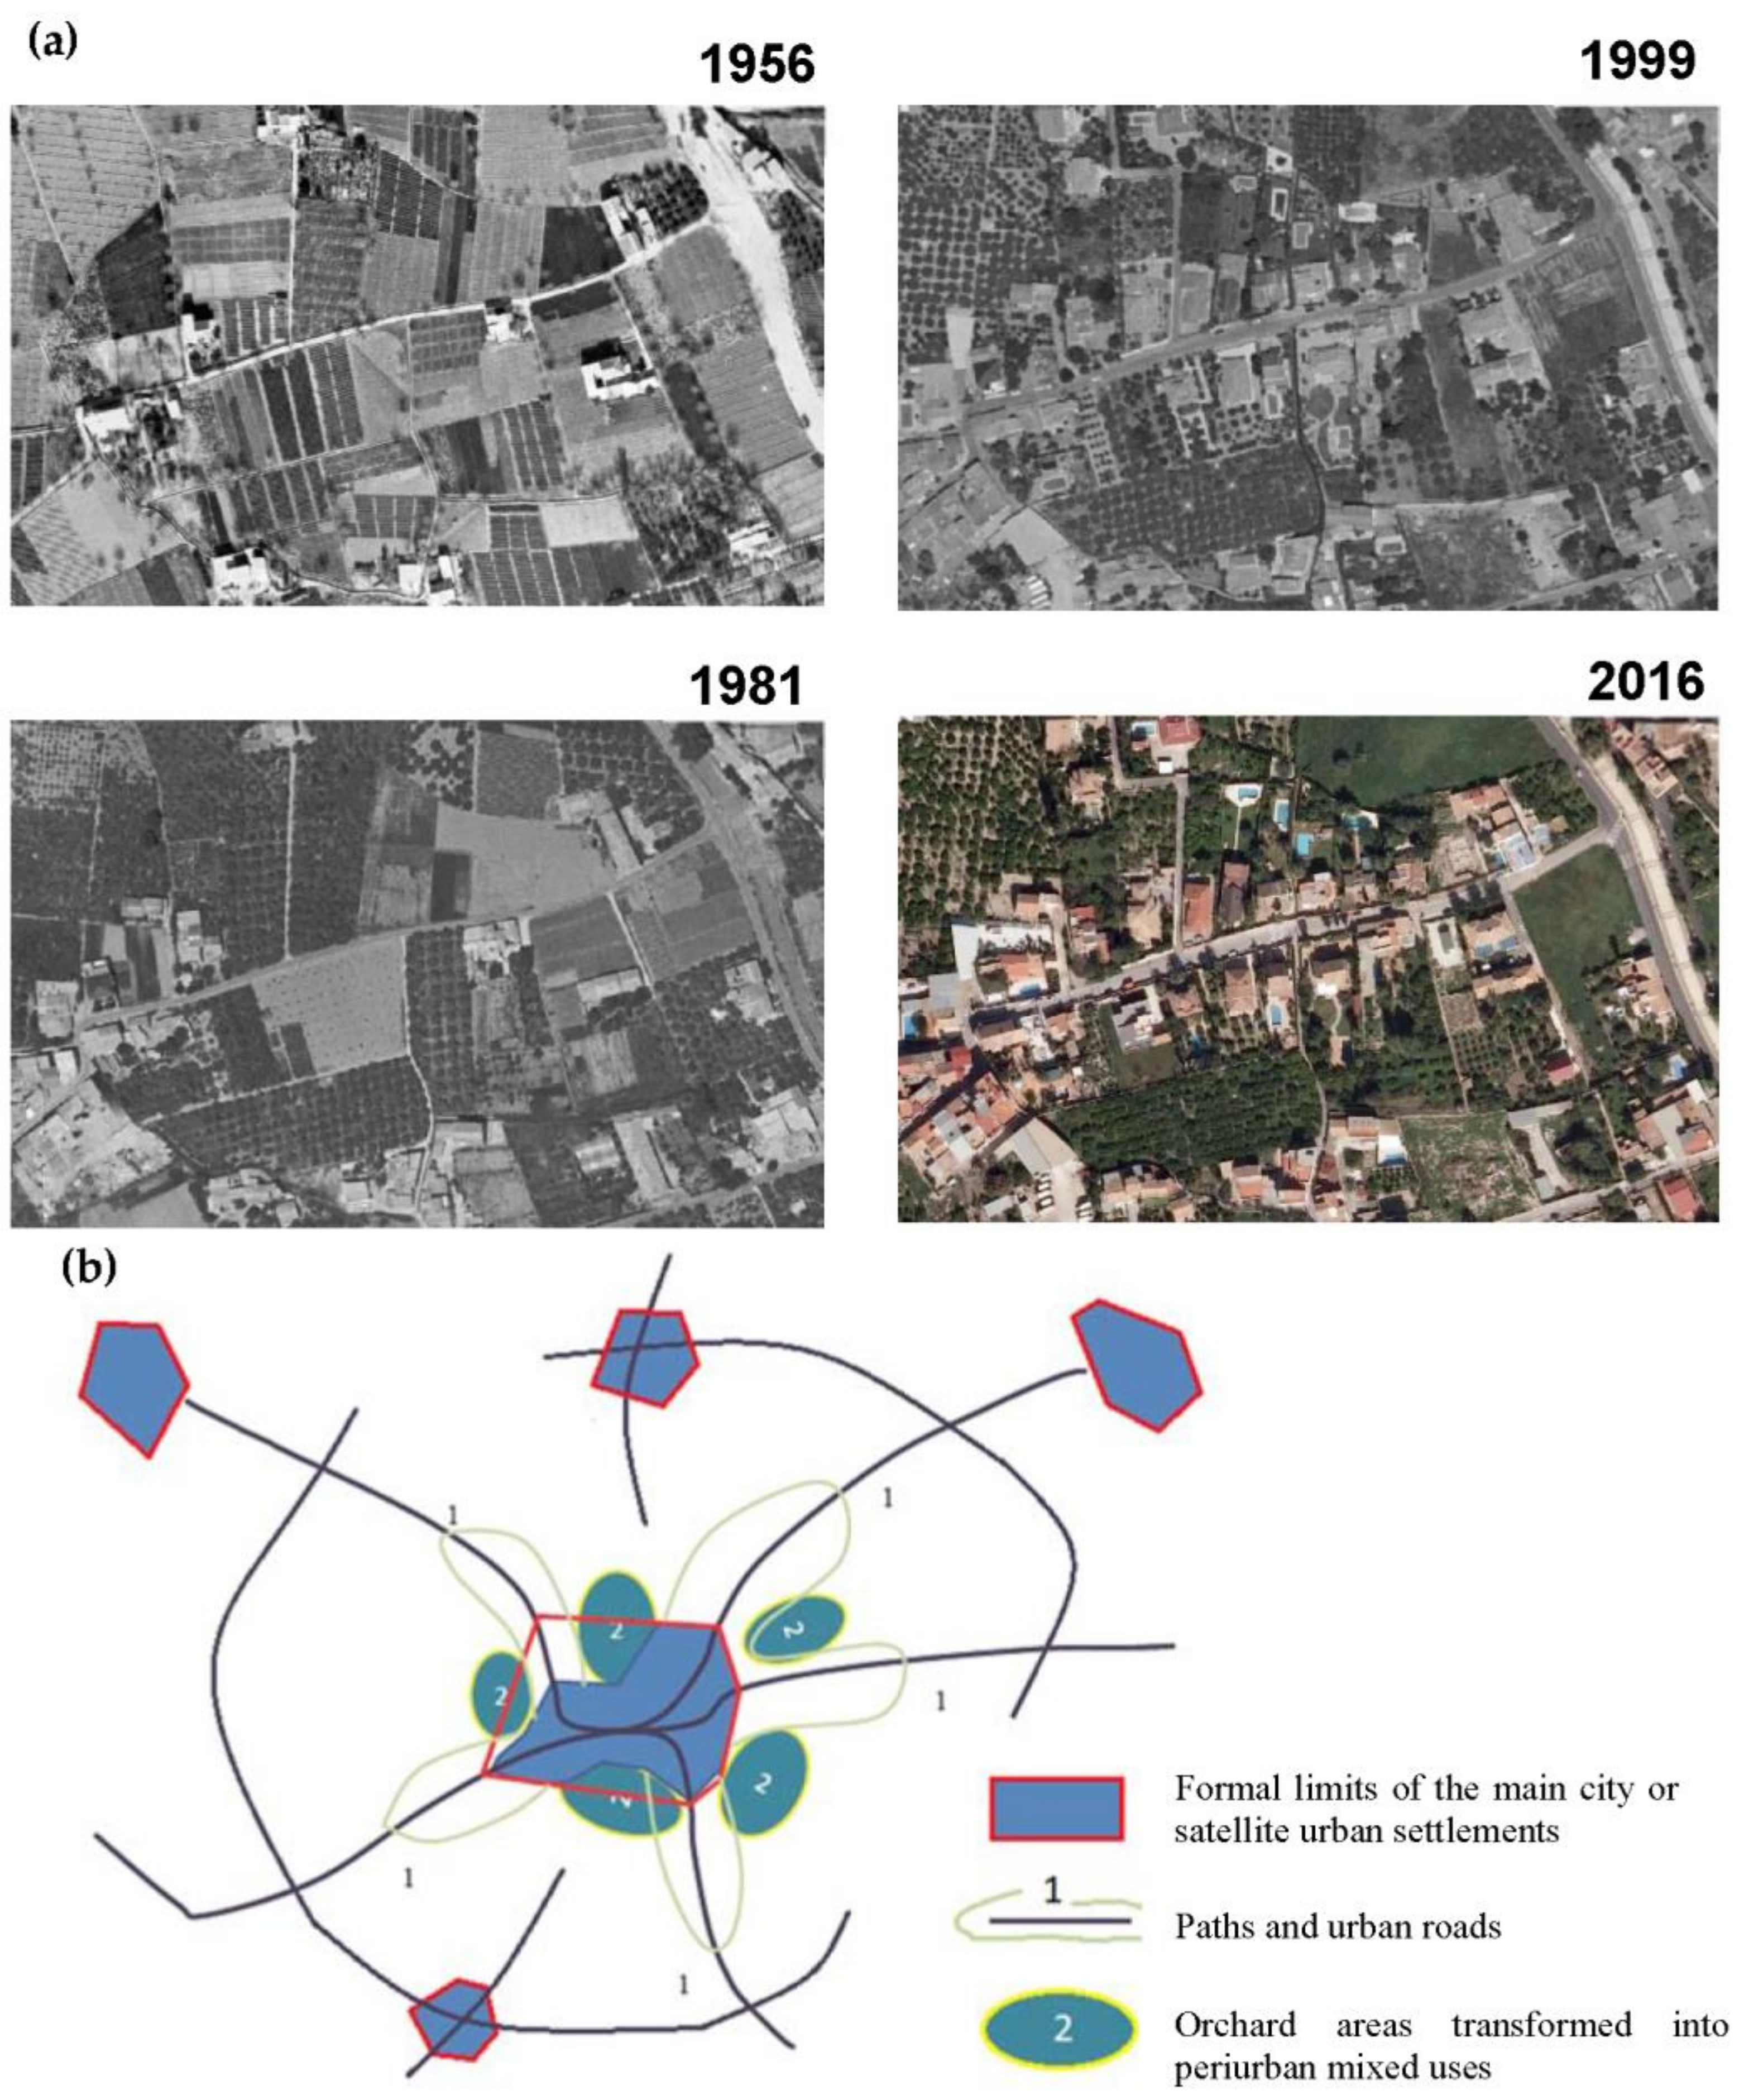
If we lower the scale of analysis, from the simple evolutionary observation of the transformation process through the georeferenced tools, we can qualitatively see that the evolution is not an anarchic phenomenon but has different growth vectors associated to a model that we have called development in “structured oil stain”. This vector structure can be classified as a regular growth pattern linked to variables such as land use change derived from the gradual creation of paths and minor urban roads (Figure 6). Moreover, the absence of a homogeneous process is hinted at through the different GIS tools. In fact, differentiated patterns are appreciated between the East and West areas of the Huerta as a consequence of urban city trends and the barrier effect of the A-30 highway infrastructure. To quantify all these patterns objectively and to enable a comparative assessment with the other two cases, the study area has been analyzed through the non-dimensional indicators of the methodology section, comparing the results.
3.1.2. El Ejido—Campo Dalias Area
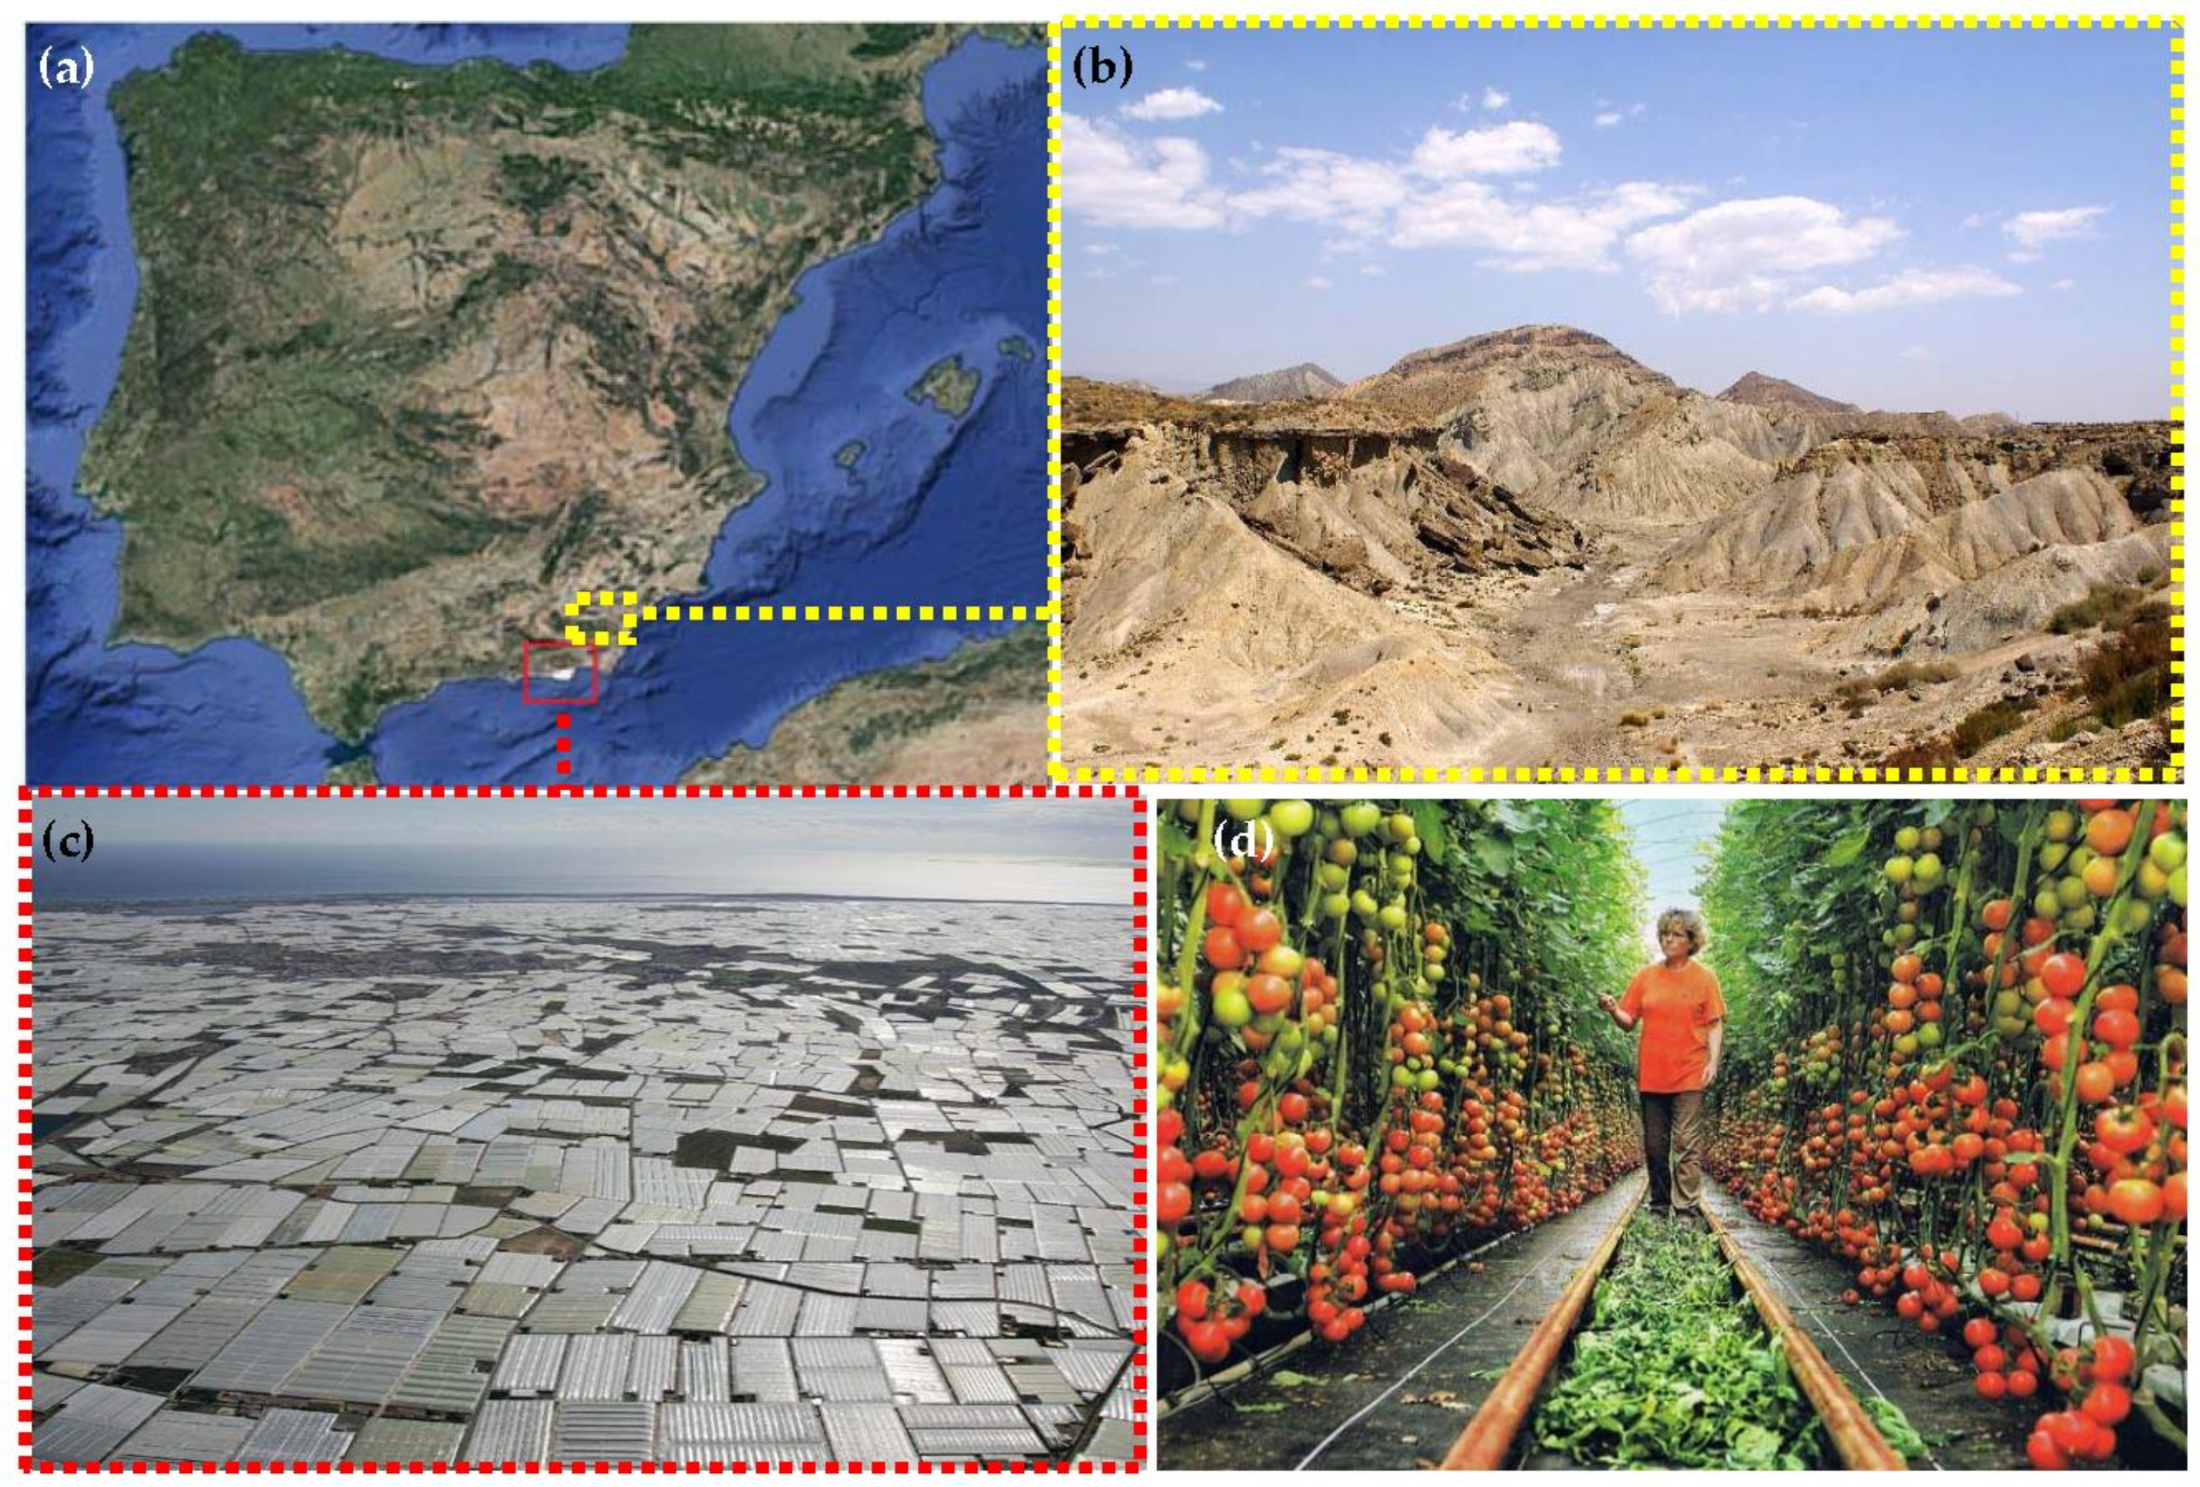
The area around El Ejido, in the Spanish region of Andalusia, similar to the previous case is a semi-arid zone of Mediterranean climate characterized by its low rainfall (300 mm/year) and nearby desert landscapes. Nevertheless, this area known as Campo de Dalias, despite being in a territory with a high risk of increasing desertification due to its proximity to the Sahara Desert [35], has become the main agricultural production hub of Europe in recent decades [36]. This context offering stark contrasts currently configures the so-called “Plastic Sea” landscape formed by thousands of greenhouses with agricultural products, which can even be observed from outer space (Figure 7).
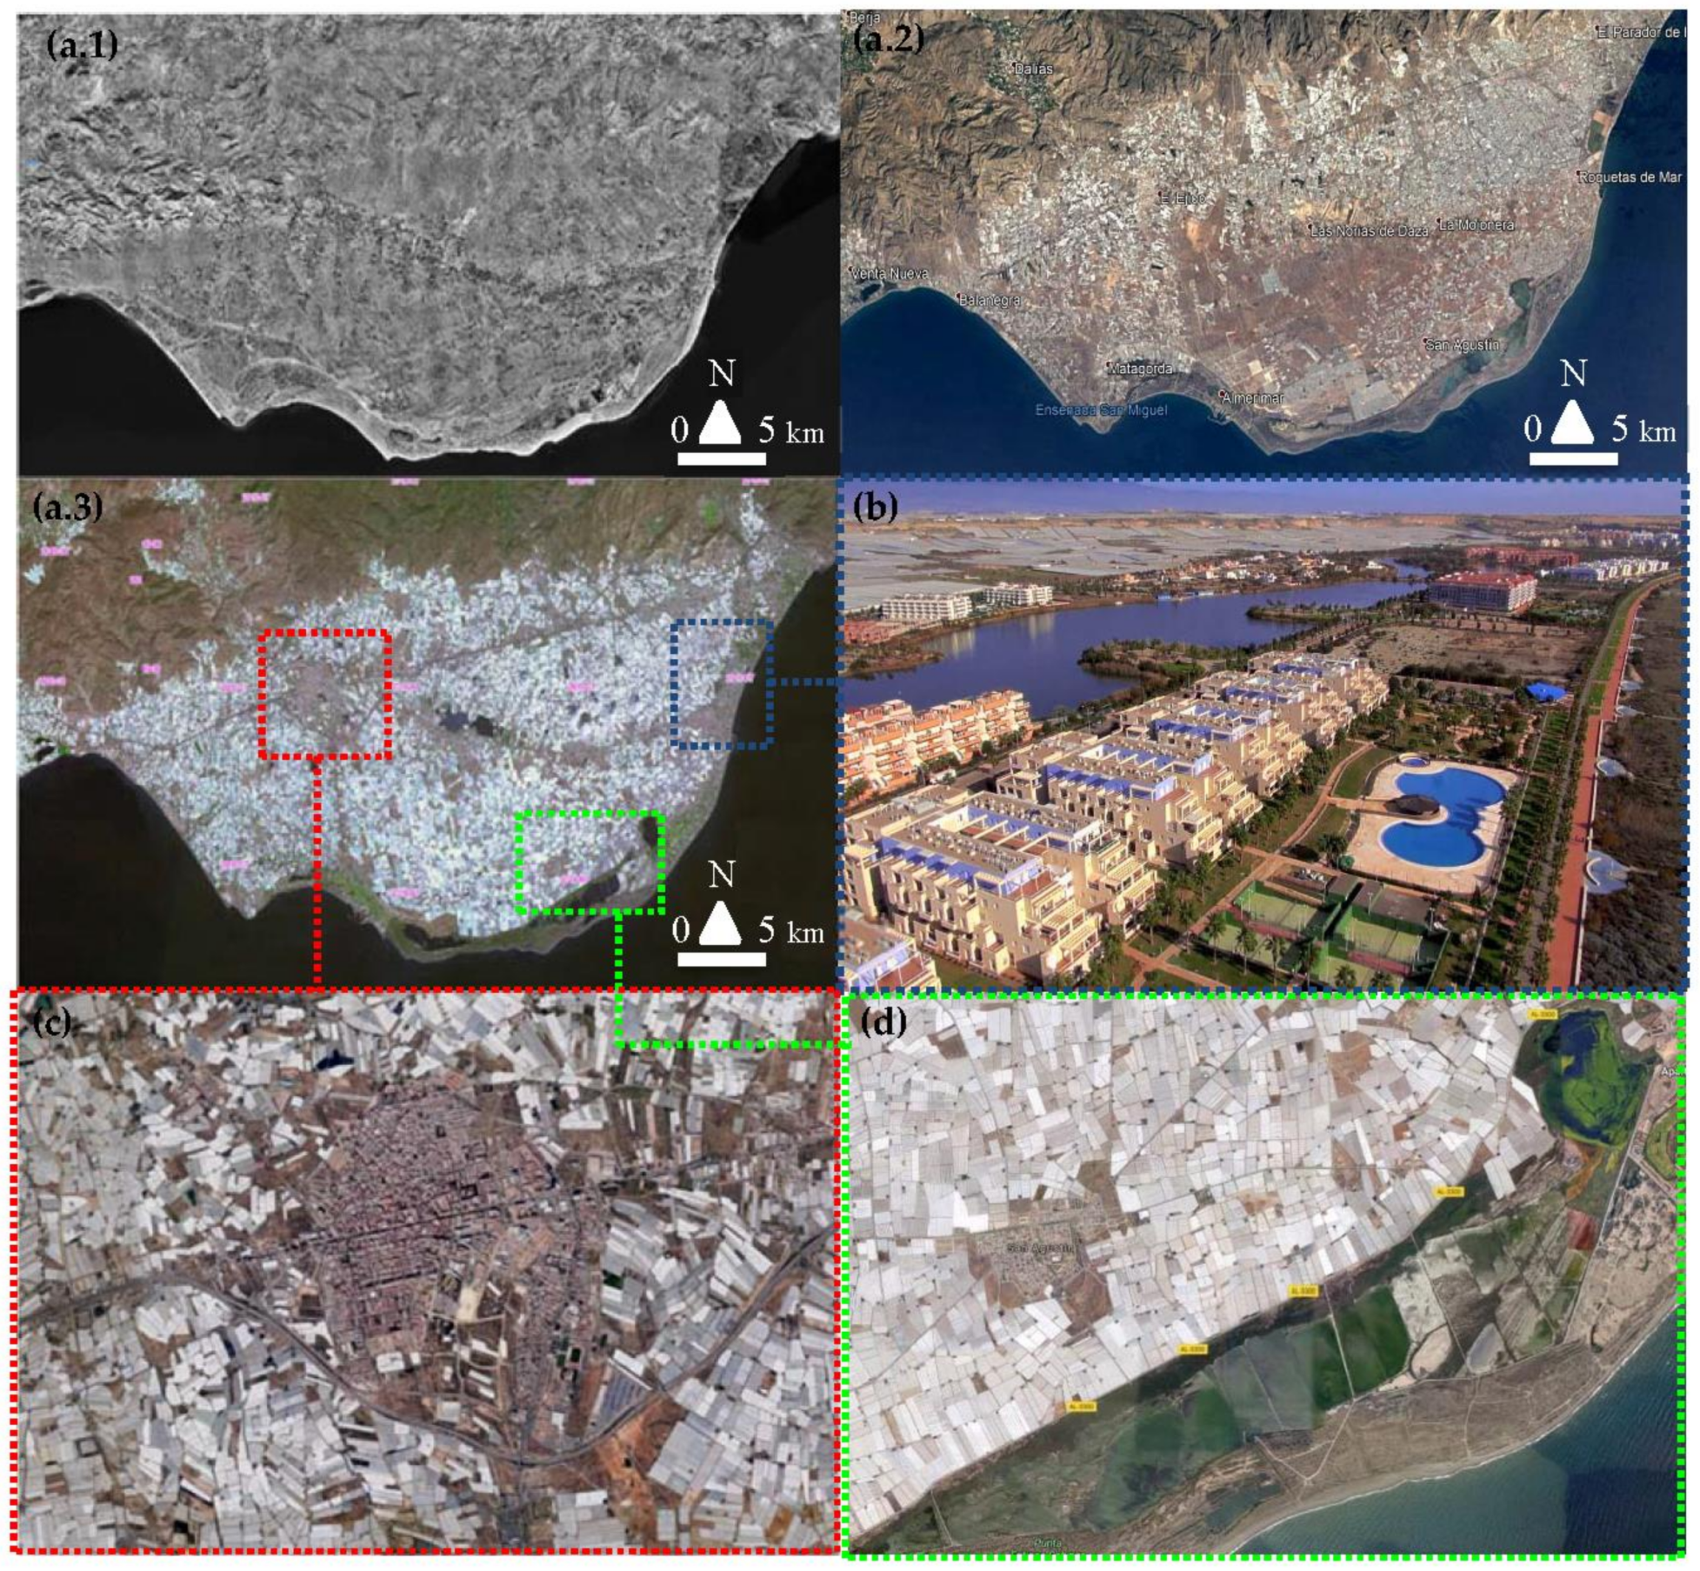
This enormously profitable agriculture is due to the discovery of a large aquifer in the area in the 1950s, and whose groundwater has allowed an exponential growth of the agrifood industry [37]. This fact, together with the progressive technification of agriculture in the area, has now generated the largest greenhouse concentration area on the planet (more than 26,000 ha). The territory traditionally consisted of land with limited agricultural use and eight small towns with a subsistence economy. The exponential development of intensive agriculture since the 1970s involved an unprecedented process of land transformation. The change has filled the territory with greenhouses, in a process that has suffered a certain degree of stagnation as a result of the high levels of land occupation and the hydrogeological imbalances detected in the aquifer. This last thing has forced the agricultural growers to resort to the use of desalination plants [38]. The phenomenon of territory saturation has occurred following patterns of what we call the “reverse oil stain” model. The process takes into account the structure of existing paths and rural roads to favor the transformation of the landscape into greenhouses, but it is developed from the most distant places of the urban or periurban settlements towards the main urban nuclei. Moreover, the urban nuclei do not remain static over time, and this process has had to cohabit since the 1990s with other actors such as coastal mass tourism in a territory that also has important natural spaces of high environmental value (Figure 8).
If we numerically analyze the transformation process of the territory in the last five decades we can observe how the process generated has been of great intensity in relation to the whole of the region. This has led to exponential population growth. Its main settlements have passed from 3000 to almost 100,000 people in barely 35 years, stabilizing in the last decade as a consequence of the phenomenon of land clogging (Table 2). This “clogging” periurban land process contains elements in common as well as different elements to the other two cases studied. We must take into account that the landscape transformation responded fundamentally to the agricultural boom in cases such as El Ejido town while other periurban areas like Roquetas de Mar are nevertheless more subjected to tourism development trends. To evaluate the current transformation trend numerically and to develop a comparative analysis with the other two cases, the El Ejido-Campo Dalias area will be assessed through the GIS indicators from the methodology section, observing similarities and differences with the other two cases.
3.1.3. Campo de Cartagena—Mar Menor Area
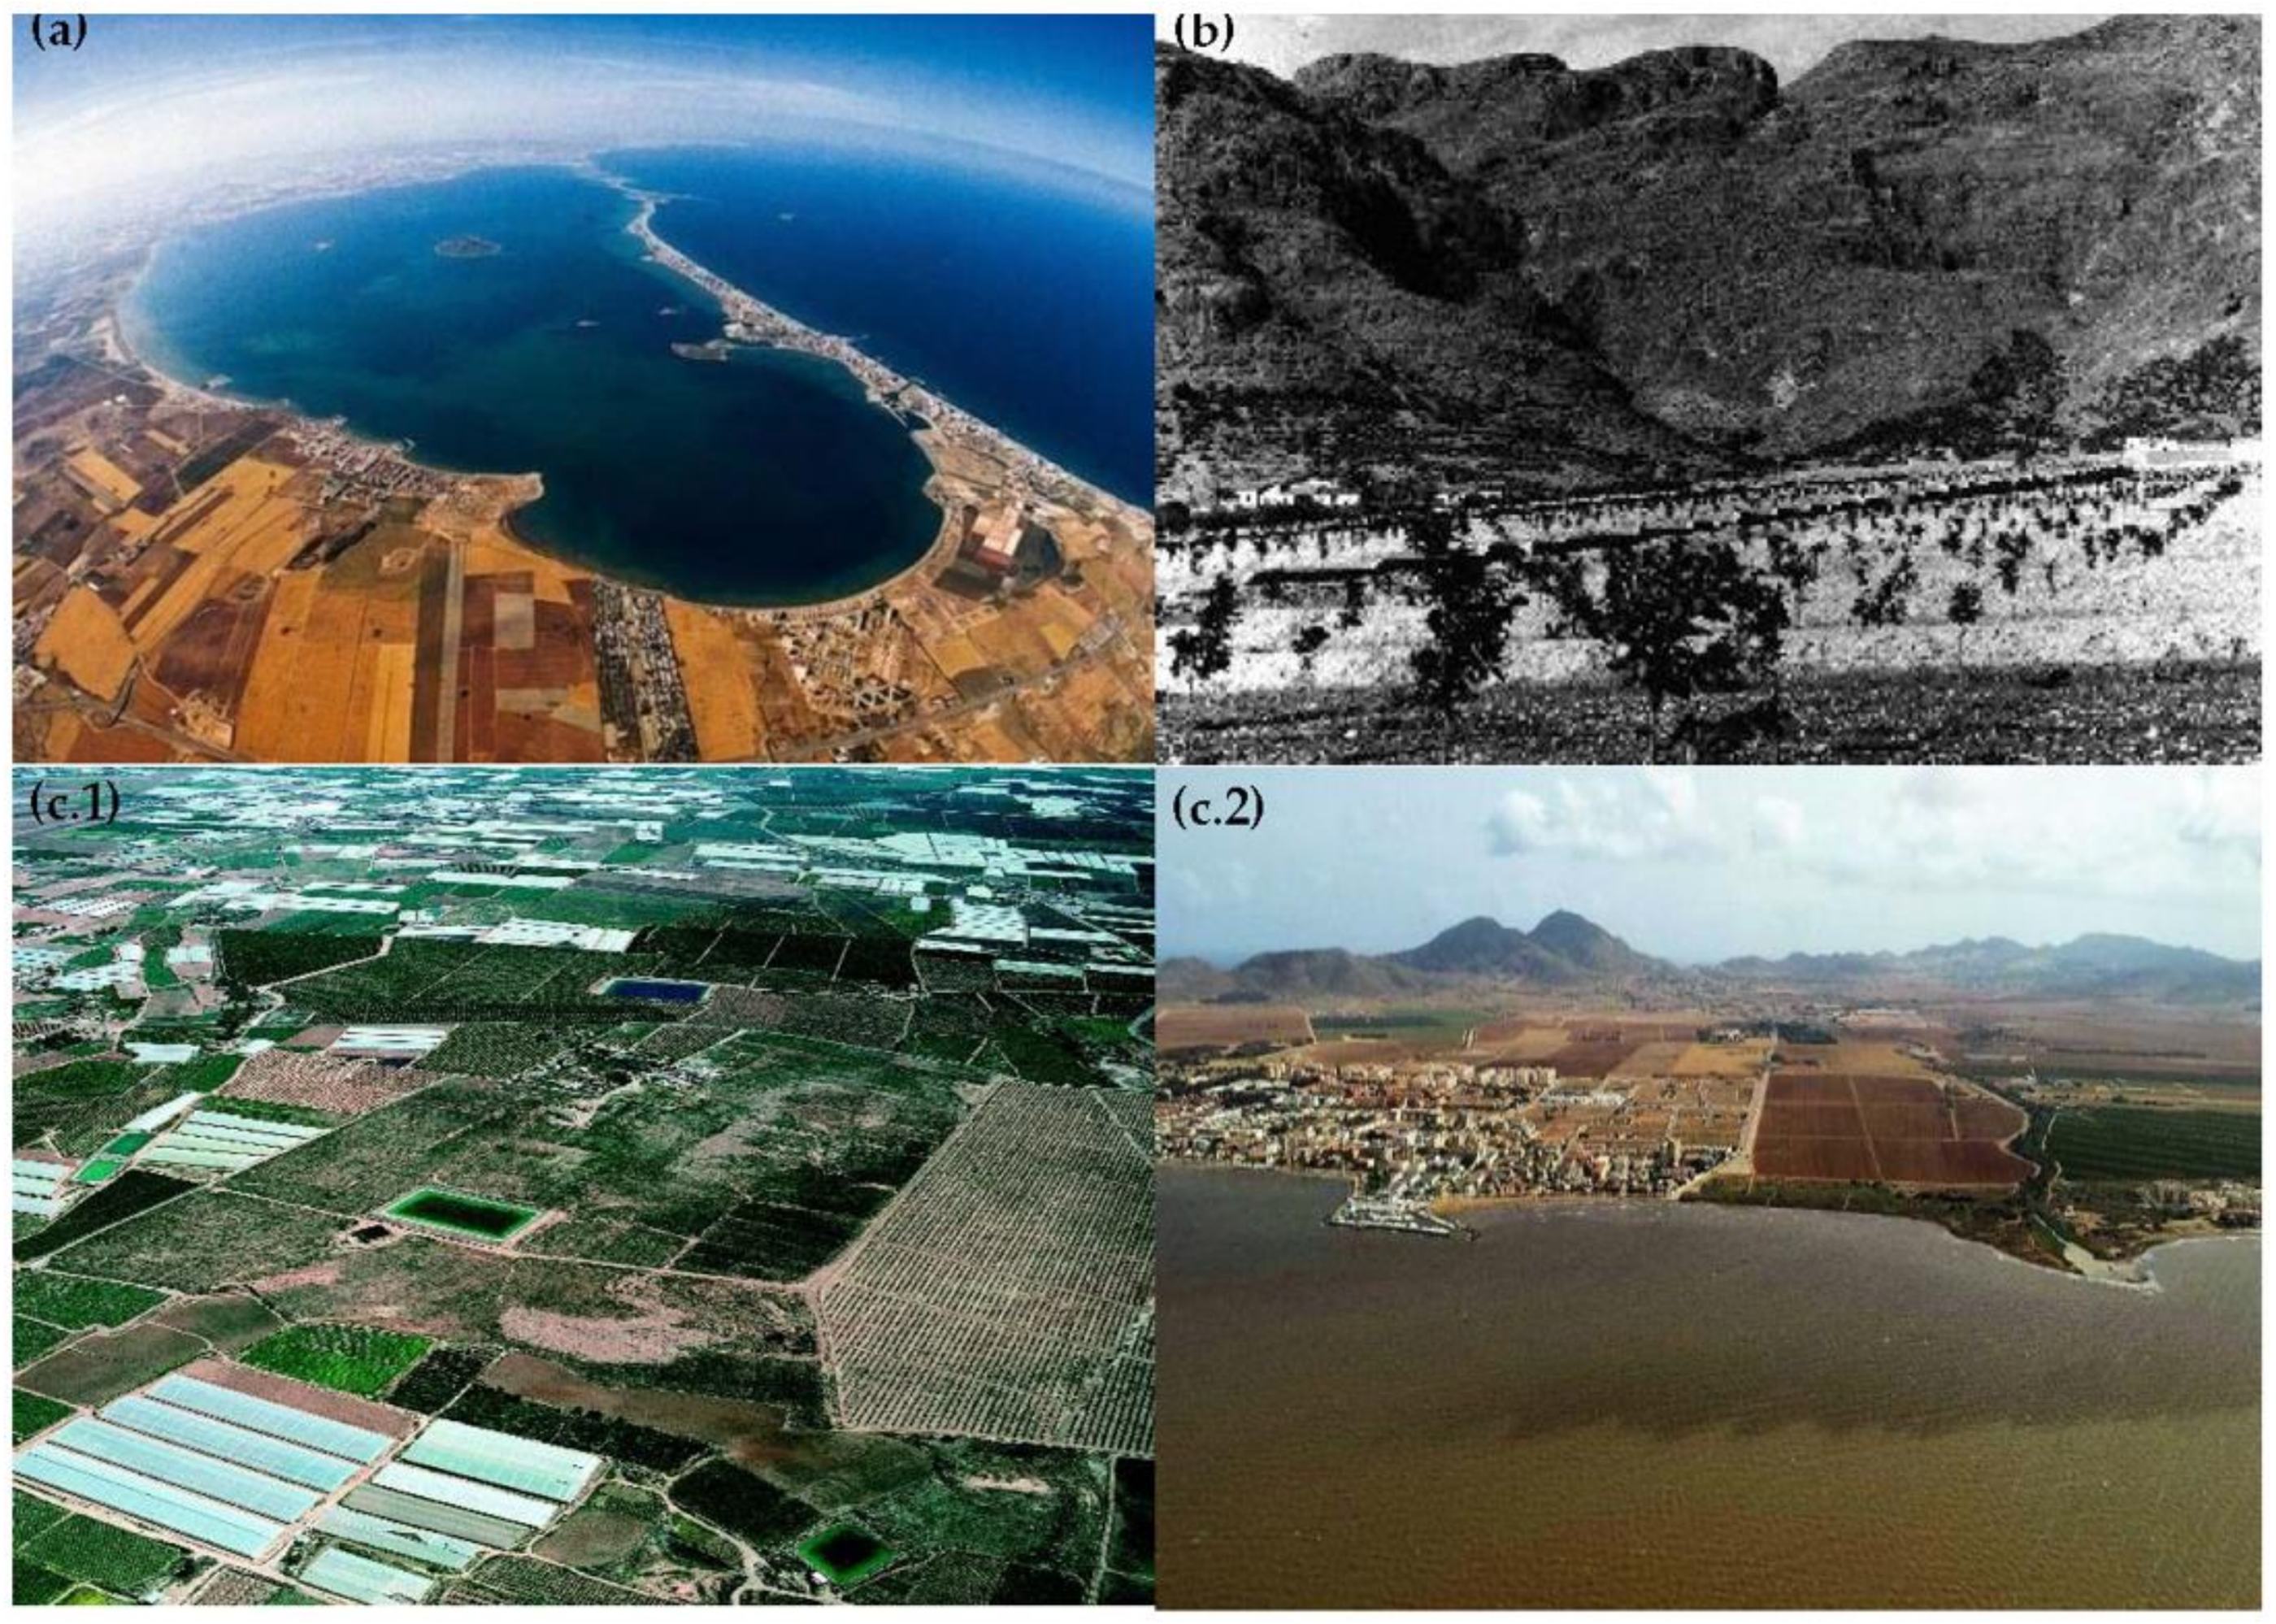
The third case corresponds to the Campo de Cartagena—Mar Menor area, involving around 40,000 Ha of agricultural areas with small urban settlements located around the salty coastal lagoon of the Mar Menor (17,000 Ha). This classic semi-arid Mediterranean territory with little rainfall was irreversibly transformed with the start of the water transfer infrastructure between the Tagus and Segura rivers in the late 1970s. This operation enabled the transformation of the traditional subsistence agriculture consisting of rainfed crops into intensive irrigated agriculture. In that context, the former landscapes of orange and lemon trees were gradually replaced by productive crops and greenhouses of tomatoes, lettuce or broccoli that replaced the traditional terraced orography and transformed the former natural soils for this growing agrifood industry (Figure 9).
This phenomenon has generated great economic wealth for the territory, and the area is currently one of the most productive in Europe. However, this intense transformation of the territory during the last 35 years is not exempt from controversy today. Apart from the associated profound transformation of the rural landscape, the development of intensive agriculture requires fertilizers and phytosanitary products. This has nitrified the aquifer and polluted the Mar Menor lagoon (a natural protected area with high environmental value) by nitrates that now easily reach the lagoon through wadis as a consequence of land transformation [39].
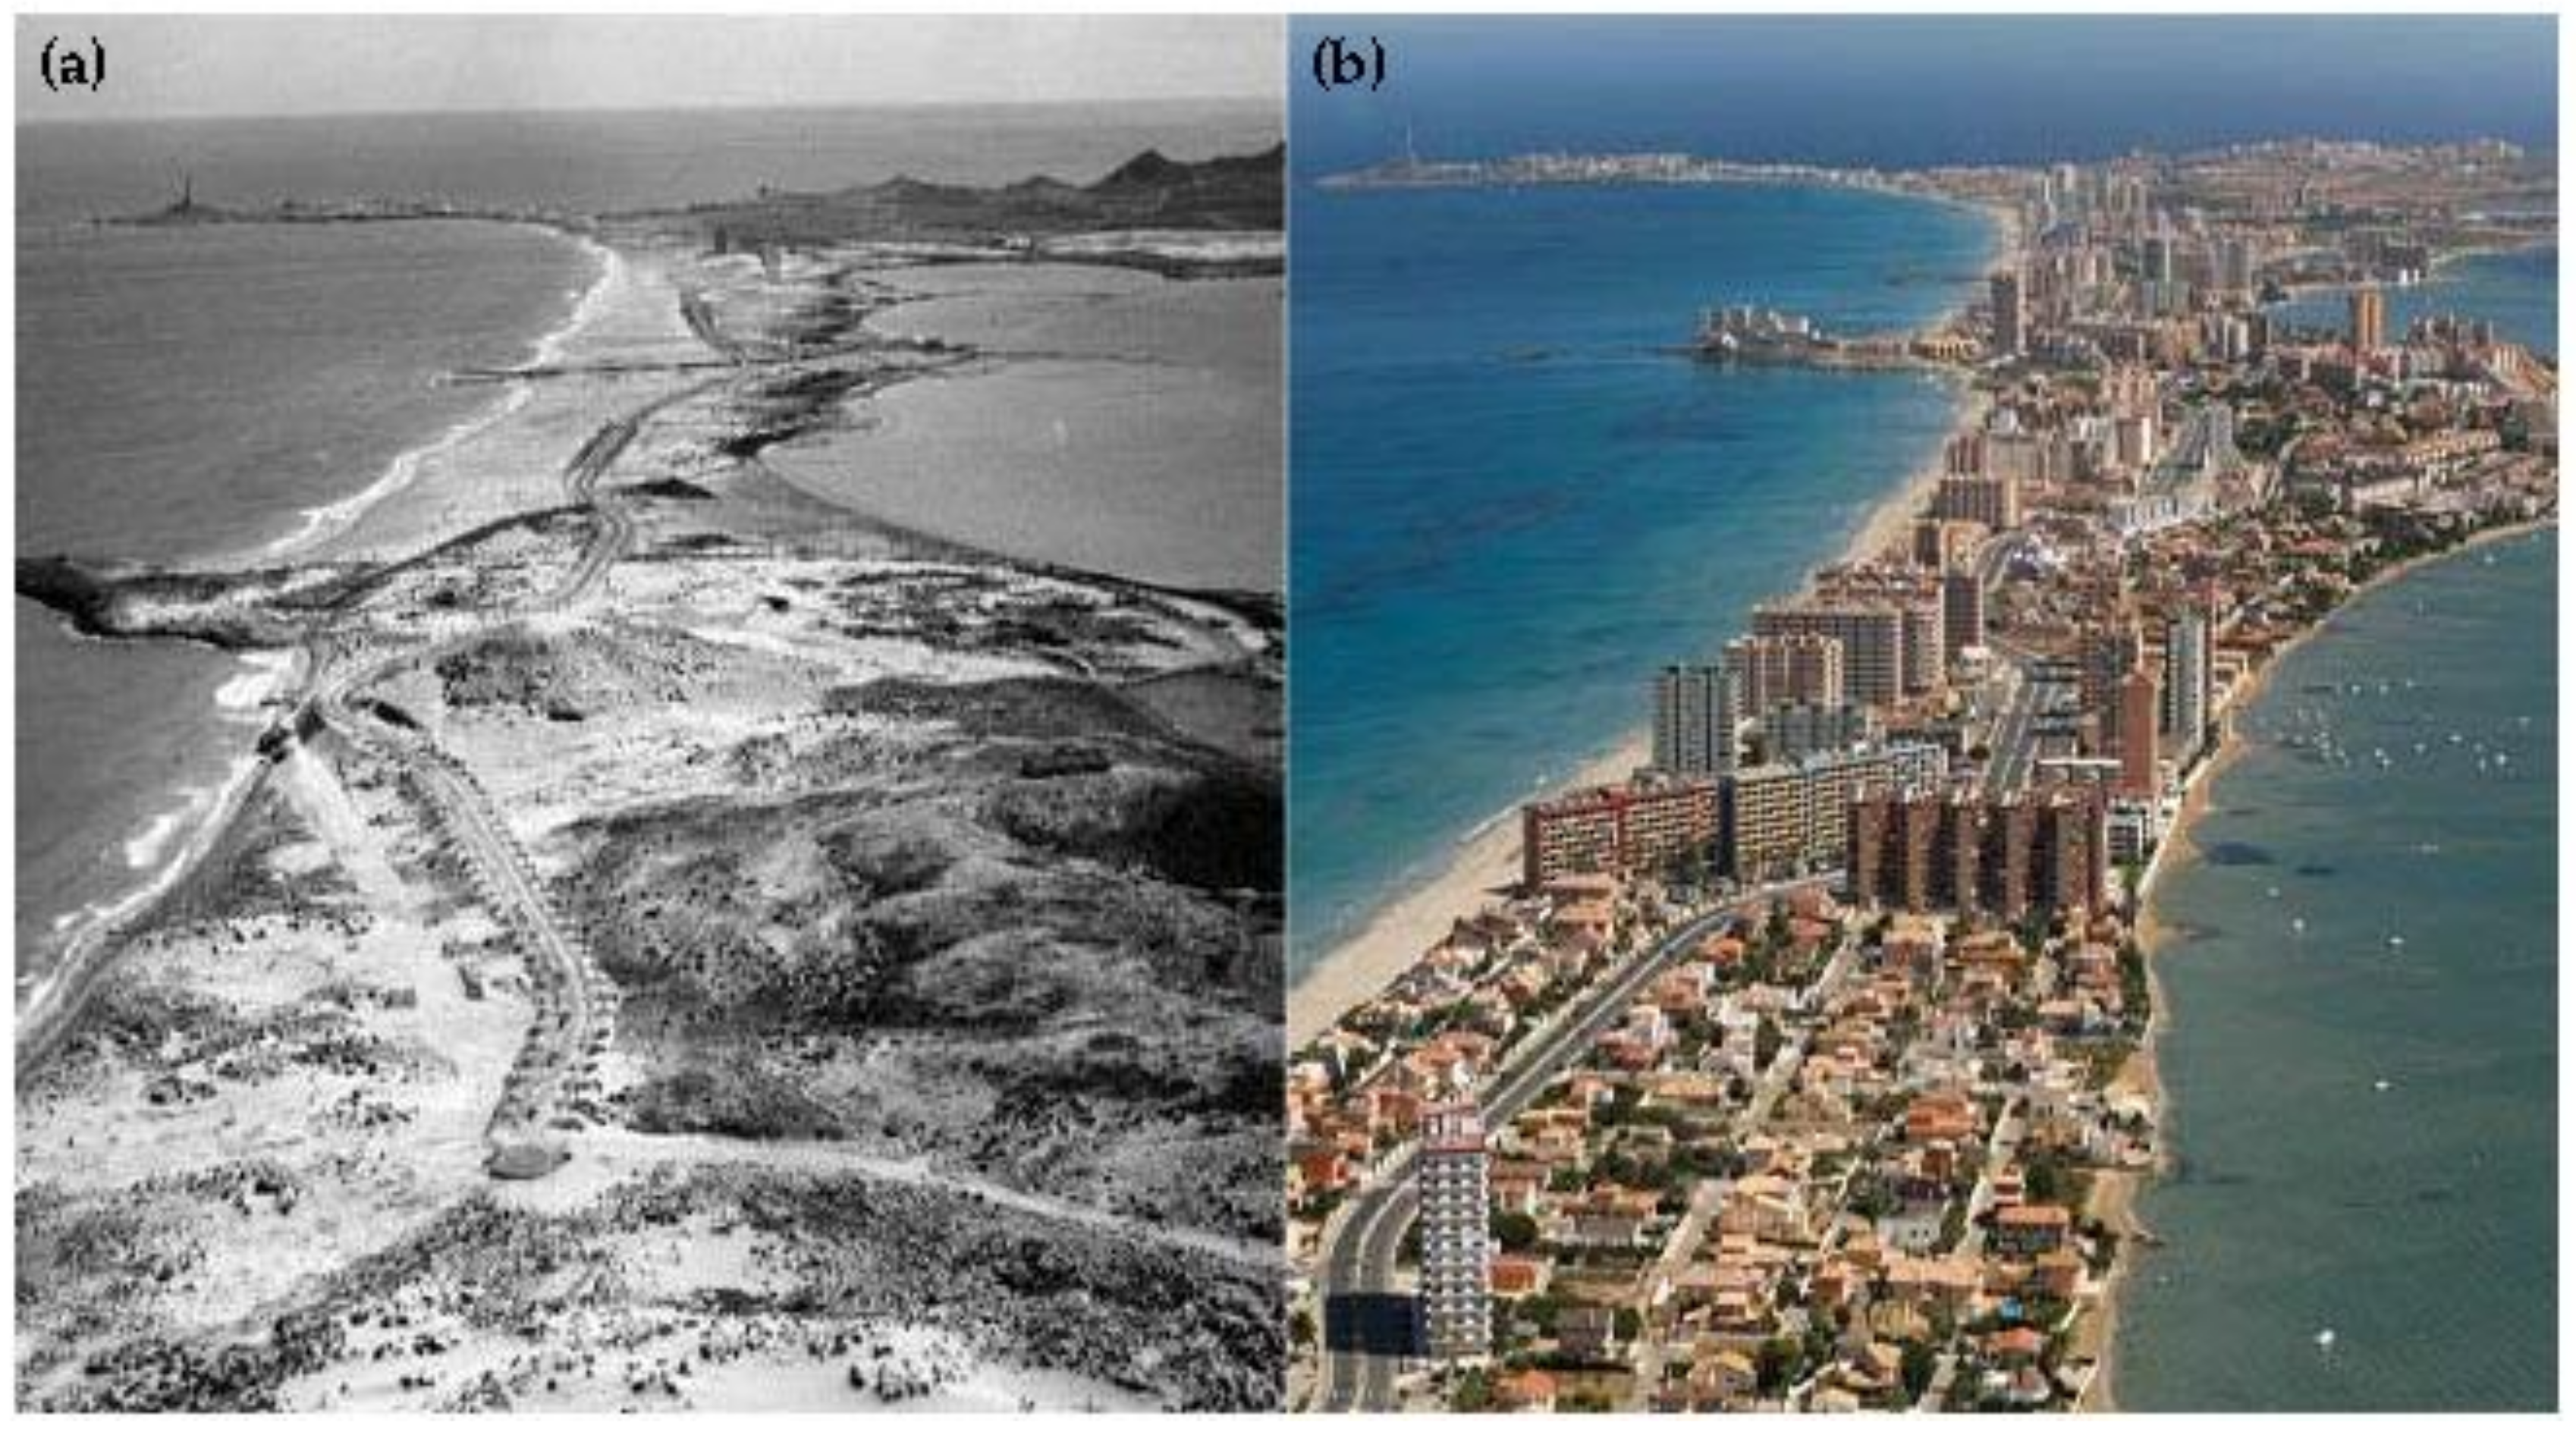
Another phenomenon that has decisively transformed the landscape of this periurban environment formed by a dozen small agricultural populations has been tourism. However, two different tourism phenomena must be differentiated. On the one hand, we find mass tourism, oriented to the offer of sun and beach in the perimeter of the Mar Menor lagoon. This tourism has experienced exponential growth since the 1960s, with urban coastal settlements growing and urbanizing almost the entire perimeter of the lagoon. Its most paradigmatic exponent is the chaotic urban development of La Manga [40]. This ancient natural dune strand with shrub vegetation separates the Mar Menor from the Mediterranean Sea and is currently totally urbanized by concrete buildings (Figure 10). However, it is necessary to point out that this type of urban development has been slowed in the last two decades from the point of view of the land consumption because of the clogging of the coastal perimeter in the lagoon and the increasing constraints imposed by environmental regulations.
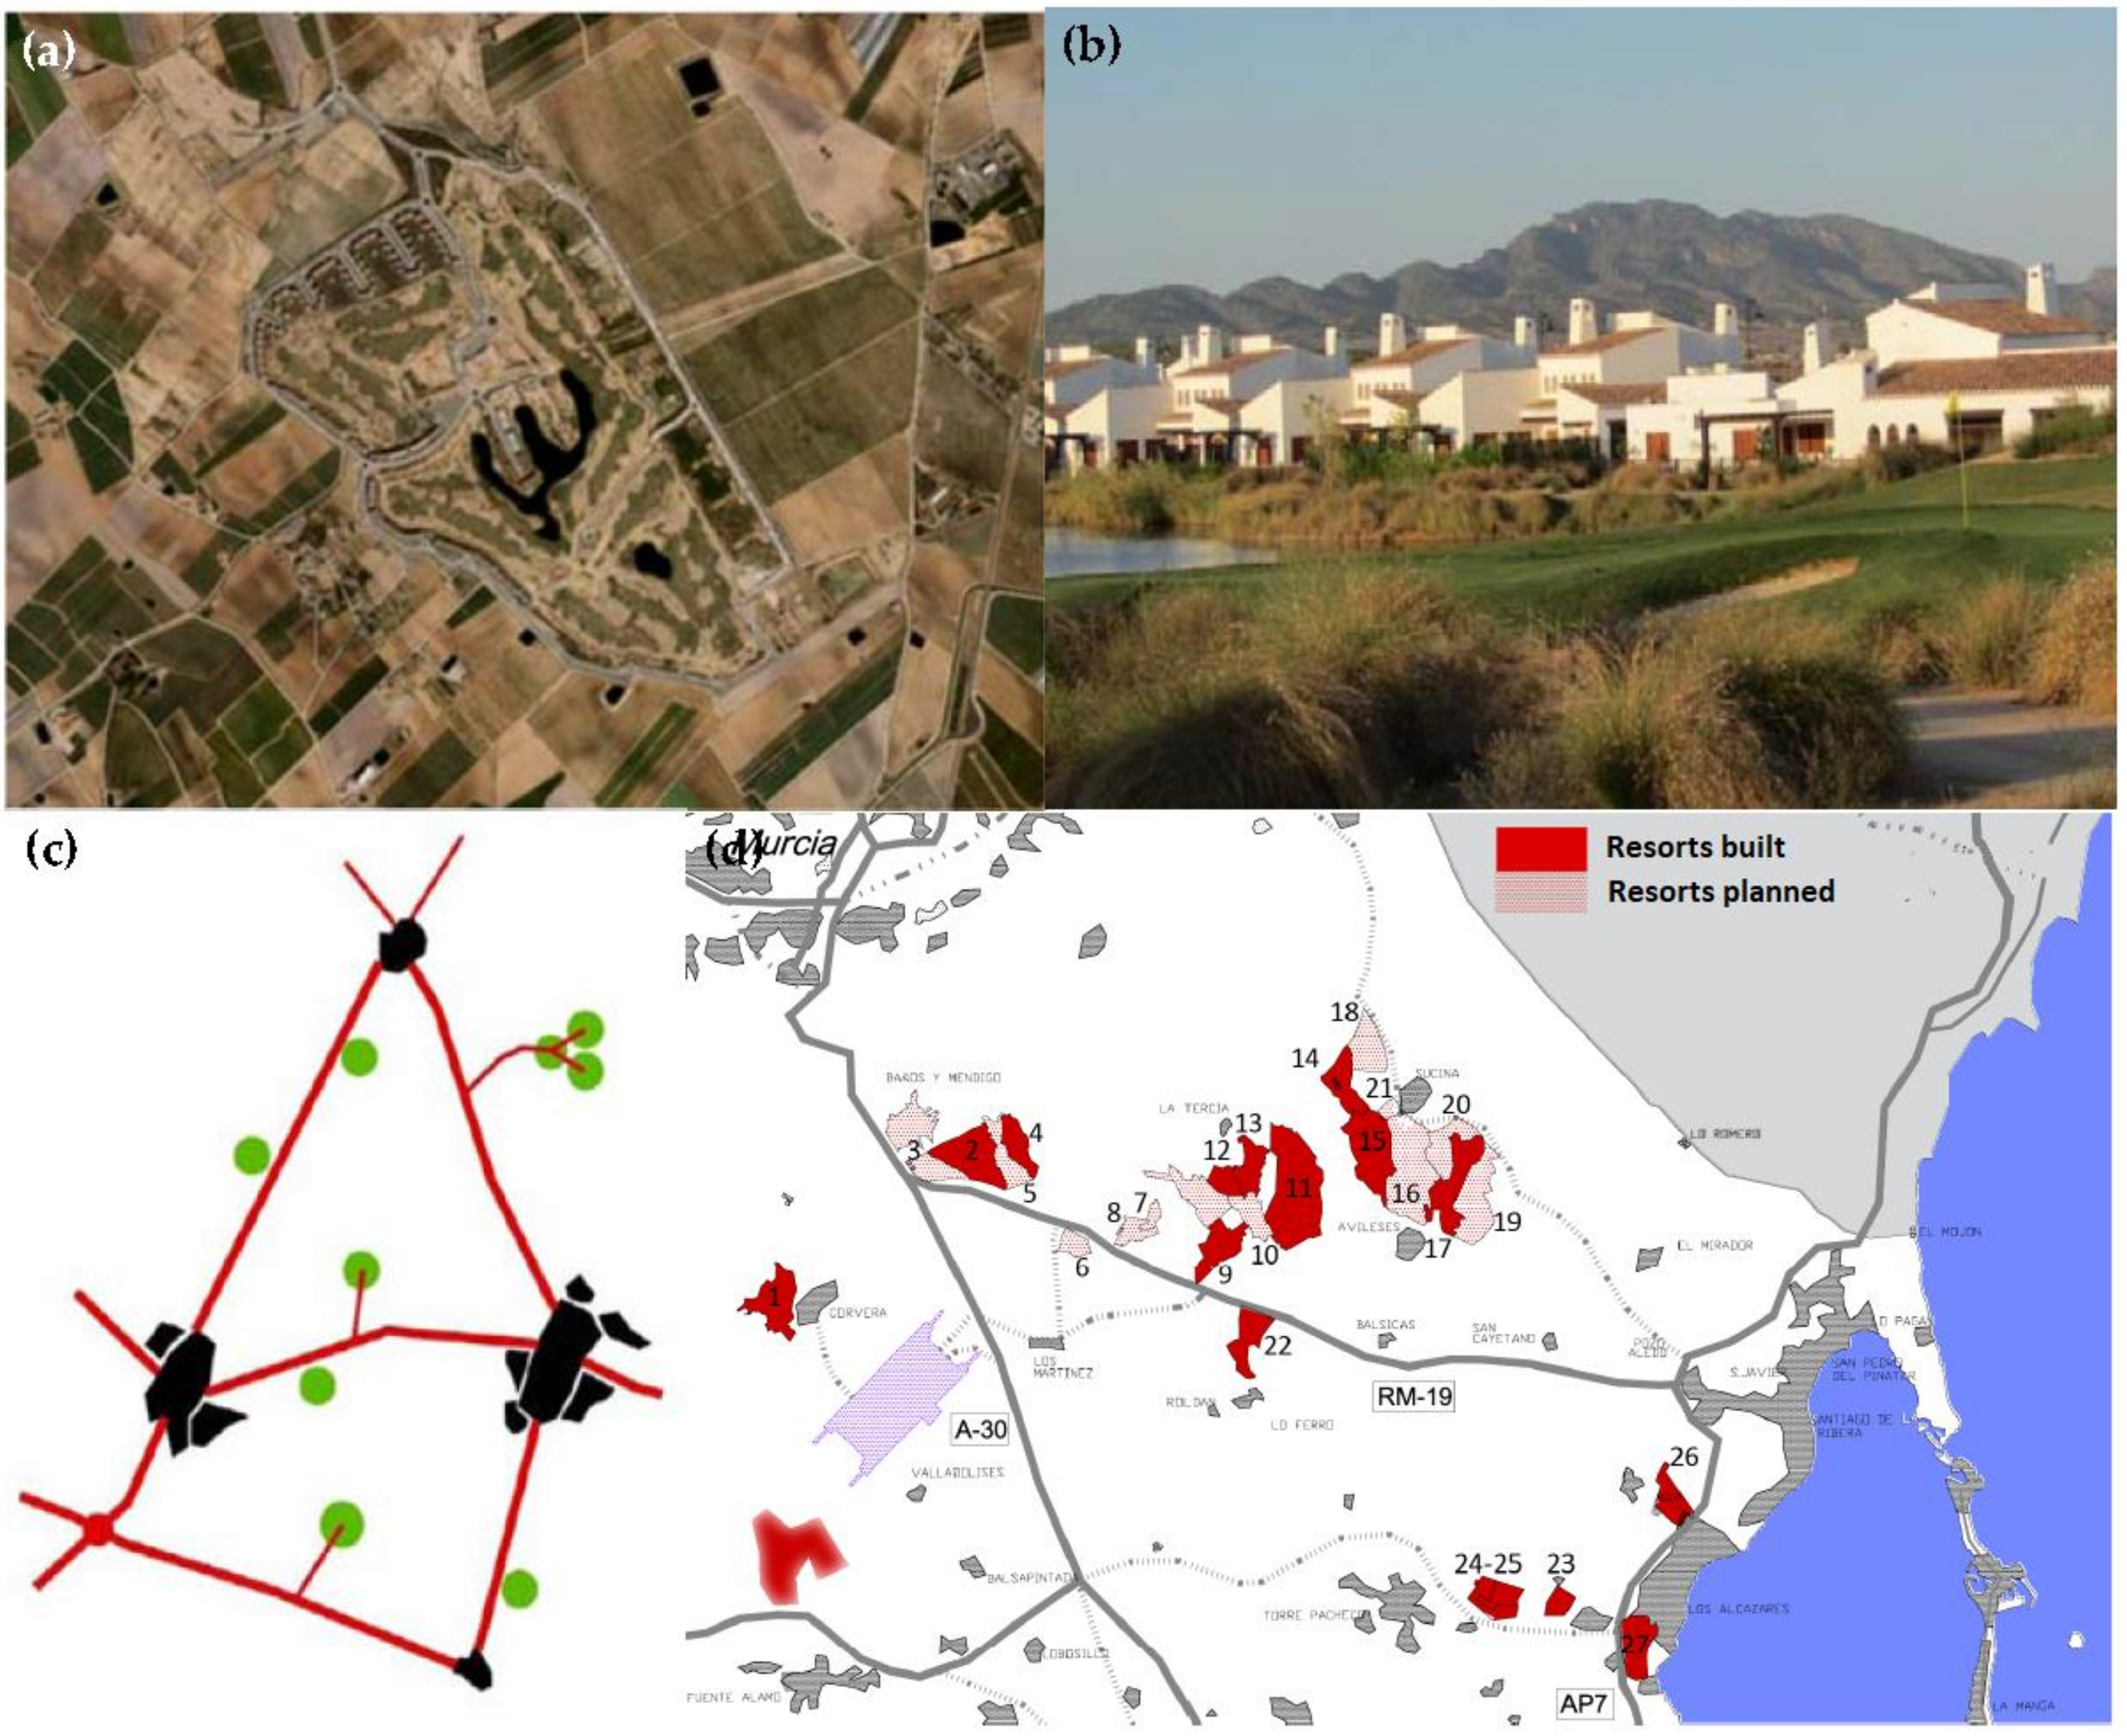
Even so, from the point of view of periurban landscape transformation, the resort phenomenon on the other hand is far more interesting. This second type of tourism was born as an alternative (or even as a result) of the urbanization process generated by coastal mass tourism. It is a different phenomenon where it is not sought to occupy the coastal edge but the inner periurban spaces of the Campo de Cartagena area, where the purchase of rural land for real estate development is cheaper. Its urban developments are, in contrast to the previous one, very low density and are located near the cities and the major communication infrastructures. In addition, its landscape impact in the environment is significantly less, as they are surfaces configured with green areas and small lakes for playing golf (which is used as a tourist attraction), and architectural designs of the friendliest single-family houses. We have called this pattern of growth the “polyp model” for analysis. However, this phenomenon is not exempt from controversy for having a complex cohabitation with the agricultural uses and requiring a high consumption of soil and resources (water and electricity infrastructures, public services, etc.). This makes it highly recommended to study its evolution more accurately, with land consumption in the area being a good indicator of its trend behavior (view Figure 11 as a summary of the phenomenon).
In this context, if we analyze the evolution of the different types of soil and the population in the area over the last 50 years, we observe that they do not follow behavior patterns similar to the two previous cases (Table 3). To compare these transformation trends numerically in an objective way they will be assessed through the dimensionless GIS indicators performed.
3.2. Comparative Results
Table 4 summarizes the results obtained from applying the GIS indicators described in the second section to the areas corresponding to the three cases analyzed in the third section (included as supplementary material). To evaluate the heterogeneity of the static indicators in the three cases, their surfaces have been analyzed by dividing them into land subareas or landscape subunits of homogeneous characteristics. The highest, lowest and the average values of the set of subunits have been indicated for each case. On the other hand, to carry out the trend analysis that considers possible future scenarios, the dynamic indicators have been evaluated for the three periods between the years 1956, 1981, 1999 and 2016.
From the simple global observation of the results, it can be seen that in the case of the static indicators, a much more homogeneous behavior is appreciated in the case of Campo de Dalias than in the other two cases (average dispersions of 5% versus 20 and 25% in the other two). This has to do with the fact that urban, natural and agricultural uses here are less “mixed”. In this case, comparatively high average values of LAR (0.662 against 0.467 of the Huerta de Murcia and 0.504 of the Campo de Cartagena) are also found. This value reflects its comparative high rate of transformation of the natural soil, whose situation borders on reaching the clogging of the territory analyzed. In this case, periurban transformation is essentially agricultural in nature, as revealed by the values of infrastructural anthropization IFA (0.221) and urban fragmentation UFI (0.183). This heterogeneity of the different subunits is observed in the high and stable compactness of the set analyzed. In the case of dynamic indicators, we observe a stabilized sprawl rate (0.152) and a low contribution to the creation of new low-density urban cores reflected in the ICNUC value, as a result of this heterogeneity. In comparison, the rate of agricultural transformation is high but currently stabilized over time. It would therefore be the least “periurban” (assuming the classic concept presented in the introduction about these mixed-use territories) of the three examples of periurban areas analyzed.
The case of the Campo de Cartagena presents a behavior halfway between the Campo Dalias and the Huerta de Murcia for most of its parameters. It is an environment with medium-low and homogeneous rates of transformation (average values of 0.300 for LAR, IFA, UFI, Ti) in relation to the other two cases. It also has acceptable compactness ratios which remain relatively stable over time. Nevertheless, the recent increasing degree of transformation of natural soil into agricultural land and the growing tendency to form new low-density urban cores is alarming. In fact, an interesting aspect related to the growing increase of Ti (63.8%) is the sensation that the urban sprawl phenomenon has “accelerated” in recent decades (this case has shown the greatest increase of the three for that parameter).
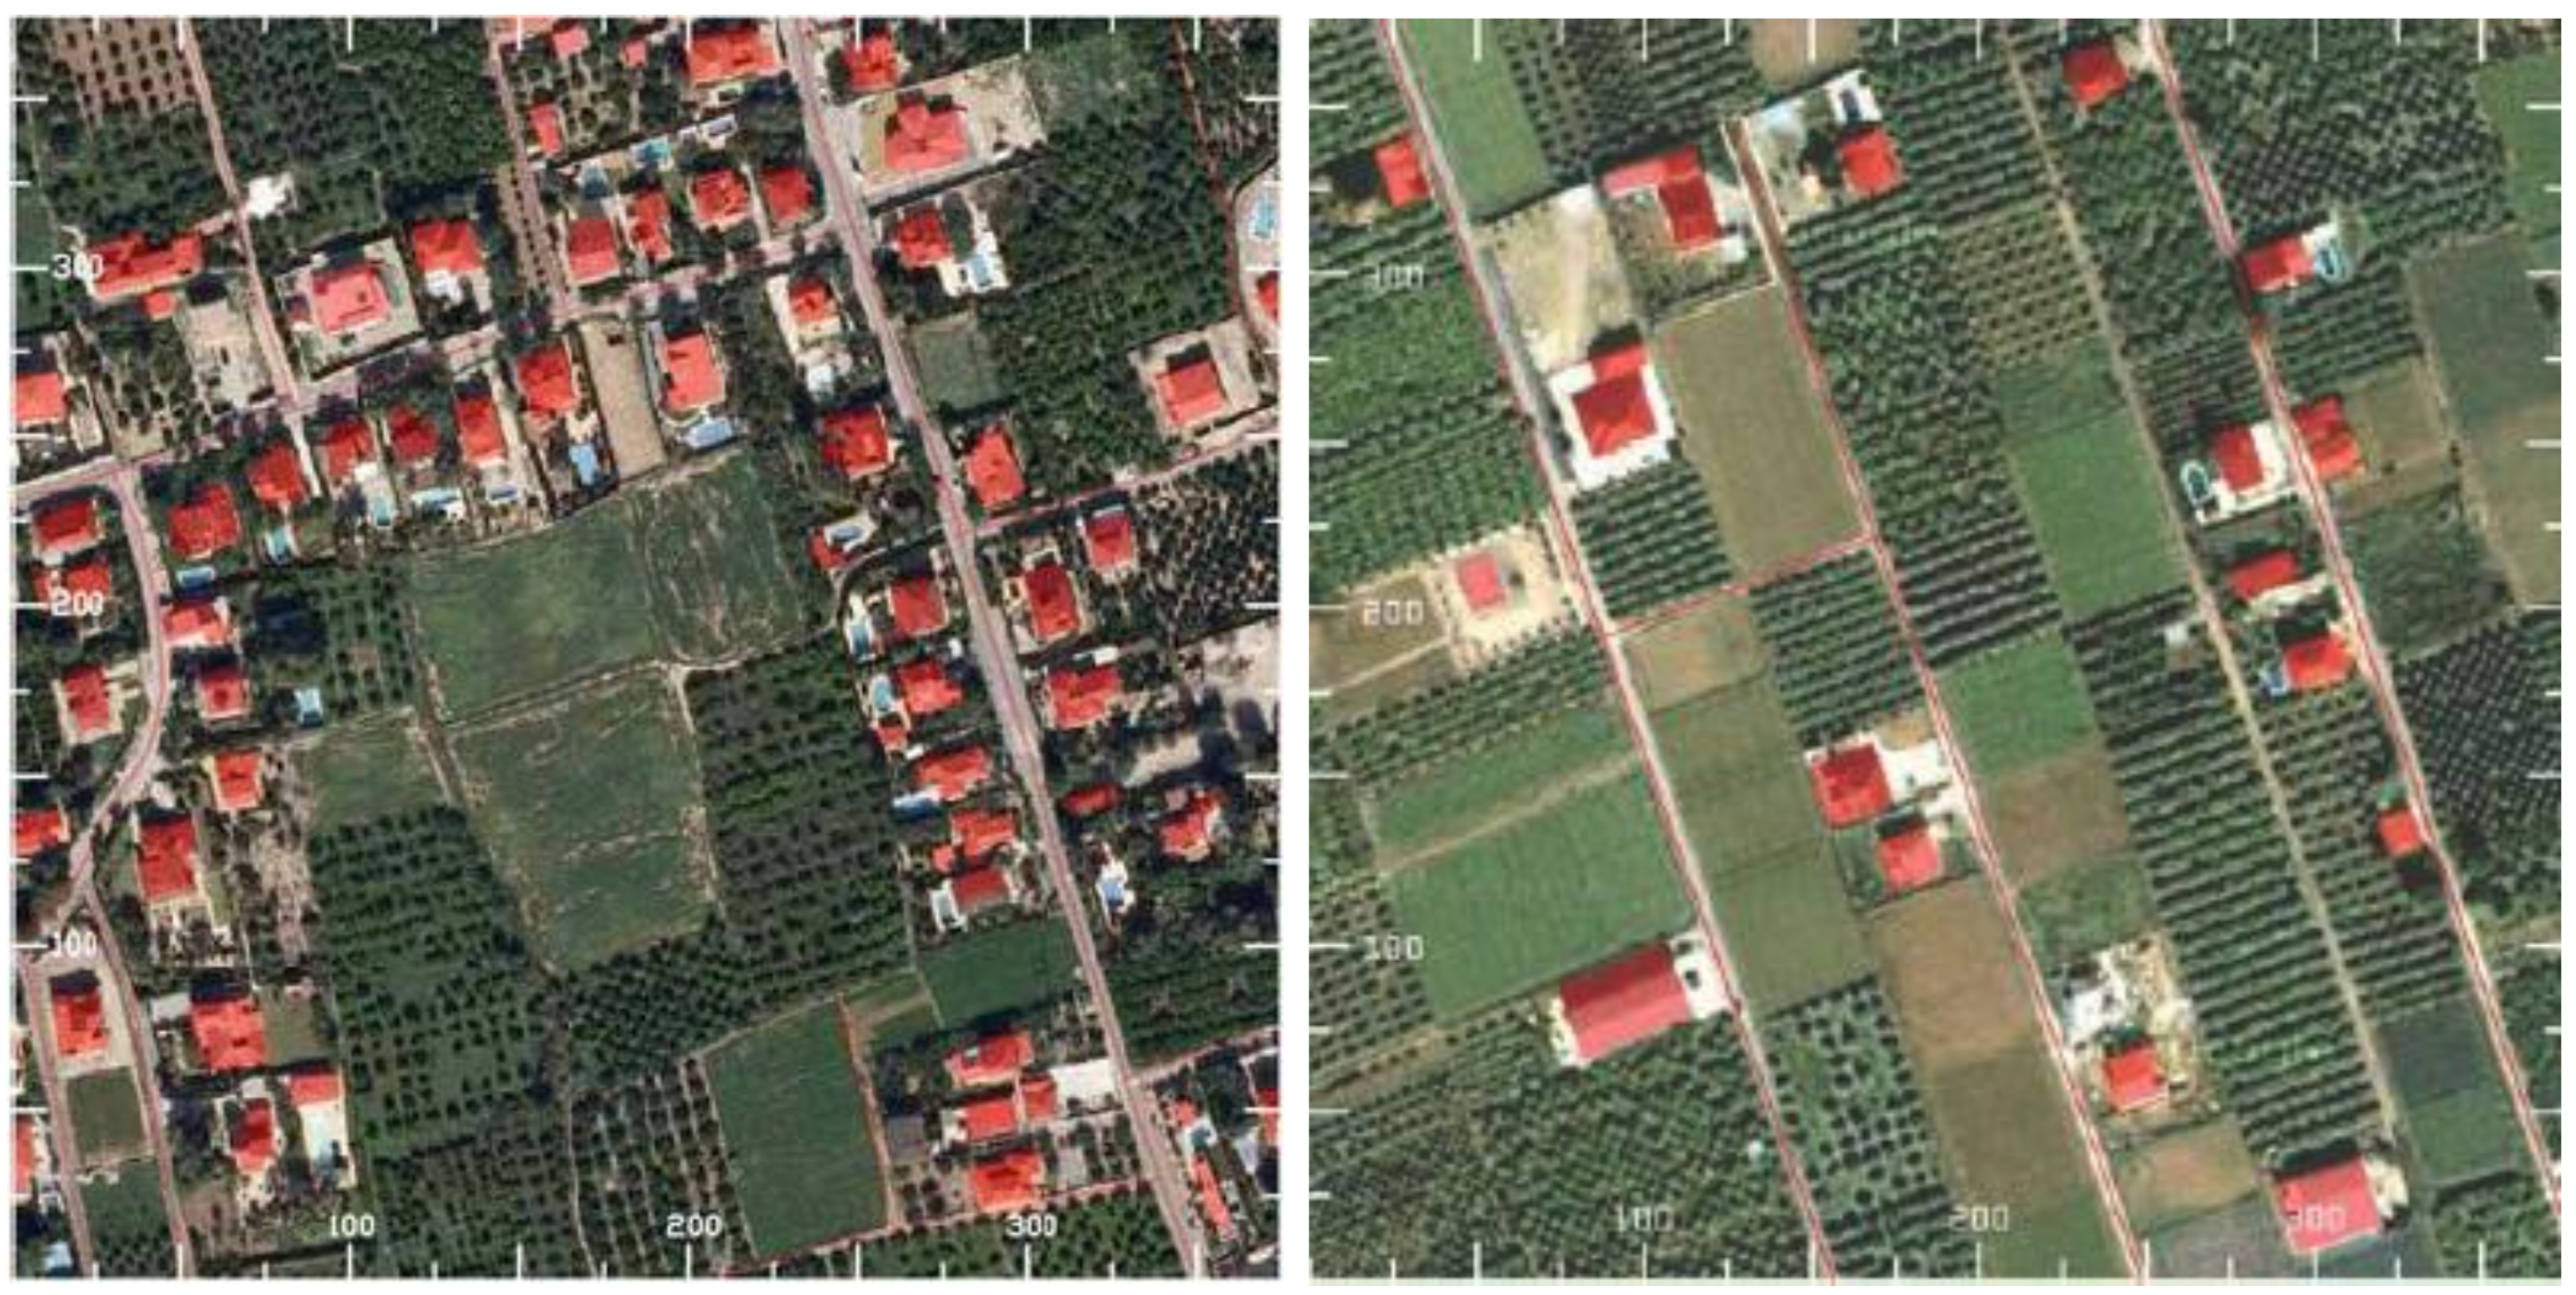
In the case of Huerta de Murcia we find globally higher ratios of transformation, but which are more homogeneous. With the exception of the case of the global and agricultural transformation of LAR and IAT from Campo Dalias, the remaining values are greater than in the other two territories. The deterioration of the compactness index is particularly interesting (in the analyzed period it has decreased by almost half). If we analyze GIS subunits patterns more in depth graphically, the case of the Huerta de Murcia is undoubtedly the most interesting of the three in terms of its heterogeneity. Upon studying the values of the different subunits in a disaggregated way, we can observe how they present different behavior patterns depending on whether they are located east of the main city or located to the west. A deeper analysis has been carried out to interpret this behavior in more detail by selecting a representative sample of both groups of subunits. The working scale has been reduced to perform this analysis by observing each plot individually as can be seen in the detail of Figure 12; the comparative results obtained of the two samples are given in Table 5.
A priori the two samples maintain their theoretical condition of agricultural territories (the parameter agricultural area, which defines the urban category attributed to the soil, remains with values higher than 80% for both in 2016, decreasing in one case from 86% to 80.5% and in the other, from 93% to 91%). However, looking at the analysis of the western sample it can be deduced that its territory has partially abandoned its productive agricultural facet to provide support for a kind of anarchic city-garden (cultivated land in use parameter, the soil that has really been observed that is cultivated at the time of mapping the orthophoto, goes down from 555,245 m2 in 1956 to 217,812 m2 in 2016, going from representing 80% of this theoretically agricultural territory to barely 40% of it). Meanwhile, in the eastern sample the rates of crops in use for this parameter are more than double, reaching 80% of the agricultural land (both analyses were carried out using material obtained for the same period of the year). Comparing the two samples, one can see that while the western orchard land has a rate of built soil greater than 10%, in the eastern orchard this value is just over 3%. In addition, the impact of roads and paths is three times higher as a result of the increased urbanization. Furthermore, although the agricultural surface areas of both samples only differ slightly, the area of cultivated land at the time of the analysis is much higher in the eastern sample. It can therefore be observed that, although both maintain their theoretical condition of agricultural territories as a consequence of the existence of protected high-value landscapes, the western case is becoming increasingly a residential space with small farms. These small farms which have a tendency to stop being cultivated because they cannot compete with the large farms, are possibly the prelude to the substitution of agricultural periurban land for residential periurban land.
4. Discussion
The three cases analyzed have some common elements. They are periurban environments of a similar size subjected to a process of land transformation during the last 40–50 years. They have several inter-related growing urban settlements in their territories with different populations. Additionally, all of them have a high agricultural activity based largely on a common element (water) that has made them three of the largest agrifood production centers in Europe. However, this resource has been implemented in very different ways in the territory. This has led now to different behavior patterns in the process of transformation of the periurban landscape. Besides, these processes have been influenced by other anthropizing activities of the territory such as tourism or the urban growth of cities. The analysis carried out can prove very interesting from the perspective of the trend diagnosis of periurban areas in developed countries. The proposed methodology provides a model that can be exported to any other region in the world, facilitating an objective numerical quantification for its evaluation. This is possible thanks to its dimensionless format for a comparative analysis between areas of different sizes or territorial contexts. In this sense, several questions arise in view of the results: Which of the three presents a more complicated future perspective? What can the consequences of maintaining the current trend be in all three? Are there solutions to correct the current territorial trends?
The establishment of behavior trends in the transformation of the periurban territories can help us to anticipate future problems and to modify wrong or unsustainable tendencies. We must take into account that these contexts usually have phenomena whose evolution is difficult to analyze in developed countries, because they are territories with mixed uses of considerable human activity. In this sense, the analysis carried out can provide a very useful tool to diagnose these areas in which anthropization usually spoils traditional environments of great landscape value. If we introduce the discretized graphic representation of the annual values of IAT and ICNUC between 1956 and 2016 as a three-phase life-cycle concept (initial growth, maturity and decline) we can propose near future scenarios (10–15 years) for the transformation process of a territory. The aggregate trend representation of these two indices in a cumulative index of their dimensionless values can show the situation of global depletion of a territory with certain reliability (Figure 13, note: the non-availability of data for every year for all cases or even the presence of data from different times of each year can be assumed due to the large amount of data as a consequence of the long period evaluated (60 years). This can cause small point distortions from one year to the next, especially in relation to agricultural transformation indices; nevertheless, the trends over time present a high statistical robustness).
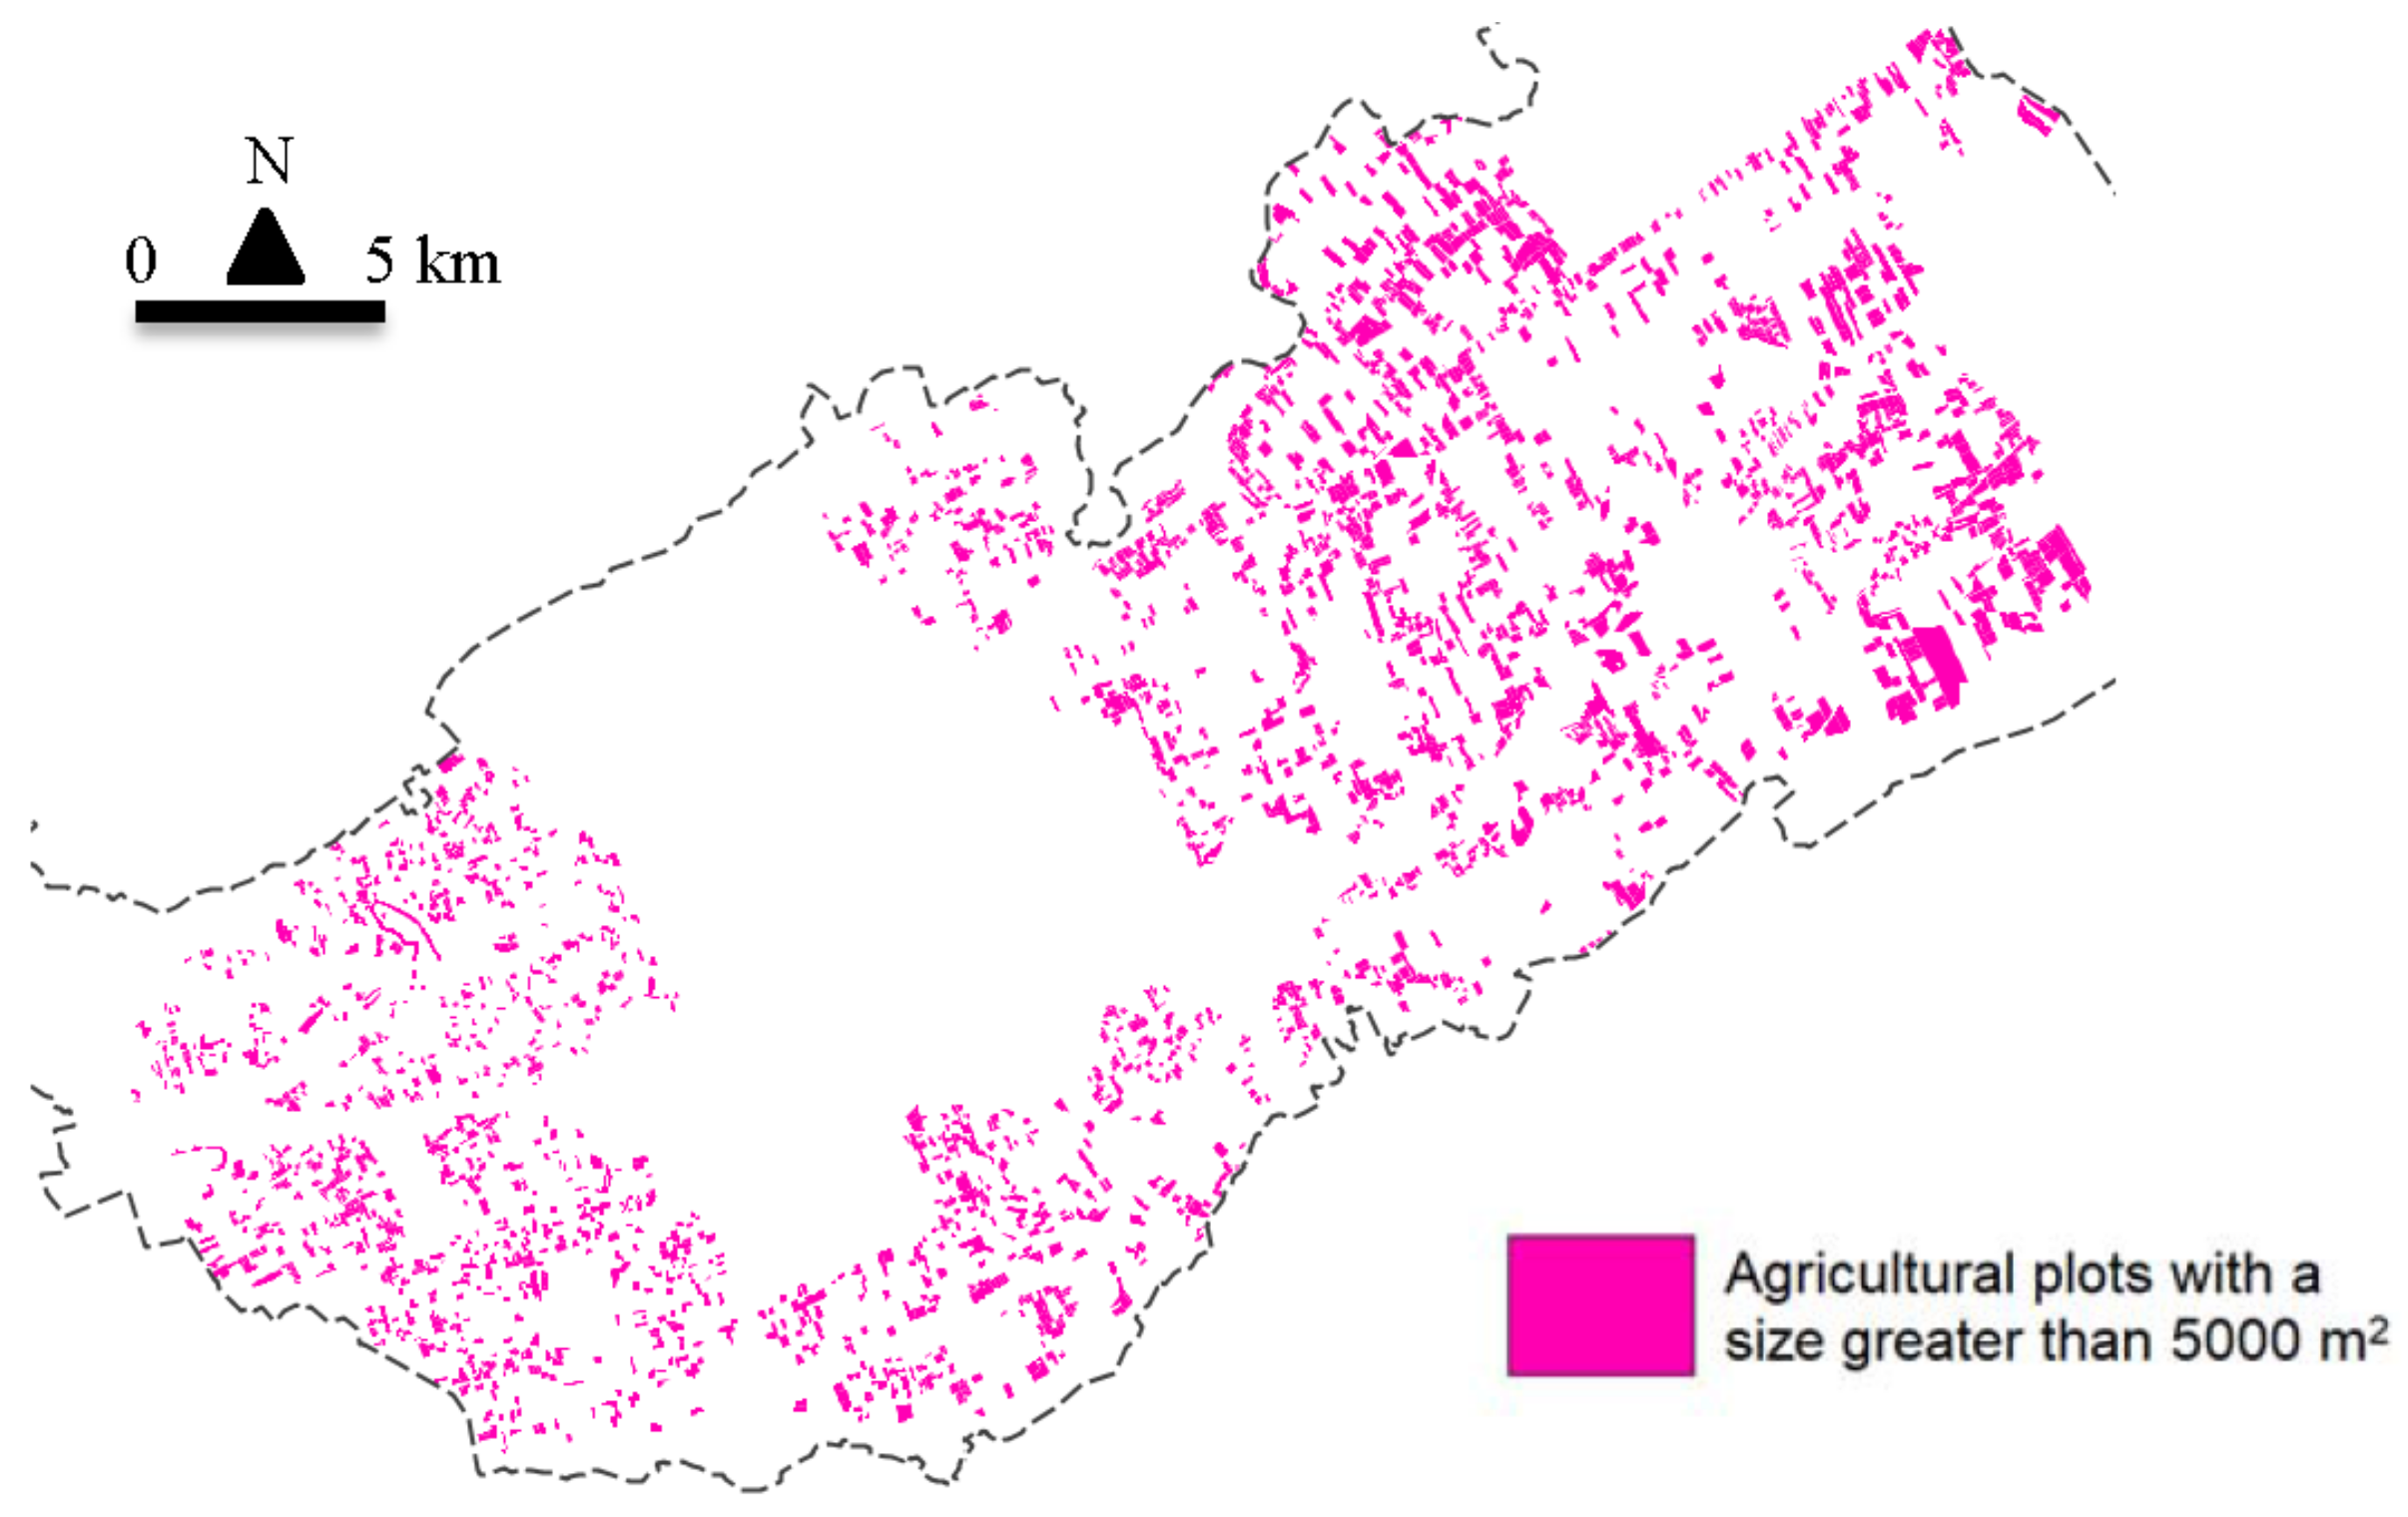
The case of the Huerta de Murcia is revealed as a “mature” periurban territory in the anthropization life-cycle process. This area has seen its agricultural activity decline sharply as a result of the relentless advance of urban sprawl. In this way, crops, which were very integrated into the periurban landscape for centuries and with great cultural value, have given way to a kind of scattered chaotic city-garden. The abandonment of the agricultural use of the territory has progressively transformed the periurban agricultural urban fabric into low-density residential urban fabric (a large part of it built in an irregular manner since it was not carried out to maintain agricultural operations). The process has produced a strong phenomenon of denaturalization and loss of the landscape idiosyncrasy of the traditional Huerta. This situation already raises few possibilities for reversion. Thus, preservation by local and regional authorities of the agricultural status of the larger plots (for example >5000 m2, the surface area required by urban planning regulations in this area to authorize the construction of buildings linked to existing farmland possession, Figure 14) through stricter regulations for house building remains as the only structural solution to maintain the coherence of the current landscape.
The cases of Dalias-El Ejido and Campo de Cartagena are less worrisome than the previous case, but attention must be paid to them to avoid reaching the current status of the Huerta de Murcia. In the first one the agricultural clogging of the territory through greenhouses has prevented the urban sprawl. We would therefore be talking about a process of “primary maturation” only linked to intensive agriculture. This allows, to a greater extent, to propose solutions to reverse the anthropization of the periurban landscape. In the second case we do not witness such an intense process of this primary maturation, which allowed the beginning of the next phase of anthropization of the periurban territory. This secondary maturation expressed in the polyps model is still very incipient, which allows many alternatives to sustainably maintain the current landscape or even to recover elements transformed by intensive agriculture. However, failing to act now could mean that this environment in the long term may reach future rates of anthropization similar to those of the Huerta de Murcia as a consequence of its increasing accelerated inertia.
5. Conclusions
The transformation of periurban areas in developed countries follows complex patterns that nevertheless can be parameterized and diagnosed numerically. In the three cases studied for the territory known as the “orchard of Europe”, different phenomena have been observed from a comparative point of view using indicators based on GIS tools. This analysis has allowed on the one hand to diagnose the current situation of these mixed-use territories, determining the causes of their current problems. Qualitative analysis and the calculation of static indicators has allowed us to determine the main issues and to comparatively assess the seriousness of the problems in an objective and quantifiable manner. In this way, phenomena such as the structured transformation of the Huerta de Murcia into a kind of chaotic residential city-garden, the clogging caused by the intensive agriculture of the periurban territory in Campo Dalias, or the growing phenomenon in the Campo de Cartagena through the so-called “polyps model” have been diagnosed.
On the other hand, the use of dynamic territorial indicators has established trend patterns which simulate what the future scenario may be for each of the three cases. This has made it possible to emulate the situation of each of the three cases in the framework of a life cycle of the process of transformation of a mixed territory. Thus, we have differentiated the mature case of the Huerta de Murcia (which offers little room to manoeuvre in order to reverse the current trend), of less consolidated cases such as the Campo Dalias or more incipient processes such as the Campo de Cartagena. The latter, despite being in a more advantageous situation, require decisive action to redirect current trends if they do not wish to face the same situation as the first case.
Supplementary Materials
GIS delimitations and subunits of areas analyzed are available online at https://www.mdpi.com/2071-1050/10/6/1820/s1.
Conflicts of Interest
The authors declare no conflict of interest.
References
- Ahmed, N.; Englund, J.-E.; Åhman, I.; Lieberg, M.; Johansson, E. Perception of pesticide use by farmers and neighbors in two periurban areas. Sci. Total Environ. 2011, 412–413, 77–86. [Google Scholar] [CrossRef] [PubMed]
- La Rosa, D.; Privitera, R. Characterization of non-urbanized areas for land-use planning of agricultural and green infrastructure in urban contexts. Landsc. Urban Plan. 2013, 109, 94–106. [Google Scholar] [CrossRef]
- Narain, V. Taken for a ride? Mainstreaming periurban transport with urban expansion policies. Land Use Policy 2017, 64, 145–152. [Google Scholar] [CrossRef]
- Salvati, L.; Zitti, M.; Sateriano, A. Changes in city vertical profile as an indicator of sprawl: Evidence from a Mediterranean urban region. Habitat Int. 2013, 38, 119–125. [Google Scholar] [CrossRef]
- Verdú-Vázquez, A.; Fernández-Pablos, E.; Lozano-Diez, R.V.; López-Zaldívar, Ó. Development of a methodology for the characterization of urban and periurban green spaces in the context of supra-municipal sustainability strategies. Land Use Policy 2017, 69, 75–84. [Google Scholar] [CrossRef]
- Taylor, J.R.; Lovell, S.T. Mapping public and private spaces of urban agriculture in Chicago through the analysis of high-resolution aerial images in Google Earth. Landsc. Urban Plan. 2012, 108, 57–70. [Google Scholar] [CrossRef]
- Inostroza, L.; Baur, R.; Csaplovics, E. Urban sprawl and fragmentation in Latin America: A dynamic quantification and characterization of spatial patterns. J. Environ. Manag. 2013, 115, 87–97. [Google Scholar] [CrossRef] [PubMed]
- Statuto, D.; Cillis, G.; Picuno, P. Analysis of the effects of agricultural land use change on rural environment and landscape through historical cartography and GIS tools. J. Agric. Eng. 2016, 47, 28–39. [Google Scholar] [CrossRef]
- García-Ayllón, S. Rapid development as a factor of imbalance in urban growth of cities in Latin America: A perspective based on territorial indicators. Habitat Int. 2016, 58. [Google Scholar] [CrossRef]
- Chen, L.; Ren, C.; Zhang, B.; Wang, Z.; Liu, M. Quantifying Urban Land Sprawl and its Driving Forces in Northeast China from 1990 to 2015. Sustainability 2018, 10, 188. [Google Scholar] [CrossRef]
- Dai, E.; Wang, Y.; Ma, L.; Yin, L.; Wu, Z. “Urban-Rural” Gradient Analysis of Landscape Changes around Cities in Mountainous Regions: A Case Study of the Hengduan Mountain Region in Southwest China. Sustainability 2018, 10, 1019. [Google Scholar] [CrossRef]
- García-Ayllón, S. GIS Assessment of Mass Tourism Anthropization in Sensitive Coastal Environments: Application to a Case Study in the Mar Menor Area. Sustainability 2018, 12, 1344. [Google Scholar] [CrossRef]
- Duarte, R.; Pinilla, V.; Serrano, A. The water footprint of the Spanish agricultural sector: 1860–2010. Ecol. Econ. 2014, 108, 200–207. [Google Scholar] [CrossRef]
- Garcia-ayllon, S. Geographic Information System (GIS) Analysis of Impacts in the Tourism Area Life Cycle (TALC) of a Mediterranean Resort. Int. J. Tour. Res. 2016, 18, 186–196. [Google Scholar] [CrossRef]
- IMIDA IDERM. Infraestructuras de Datos Espaciales de la Región de Murcia. Available online: http://iderm.imida.es/geoportal/catalog/main/home.page (accessed on 18 March 2018).
- Junta de Andalucia Infraestructuras de Datos Espaciales IDE Andalucia. Available online: http://www.ideandalucia.es/portal/web/ideandalucia/ (accessed on 18 March 2018).
- European Commission INSPIRE. Available online: https://inspire.ec.europa.eu/ (accessed on 18 March 2018).
- European Environment Agency Corine Land Cover. 2012. Available online: https://land.copernicus.eu/pan-european/corine-land-cover/clc-2012 (accessed on 18 March 2018).
- García-Ayllón, S. The Integrated Territorial Investment (ITI) of the Mar Menor as a model for the future in the comprehensive management of enclosed coastal seas. Ocean Coast. Manag. 2018. [Google Scholar] [CrossRef]
- Statuto, D.; Cillis, G.; Picuno, P. Using Historical Maps within a GIS to Analyze Two Centuries of Rural Landscape Changes in Southern Italy. Land 2017, 6, 65. [Google Scholar] [CrossRef]
- Gutiérrez Angonese, J.; Grau, H.R. Assessment of swaps and persistence in land cover changes in a subtropical periurban region, NW Argentina. Landsc. Urban Plan. 2014, 127, 83–93. [Google Scholar] [CrossRef]
- Ode, Å.; Tveit, M.S.; Fry, G. Capturing Landscape Visual Character Using Indicators: Touching Base with Landscape Aesthetic Theory. Landsc. Res. 2008, 33, 89–117. [Google Scholar] [CrossRef]
- Ren, Y.; Yan, J.; Wei, X.; Wang, Y.; Yang, Y.; Hua, L.; Xiong, Y.; Niu, X.; Song, X. Effects of rapid urban sprawl on urban forest carbon stocks: Integrating remotely sensed, GIS and forest inventory data. J. Environ. Manag. 2012, 113, 447–455. [Google Scholar] [CrossRef] [PubMed]
- Stephenson, J. The Cultural Values Model: An integrated approach to values in landscapes. Landsc. Urban Plan. 2008, 84, 127–139. [Google Scholar] [CrossRef]
- Vizzari, M.; Hilal, M.; Sigura, M.; Antognelli, S.; Joly, D. Urban-rural-natural gradient analysis with CORINE data: An application to the metropolitan France. Landsc. Urban Plan. 2018, 171, 18–29. [Google Scholar] [CrossRef]
- European Environment Agency. CLC2006 Technical Guidelines; European Environment Agency: Copenhagen, Demark, 2007; Volume, 2007; Volume 2010, p. 70. [Google Scholar]
- Liu, X.; Zhou, J. Mind the missing links in China’s urbanizing landscape: The phenomenon of broken intercity trunk roads and its underpinnings. Landsc. Urban Plan. 2017, 165, 64–72. [Google Scholar] [CrossRef]
- Ji, W.; Ma, J.; Twibell, R.W.; Underhill, K. Characterizing urban sprawl using multi-stage remote sensing images and landscape metrics. Comput. Environ. Urban Syst. 2006, 30, 861–879. [Google Scholar] [CrossRef]
- García-Ayllón, S. Retro-diagnosis methodology for land consumption analysis towards sustainable future scenarios: Application to a mediterranean coastal area. J. Clean. Prod. 2018. [Google Scholar] [CrossRef]
- Zhang, X.; Skitmore, M.; De Jong, M.; Huisingh, D.; Gray, M. Regenerative sustainability for the built environment—From vision to reality: An introductory chapter. J. Clean. Prod. 2015, 109, 1–10. [Google Scholar] [CrossRef]
- Yue, W.; Liu, Y.; Fan, P. Measuring urban sprawl and its drivers in large Chinese cities: The case of Hangzhou. Land Use Policy 2013, 31, 358–370. [Google Scholar] [CrossRef]
- Van Vliet, J.; de Groot, H.L.F.; Rietveld, P.; Verburg, P.H. Manifestations and underlying drivers of agricultural land use change in Europe. Landsc. Urban Plan. 2015, 133, 24–36. [Google Scholar] [CrossRef]
- Estrella, E. García-Ayllón La evolución urbana de la ciudad de Murcia entorno al rio Segura. Rev. Obras Publicas 2012, 3941, 69–82. [Google Scholar]
- Ros, M.; Sanz, J.P.; García, F. Periurban land management in the garden of Murcia. In Proceedings of the First National Congress of Applied Research Building Management, Alicante, Spain, 28–30 June 2010. [Google Scholar]
- Barbero-Sierra, C.; Marques, M.J.; Ruíz-Pérez, M. The case of urban sprawl in Spain as an active and irreversible driving force for desertification. J. Arid Environ. 2013, 90, 95–102. [Google Scholar] [CrossRef]
- Galdeano-Gómez, E.; Aznar-Sánchez, J.A.; Pérez-Mesa, J.C.; Piedra-Muñoz, L. Exploring Synergies among Agricultural Sustainability Dimensions: An Empirical Study on Farming System in Almería (Southeast Spain). Ecol. Econ. 2017, 140, 99–109. [Google Scholar] [CrossRef]
- Daniele, L.; Vallejos, Á.; Corbella, M.; Molina, L.; Pulido-Bosch, A. Hydrogeochemistry and geochemical simulations to assess water–rock interactions in complex carbonate aquifers: The case of Aguadulce (SE Spain). Appl. Geochem. 2013, 29, 43–54. [Google Scholar] [CrossRef]
- Veolia. Campo Dalías desalination plant—One of the largest in Europe. Membr. Technol. 2016, 2016, 9. [Google Scholar] [CrossRef]
- García-Ayllón, S. Diagnosis of complex coastal ecological systems: Environmental GIS analysis of a highly stressed Mediterranean lagoon through spatiotemporal indicators. Ecol. Indic. 2017, 83. [Google Scholar] [CrossRef]
- García-Ayllón, S. La Manga case study: Consequences from short-term urban planning in a tourism mass destiny of the Spanish Mediterranean coast. Cities 2015, 43, 141–151. [Google Scholar] [CrossRef]
Figure 1.
(a) El Ejido—Campo Dalias (upper left), (b) Huerta de Murcia (bottom right) and (c) Campo de Cartagena—Mar Menor (bottom left) agricultural areas in Mediterranean South-Eastern Spain.
Figure 1.
(a) El Ejido—Campo Dalias (upper left), (b) Huerta de Murcia (bottom right) and (c) Campo de Cartagena—Mar Menor (bottom left) agricultural areas in Mediterranean South-Eastern Spain.

Figure 2.
Schematized summary of the methodology presented.

Figure 3.
Huerta de Murcia context: (a.1) Extension of the area and subunits directly linked to the city of Murcia and (a.2) example of its landscape value (up), (b) scheme of the ditch network around the city and its satellite small urban settlements (bottom left) and (c.1,c.2) traditional hydraulic infrastructures existing since the Muslim period (bottom right).

Figure 4.
(a) Inertial analysis of land transformation inertias in the Huerta de Murcia: on the left compression trends of the urban areas (lilac) to the orchard (green areas). The most intense growth flows of the city over the orchard are shown in red. (b) On the right, visualization of traditional housing of Huerta landscape (b.1 and b.2, up) vs. current mixed landscape trends of periurban transformation (b.3–b.8, down).

Figure 5.
Barrier effect (dotted line in red) of A-30 highway preventing urban sprawl growth to the East (left) and industrial estate developed together with MU-31 road (right).
Figure 5.
Barrier effect (dotted line in red) of A-30 highway preventing urban sprawl growth to the East (left) and industrial estate developed together with MU-31 road (right).

Figure 6.
(a) Evolutionary process of a periurban example of the Huerta de Murcia throughout the years 1956, 1981, 1999 and 2016 (up) and (b) schematization of “structured oil stain” urbanization model (down).
Figure 6.
(a) Evolutionary process of a periurban example of the Huerta de Murcia throughout the years 1956, 1981, 1999 and 2016 (up) and (b) schematization of “structured oil stain” urbanization model (down).

Figure 7.
El Ejido—Campo Dalias area: (a) observed from outer space (upper left), (b) nearby desert area of Tabernas (upper right), (c) “Plastic Sea” view of greenhouses developed to the coastal edge (bottom left) and (d) horticultural products developed in greenhouses (bottom right). Source: [16].
Figure 7.
El Ejido—Campo Dalias area: (a) observed from outer space (upper left), (b) nearby desert area of Tabernas (upper right), (c) “Plastic Sea” view of greenhouses developed to the coastal edge (bottom left) and (d) horticultural products developed in greenhouses (bottom right). Source: [16].

Figure 8.
(a) Evolutionary process of transformation in El Ejido—Campo Dalias area throughout the years 1970, 1984, and 2016 (a.1, a.2 and a.3). (b) Detail of Roquetas de Mar village, (c) El Ejido town and (d) natural area of salt marshes close to greenhouses enclosing Saint Agustin town. Source: [16].

Figure 9.
(a) Agricultural plots around the Mar Menor lagoon. (b) Traditional landscape of rainfed agriculture on terraces in the Campo de Cartagena in the 1950s. (c) Current landscape of irrigation-intensive agriculture of horticultural products (c.1) that reach the lagoon (c.2).
Figure 9.
(a) Agricultural plots around the Mar Menor lagoon. (b) Traditional landscape of rainfed agriculture on terraces in the Campo de Cartagena in the 1950s. (c) Current landscape of irrigation-intensive agriculture of horticultural products (c.1) that reach the lagoon (c.2).

Figure 10.
La Manga del Mar Menor: (a) ancient sandy bar separating the Mar Menor and the Mediterranean Sea in the 1950s (left) vs. (b) current urban landscape after urbanization process associated to mass tourism (right).
Figure 10.
La Manga del Mar Menor: (a) ancient sandy bar separating the Mar Menor and the Mediterranean Sea in the 1950s (left) vs. (b) current urban landscape after urbanization process associated to mass tourism (right).

Figure 11.
(a) Aerial and (b) ground level view of one of the tourism resorts in the area. (c) Schematization of the polyp model of growth for resorts: urban settlements in black, road infrastructures in red and tourism resorts in green. (d) Map of resorts currently built and planned for the future in the Campo de Cartagena area.

Figure 12.
Detail of the main urban configurations found in the sample analyzed for the western orchard (left) and the eastern orchard (right). Source: [34].
Figure 12.
Detail of the main urban configurations found in the sample analyzed for the western orchard (left) and the eastern orchard (right). Source: [34].

Figure 13.
Graphical evolution and future simulation (dashed line) of IAT, ICNUC and the integration rate of both between 1950 and 2016 (upper) and the situation of each case study in a hypothetical classic three-phase life-cycle graphic (lower).
Figure 13.
Graphical evolution and future simulation (dashed line) of IAT, ICNUC and the integration rate of both between 1950 and 2016 (upper) and the situation of each case study in a hypothetical classic three-phase life-cycle graphic (lower).

Figure 14.
GIS location in the Huerta of Murcia of agricultural plots with a size greater than 5000 m2 and the possibility of being built on.
Figure 14.
GIS location in the Huerta of Murcia of agricultural plots with a size greater than 5000 m2 and the possibility of being built on.


Table 1.
Evolution of the Huerta de Murcia area in terms of land transformation and population from 1950 to 2016.
Table 1.
Evolution of the Huerta de Murcia area in terms of land transformation and population from 1950 to 2016.
| 1950 | 1960 | 1970 | 1981 | 1991 | 2001 | 2011 | 2016 | |
|---|---|---|---|---|---|---|---|---|
| Land transformed (km2) | ||||||||
| Huerta de Murcia (HdM) | 526 | 1079 | 1886 | 2782 | 3931 | 6156 | 7832 | 8867 |
| Region of Murcia (RoM) | 4861 | 6415 | 8579 | 10,515 | 14,806 | 28,252 | 54,673 | 55,932 |
| % HdM/RoM | 10.82 | 16.81 | 21.98 | 26.45 | 26.55 | 21.78 | 14.32 | 15.85 |
| Population | ||||||||
| Huerta de Murcia (HdM) | 260,023 | 297,806 | 304,522 | 371,237 | 432,851 | 491,290 | 551,119 | 626,451 |
| Region of Murcia (RoM) | 755,850 | 803,086 | 832,047 | 955,487 | 1,045,601 | 1,190,379 | 1,335,792 | 1,521,354 |
| % HdM/RoM | 34.40 | 37.08 | 36.59 | 38.85 | 41.39 | 41.27 | 41.25 | 41.17 |
Table 2.
Evolution of El Ejido—Campo Dalias area land transformation and population from 1950 to 2016.
Table 2.
Evolution of El Ejido—Campo Dalias area land transformation and population from 1950 to 2016.
| 1950 | 1960 | 1970 | 1981 | 1991 | 2001 | 2011 | 2016 | |
|---|---|---|---|---|---|---|---|---|
| Land transformed (LT, km2) | ||||||||
| Greenhouse surface | 0 | 22 | 436 | 2782 | 6388 | 15,874 | 25,556 | 26,738 |
| Urban surface | 1036 | 1084 | 1517 | 1960 | 3006 | 3852 | 4673 | 4782 |
| LT/Total area (%) | 3.03 | 3.23 | 5.70 | 13.85 | 27.43 | 57.60 | 88.28 | 92.05 |
| Population | ||||||||
| El Ejido city | 3023 | 8064 | 12,199 | 20,458 | 31,201 | 55,710 | 83,774 | 88,752 |
| Roquetas de Mar city | 3811 | 7059 | 12,884 | 18,891 | 26,842 | 50,096 | 82,860 | 91,965 |
| Campo Dalias territory | 8782 | 18,930 | 32,174 | 46,091 | 69,399 | 136,543 | 254,720 | 303,604 |
| Agrifood production (thousands of tons) | ||||||||
| Campo Dalias territory | 32 | 35 | 344 | 817 | 1478 | 2501 | 2749 | 3103 |
Table 3.
Evolution of the Campo de Cartagena area for land transformation and population from 1950 to 2016.
Table 3.
Evolution of the Campo de Cartagena area for land transformation and population from 1950 to 2016.
| 1950 | 1960 | 1970 | 1981 | 1991 | 2001 | 2011 | 2016 | |
|---|---|---|---|---|---|---|---|---|
| Land transformed (LT, km2) | ||||||||
| Irrigation areas (Ha) | 0 | 22 | 436 | 2782 | 6388 | 15,874 | 25,556 | 26,738 |
| Urban surface areas (Ha) | 1036 | 1084 | 1517 | 1960 | 3006 | 3852 | 4673 | 4782 |
| Coastal occupation 1 (%) | 3.03 | 3.23 | 5.70 | 25.85 | 45.43 | 67.60 | 88.28 | 89.05 |
| Tourist resorts | ||||||||
| Resorts built | 0 | 0 | 0 | 1 | 2 | 5 | 17 | 18 |
| Total resorts surface (Ha) | 0 | 0 | 0 | 202 | 391 | 2674 | 5521 | 5714 |
| Population | ||||||||
| Campo de Cartagena | 184,855 | 179,847 | 204,671 | 238,138 | 251,837 | 301,256 | 402,278 | 420,183 |
| Whole Region of Murcia | 755,850 | 803,086 | 832.047 | 955.487 | 1.045,601 | 1,190,379 | 1,335,792 | 1,465,867 |
1 first 500 m. strip.
Table 4.
Summary of results of the indicators for the three cases.
| Huerta de Murcia | Campo Dalias—El Ejido | Campo de Cartagena | |||||||
|---|---|---|---|---|---|---|---|---|---|
| Landscape subunits (Ha) | 12 subunits | Min. | 1560 | 8 subunits | Min. | 1345 | 9 subunits | Min. | 2234 |
| Average | 3050 | Average | 4448 | Average | 4421 | ||||
| Max. | 3978 | Max. | 5770 | Max. | 6051 | ||||
| Static Indicators | |||||||||
| LAR | Bottom | Average | Top | Bottom | Average | Top | Bottom | Average | Top |
| 0.322 | 0.467 | 0.685 | 0.103 | 0.622 | 0.792 | 0.255 | 0.304 | 0.360 | |
| IFA | Bottom | Average | Top | Bottom | Average | Top | Bottom | Average | Top |
| 0.551 | 0.643 | 0.677 | 0.099 | 0.221 | 0.476 | 0.292 | 0.333 | 0.394 | |
| UFI | Bottom | Average | Top | Bottom | Average | Top | Bottom | Average | Top |
| 0.457 | 0.504 | 0.622 | 0.068 | 0.183 | 0.272 | 0.324 | 0.341 | 0.399 | |
| Dynamic Indicators | |||||||||
| LCI | 1956–1981 | 1981–1999 | 1999–2016 | 1956–1981 | 1981–1999 | 1999–2016 | 1956–1981 | 1981–1999 | 1999–2016 |
| 0.776 | 0.612 | 0.414 | 0.921 | 0.878 | 0.824 | 0.901 | 0.857 | 0.710 | |
| Average Ti | 1956–1981 | 1981–1999 | 1999–2016 | 1956–1981 | 1981–1999 | 1999–2016 | 1956–1981 | 1981–1999 | 1999–2016 |
| 0.289 | 0.441 | 0.532 | 0.049 | 0.137 | 0.152 | 0.054 | 0.188 | 0.308 | |
| Average ICNUC | 1956–1981 | 1981–1999 | 1999–2016 | 1956–1981 | 1981–1999 | 1999–2016 | 1956–1981 | 1981–1999 | 1999–2016 |
| 0.421 | 0.585 | 0.689 | 0.022 | 0.026 | 0.029 | 0.045 | 0.108 | 0.309 | |
| Average IAT | 1956–1981 | 1981–1999 | 1999–2016 | 1956–1981 | 1981–1999 | 1999–2016 | 1956–1981 | 1981–1999 | 1999–2016 |
| 0.321 | 0.256 | 0.109 | 0.559 | 0.737 | 0.771 | 0.132 | 0.318 | 0.564 | |
Table 5.
Data from the two samples analyzed of the East and West orchard zones of Huerta de Murcia surface area.
Table 5.
Data from the two samples analyzed of the East and West orchard zones of Huerta de Murcia surface area.
| Sample 1 (West Orchard) | Sample 2 (East Orchard) | ||
|---|---|---|---|
| Analyzed surface | 654,387 m2 | Analyzed surface | 654,387 m2 |
| 1956 | |||
| Artificial surface | 8220 m2 | Artificial surface | 5343 m2 |
| Agricultural area | 563,835 m2 | Agricultural area | 606,911 m2 |
| Number of houses | 201 | Number of houses | 33 |
| Average plot size | 15,600 m2 | Average plot size | 16,300 m2 |
| Road length | 1013 m | Road length | 818 m |
| Cultivated land in use | 555,245 m2 | Cultivated land in use | 592,804 m2 |
| 1956–1981 Average transformation rate | 12.5% | 1956–1981 Average transformation rate | 11.7% |
| 1981 | |||
| Artificial surface | 27,514 m2 | Artificial surface | 9678 m2 |
| Agricultural area | 556,976 m2 | Agricultural area | 601,372 m2 |
| Number of houses | 437 | Number of houses | 65 |
| Average plot size | 7400 m2 | Average plot size | 14,800 m2 |
| Road length | 4844 m | Road length | 1399 m |
| Cultivated land in use | 489,981 m2 | Cultivated land in use | 565,701 m2 |
| 1981–2016 Average transformation rate | 67.3% | 1981–2016 Average transformation rate | 37.6% |
| 2016 | |||
| Artificial surface | 67,165 m2 | Artificial surface | 18,263 m2 |
| Agricultural area | 523,632 m2 | Agricultural area | 597,372 m2 |
| Number of houses | 743 | Number of houses | 108 |
| Average plot size | 1600 m2 | Average plot size | 12,200 m2 |
| Road length | 9673 m | Road length | 4836 m |
| Cultivated land in use | 217,812 m2 | Cultivated land in use | 486,785 m2 |
| Trend transformation rate in 2016 (linearized) | 36.2% | Trend transformation rate in 2016 (linearized) | 29.9% |
© 2018 by the author. Licensee MDPI, Basel, Switzerland. This article is an open access article distributed under the terms and conditions of the Creative Commons Attribution (CC BY) license (http://creativecommons.org/licenses/by/4.0/).
Share and Cite
MDPI and ACS Style
García-Ayllón, S. Predictive Diagnosis of Agricultural Periurban Areas Based on Territorial Indicators: Comparative Landscape Trends of the So-Called “Orchard of Europe”. Sustainability 2018, 10, 1820. https://doi.org/10.3390/su10061820
AMA Style
García-Ayllón S. Predictive Diagnosis of Agricultural Periurban Areas Based on Territorial Indicators: Comparative Landscape Trends of the So-Called “Orchard of Europe”. Sustainability. 2018; 10(6):1820. https://doi.org/10.3390/su10061820
Chicago/Turabian StyleGarcía-Ayllón, Salvador. 2018. "Predictive Diagnosis of Agricultural Periurban Areas Based on Territorial Indicators: Comparative Landscape Trends of the So-Called “Orchard of Europe”" Sustainability 10, no. 6: 1820. https://doi.org/10.3390/su10061820
Note that from the first issue of 2016, this journal uses article numbers instead of page numbers. See further details here.