Design Solutions for Sustainable Construction of Pre Engineered Steel Buildings


Department of Civil Engineering, College of Engineering, King Faisal University, 31982 Hofuf, Alahsa, Saudi Arabia
*
Author to whom correspondence should be addressed.
Sustainability 2018, 10(6), 1761; https://doi.org/10.3390/su10061761
Submission received: 15 April 2018
/
Revised: 23 May 2018
/
Accepted: 25 May 2018
/
Published: 28 May 2018
(This article belongs to the Special Issue Sustainability in Civil Engineering: from Sustainable Materials to Sustainable Cities)
Abstract
:Sustainable construction of ecofriendly infrastructure has been the priority of worldwide researchers. The induction of modern technology in the steel manufacturing industry has enabled designers to get the desired control over the steel section shapes and profiles resulting in efficient use of construction material and manufacturing energy required to produce these materials. The current research study is focused on the optimization of steel building costs with the use of pre-engineered building construction technology. Construction of conventional steel buildings (CSB) incorporates the use of hot rolled sections, which have uniform cross-section throughout the length. However, pre-engineered steel buildings (PEB) utilize steel sections, which are tailored and profiled based on the required loading effects. In this research study, the performance of PEB steel frames in terms of optimum use of steel sections and its comparison with the conventional steel building is presented in detail. A series of PEB and CSB steel frames is selected and subjected to various loading conditions. Frames were analyzed using Finite Element Based analysis tool and design was performed using American Institute of Steel Construction design specifications. Comparison of the frames has been established in terms of frame weights, lateral displacements (sway) and vertical displacements (deflection) of the frames. The results have clearly indicated that PEB steel frames are not only the most economical solution due to lesser weight of construction but also have shown better performance compared to CSB frames.
1. Introduction
Steel construction is growing very rapidly all over the world [1,2,3]. Apart from making the steel building economical in terms of cost, time and quality, experts are also working on making those steel buildings environmentally friendly and green throughout its life-cycle [1,4,5,6].
Overall, steel is an expensive material as compared to the rest but when it comes to the cost-savings during the life span of the structure, steel proves to be a very affordable material [3,7]. Steel can also be made rust proof by the application of special coated paints [2]. Apart from that, steel is an insect and termite resistant material and the maintenance cost is lower during its life span as compared to other materials [8].
Pre-engineered steel buildings prove to be very economical and environmentally friendly as compared to conventional steel frames [5,7]. Pre-engineered steel structures result in reduction in factors that are contributing to global warming and pollution. Pre-engineered steel buildings usually save a lot of landfill space. Pre-engineered steel frames have longer life spans. Once the design life is over, most of the pre-engineered steel buildings end up at a recycling center where they are melted and used for the other purposes rather than being dumped at the local available land/ground, thus reducing construction and demolition waste [8].
Construction of pre-engineered steel buildings saves energy, and, as a result of that, it cuts down on heating and cooling bills. There is much less chance of error during construction of pre-engineered buildings as everything is pre-fabricated in the factory to an accuracy of millimeters [9,10]. Once constructed, there is very little chance that the steel frames will creep and loosen with the passage of time, windows and doors that are framed within jambs and headers inside the building continue to remain tightly shut, and, as a result, the chances of air leaks are very minimal.
Pre-engineered design is a new terminology where the excess steel is avoided by tapering the sections as per the bending moment’s envelope [9]. The section-moment simulation method results in lightweight structural members, which mainly contribute to the reduction of weight and cost of the structure. PEBs are designed and fabricated in the factory, then transported to the construction site in a completely knocked down condition and all structural components are assembled and erected with nut-bolts on site as per the construction plan, thereby reducing the construction time and wastage as compared to convention steel where structural members are welded on site, thus reducing wastage and energy [7,9,10,11].
Pre-engineering primary framing structure is an assembly of I-shaped structural members. The I-shaped beams are usually formed in the factory by welding steel plates together to form the I-sections. The I-section beams are then assembled on site with bolted connections to form the entire frame of the pre-engineered building. Steel Manufacturers taper the framing members as per the required specifications and design codes to account for the local loading effects. Larger plate dimensions are used in areas where the load effects are higher, whereas the secondary structural elements such as roof purlins, side and end wall girts consist of Cold Formed Z- and C-shaped members [9,10,11].
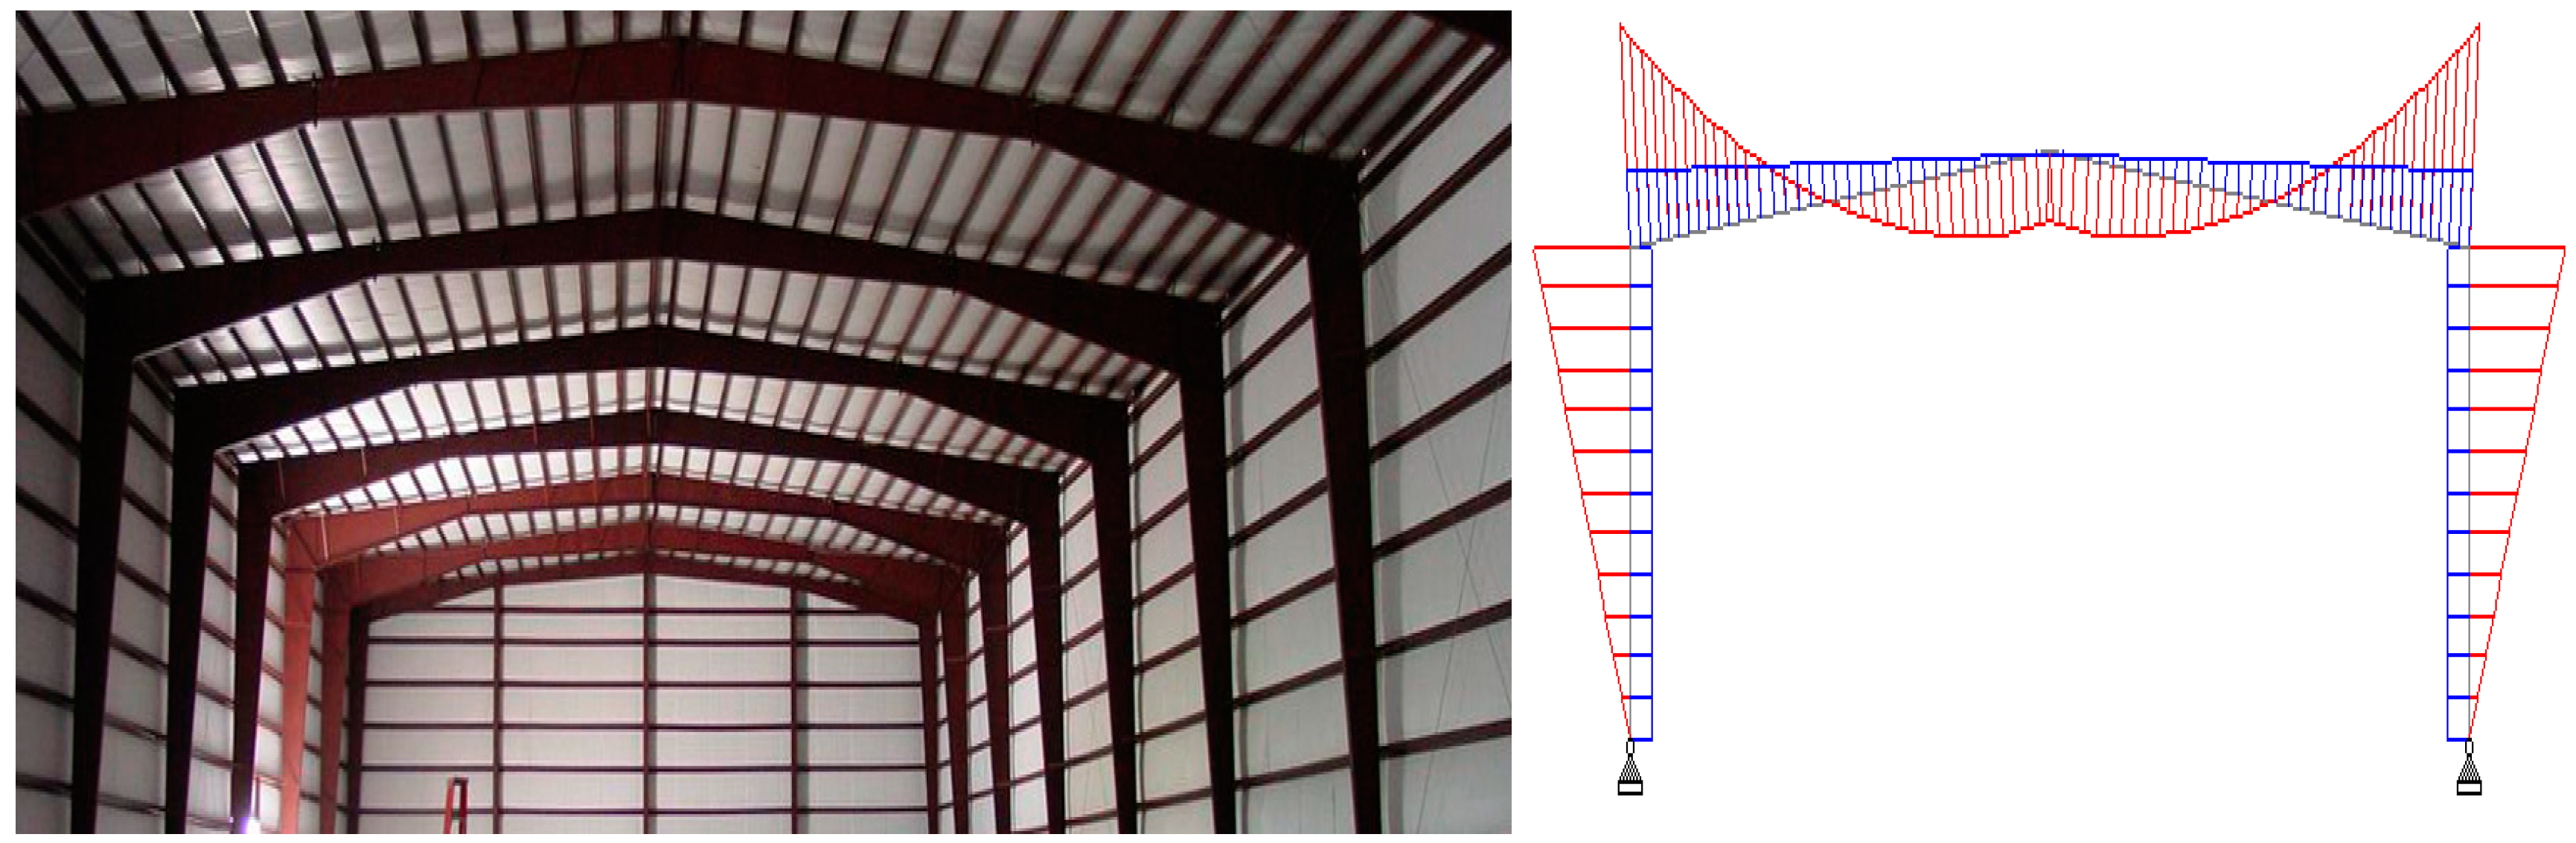
In the construction industry, most of the clients demand longer spans i.e., large spacing between columns along with larger bay spacing in steel buildings so that they can easily locate their racking system, equipment and machinery. The concept of pre-engineered buildings enables for achieving longer spans and large bay spacing values [9]. Design engineers mostly use a method of tapered sections to design pre-engineered steel frames with large spans, thus eliminating excess steel by the method of tapered section, which is as per the shape of the bending Moment Diagram as shown in Figure 1.
In the past, significant research has been done on the design and performance evaluation of hot rolled steel sections, which are used for the construction of Conventional Steel Buildings (CSB) frames. For instance, Ren and Zeng [12] conducted an experimental and numerical study to evaluate the capacity of a various I-shaped hot rolled steel column section by selecting the different slenderness ratios and load eccentricities. Ellobody [13] modeled the buckling behavior of hot rolled steel stiffened and unstiffened hollow slender sections using the Finite Element Method. Dowling et al. developed a design method by using tapered steel portal frames for the industrial buildings located in the United Kingdom and discussed the advantages and role of slender webs in achieving the economy of the steel buildings [14]. Rangelov determined the effective stiffness of slender steel sections for deflection calculations [15]. The feasibility of tapered beam-column joints for the steel construction was elaborated by Šapalas et al. [16] and Deb and Gulati attempted to reduce the weight of CSB truss buildings by using genetic algorithms [17]. Saka used genetic algorithms to optimize the design of conventional pitched roof steel frames [18]. Chan et al. determined the nonlinear behavior of pitched roof steel framed when subjected to sequential loading [19]. Horridge and Morris compared the design and cost of CSB low pitched portal frames with pinned-base stanchions, low pitched lattice girders with fixed-base, pitched roof trusses with fixed-base and two-layer space frames with fixed-base [20]. Chan discussed the stability design procedures for the conventional steel structures by evaluating the theory and practice in steel construction [21]. However, there are very few who have opted for PEB steel as an area of research. Saleem et al. [22] optimized the steel weight of PEB buildings by proposing a relationship between an unbraced length ratio of the members and flange slenderness of slender built-up sections. He considered a wide range of steel sections having non-compact and slender flanges and webs. Saleem et al. determined the optimum values of flange and web slenderness to have a minimum weight of a built-up steel section [22]. Wankhade and Pajgade [23] compared between the design procedures of PEB and CSB steel buildings. They effectively convey that PEB structures can be easily designed by simple design procedures in accordance with country standards. In addition, they concluded that PEB structures are more advantageous than CSB structures in terms of cost effectiveness, quality control speed in construction and simplicity in erection. Their paper also imparts simple and economical ideas on preliminary design concepts of PEBs. The concept depicted clarifies the design procedure of a PEB concept. Charkha and Latesh worked on a senior design project specialized in the economization of a steel Building using tapered steel sections. They used a few techniques and used different tapered steel sections to achieve the economic sustainability in an optimum quantity. In addition, they presented a cooperative study of PEB and CSB [24]. Firoz et al. just elaborated on the design procedures for PEB steel buildings [25].
In the recent past, different researchers have compared the PEB steel frames with CSB frames. For instance, Pradip and Lande compared a truss roof conventional building with a PEB frame of 22.0 m width and 7.5 m height and found that PEB structure weight is 35% less than the weight of a conventional CSB truss frame [26]. Shashank and Kulkarni compared a 12.0 m wide steel frame and found that PEB steel frames are 33% lighter than the CSB steel frames [27]. Darshan et al. also performed a similar kind of study using PEB and CSB frames of 20 m width and tried hot rolled tube sections for CSB frames [28]. He found 35% reduction in the PEB frame weight compared to CSB. Thakre et al. and Titiksh et al. just elaborated on the advantages of PEB steel frames with CSB frames [29,30]. Pradeep and Rao compared the forces and moments of a 20 m CSB truss frame with a PEB frame and found it is 26% lighter than the CSB truss frame [31]. Similar kinds of studies were also performed by Takre et al., Pradeep et al. and by Titiksh et al. [29,30,31]. All of the aforementioned research works present the weight comparison for a frame that consists of a single span. However, the percentage reduction in frame weight is a function of frame span, bay spacing and the lateral force effects. Moreover, the aforementioned studies just present the comparison of single PEB and CSB frames in terms of weight and cost only. No information regarding the structural response (sway and deflection), the effect of wind forces and the effect of seismic forces is presented in detail. The current study elaborates on the effect of frame span, bay spacing and lateral forces on the economy achieved by the use of PEB steel frames. In order to achieve these objectives, a detailed study was planned and 48 different frames were analyzed, profiled, designed and optimized. In the first part of the study, spans of the frames (for both CSB and PEB) were varied from 30 m to 35 m, 40 m, 45 m and 50 m and the effect of this variation is monitored in terms of weight, deflection and sideway of the frames and later on these values were also compared with the allowable values of MBMA 2006. In the next part, the bay spacing of the frames varied from 4 m to 5, 6, 7, 8, 9, and 10 m, respectively. In the third and fourth part, the seismic forces and wind forces were gradually varied. The effect of all these variations was compared in terms of weight and deflections.
2. Materials and Methods
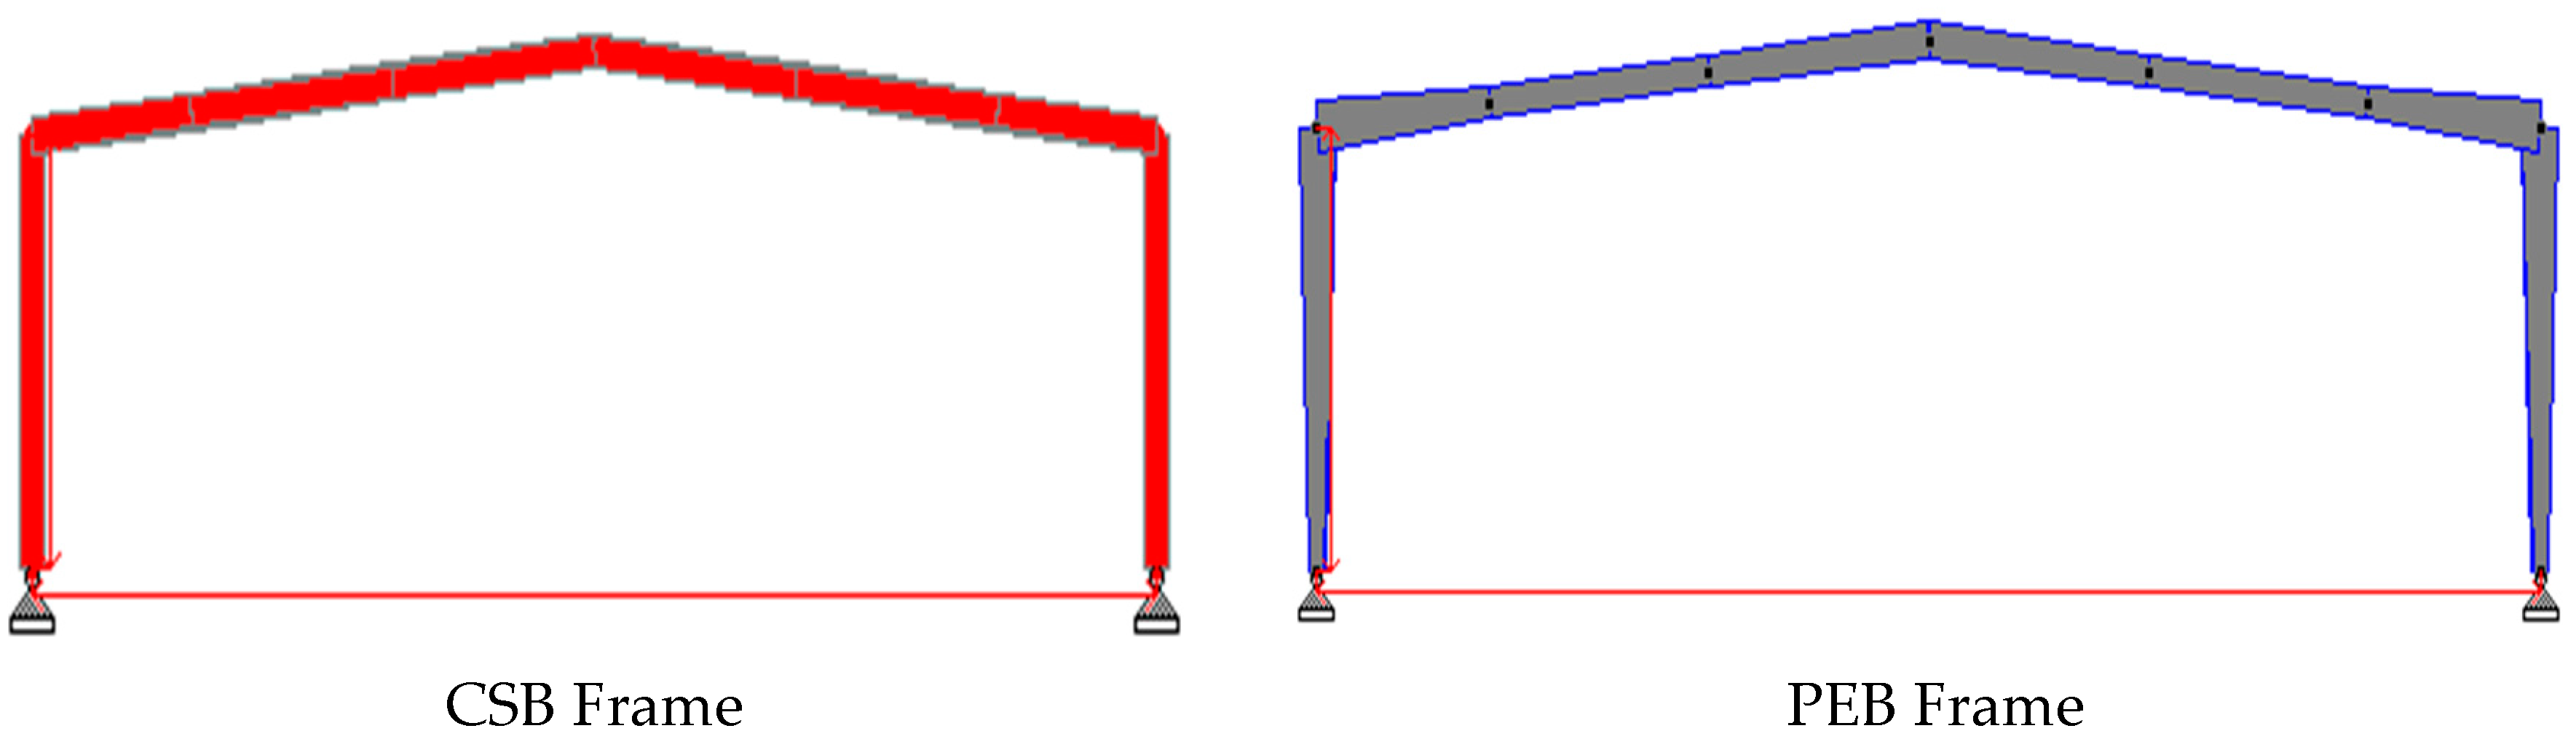
In the present research study, all of the required information such as building layout as well as span lengths and bay-spacing of pre-engineered steel building is decided based upon the most common industrial buildings construction practices in the Middle East or Gulf Region of the world. A detailed study was planned to investigate the behavior of CSB and PEB steel buildings. Different frame spans, bay spacing values, seismic loads and wind forces were the main parameters of the study as given in Table 1. The dead, live and wind loads were calculated using the American Society of Civil Engineers Minimum Design Loads (ASCE/SEI 7-10) [32] and seismic forces were calculated using Uniform Building Code (UBC 97) [33]. The design of the frames was carried using the American Institute of Steel Construction Specification for Structural Steel Buildings (ANSI/AISC 360-10) [34] and all the material strengths were conforming to ASTM A572—15 [35]. The serviceability checks for the lateral displacements and vertical deflections were considered by applying the limiting values proposed by the Metal Building Manufacturing Association (MBMA 2006) [36]. The steel main frames were analyzed and designed by using Finite Element Method based computer software STAAD PRO. The steel frames were subjected to the different load combinations and the frames sections were optimized by using the technique of the bending moment profile. The steel frames were subjected to the load combinations consisting of dead, collateral, live, wind and earthquake as given in Table 2. The steel main frames were analyzed by considering the building under fully enclosed conditions. The research work mainly discusses the comparison between PEB frame and CSB main frames steel weight, lateral displacement (sway) and vertical displacement (deflection). The whole study is comprised of four parts. In the first part, the frame spans were varied from 30 m to 50 m with an interval of 5 m (See Table 1) and the effect of span on the frame weight, sway and deflection was determined. In the second part, the frame span was kept constant at 33 m and the bay spacing is varied from 4 m to 10 m as given in Table 1. In the third and fourth part, the frames were subjected to different seismic forces and wind speeds according to UBC 97 [33] and ASCE/SEI 7-10 [32], respectively. A typical CSB and a PEB frame modelled in STAAD Pro. is shown in Figure 2.
3. Loading
3.1. Dead Load
It includes the self-weight of rigid frames and imposed dead load due to secondary elements like roof sheeting, purlins, insulation, etc. It can be precisely determined by knowing the material properties of the component used in the construction. Generally, the self-weight of structural members is assumed to be 10% of the total dead load acting on it. To achieve accurate results, the self-weight of structural members is computed by STAAD Pro. In this study, a DL of 0.15 kN/m2 is considered.
3.2. Collateral Load
Collateral load is an additional weight that generates from additional permanent materials rather than the structural system, for instance, ceilings, lighting, mechanical shafts and mechanical ducting system. Typical values range from 0.1 to 0.3 kN/m2 [16].
3.3. Live Loads and Roof Live Loads
Live load acting on structural members is due to the moveable equipment and stuff. For pre-engineered buildings, live load is generated on the roof during construction and maintenance work. The corresponding code used for calculating life load is ASCE/SEI 7-10 [32]. This code specifies live load on purlin and sheeting to be 0.96 kN/m2. For the main frame, live load according to the code can be reduced by 30% due to the roof slope and tributary area. This results in a range from 0.57 to 0.6 kN/m2, which is commonly used for the design of main frames as a minimum live load [16].
3.4. Wind Loads
The wind loads acting on main frames are determined in accordance with ASCE/SEI 7-10 [32]. Wind loads are governed by wind speed, roof slope, eave height, exposure category and open wall conditions of the building. Usually, steel buildings are not designed for a wind speed less than 110 km/h.
Wind design pressure p depends on Importance Factor Iw, velocity pressure q and pressure coefficient GCp as calculated by using Equation (1) [16]:
where velocity pressure q is evaluated by using Equation (2):
3.4.1. Wind Exposure Category
Wind exposure category indicates the nature of the topographical conditions that influence the wind speed and intensity. For the current research work, the wind exposure category C is considered. The wind exposures as per ASCE/SEI 7-10 [32] are designated by A, B, C, D letters as described below:
- A: Urban center city locations.
- B: Suburban areas where various types of obstructions are presented such as trees, houses and hills.
- C: Open terrain with scattered obstruction—flat, open country and grasslands.
- D: Exposure to open terrain as in the coastal region.
3.4.2. Wind Enclosure Condition
This condition describes how much the building’s surfaces are enclosed. Briefly, they are described as follows:
- (a)
- Open Building: a building having total surface area at least 80% open. This condition could be expressed by Equation (3):
- (b)
- Partially Enclosed Building: a building provided with the following conditions is considered as partially enclosed building:
- (i)
- The sum of all areas of the openings in a wall that receives positive external pressure exceeds the sum of the areas of openings in the balance of the building envelope (walls and roof) by more than 10%.
- (ii)
- The sum of area openings in the building pressure exceeds 1% percent of the total surface area.
These conditions are expressed by the following Equation (4): - (c)
- Enclosed Building: a building that does not meet the requirements for open or partially enclosed buildings. For the current research study, the enclosed building conditions are considered.
3.5. Earthquake Load Calculation
UBC-97 [17] commonly specialized in seismic load calculations. According to the location of seismic zone of the building, with some categories this code provides a number of different coefficients to perform these calculations. According to UBC-97, the total design base shear can be determined by using Equations (5)–(8):
The total force is distributed over the height of the structure in conformance with UBC-97 formulas as given by Equation (9):
The concentrated force Ft at the top, which is in addition to Fn, is determined by Equation (10):
The value of T is the period as 0.7 s or less. The remaining portion of the base shear is distributed over the height of the structure, including level n, according to Equation (11):
3.6. Load Combinations
4. Results and Discussion
4.1. Performance Comparison of CSB and PEB at Varying Span Lengths
4.1.1. Frame Weight Comparison
In order to understand the efficiency of PEB frames in terms of weight and span compared to conventional steel frames, five different span lengths of frames were considered. The same single span rigid frame was used for both PEB and CSB. The bay pacing of the frames was kept constant at 6.0 m and both of the frames were subjected to identical load combinations as given in Table 2. The span lengths of the frames were varied from 30 m to 50 m with an increment interval of 5.0 m. After performing analysis and design for each frame, it has been found that the PEB frame was approximately 32% lighter compared to the CSB frame when 30 m of span length was used for both steel frames as given in Table 3. Table 3 also presents the mean and standard deviation of PEB and CSB frames for different span length. However, the percentage difference was comparatively higher than the smaller span, but the mean percentage reduction of weight in the case of PEB frames remained at 36%. This reduction in frame weight hit the maximum when the span was 40 m. Even at 45 m span, the percentage reduction of the PEB frame weight was 40% compared to the CSB frame. However, in the case of a 35 m span, the percentage reduction was 31% only. The percentage reduction in frame weight is a function of hot rolled section inventory. If in the hot rolled section inventory a suitable lightweight section is available in the series of sections, then the percentage reduction could be small; otherwise, it can increase. However, the average percentage reduction in the case of PEB frames was 36%. Figure 3 presents the variation of the PEB and CSB frame weights under increasing span lengths.
4.1.2. Sway Comparison of the Frames
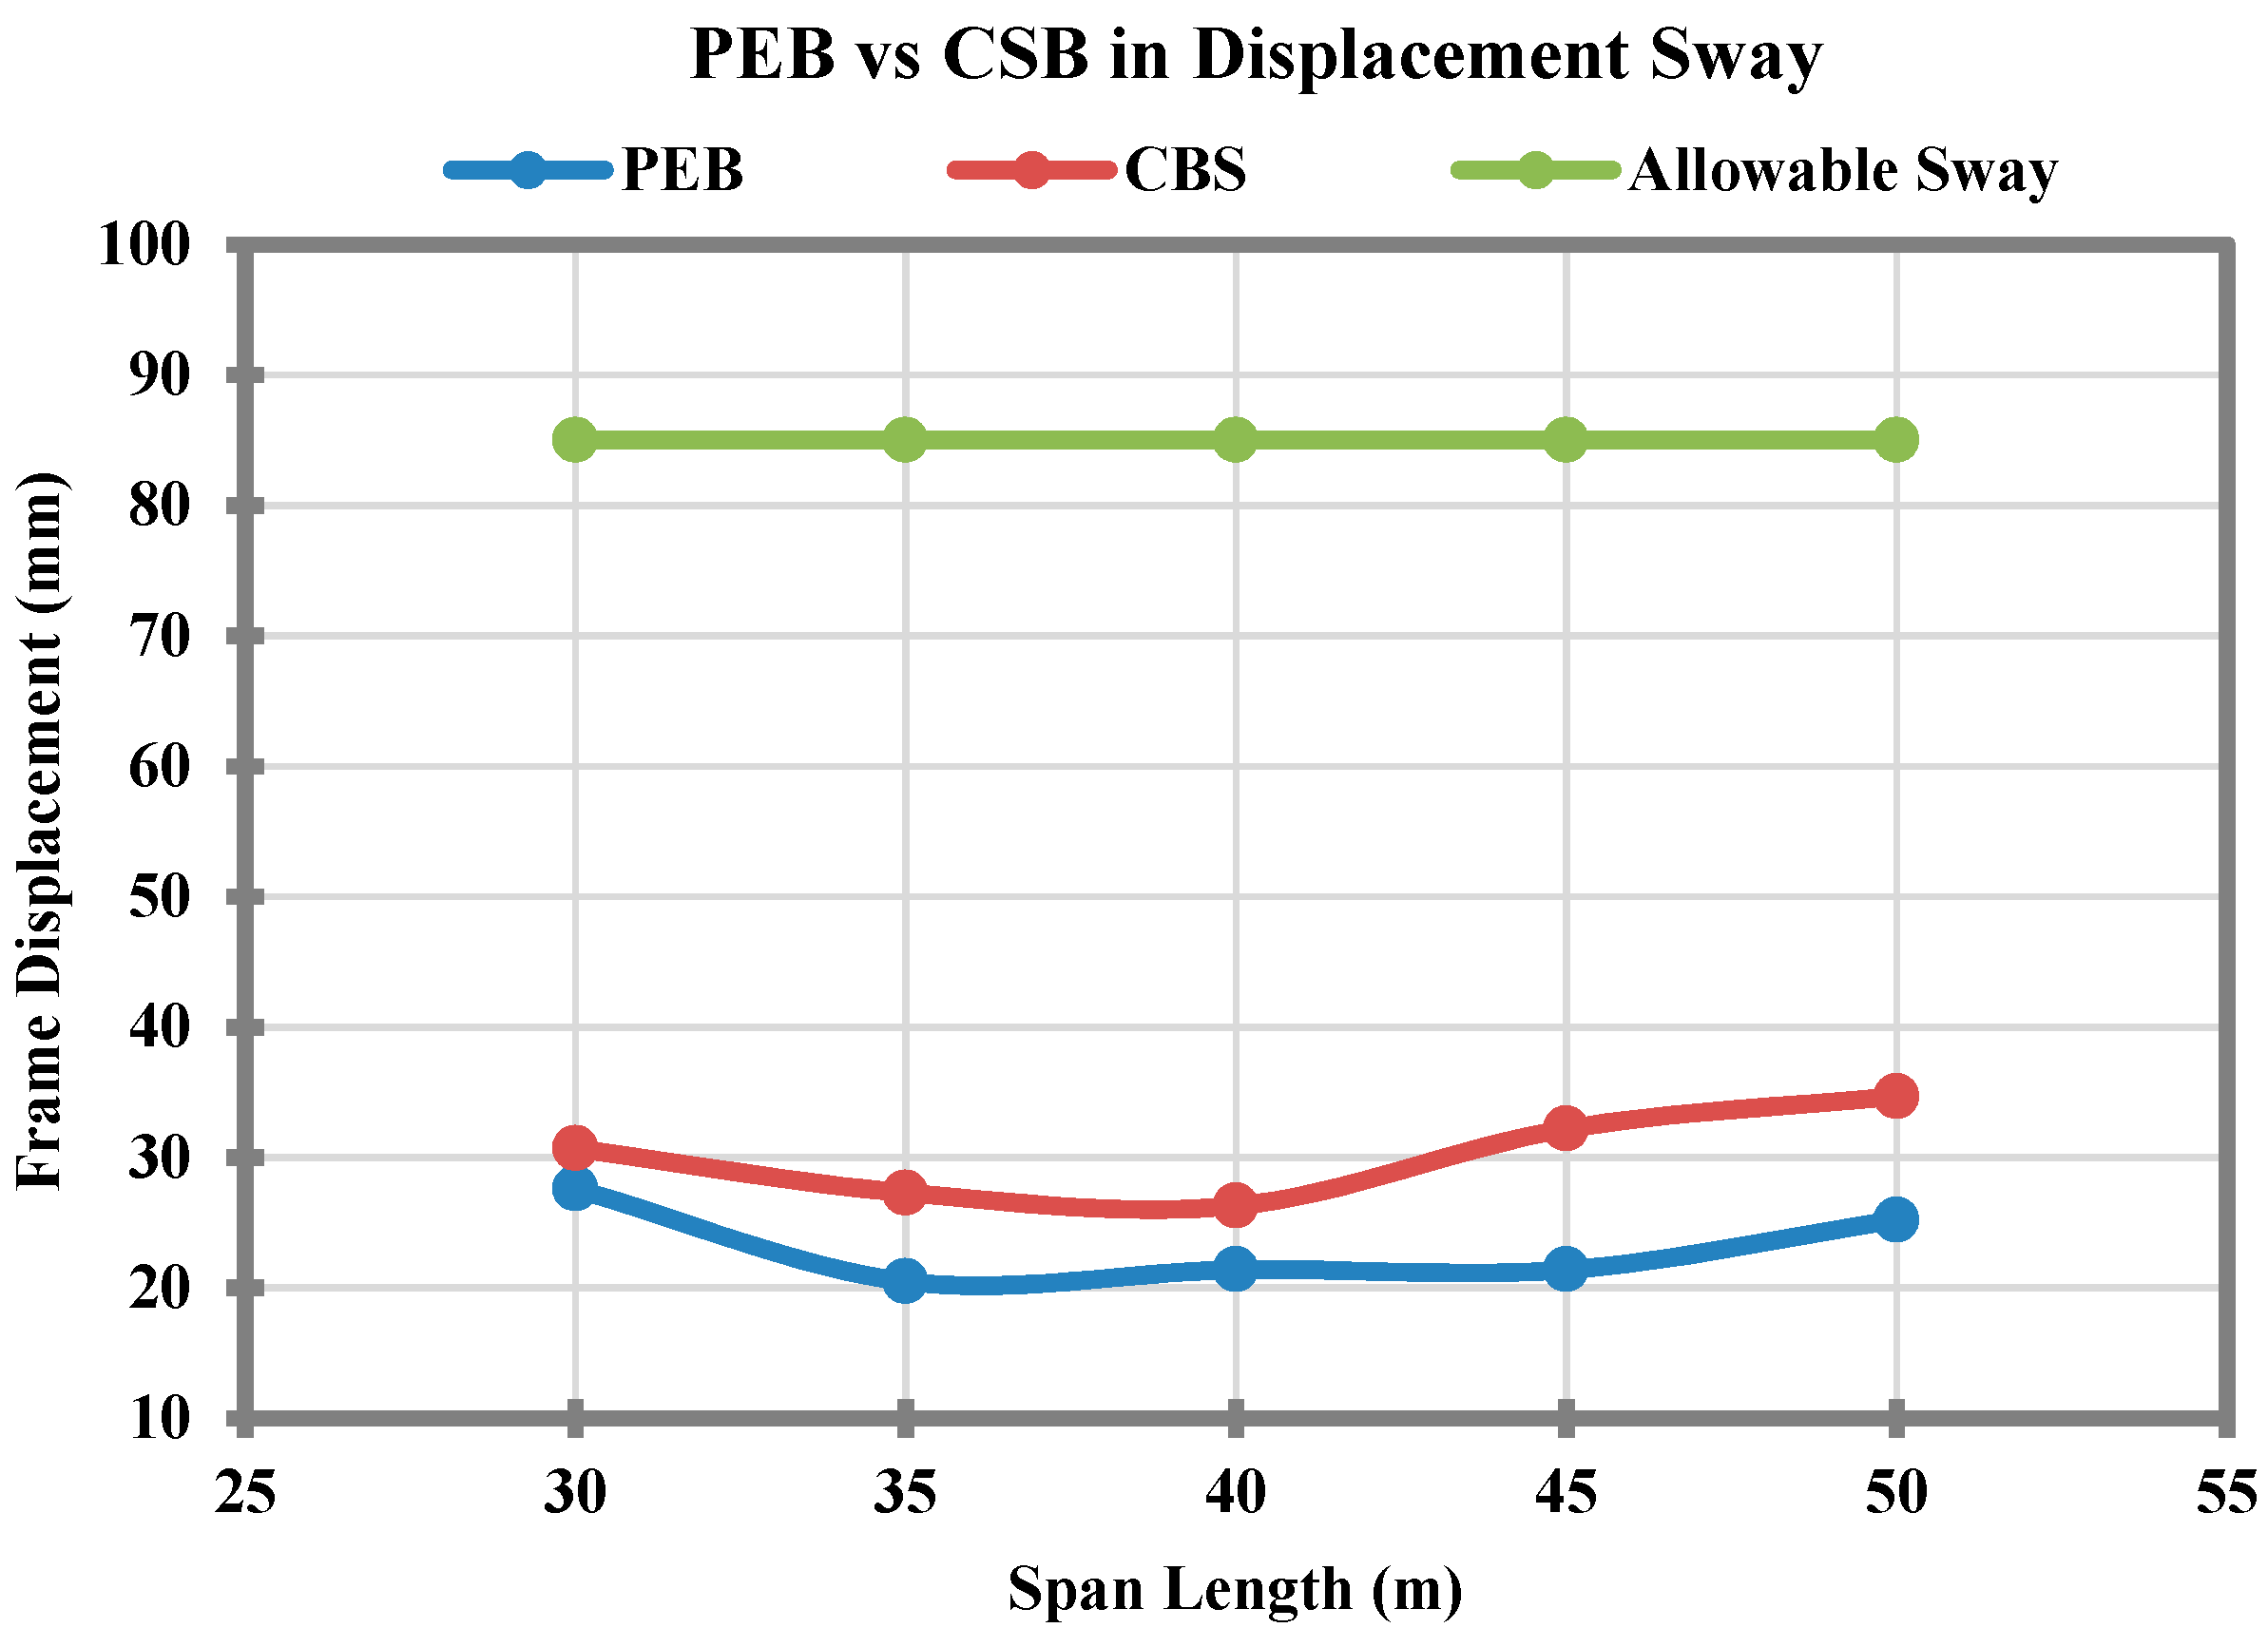
The lateral displacement (sway) of PEB frames is compared to conventional steel frames at five different span lengths of frames. The variation of lateral displacement with respect to different span lengths is shown in Figure 4 and Table 4 gives the percentage difference of lateral displacement between CSB and PEB frames along with their mean values and standard deviations. When the span length was increased from 30 m to 35 m, both CSB and PEB frames have shown a slight decrease in lateral sway. A similar behavior was observed when the span length was further increased from 35 to 40 m. This decrease in lateral displacement is attributed due to the provision of stronger column sections. The lateral displacement in both of the frames remains lower than the allowable frame lateral displacement, which is 82 mm as suggested by the MBMA [36]. CSB frames have shown a significant increase in lateral displacement compared to PEB frames at each span length as shown in Figure 4. The maximum difference in the displacement was observed at 45 m span length as given in Table 4.
4.1.3. Comparison of Frame Deflection
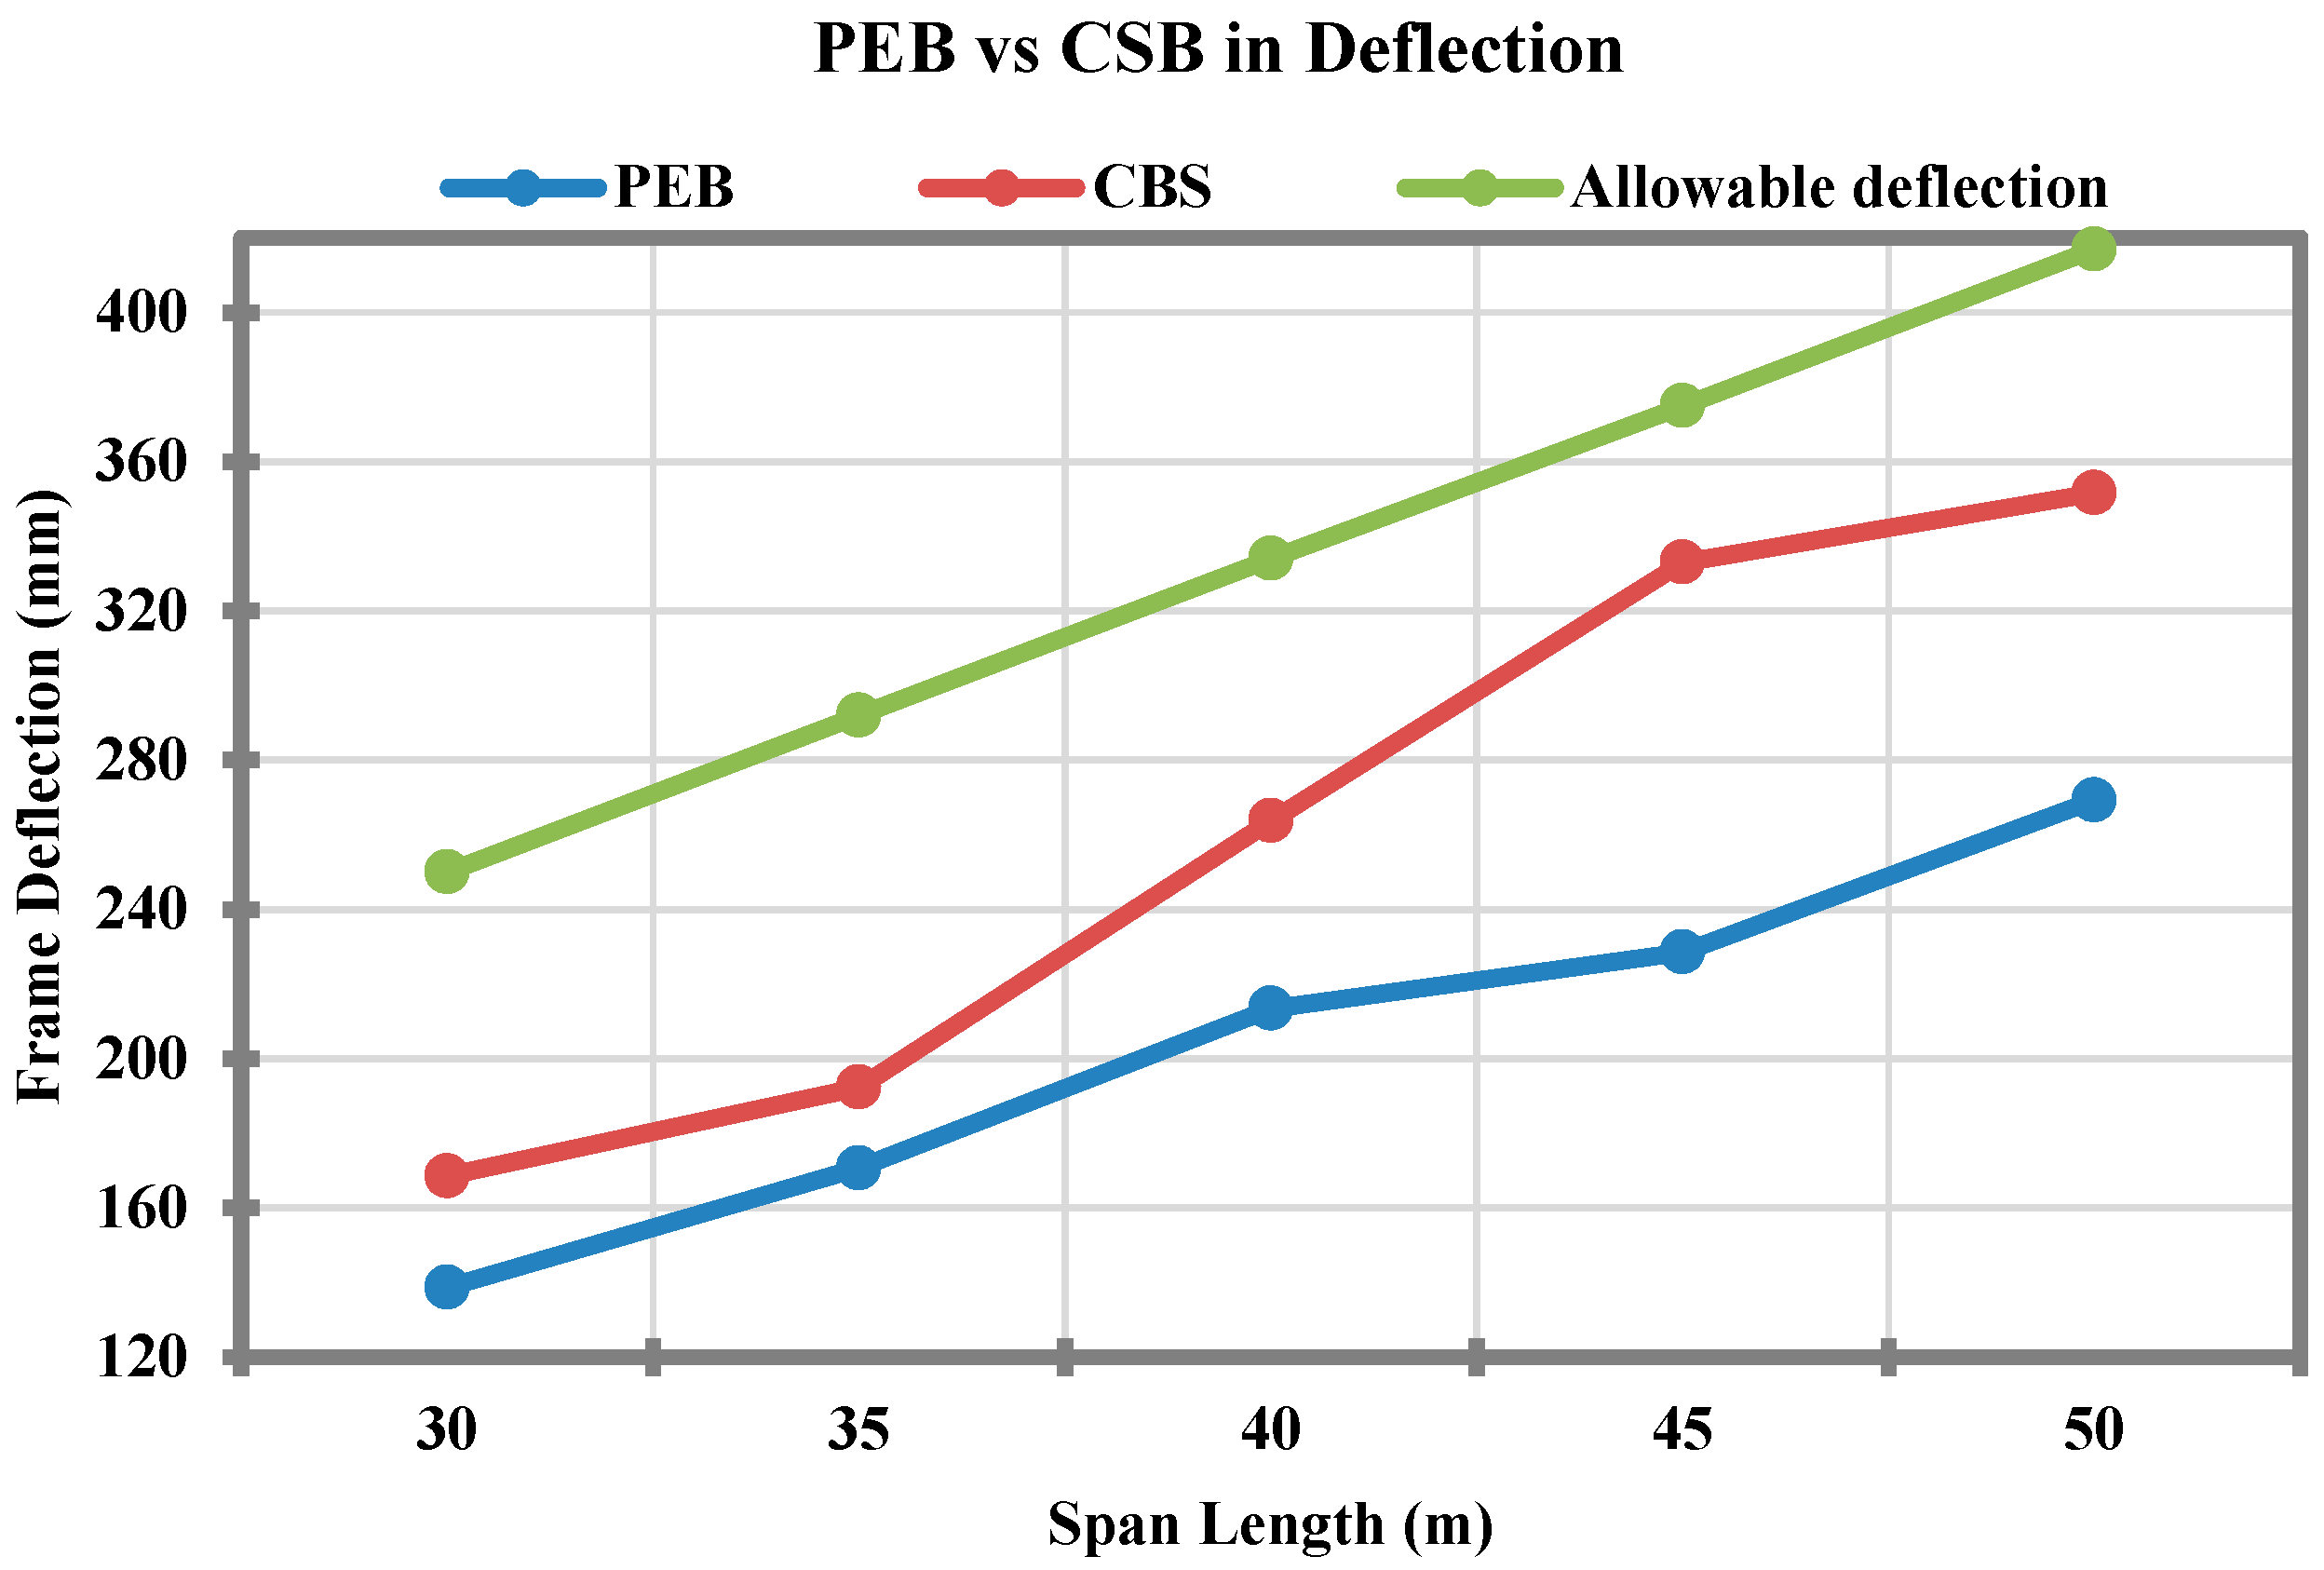
Figure 5 shows the variation of vertical deflection of the CSB and PEB frames at different span lengths. In general, by increasing span length, the deflection of both CSB and PEB frames has increased. In Figure 5, the PEB frames has performed comparatively better than the CSB frames. Table 5 shows the percentage difference of PEB and CSB frame weights and also gives the standard deviation and mean of these frames. The PEB frames has shown a percentage difference of 18% and 11% at a span length of 30 m and 35 m. However, the mean percentage difference of the frame displacement was 20.4 with a standard deviation of 7.33 as given in Table 5. As the span length of the frame increases, this percentage difference also increases, which shows better performance of PEB frames. At a span of 45 m, the CSB frames has shown 31% higher deflection, which is a significant deflection value. However, all of the deflection values were less than the allowable values of deflections as proposed by MBMA (2006) [36]. In the case of PEB frames, the designer has control over the cross section sizes due to the tapering facility of the sections. It allows the designer to provide the higher section depth at mid span or at critical sections of deflections.
4.2. Performance Comparison of CSB and PEB at Different Bay Spacing
4.2.1. Effect on Main Frame Weight
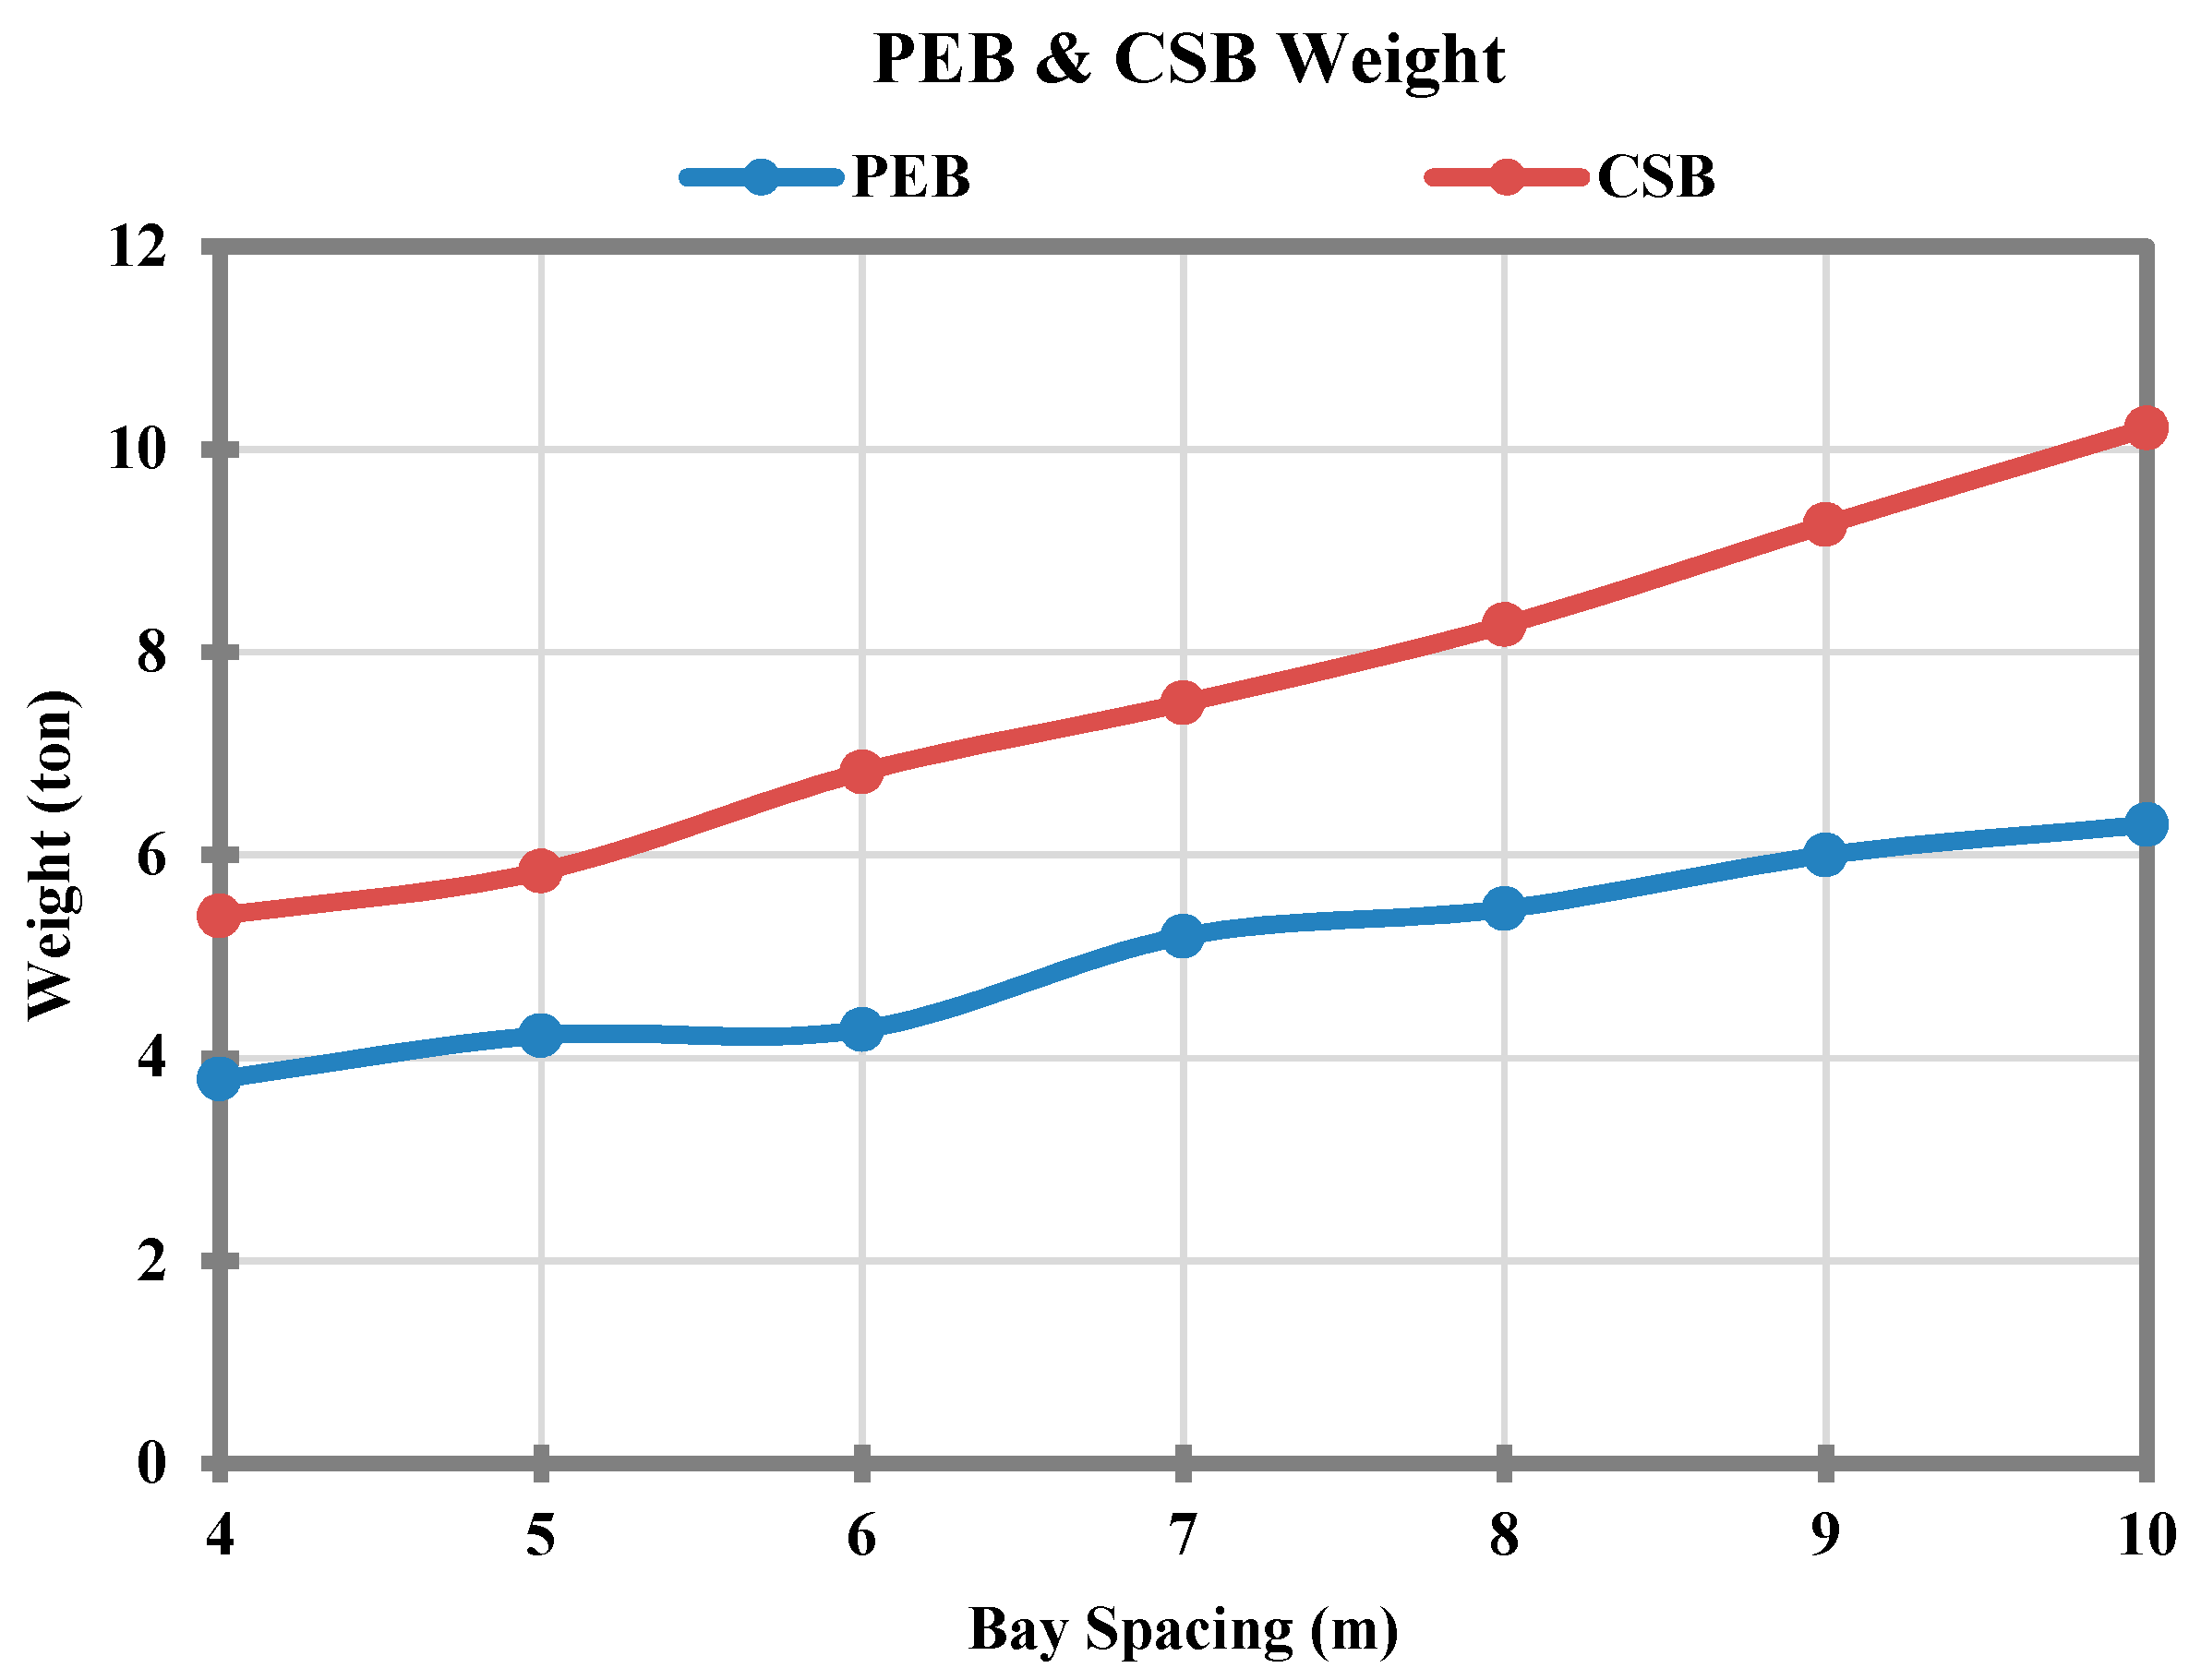
In order to understand the effect of bay spacing on the frame weights, seven different amounts of bay spacing ranging from 4 m to 10 m with an interval of 1.0 m were considered. The span length of both PEB and CSB frame was kept constant at a value of 33 m. In addition, 10 m bay spacing is the maximum bay spacing that is allowed in PEB frames as higher bay spacing can lead to the failure of cold formed steel purlins. The most commonly used bay spacing in the steel frames lies between 6 m and 8.0 m. At each bay spacing, the load on the frames is calculated and applied to each frame. The frames are analyzed, designed and fully optimized based upon the available design sections (for CSB frames) and inventory of steel plates (for PEB frames). Figure 6 and Table 6 give the comparison of CSB and PEB frame weights and their percentage difference. A linear behavior of both frames was observed under increased bay spacing. As the bay spacing increases, the percentage difference in both PEB and CSB frames also increases. At every interval of bay spacing, PEB frames have shown less weight than the CSB frames. At a bay spacing of 10 m, the PEB frame was found to be 38% lighter than the CSB frame, which is a significantly higher value and directly proportional to the savings of the cost. Table 6 shows that the PEB frames were lighter than the CSB frames with a mean percentage difference value of 35% and with a standard deviation of 2.74.
4.2.2. Effect on Lateral Displacement (Sway)
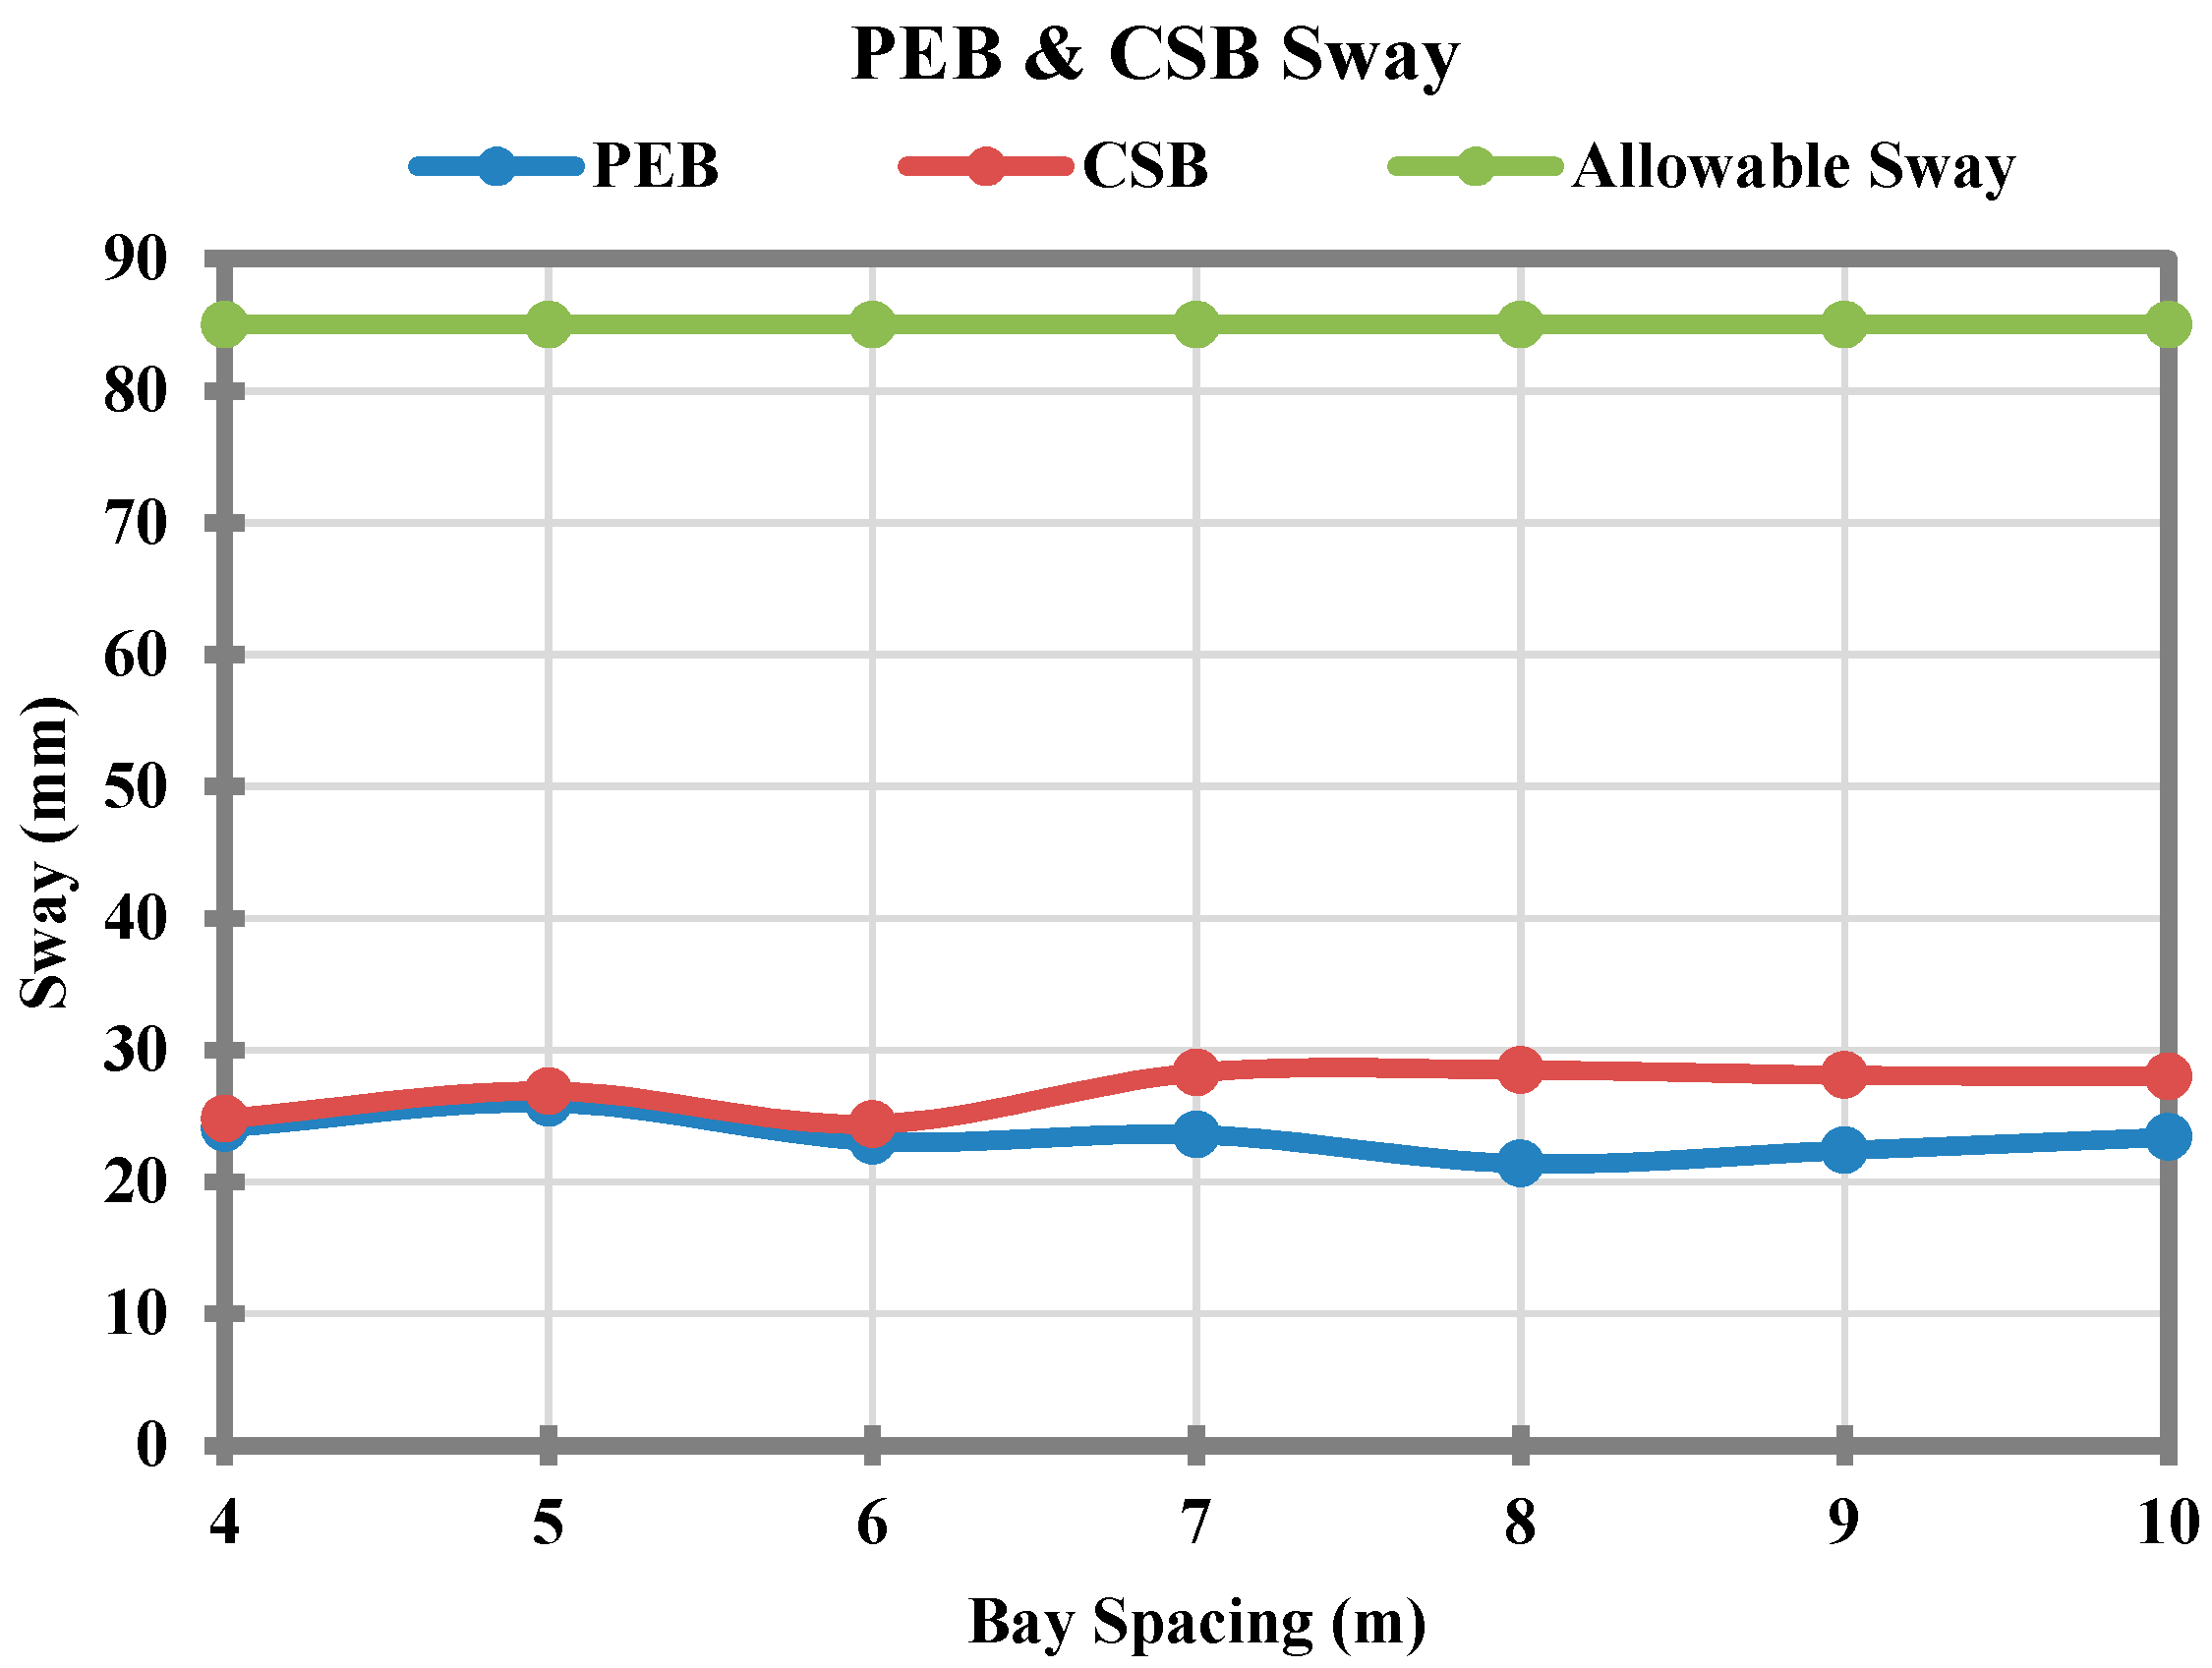
Figure 7 and Table 7 describe the performance of PEB and CSB frames in terms of lateral sway. The variation in bay spacing has much less effect on the in-plane displacements of steel frames. Moreover, the selection of sections also plays a significant role in this regard. A non-uniform trend of frame sways has been observed. As the bay spacing increases from 4 m to 5 m, sway also increases, but, at a bay spacing of 6.0 m, it reduces and a similar kind of trend was also observed when the bay spacing was further increased. This non-uniform behavior is due to the selection of design sections for steel frames. At all bay spacing values, the PEB frames have performed better than the CSB frames. This can be seen from Figure 7 and this difference increases with an increase in bay spacing as shown in Table 7. The mean lateral displacement of CSB frames was found to be higher than the PEB frames with a standard deviation of 1.72.
4.2.3. Comparison in Terms’ Frame Deflection
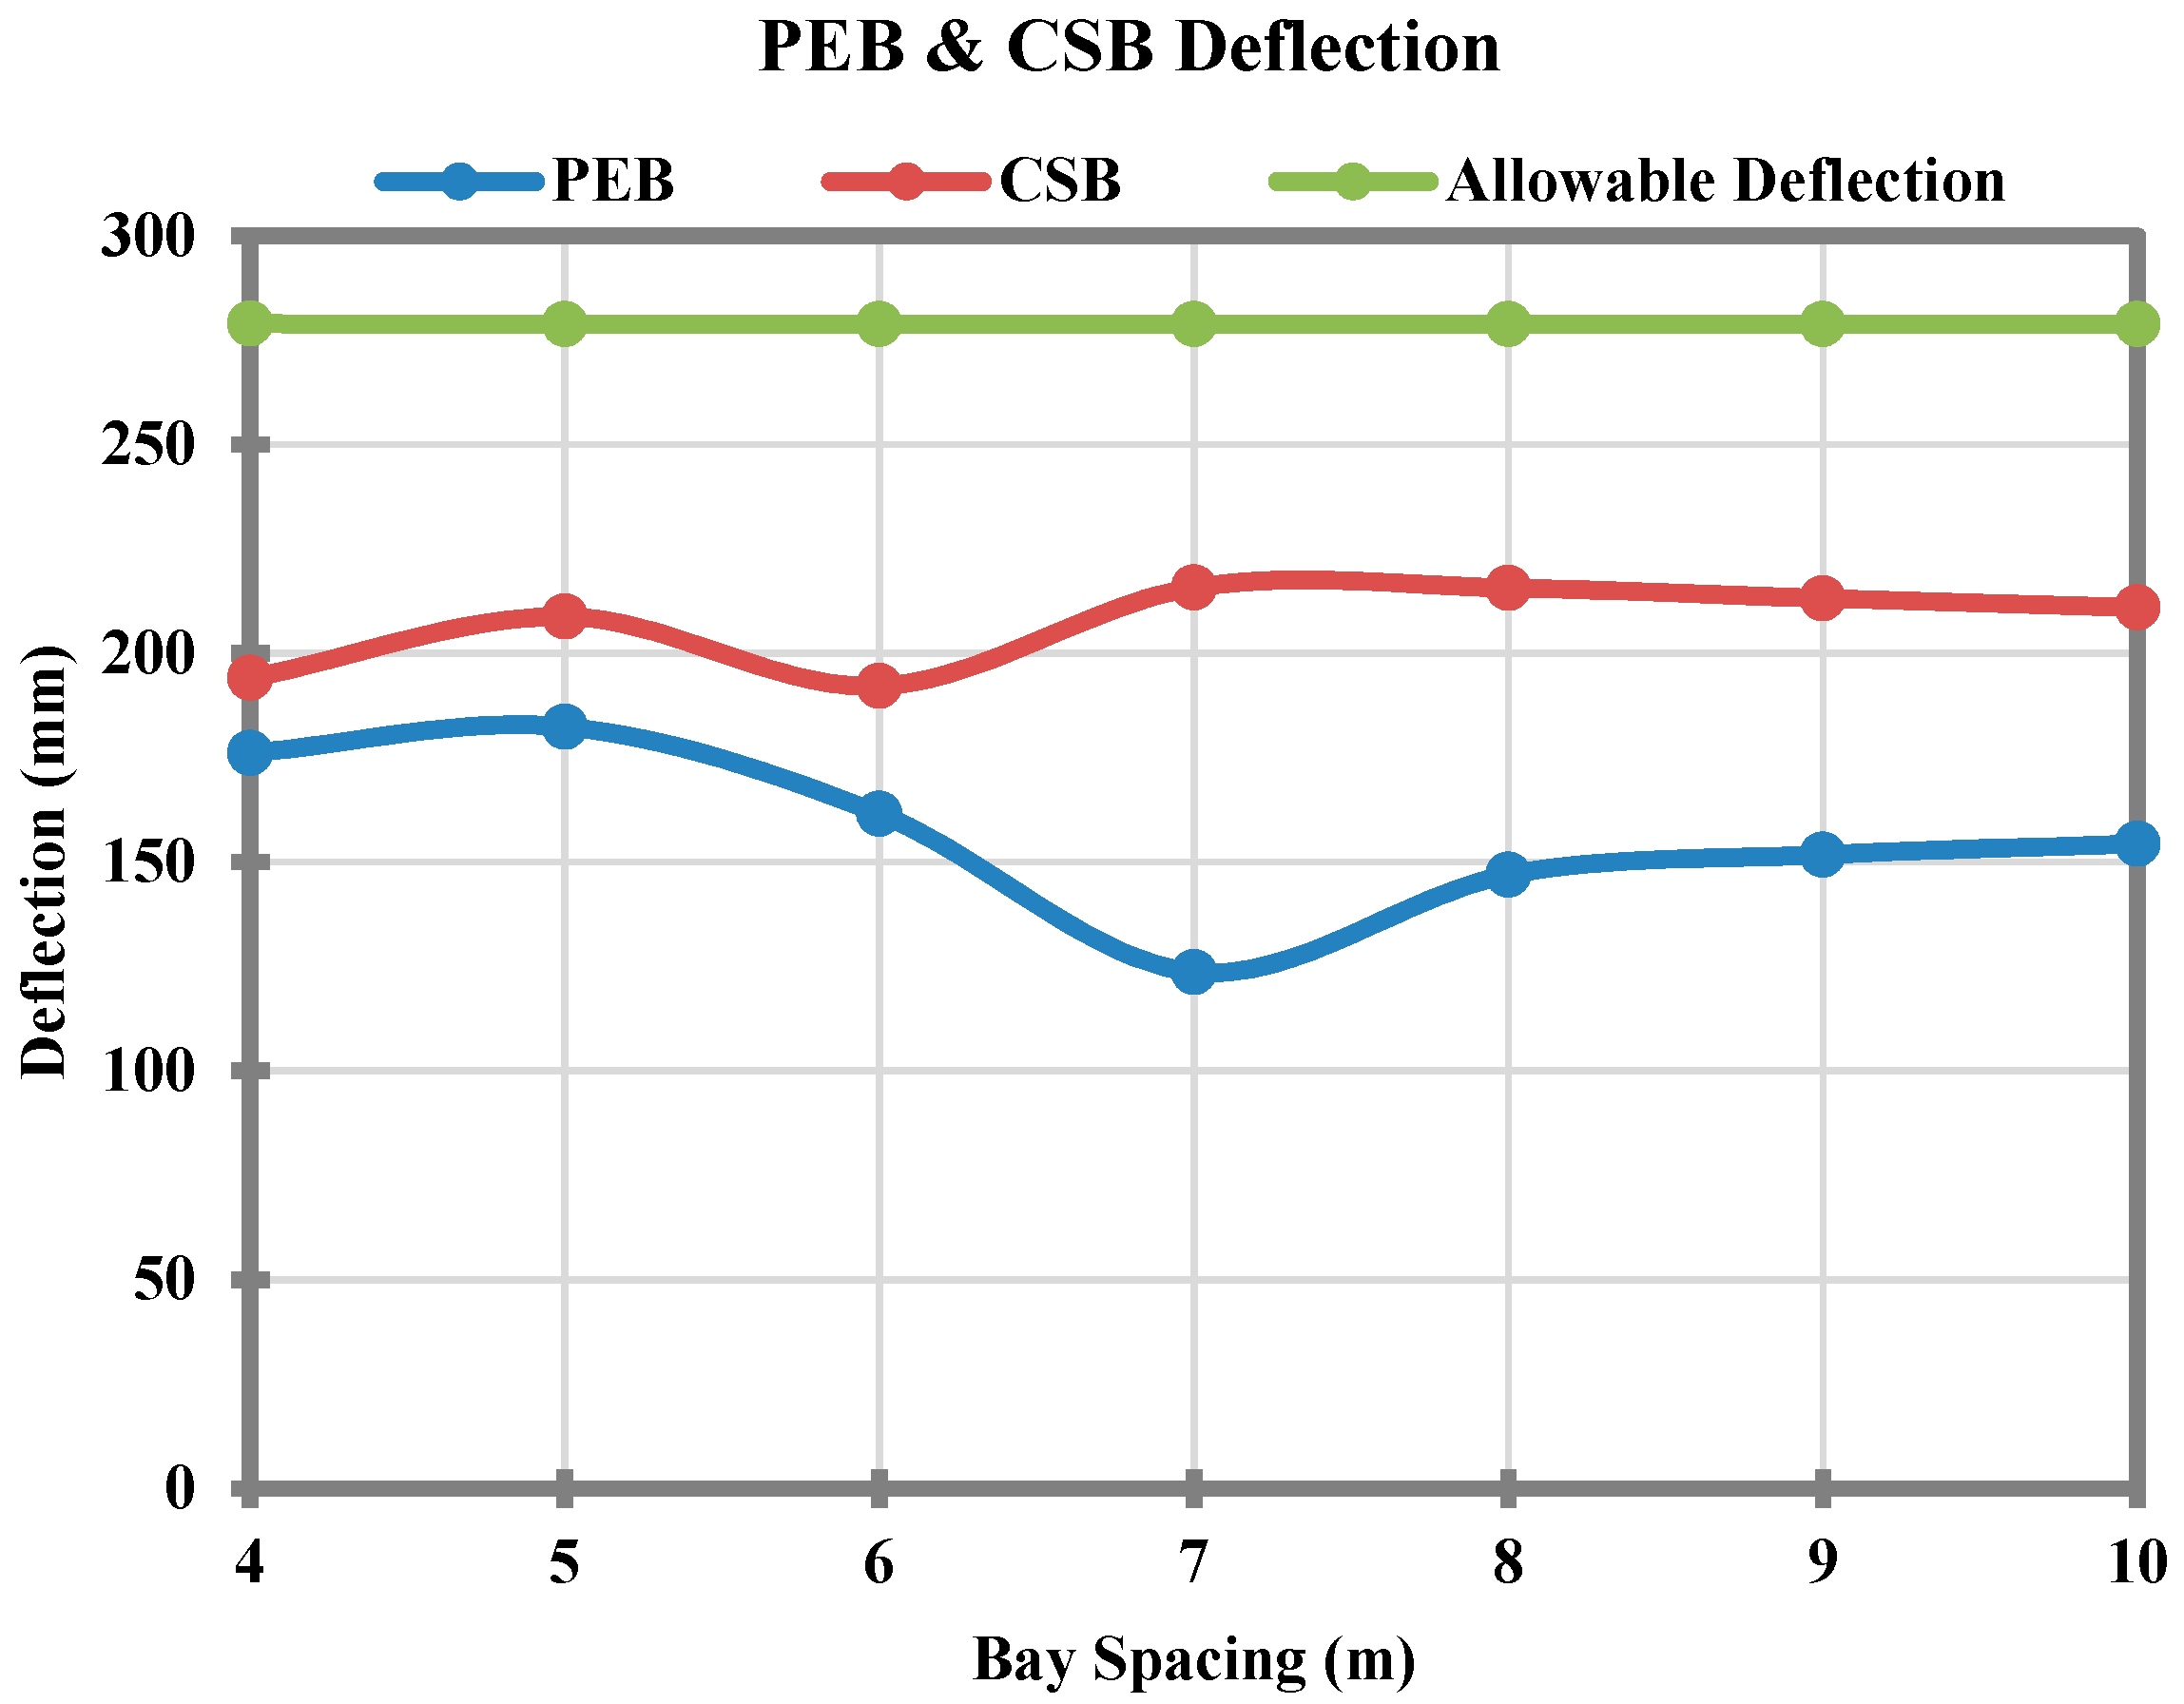
The deflection of CSB and PEB steel frames under varying bay spacing values is shown in Figure 8. Likewise, the lateral sway of both CSB and PEB frames have shown a non-uniform behavior of frame deflection when subjected to varied bay spacing values. However, CSB frames have shown comparatively higher deflection values than the PEB values as shown in Figure 8. The percentage difference is lesser for smaller bay spacing values, whereas it increases as the bay spacing increases beyond 6 m as given in Table 8. Table 8 shows that the CSB frames have 29.4% higher displacement than the PEB frames, whereas the corresponding standard deviation was found equal to 9.71.
4.3. Behaviour of CSB and PEB Frames under Seismic Forces
The performance of steel frames under seismic forces was evaluated by subjecting both types of steel frames to the increasing seismic forces. The earthquake forces were calculated for five seismic zones 1, 2A, 2B, 3 and 4 as given by the UBC (1997) [33]. For both CSB and PEB frames, the span length was kept at 33 m, whereas the bay spacing was kept equal to 6.0 m. CSB and PEB frames were initially designed for zone 1, and, later on, the forces were gradually increased for the rest of the seismic zone. After performing analysis and design for each case, it has been found that, due to lesser self-weight of the steel structures, the earthquake forces did not govern the design. The steel frame designed for earthquake zone 1 has successfully gone through the seismic forces of zones 2A, 2B, 3 and 4 and the frame weight remained constant for both CSB and PEB frames as shown in Figure 9a. However, PEB frame has shown approximately 30% lesser weight than the CSB frame. Figure 9b gives the comparison of lateral sway under increase earthquake forces. In this case, both CSB and PEB frames have shown similar behavior and a very small increase in lateral sway was observed at seismic zone 4. For all seismic zones, the vertical deflection of the CSB frame was restricted to 76 mm, whereas it remained at 69 mm for the PEB steel frame.
4.4. Behaviour of CSB and PEB Frames under Wind Forces
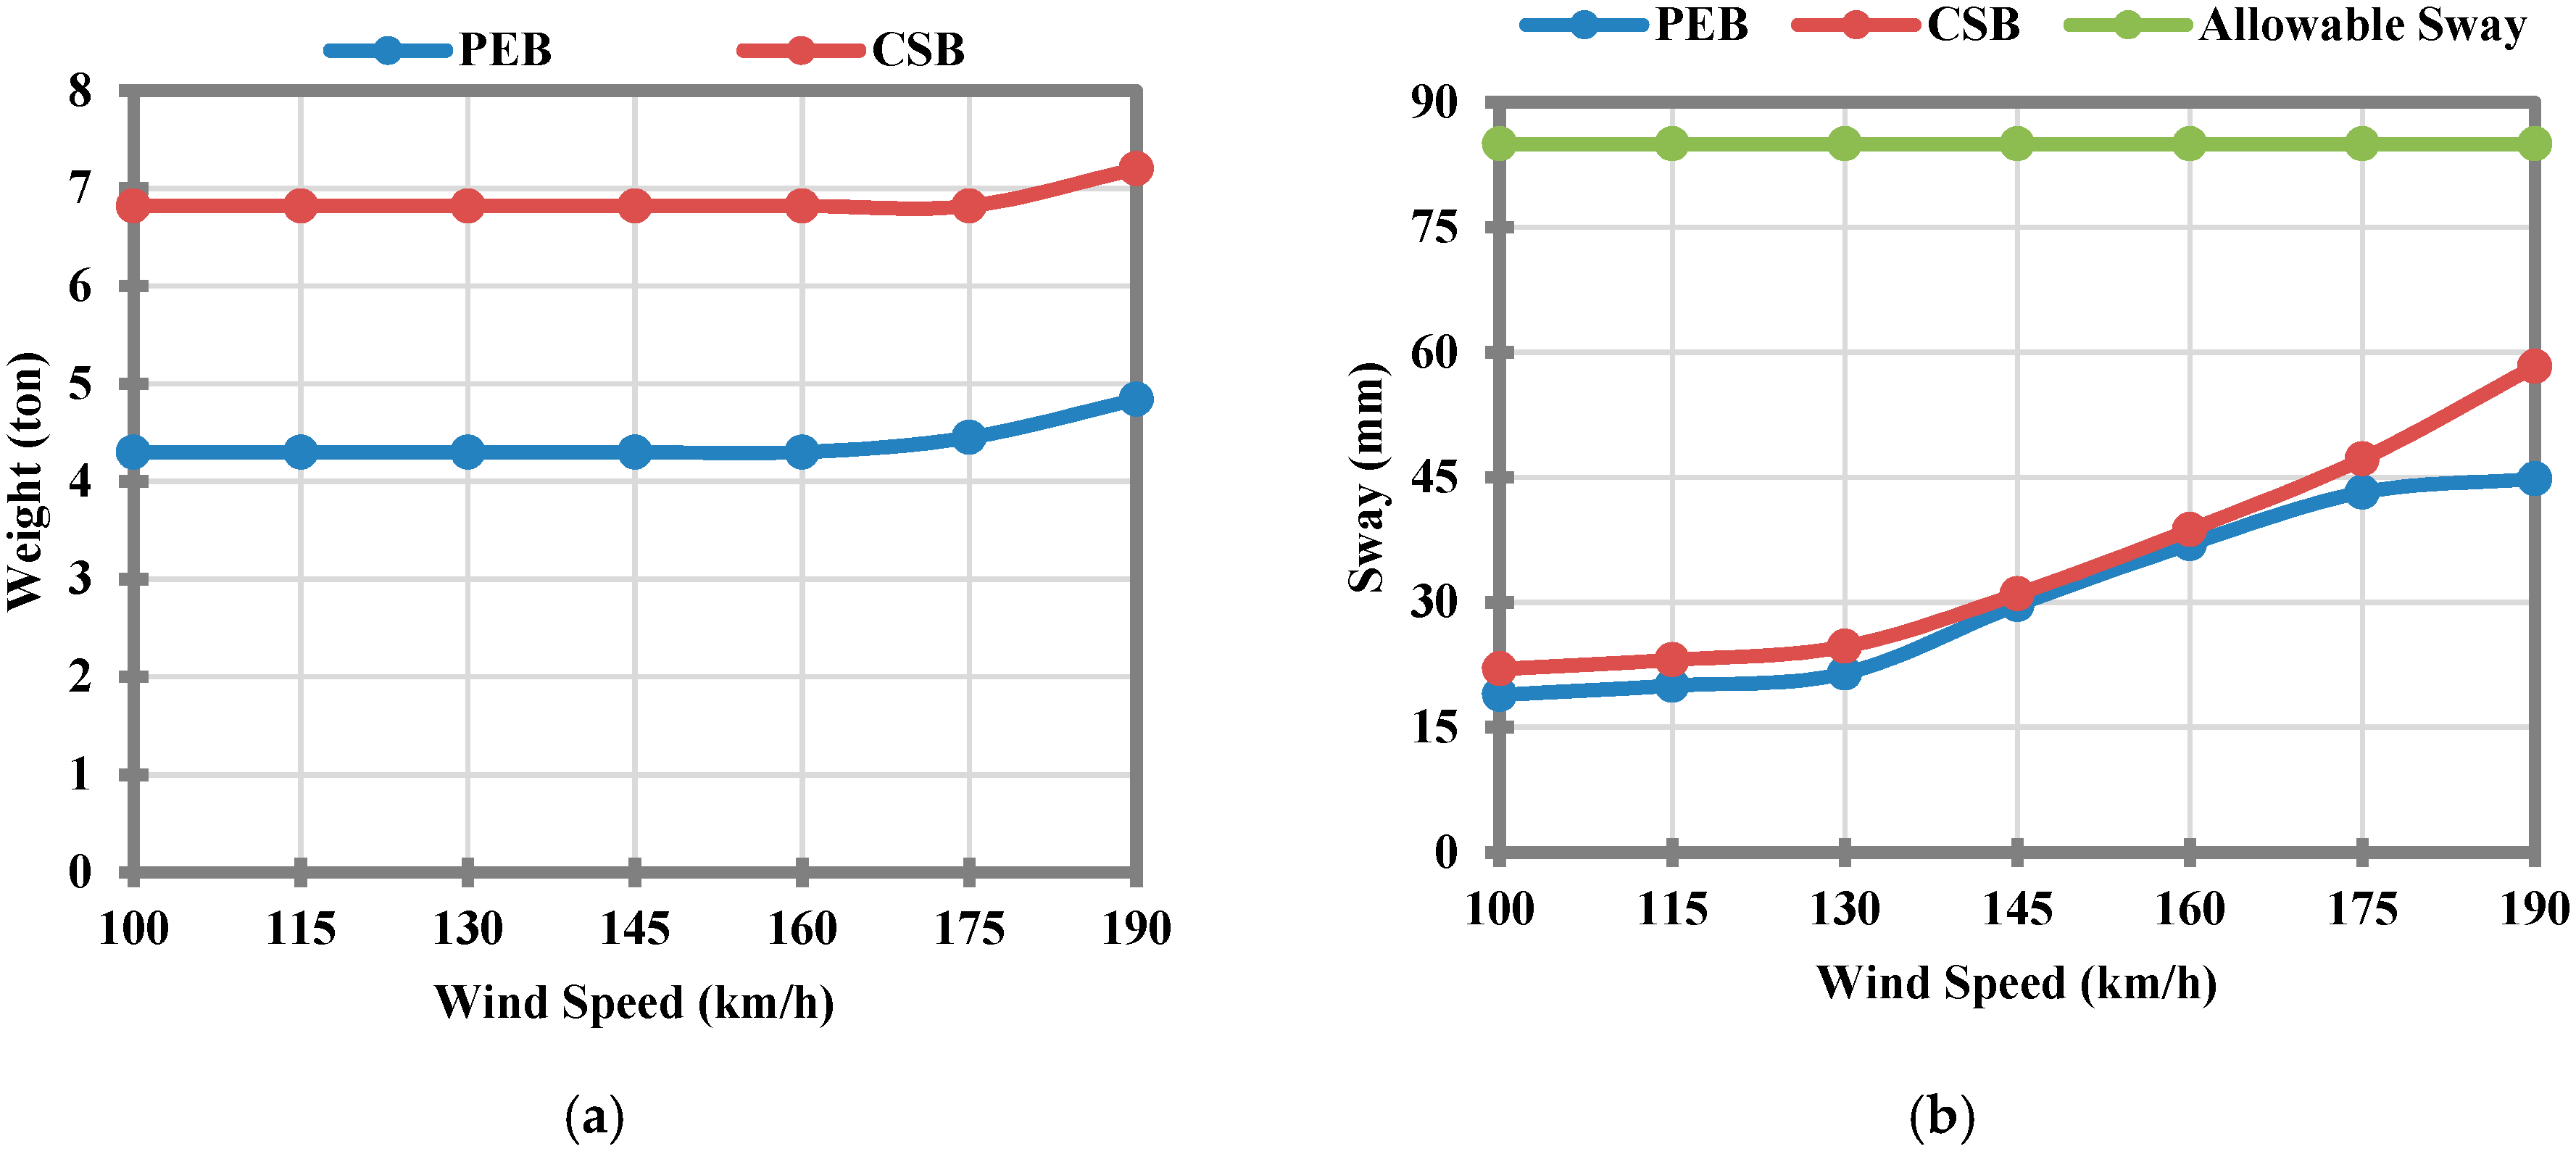
To understand the performance of CSB and PEB frames under wind loading, frames were subjected to an increasing wind speed from 100 km/h to 190 km/h. The frame span and bay spacing were kept constant at values of 33 m and 6.0 m, respectively. Wind forces were calculated according to ASCE/SEI 7-10 [32] for each 15 km/h interval (100, 115, 130, 145, 160, 175 and 190 km/h) and applied to the frames while keeping all other parameters constant. Figure 10a demonstrates the effect of different wind speeds to the main frame weight. The weight relatively stays constant throughout the whole testing, but it increases at wind speed ranging from 175 to 190 km/h. In this case, the wind loads do not govern the design but gravity loads. The weight difference between PEB and CSB stays mostly constant at 37%. As shown in Figure 10b, with the increase of wind speed, there is an increase in lateral sway. Wind speed is one of the critical factors, which affects the lateral sway of the steel frames. The lateral sway increases linearly with an increase in the wind speed. The difference in lateral sway between PEB and CSB is relatively small until the wind speed of 175 km/h, but it increases at 190 km/h. The frame deflections were not governed by the wind speed. For all these cases, the PEB frames have shown better performance in terms of weight and lateral response.
5. Conclusions
In this research study, the PEB and CSB frames were subjected to various loading affects to compare their performance in terms of weight and displacements. The frame span, bay spacing, seismic earthquake zones and different wind speed has been selected and were the parameters of the research study. In the current study, the performance of the PEB and CSB frames is compared in terms of frame weight, lateral sway and deflection. The current study mainly compares the steel weight and the cost comparison was not conducted because the steel price per metric ton is a variable, and it varies from country to country and is highly dependent on the global financial market conditions. The cost of the pre-engineered building is also dependent upon the location of the project and transportation freight (via sea or land). The majority of the pre-engineered steel suppliers charge the fabrication price per metric ton; therefore, any reduction in the frame weight will be proportional to steel fabrication price per metric ton only.
A number of steel frames were analyzed and designed using FEM-based computer package (Staad Pro.). The use of tapered sections in pre-engineered steel structure plays a significant role in reducing steel weight by roughly 35% of the weight of the conventional steel structure. As a result, the size of the foundation will be minimized due to the reduction in dead load. An overall reduction of 30–40% in steel weight was observed in the main frames, which spanned between 30 and 50 m. For bigger frame spans (40 m, 45 m and 50 m), a higher percentage reduction in frame weight was found as compared to smaller frame spans. A similar kind of trend was also observed for higher bay spacing values. The seismic forces has no significant effect on the frame weights (both CSB and PEB) because of the lesser weight and lighter roofing of the building. However, on the other hand, due to the lesser weight of the frames and load over it, wind forces became more critical and play a vital role in governing the design of the frames. The earthquake forces may become critical for multilevel PEB steel frames, which have intermediate mezzanine floors of significantly higher dead and live loads. For all of the frames analyzed, the PEB steel frames have shown lesser lateral and vertical displacements compared to conventional hot-rolled steel frames. This is because of the better control over the cross-sectional sizes and tapering technology of steel sections. By choosing thicker sections of the CSB frames, the displacement will become closer to the PEB frame, but it will result in higher steel weight. One of the reasons for higher CSB frame weights is no availability of a series of hot rolled sections. For instance, if a design section fails at a given loading, then the next available option of the hot rolled sections may result in increased tonnage. To have a lighter CSB frame weight, it is highly desirable to have a variety of sections available in the inventory of a hot-rolled table. PEB construction is environmentally friendly because of energy efficiency and the elimination of material wastage through cutting and welding. In the PEB industry, the fabrication processes are monitored and performed inside the factory, while in conventional steel construction, all fabrication work is performed on-site, resulting in material waste. Pre-engineered building construction gives the end users a much more economical and better solution for long span structures where large clear span and rapid construction are the utmost priority of the builders.
Author Contributions
Both authors have contributed to the research based on their knowledge, capacity and area of specialty. M.U.S. has planned the research program, prepared and analyzed the results in the presentable form. H.J.Q. has collected the information of steel buildings in the Middle East and performed a detailed literature survey. In addition, H.J.Q. has also modeled the frames in computer software to collect data and results.
Acknowledgments
This research was supported by the Deanship of Scientific Research (DSR) at King Faisal University (KFU) through its “Eighteenth Annual Research Project no. 180061.” The authors are thankful for the Department of Civil Engineering, College of Engineering and Deanship of Scientific Research for providing the required support in terms of the collection of steel buildings’ data and the computer laboratory facility for conducting the simulations.
Conflicts of Interest
The authors declare no conflict of interest with any private or public sector body.
Abbreviation
| Symbol | Description |
| DL | Dead load |
| LL | Live load |
| WL | Wind load |
| EQ | Earthquake load |
| p | Design wind pressure in kN/m2 |
| qh | Velocity pressure in pounds kN/m2 |
| GCp | External pressure coefficient |
| GCpi | Internal pressure coefficient |
| q | Velocity pressure |
| Ao | Total surface area of the building in square meters excluding the area of the openings present in the building such as: doors, windows skylight, etc. |
| Ag | The gross area of that wall in which Ao is identified, in square meter |
| V | Total design base shear |
| W | Seismic dead load, used to calculate the base shear |
| Vmax | Maximum allowable design base shear |
| Vmin | Minimum allowable design base shear |
| Cv | Coefficient dependent on the soil condition at the site and seismicity of the region |
| Ca | Another seismic coefficient dependent on soil conditions and seismicity of region |
| I | Seismic importance factor, used to increase margin of safety |
| R | Structural system coefficient, measures the ductility and overall strength of the system |
| T | Fundamental period of the structure in the direction under consideration |
| Ct | 0.035 for steel frames |
| hn | Height of the building in feet |
| Fi | The force at each level according to the height of the structure |
| Ft | Extra force in addition to Fi |
| wx | The weight at a particular level above the base shear |
| hx | The height at a particular level above the base shear |
| Wi | The total weight |
| hi | The total height |
References
- Andrade, J.B.; Braganca, L. Sustainability Assessment and Standardisation—Steel Buildings. Concepts Methods Steel Intensiv. Build. Proj. 2012, 5, 213–224. [Google Scholar]
- Fenker, M.; Balzer, M.; Kappl, H. Corrosion protection with hard coatings on steel: Past approaches and current research efforts. Surf. Coat. Technol. 2014, 257, 182–205. [Google Scholar] [CrossRef]
- Bhagatkar, S.V.; Shaikh, F.I.; Gupta, B.P.; Kharta, D. A study on pre-engineered building—A construction technique. Int. J. Eng. Res. Appl. 2015, 5, 5–9. [Google Scholar]
- Taha, S.H.; Ibrahim, M.G.; Ali, A.A.M. Steel as a sustainable choice towards the green building concept. Sustain. Dev. Plan. 2016, 210, 123–134. [Google Scholar]
- Saleem, M.U.; Zahid, A.S.; Hisham, J.Q. Minimum weight design of pre- engineered steel structures using Built-up sections and cold formed sections. Adv. Mater. Res. 2013, 684, 125–129. [Google Scholar] [CrossRef]
- Wang, C.; Li, J. The Investigation of Steel Structure Used in Residential Buildings. Appl. Mech. Mater. 2014, 501–504, 936–939. [Google Scholar] [CrossRef]
- Rao, P.P.K.V. Pre-engineered buildings the latest trend in building construction. In Proceedings of the National Conference on Recent Trends in Engineering and Technology, Gujrat, India, 13–14 May 2011. [Google Scholar]
- Aksel, H.; Eren, O. A discussion on the advantages of steel structures in the contract of sustainable constructions. Int. J. Contemp. Archit. 2015, 2, 46–53. [Google Scholar]
- Naidu, G.D.R.; Rao, K.S.V.; Sri, V.D.; Navakanth, M.; Rao, R. Comparative study of analysis and design of pre-engineered buildings and conventional frames. Int. J. Eng. Res. Dev. 2014, 10, 33–41. [Google Scholar]
- Subashini, L.M.; Valentina, S. Comparative study of pre-engineered and conventional industrial building. Indian J. Sci. Technol. 2015, 8, 1–6. [Google Scholar]
- Wakchaure, S.; Dubey, N.C. Design and comparative study of pre-engineered building. Int. J. Eng. Dev. Res. 2016, 4, 2108–2113. [Google Scholar]
- Ren, W.X.; Zeng, Q.Y. Interactive buckling behavior and ultimate load of I-section steel columns. J. Struct. Eng. 1997, 123, 1210–1217. [Google Scholar] [CrossRef]
- Ellobody, E. Buckling analysis of high strength stainless steel stiffened and unstiffened slender hollow section columns. J. Constr. Steel Res. 2007, 63, 145–155. [Google Scholar] [CrossRef]
- Dowling, P.J.; Mears, T.; Owens, G.; Raven, K. A development in the automated design and fabrication of portal framed industrial buildings. Struct. Eng. 1982, 60A, 311–319. [Google Scholar]
- Rangelov, N. On the effective stiffness of slender steel sections for deflection calculations. Thin-Walled Struct. 1996, 25, 171–183. [Google Scholar] [CrossRef]
- Šapalas, V.; Samofalov, M.; Viačeslavas, Š. FEM stability analysis of tapered beam-columns. J. Civ. Eng. Manag. 2005, 11, 211–216. [Google Scholar] [CrossRef]
- Deb, K.; Gulati, S. Design of truss-structures for minimum weight using genetic algorithms. Finite Elements Anal. Des. 2001, 37, 447–465. [Google Scholar] [CrossRef]
- Saka, M.P. Optimum design of pitched roof steel frames with haunched rafters by genetic algorithm. Comput. Struct. 2003, 81, 1967–1978. [Google Scholar] [CrossRef]
- Chan, B.H.M.; Chan, S.L. Nonlinear behaviour of pitched roof steel frames subjected to sequential loads. J. Appl. Mech. Eng. 2000, 5, 773–794. [Google Scholar]
- Horridge, J.F.; Morris, L.J. Comparative costs of single-storey framed structures. Struct. Eng. 1986, 64, 1–10. [Google Scholar]
- Chan, S.L. Stability design of steel structures—Theory and practice. In Proceedings of the International Conference on Steel and Composite Structures, Pusan, Korea, 14–16 June 2001; pp. 43–55. [Google Scholar]
- Saleem, M.U.; Hisham, J.Q.; Zahid, A.S. Optimum Unbraced Length Ratios of Slender Steel Sections. Int. J. Eng. Technol. 2013, 5, 493–497. [Google Scholar]
- Wankhade, S.D.; Pajgade, P. Review paper on comparison of conventional steel building & pre-engineering steel building. Int. J. Res. Advent Technol. 2014, 2, 1–10. [Google Scholar]
- Charkha, S.; Sanklecha, L.S. Economizing Steel Building using Pre-engineered Steel Sections. Int. J. Res. Civ. Eng. Archit. Des. 2014, 2, 1–10. [Google Scholar]
- Firoz, S.; Kumar, S.C.; Kanakambara, R. Design Concept of Pre-engineered Building. Int. J. Eng. Res. Appl. 2012, 2, 267–272. [Google Scholar]
- Pradip, S.L.; Vivek, V.K. Comparative Study of an Industrial Pre-Engineered Building with Conventional Steel Building. J. Civ. Eng. Environ. Technol. 2015, 2, 77–82. [Google Scholar]
- Shashank, P.; Sachin, M.K. Comparative Study on the Economy between Pre-Engineered and Conventional Steel Buildings. Int. Res. J. Eng. Technol. 2017, 4, 2708–2711. [Google Scholar]
- Darshan, K.; Sujay, D.; Pavan, G. A Comparative study on the Performance of PEB with CSB considering various parameters. Int. Res. J. Eng. Technol. 2017, 4, 1082–1088. [Google Scholar]
- Thakre, V.; Vairagade, L. Analysis and Cost Comparative study of conventional Industrial building with PEB structure. J. Inf. Knowl. Res. Civ. Eng. 2016, 1, 349–352. [Google Scholar]
- Titiksh, A.; Dewangan, A.; Khandelwal, A.; Sharma, A. Comparative Study of Conventional Steel Building and Pre-engineered Building to be used as an Industrial Shed. Int. J. Eng. Res. Appl. 2015, 5, 25–28. [Google Scholar]
- Pradeep, V.; Rao, P.G. Comparative Study of Pre-engineered and Conventional Industrial Building. Int. J. Eng. Trends Technol. 2014, 9, 1–6. [Google Scholar]
- ASCE/SEI 7-10. Minimum Design Loads for Buildings and Other Structures; American Society of Civil Engineers: Reston, VA, USA, 2010. [Google Scholar]
- UBC. Unifrom Building Code; International Conference of Building Officials: Whittier, CA, USA, 1997. [Google Scholar]
- American Institute of Steel Construction (AISC). Specification for Structural Steel Buildings; ANSI/AISC 360-10; American Institute of Steel Construction: Chicago, IL, USA, 2010. [Google Scholar]
- ASTM A572-15. Standard Specification for High-Strength Low-Alloy Columbium-Vanadium Structural Steel; ASTM International: West Conshohocken, PA, USA, 2015. [Google Scholar]
- MBMA. Metal Building Systems Manual; Metal Building Manufacturers Association: Cleveland, OH, USA, 2006. [Google Scholar]
Figure 1.
Pre-engineered steel building.
Figure 2.
CSB main frame vs. PEB main frame.
Figure 3.
PEB vs. CSB frame total weight (span length comparison).
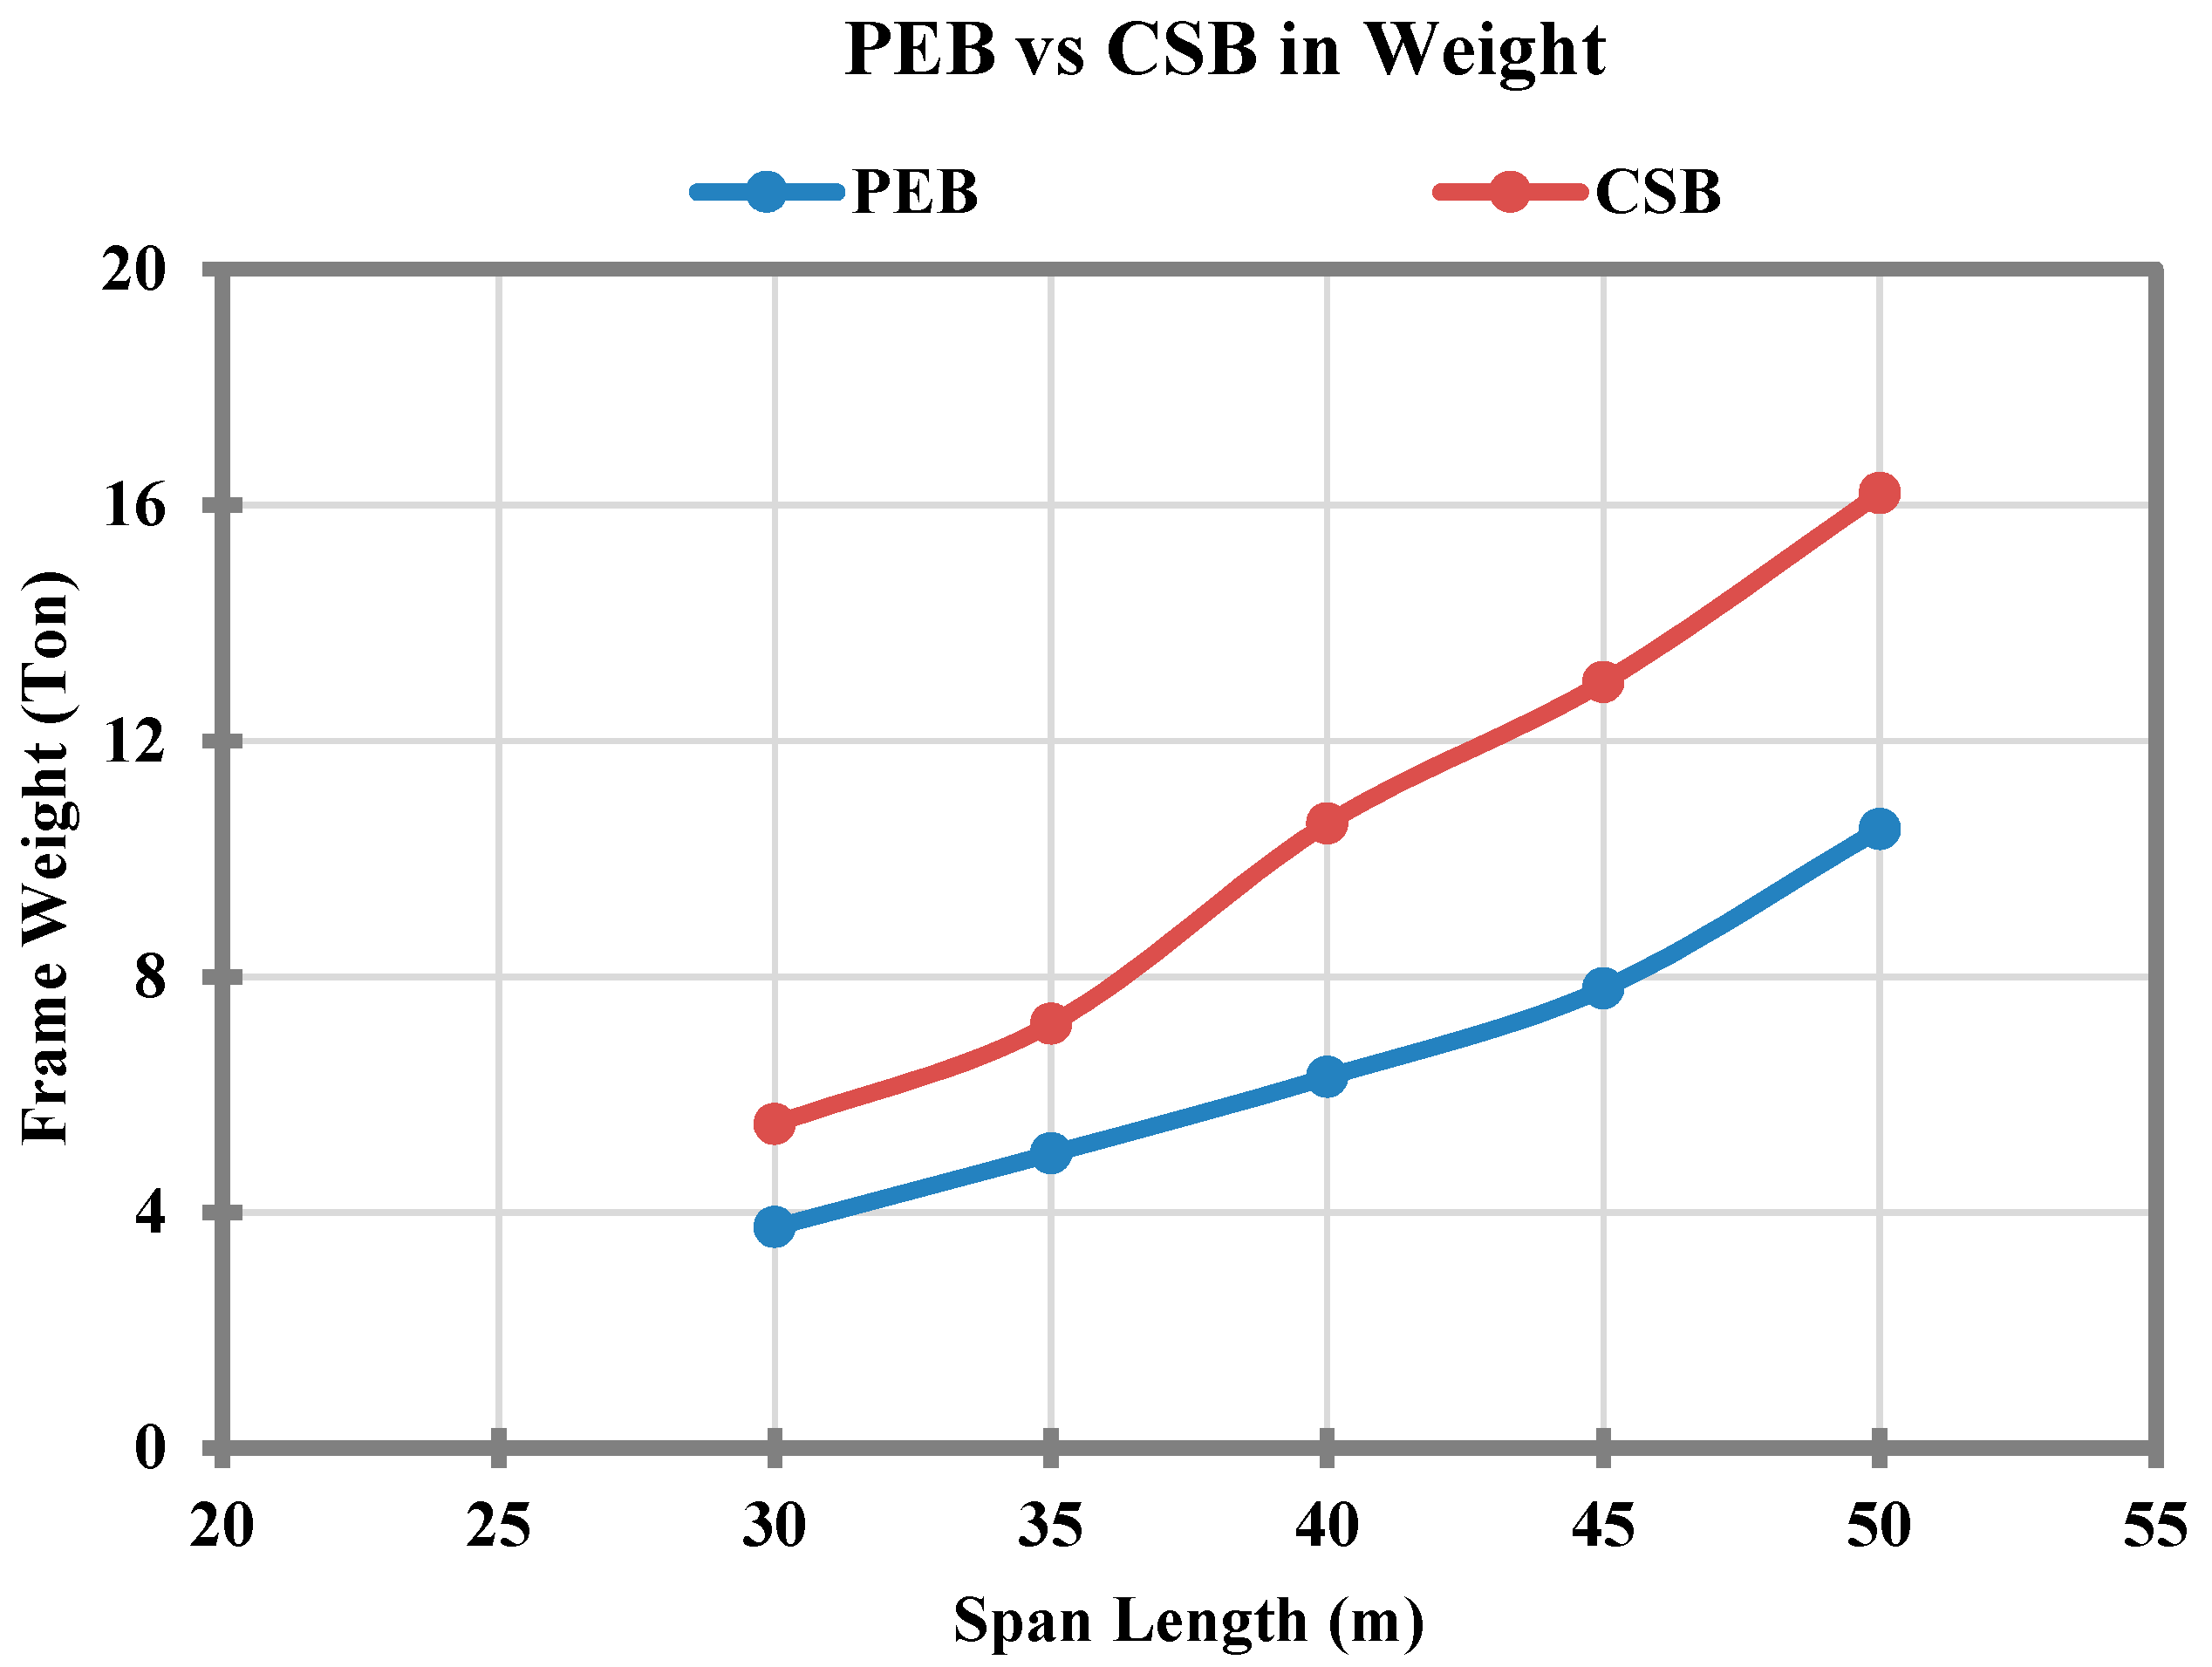
Figure 4.
Frame displacement in the x-direction (span length comparison).
Figure 5.
Frame deflection in the y-direction (span length comparison).
Figure 6.
PEB vs. CSB frame total weight (bay spacing length comparison).
Figure 7.
Frame displacements in the x-direction (bay spacing length comparison).
Figure 8.
Frame deflections in the y-direction (bay spacing length comparison).
Figure 9.
Seismic performance of steel frames (a) comparison of frames weight; (b) comparison of frame displacements.
Figure 9.
Seismic performance of steel frames (a) comparison of frames weight; (b) comparison of frame displacements.
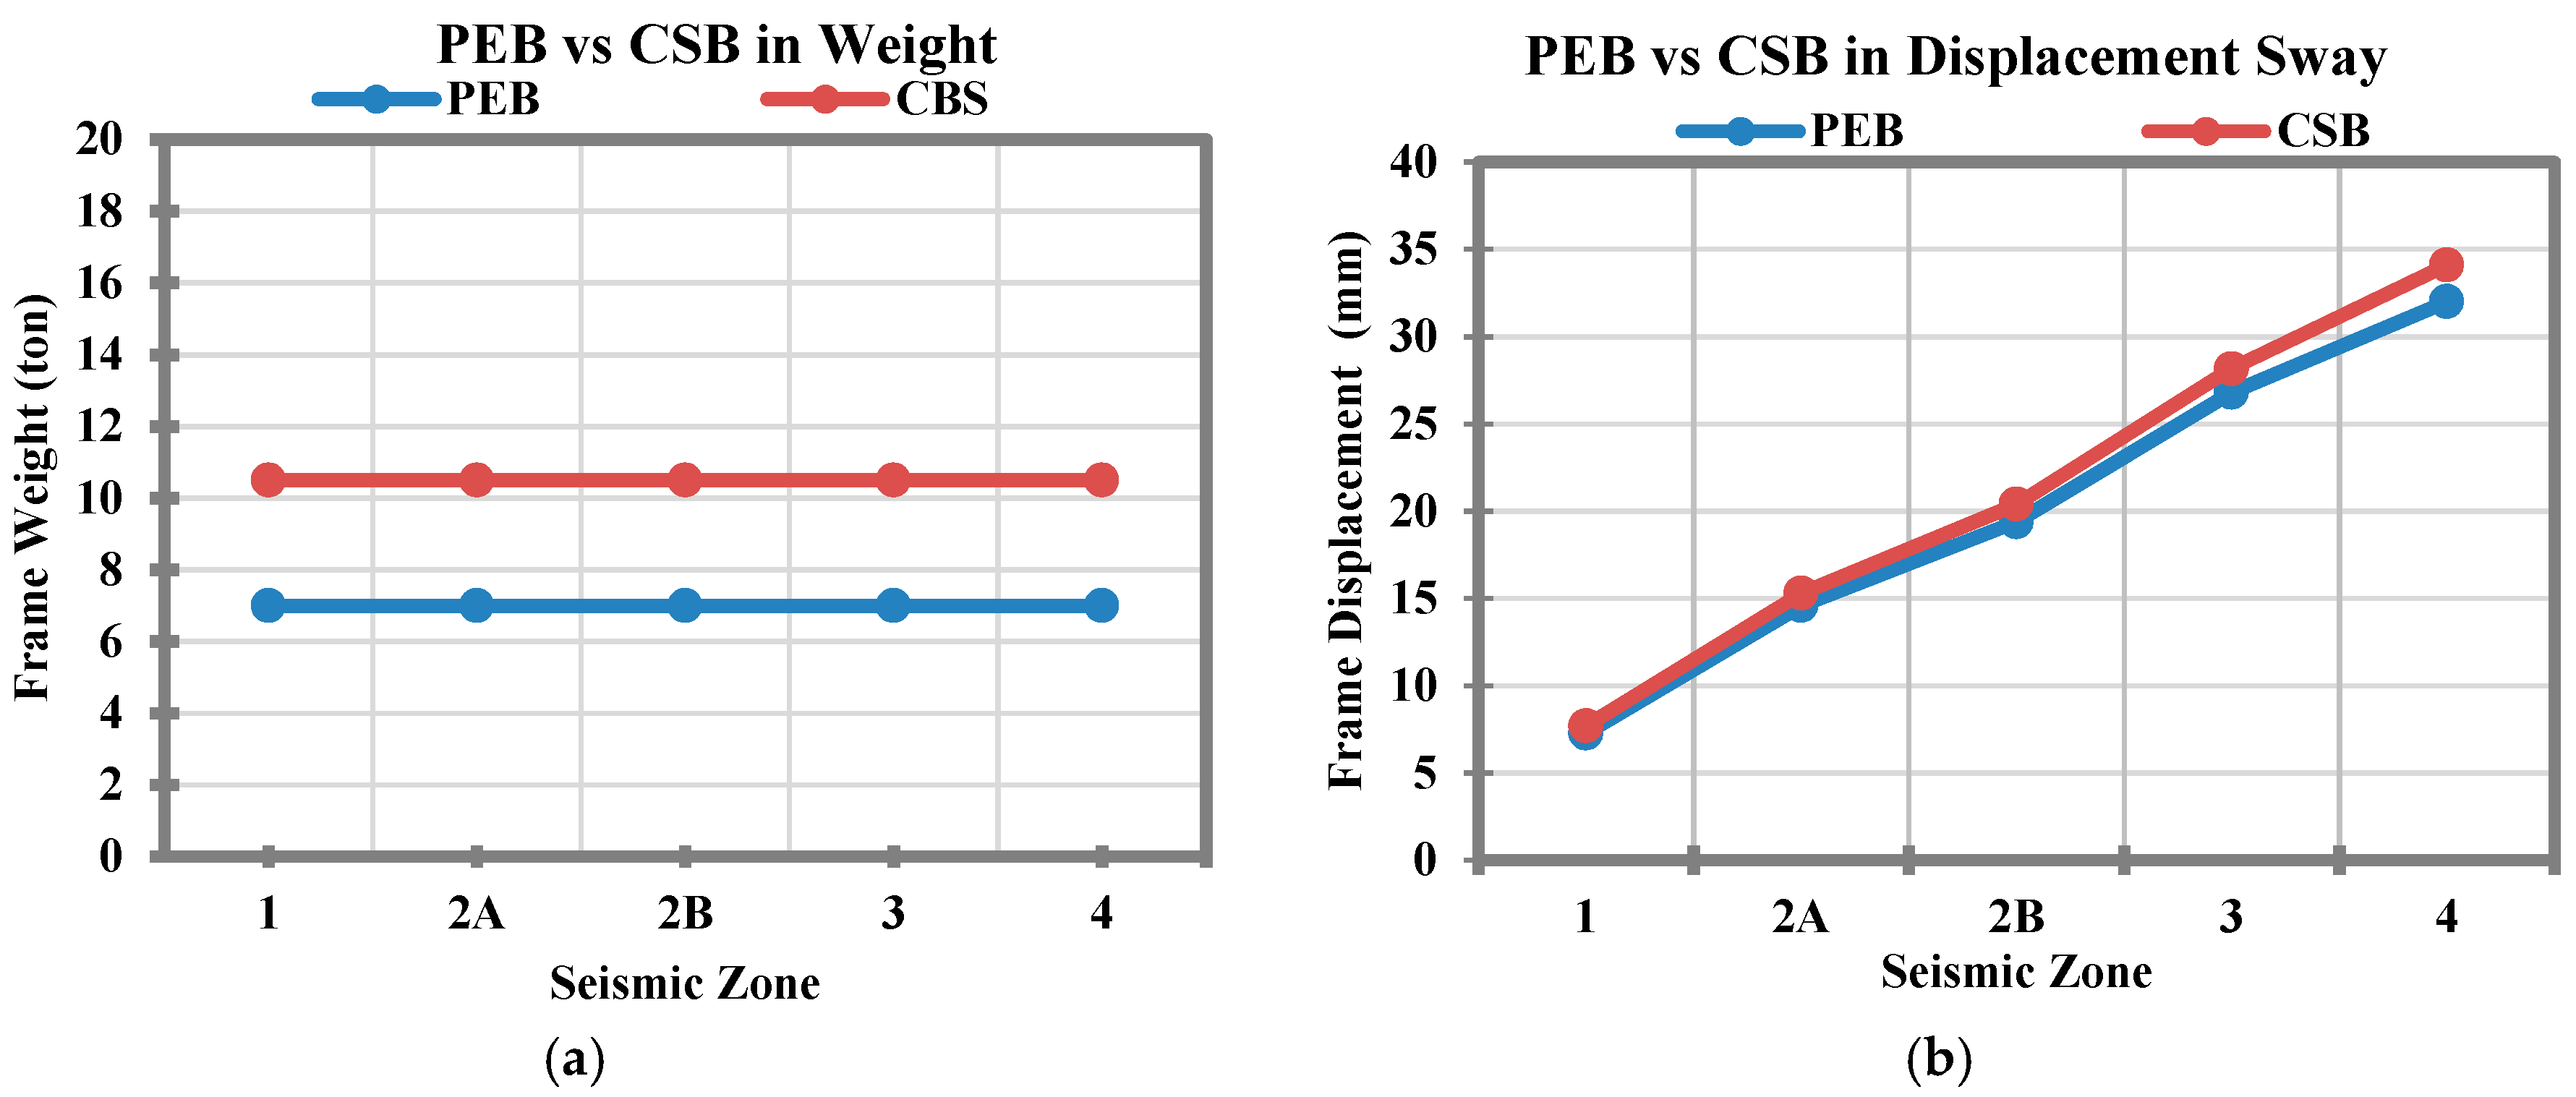
Figure 10.
Performance of steel frames under wind forces (a) comparison of frames weight; (b) comparison of frame displacements.
Figure 10.
Performance of steel frames under wind forces (a) comparison of frames weight; (b) comparison of frame displacements.

Table 1.
Parameters of the research study.
| Sr# | Parameter | Values |
|---|---|---|
| 1 | Span Length | 30 m |
| 35 m | ||
| 40 m | ||
| 45 m | ||
| 50 m | ||
| 2 | Bay Spacing | 4 m |
| 5 m | ||
| 6 m | ||
| 7 m | ||
| 8 m | ||
| 9 m | ||
| 10 m | ||
| 3 | Seismic Zone | Zone 1 |
| Zone 2A | ||
| Zone 2B | ||
| Zone 3 | ||
| Zone 4 | ||
| 4 | Wind Speed | 100 km/h |
| 115 km/h | ||
| 130 km/h | ||
| 145 km/h | ||
| 160 km/h | ||
| 175 km/h | ||
| 190 km/h |
Table 2.
LRFD and ASD load combinations as per ASCE/SEI 7-10 [16].
Table 2.
LRFD and ASD load combinations as per ASCE/SEI 7-10 [16].
| Sr# | LRFD | ASD |
|---|---|---|
| 1 | 1.4DL | DL |
| 2 | 1.2DL + 1.6LL | DL + LL |
| 3 | 1.2DL + 1.6LL + 0.8WL | DL + 0.75LL |
| 4 | 1.2DL + 1.0EQ | DL + WL |
| 5 | 0.9DL + 1.6WL | DL + 0.75LL + 0.75WL |
| 6 | 0.9DL + 1.0EQ | 0.6DL + WL |
Table 3.
Total frame weight (varied span length).
| Total Frame Weight in Ton | |||
|---|---|---|---|
| Span Length (m) | PEB (Ton) | CSB (Ton) | % Reduction in Weight |
| 30 | 3.75 | 5.5 | 32 |
| 35 | 5 | 7.2 | 31 |
| 40 | 6.3 | 10.6 | 41 |
| 45 | 7.8 | 13 | 40 |
| 50 | 10.5 | 16.2 | 36 |
| Mean | 6.67 | 10.5 | 36.0 |
| SD | 2.62 | 4.32 | 4.53 |
Table 4.
Frame lateral sway (span length comparison).
| Span Length (m) | PEB (mm) | CBS (mm) | % Difference |
|---|---|---|---|
| 30 | 27.6 | 30.7 | 10 |
| 35 | 20.5 | 27.3 | 25 |
| 40 | 21.4 | 26.3 | 18 |
| 45 | 21.4 | 32.2 | 34 |
| 50 | 25.2 | 34.7 | 27 |
| Mean | 23.22 | 30.24 | 22.80 |
| SD | 3.05 | 3.47 | 9.15 |
Table 5.
Frame deflection y-axis (span length comparison).
| Span Length (m) | PEB (mm) | CBS (mm) | % Difference |
|---|---|---|---|
| 30 | 168.5 | 138.6 | 18 |
| 35 | 192.3 | 170.6 | 11 |
| 40 | 263.7 | 213.4 | 19 |
| 45 | 333 | 228.5 | 31 |
| 50 | 351.6 | 269.3 | 23 |
| Mean | 261.82 | 204.08 | 20.40 |
| SD | 81.66 | 50.86 | 7.33 |
Table 6.
PEB vs. CSB with different bay spacing.
| Span Length (m) | PEB (Ton) | CSB (Ton) | % Reduction in Weight |
|---|---|---|---|
| 4 | 3.79 | 5.4 | 30 |
| 5 | 4.22 | 5.84 | 28 |
| 6 | 4.28 | 6.82 | 37 |
| 7 | 5.2 | 7.5 | 31 |
| 8 | 5.47 | 8.27 | 34 |
| 9 | 6 | 9.26 | 35 |
| 10 | 6.3 | 10.21 | 38 |
| Mean | 5.45 | 8.41 | 35 |
| SD | 0.78 | 1.35 | 2.74 |
Table 7.
Frame lateral sway (bay spacing length comparison).
| Bay Spacing (m) | PEB (mm) | CBS (mm) | % Difference |
|---|---|---|---|
| 4 | 24.1 | 24.8 | 1 |
| 5 | 26 | 26.9 | 3 |
| 6 | 23.1 | 24.4 | 5 |
| 7 | 23.6 | 28.3 | 17 |
| 8 | 21.4 | 28.5 | 25 |
| 9 | 22.4 | 28.1 | 20 |
| 10 | 23.4 | 28 | 16 |
| Mean | 22.78 | 27.46 | 16.60 |
| SD | 0.90 | 1.72 | 7.37 |
Table 8.
Frame deflections at different bay spacing.
| Bay Spacing (m) | PEB (mm) | CBS (mm) | % Difference |
|---|---|---|---|
| 4 | 176.2 | 194.1 | 9 |
| 5 | 182.4 | 208.8 | 13 |
| 6 | 161.6 | 192.2 | 16 |
| 7 | 123.7 | 215.8 | 43 |
| 8 | 147 | 215.7 | 32 |
| 9 | 151.8 | 213.2 | 29 |
| 10 | 154.4 | 211.0 | 27 |
| Mean | 147.70 | 209.58 | 29.40 |
| SD | 14.42 | 9.92 | 9.71 |
© 2018 by the authors. Licensee MDPI, Basel, Switzerland. This article is an open access article distributed under the terms and conditions of the Creative Commons Attribution (CC BY) license (http://creativecommons.org/licenses/by/4.0/).
Share and Cite
MDPI and ACS Style
Saleem, M.U.; Qureshi, H.J. Design Solutions for Sustainable Construction of Pre Engineered Steel Buildings. Sustainability 2018, 10, 1761. https://doi.org/10.3390/su10061761
AMA Style
Saleem MU, Qureshi HJ. Design Solutions for Sustainable Construction of Pre Engineered Steel Buildings. Sustainability. 2018; 10(6):1761. https://doi.org/10.3390/su10061761
Chicago/Turabian StyleSaleem, Muhammad Umair, and Hisham Jahangir Qureshi. 2018. "Design Solutions for Sustainable Construction of Pre Engineered Steel Buildings" Sustainability 10, no. 6: 1761. https://doi.org/10.3390/su10061761
Note that from the first issue of 2016, this journal uses article numbers instead of page numbers. See further details here.