Article

Socioeconomic Indicators to Monitor the EU’s Bioeconomy in Transition

European Commission, Joint Research Centre (JRC), Directorate for Sustainable Resources, Economics of Agriculture Unit, Edificio EXPO, C/ Inca Garcilaso 3, 41092 Seville, Spain
*
Author to whom correspondence should be addressed.
Sustainability 2018, 10(6), 1745; https://doi.org/10.3390/su10061745
Submission received: 16 April 2018 / Revised: 18 May 2018 / Accepted: 22 May 2018 / Published: 26 May 2018

Abstract

:
The monitoring of the European bioeconomy is hampered by a lack of statistics on emergent and partially bio-based sectors. In this study, we complete the picture of the bioeconomy in the European Union (EU) by first estimating a set of socioeconomic indicators in missing sectors. Second, we identify four broad bioeconomy patterns within the EU that differ according to the specialisation of Member States’ labour markets in the bioeconomy (location quotient) and according to the apparent labour productivity of their bioeconomies. The patterns are geographically distributed in (i) Eastern Member States and Greece and Portugal; (ii) Central and Baltic Member States; (iii) Western Member States; and (iv) Northern Member States. They are strongly related to the level of gross domestic product (GDP) per capita in Member States, and to their political histories (e.g., their year of accession to the EU, and the existence and maturity of their bioeconomy strategies). Within each group, diversity exists in terms of sectoral bioeconomy development. Third, we examine temporal dynamics over the period 2008–2015, stressing with the cases of Slovenia, Portugal, Greece and Finland that a transition from one group to another is possible. Finally, we take a closer look at the East–West bioeconomy disparities within Europe and suggest measures to promote EU bioeconomies.

1. Introduction

Europe’s bioeconomy encompasses the production of renewable biological resources and the conversion of these resources and waste streams into value-added products such as food, feed, bio-based products and bioenergy [1]. As a core principle, the European Bioeconomy Strategy aims to balance social, environmental and economic gains by linking the sustainable use of renewable resources with the protection and restoration of biodiversity, ecosystems and natural capital across land and water [2].
The 2017 review of the Bioeconomy Strategy created a major opportunity for a new political impetus and orientation [3]. The roadmap ‘Update of the 2012 Bioeconomy Strategy,’ published in early 2018, reinforced the main purpose of the strategy and provided an updated plan for concrete actions [2]. These actions relate to research and innovation, including education, special attention to the development of bio-based markets, the minimisation of harmful impacts and maximisation of co-benefits of the bioeconomy, and better exploitation of the potential in EU Member States and their regions [2].
Both the review and the roadmap stress the need to assess progress through better monitoring and assessment frameworks, in particular providing SMART (specific, measurable, attainable, relevant and timely) indicators across relevant sectors.
In this article we present the most recent socioeconomic key numbers, discuss and propose additional indicators, and illustrate the use of further derived indicators for the analysis of EU Member States’ bioeconomies in transition, as a contribution to the upcoming set-up of monitoring and assessment frameworks. The paper gives some insights into the situation of individual countries, as such contemplating also potentially existing path dependencies.
The majority of bioeconomy policy documents [1,2,3], but also scientific publications [4], describe the bioeconomy in terms of indicators, turnover and jobs as calculated by the Joint Research Centre (JRC) and the nova-Institute for Ecology and Innovation (www.nova-institute.eu) [5,6,7].
According to our most recent estimations, the EU-28 bioeconomy created 18 million full-time jobs and generated €2.3 trillion of turnover in 2015. To date, turnover has been the main economic indicator used to quantify the bioeconomy and its different sectors. In this article we argue that value added should receive more attention, primarily because it avoids double-counting and provides the additional value to the whole economy created by a sector. Furthermore, it is more in line with EU Member State calculations and allows comparisons with national accounts. Expressed in value added, the bioeconomy amounted to €620 billion in Europe in 2015. In particular, sectors with high inputs reduce its overall share in the bioeconomy.
In a second step, with the objective of analysing the state and potential pathways of individual EU Member States in the bioeconomy, this paper puts forward the use of the sectoral apparent labour productivity (or value added per person employed) and the so-called location quotient (see also [5]). Addressing economic performance through a productivity measure gives further insights into the growth potential of specific bioeconomy sectors in individual EU Member States, which is of particular importance from the perspective of the EU and its various policies that have implications for territorial coherence.
Accordingly, this paper proposes a simplified socioeconomic indicator framework, the positioning of EU Member States on a transition path to higher productivity and, finally, a grouping of Member States.
It should be stressed that this approach does not constitute a holistic assessment framework, in particular because it omits the environmental dimension of sustainability. Nonetheless, it gives insights into the state and the transition of EU Member States in this matrix of key economic and social indicators, and thus provides an initial contribution to the monitoring of the bioeconomy in the EU.
The article is structured as follows. Following the introduction, the second section describes the materials and methods, in particular the way the indicators are calculated. The third section provides the results, starting with an overview of the socioeconomic indicators and followed by a detailed analysis of the clustering of EU Member States. The fourth section discusses the choice of value added as the main economic indicator and then looks into the untapped potential and bioeconomy-related strategies for Eastern EU Member States.

2. Materials and Methods

2.1. Scope of the ‘European Bioeconomy’

This paper follows the official definition of the bioeconomy as published in communication COM (2012) 60 of the European Commission mentioned in the introduction [1]. Briefly put, the bioeconomy incorporates all the economic activities related to the production and manufacturing of biomass. According to the official statistical classification of economic activities of the European Community (NACE rev. 2) [8], these economic activities correspond to the list of sectors presented in
Table 1. Note that the NACE classification does not differentiate bio-based and non-bio-based activities. This is the case, for instance, in the manufacture of textiles that can use biomass as a feedstock (cotton, ,wool, silk, etc.), or synthetic fibres, or both. Sectors making use of biomass and other kinds of feedstock are called ‘hybrid’ sectors. They are marked with a * in Table 1.

2.2. Determination of the Bio-Based Proportion of Hybrid Sectors

The extent to which a given hybrid sector is bio-based is determined following the approach set out by Ronzon et al. [5]: experts estimate the proportion of biomass incorporated in each product produced by the hybrid sector; and, at sector level, the proportion of biomass incorporated in all products from this sector makes up the sectoral bio-based share.
In the present study, the quantification of sectoral bio-based shares strictly follows the same methodology as described by Ronzon et al. [5], except for the case of the manufacture of bio-based chemicals and pharmaceuticals (NACE rev. 2 sectors C20 and C21). In order to track possible developments, the nova-Institute for Ecology and Innovation has updated the product bio-based shares of these two sectors after a new round of expert interviews in which experts have worked on the statistical classification of products by category (CPA) list of products belonging to sectors C20 and C21. Consequently, the sectoral bio-based shares of the two aforementioned sectors were estimated using the production value from the EUROSTAT-Prodcom dataset (see Equation (1)).
BBS i , k , l = j = 1 n bbs j × Production   value j , k , l j = 1 n Production   value j , k , l ,
where:
BBS i , k , l is the bio-based share of sector i (NACE Rev. 2), in EU Member State k and for year l;
bbs j is the bio-based share of product j, given that sector i manufactures j = n products. Bio-based shares vary from 0 for products that do not incorporate biomass (e.g., Prodcom code 20.12.23.30, Synthetic organic tanning substances) to 1 for those that are made entirely of biomass (e.g., Prodcom code 20.12.22.50, Tanning extracts of vegetable origin);
Production valuej,k,l is the production value of product j, by EU Member State k and for year l.
Finally, the sectoral bio-based share for the production of bio-electricity is derived from the EUROSTAT—energy balances, using the nrg_105a dataset, which decomposes the gross electricity generation by source. As for the precedent sectoral bio-based shares, it is calculated per Member State and year and then applied to EUROSTAT—Structural Business Statistics data (sbs_na_ind_r2).

2.3. Calculation of Monitoring Indicators

This study is based on the analysis of the number of persons employed in bioeconomy sectors, their turnover, value added and derived indicators (see details in official definitions [9]):
  • The number of people employed (code V16110 in EUROSTAT—Structural Business Statistics) is the total number of persons who work in the observation unit, as well as persons who work outside the unit who belong to it and are paid by it.
  • The turnover (code V12110 in EUROSTAT—Structural Business Statistics) comprises the totals invoiced by the observation unit.
  • The value added at factor cost (code V12150 in EUROSTAT—Structural Business Statistics) is the gross income from operating activities after adjusting for operating subsidies and indirect taxes.
In the case of fully bio-based sectors, data for these indicators are retrieved from different EUROSTAT datasets and from Scientific, Technical and Economic Committee for Fisheries (STECF) reports (see Table 2).
Indicators are estimated for hybrid sectors by applying their sectoral bio-based share to EUROSTAT—Structural Business Statistics data (sbs_na_ind_r2; see Ronzon et al. for more details [5]).
The derived indicators used in this study include apparent labour productivity (code V91110 in EUROSTAT—Structural Business Statistics) and location quotient. Apparent labour productivity refers to the ratio of value added to persons employed. Location quotient refers to the proportion of persons employed in a particular sector and in a given Member State compared with the European proportion (see Equation (2)). A location quotient of sector i in Member State k greater than 1 means the labour market of Member State k is more ‘concentrated’ in sector i than the EU-28 labour market.
LQ i , k , l = %   people   employed i , k , l %   people   employed i , E U 28 , l ,
where:
LQi,k,l is the location quotient of sector i (NACE Rev. 2), in EU Member State k and for year l;
% people employedi,k,l is the proportion of people employed in sector i (the bioeconomy or a NACE Rev. 2 sector), in EU Member State k and for year l; and
% people employedi,EU-28,l is the proportion of people employed in sector i (the bioeconomy or a NACE Rev. 2 sector), in the EU-28 and for year l.
For example, the bioeconomy location quotient of 3.8 in Romania means that in the Romanian labour market the proportion of persons employed in bioeconomy sectors is nearly four times higher than the proportion of bioeconomy workers on the EU28 labour market.
Data are compiled within the JRC-Bioeconomics dataset and they can be gathered at https://datam.jrc.ec.europa.eu/datam/perm/od/7d7d5481-2d02-4b36-8e79-697b04fa4278 (see also the QR codes in the Supplementary Materials).

3. Results

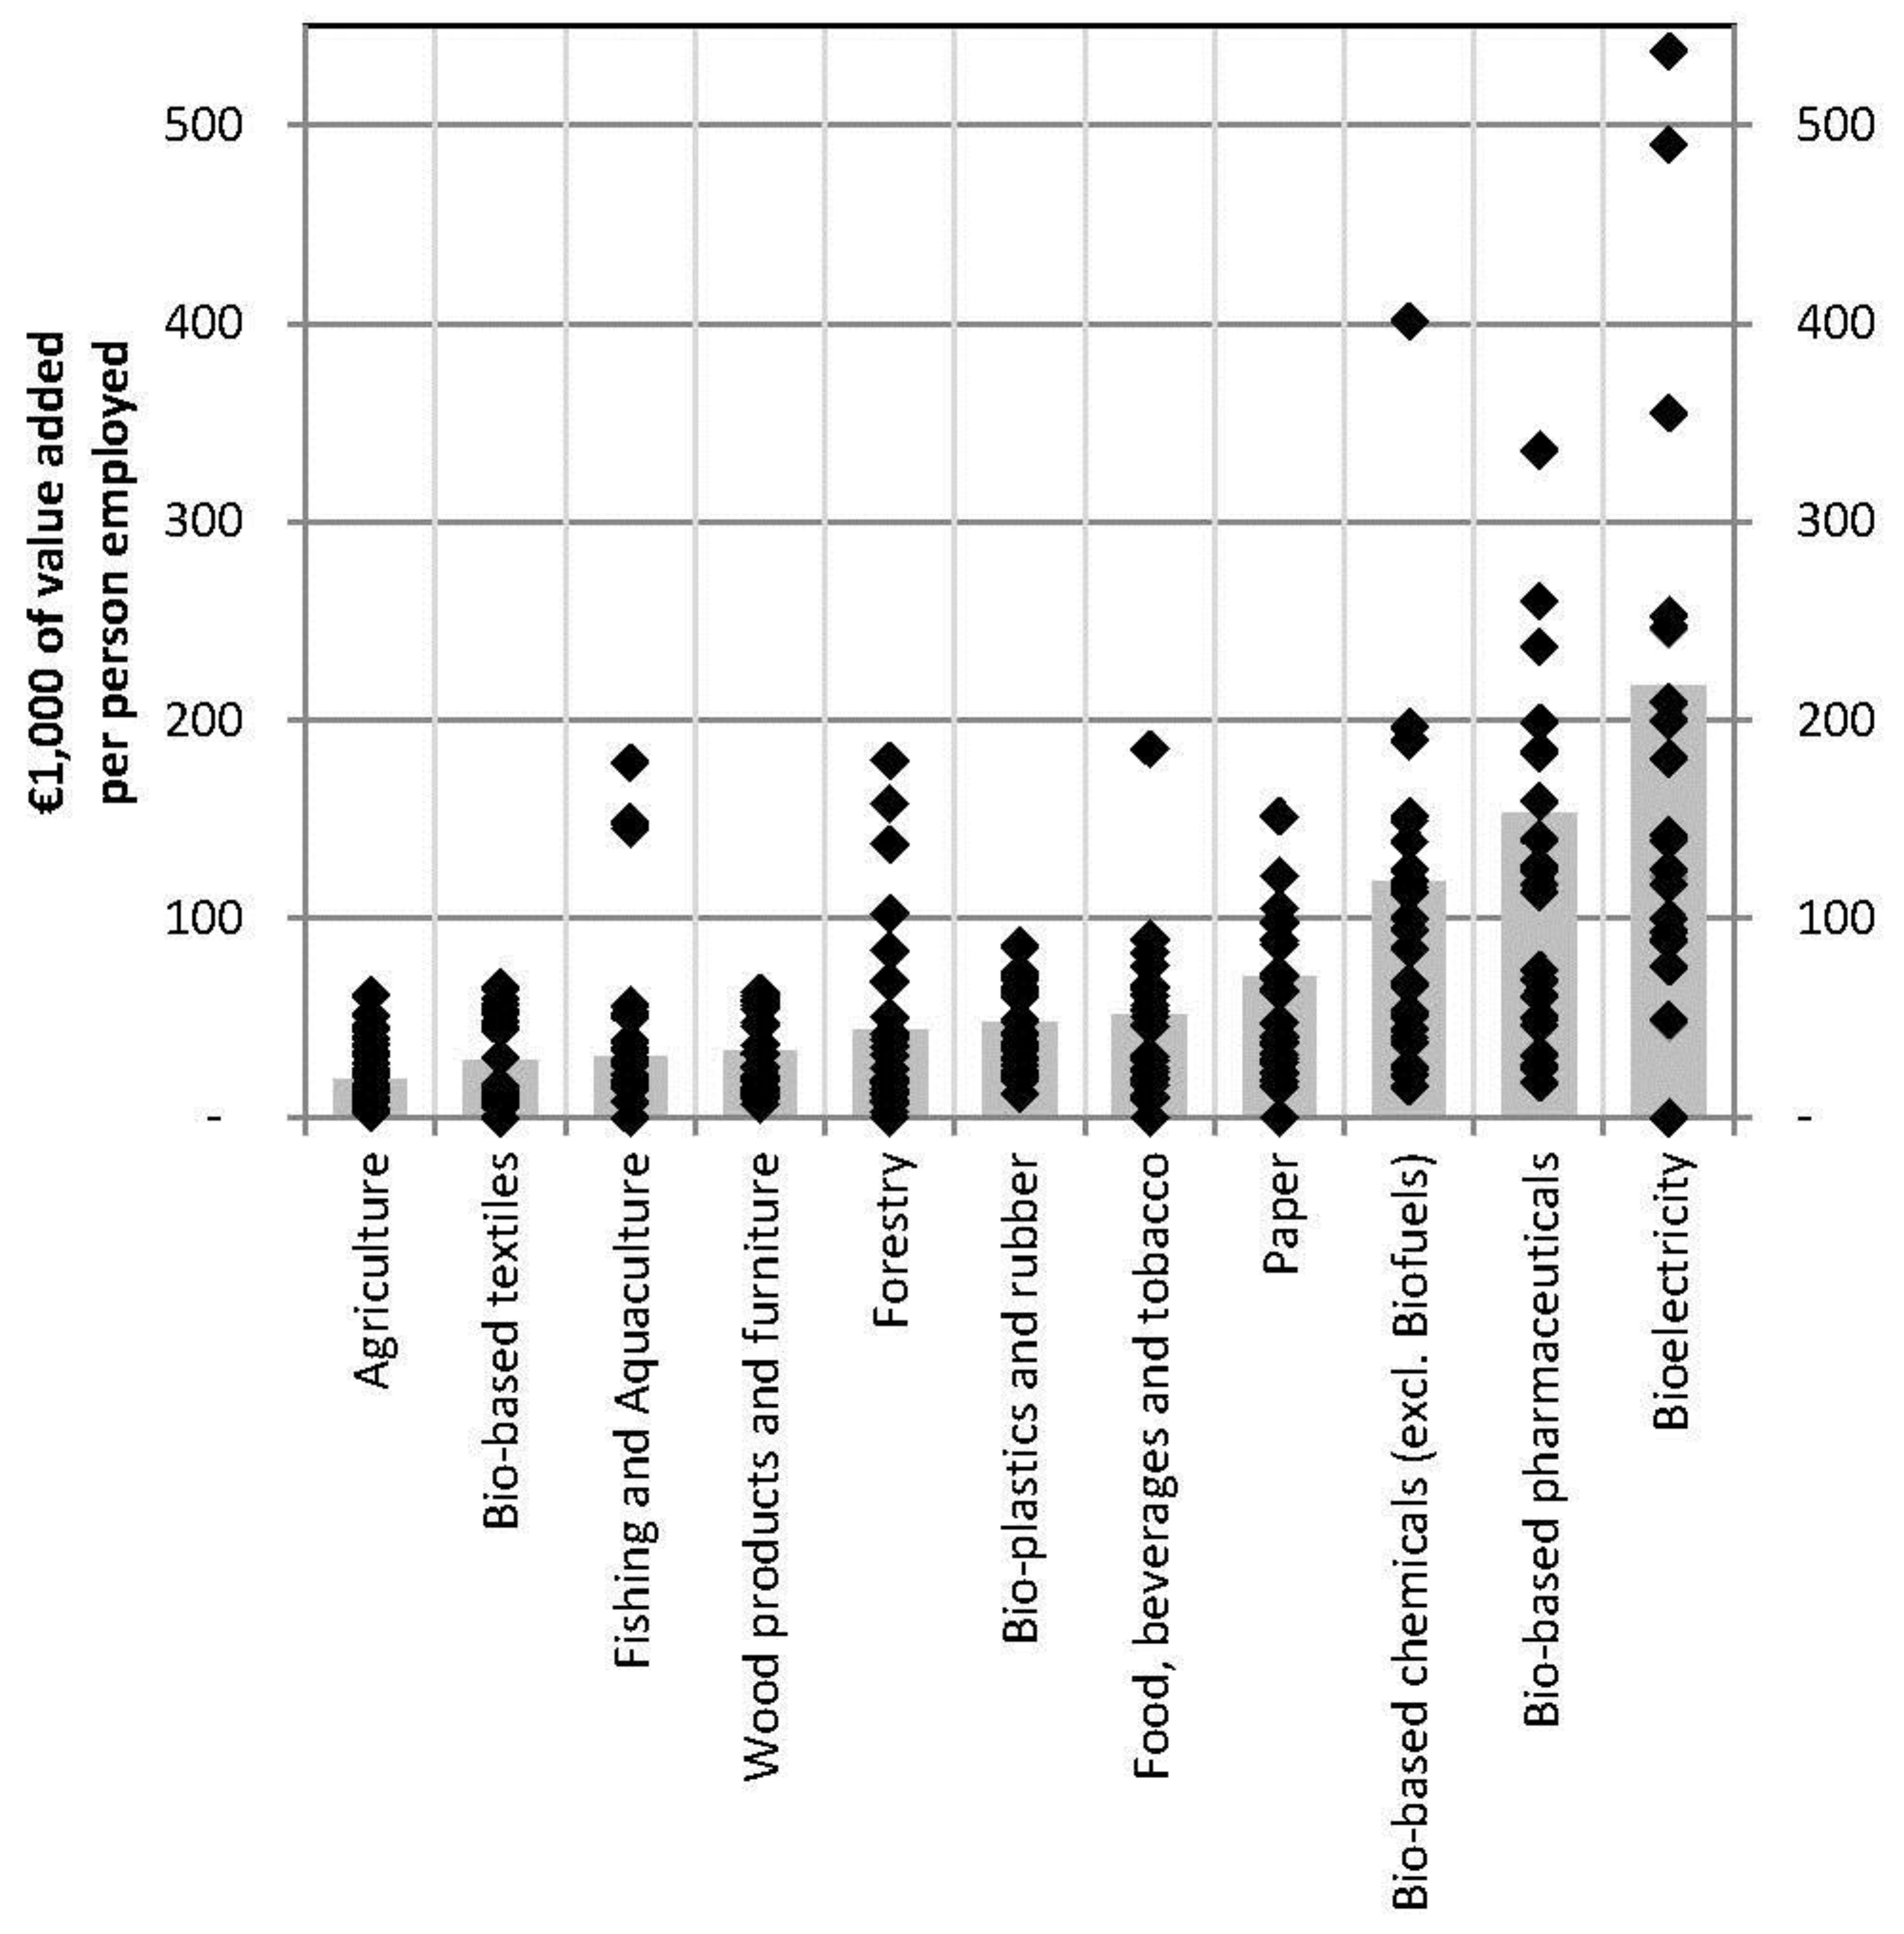
3.1. Key Socioeconomic Indicators

According to our estimations, the EU-28 bioeconomy employed 18 million people and generated €2.3 trillion of turnover or €620 million of value added in 2015. In other words, this sector employed 8.2% of the EU-28 labour force and generated 4.2% of the EU-28 GDP. Agriculture and the manufacture of food, beverages and tobacco accounted for about two thirds of the value added and turnover of the bioeconomy and three quarters of bioeconomy employment. These sectors generated €174 billion and €233 billion of value added respectively in 2015.
Even though these two sectors dominate the bioeconomy when measured with the three indicators—employment, turnover and value added—sectoral contributions vary according to the degree of labour intensiveness of the sector (see Table 3 and Appendix A Table A1). Agriculture, being a low labour productive sector, employs 51% of bioeconomy workers but generates only 28% of the bioeconomy value added. The other sectors tend to increase their contribution to the bioeconomy when measured in value terms rather than employment terms. For example, the manufacture of food, beverages and tobacco employs only 25% of the bioeconomy workers, but generates 37% of the bioeconomy value added. The manufacture of bio-based chemicals, pharmaceuticals, plastics and rubber (excluding biofuels) employs fewer than 3% of the workers in the bioeconomy, but generates more than 9% of its value added.
Differences in sectoral contribution to the bioeconomy turnover versus value added arise from differences in cost structure. Costs of bought-in goods and services are relatively higher in the manufacture of food, beverages and tobacco than in agriculture. As a result, its proportion of the bioeconomy’s turnover (51%) is far larger than its proportion of value added (38%), while the opposite is true in agriculture (17% of turnover versus 28% of value added).
Over time, bioeconomy employment tends to reduce while value added increases. The number of people working in the bioeconomy was 2.5 million fewer in 2015 than in 2008, mainly because of the ongoing restructuring of the agricultural sector, which lost 1.5 million people during the same period (which equates to 63% of the reduction in jobs in the EU-28 bioeconomy). In contrast, the value added generated by the bioeconomy has increased by €45 million and the apparent labour productivity has also improved from €28,000 of value added per person employed in 2008 to €34,400 in 2015.
We can observe five levels of sectoral apparent labour productivity in the EU bioeconomy, which more or less follow sectoral levels of capitalisation (see bars on Figure 1): (i) €19,000 of value added per person employed reached in agriculture; (ii) around €30,000 of value added per person employed in the manufacture of bio-based textiles, in fishing and aquaculture and in the manufacture of wood products and furniture; (iii) between €40,000 and €50,000 per person employed in forestry, the manufacture of bio-plastics and the manufacture of food, beverages and tobacco; (iv) €70,000 per person employed in the manufacture of paper and paper products; and (v) more than €120,000 per person employed in the manufacture of bio-based chemicals and bio-based pharmaceuticals as well as in the production of bioelectricity. Nevertheless, behind these EU averages, sectoral levels of apparent labour productivity show very wide ranges of variation at Member State level (see points on Figure 1).

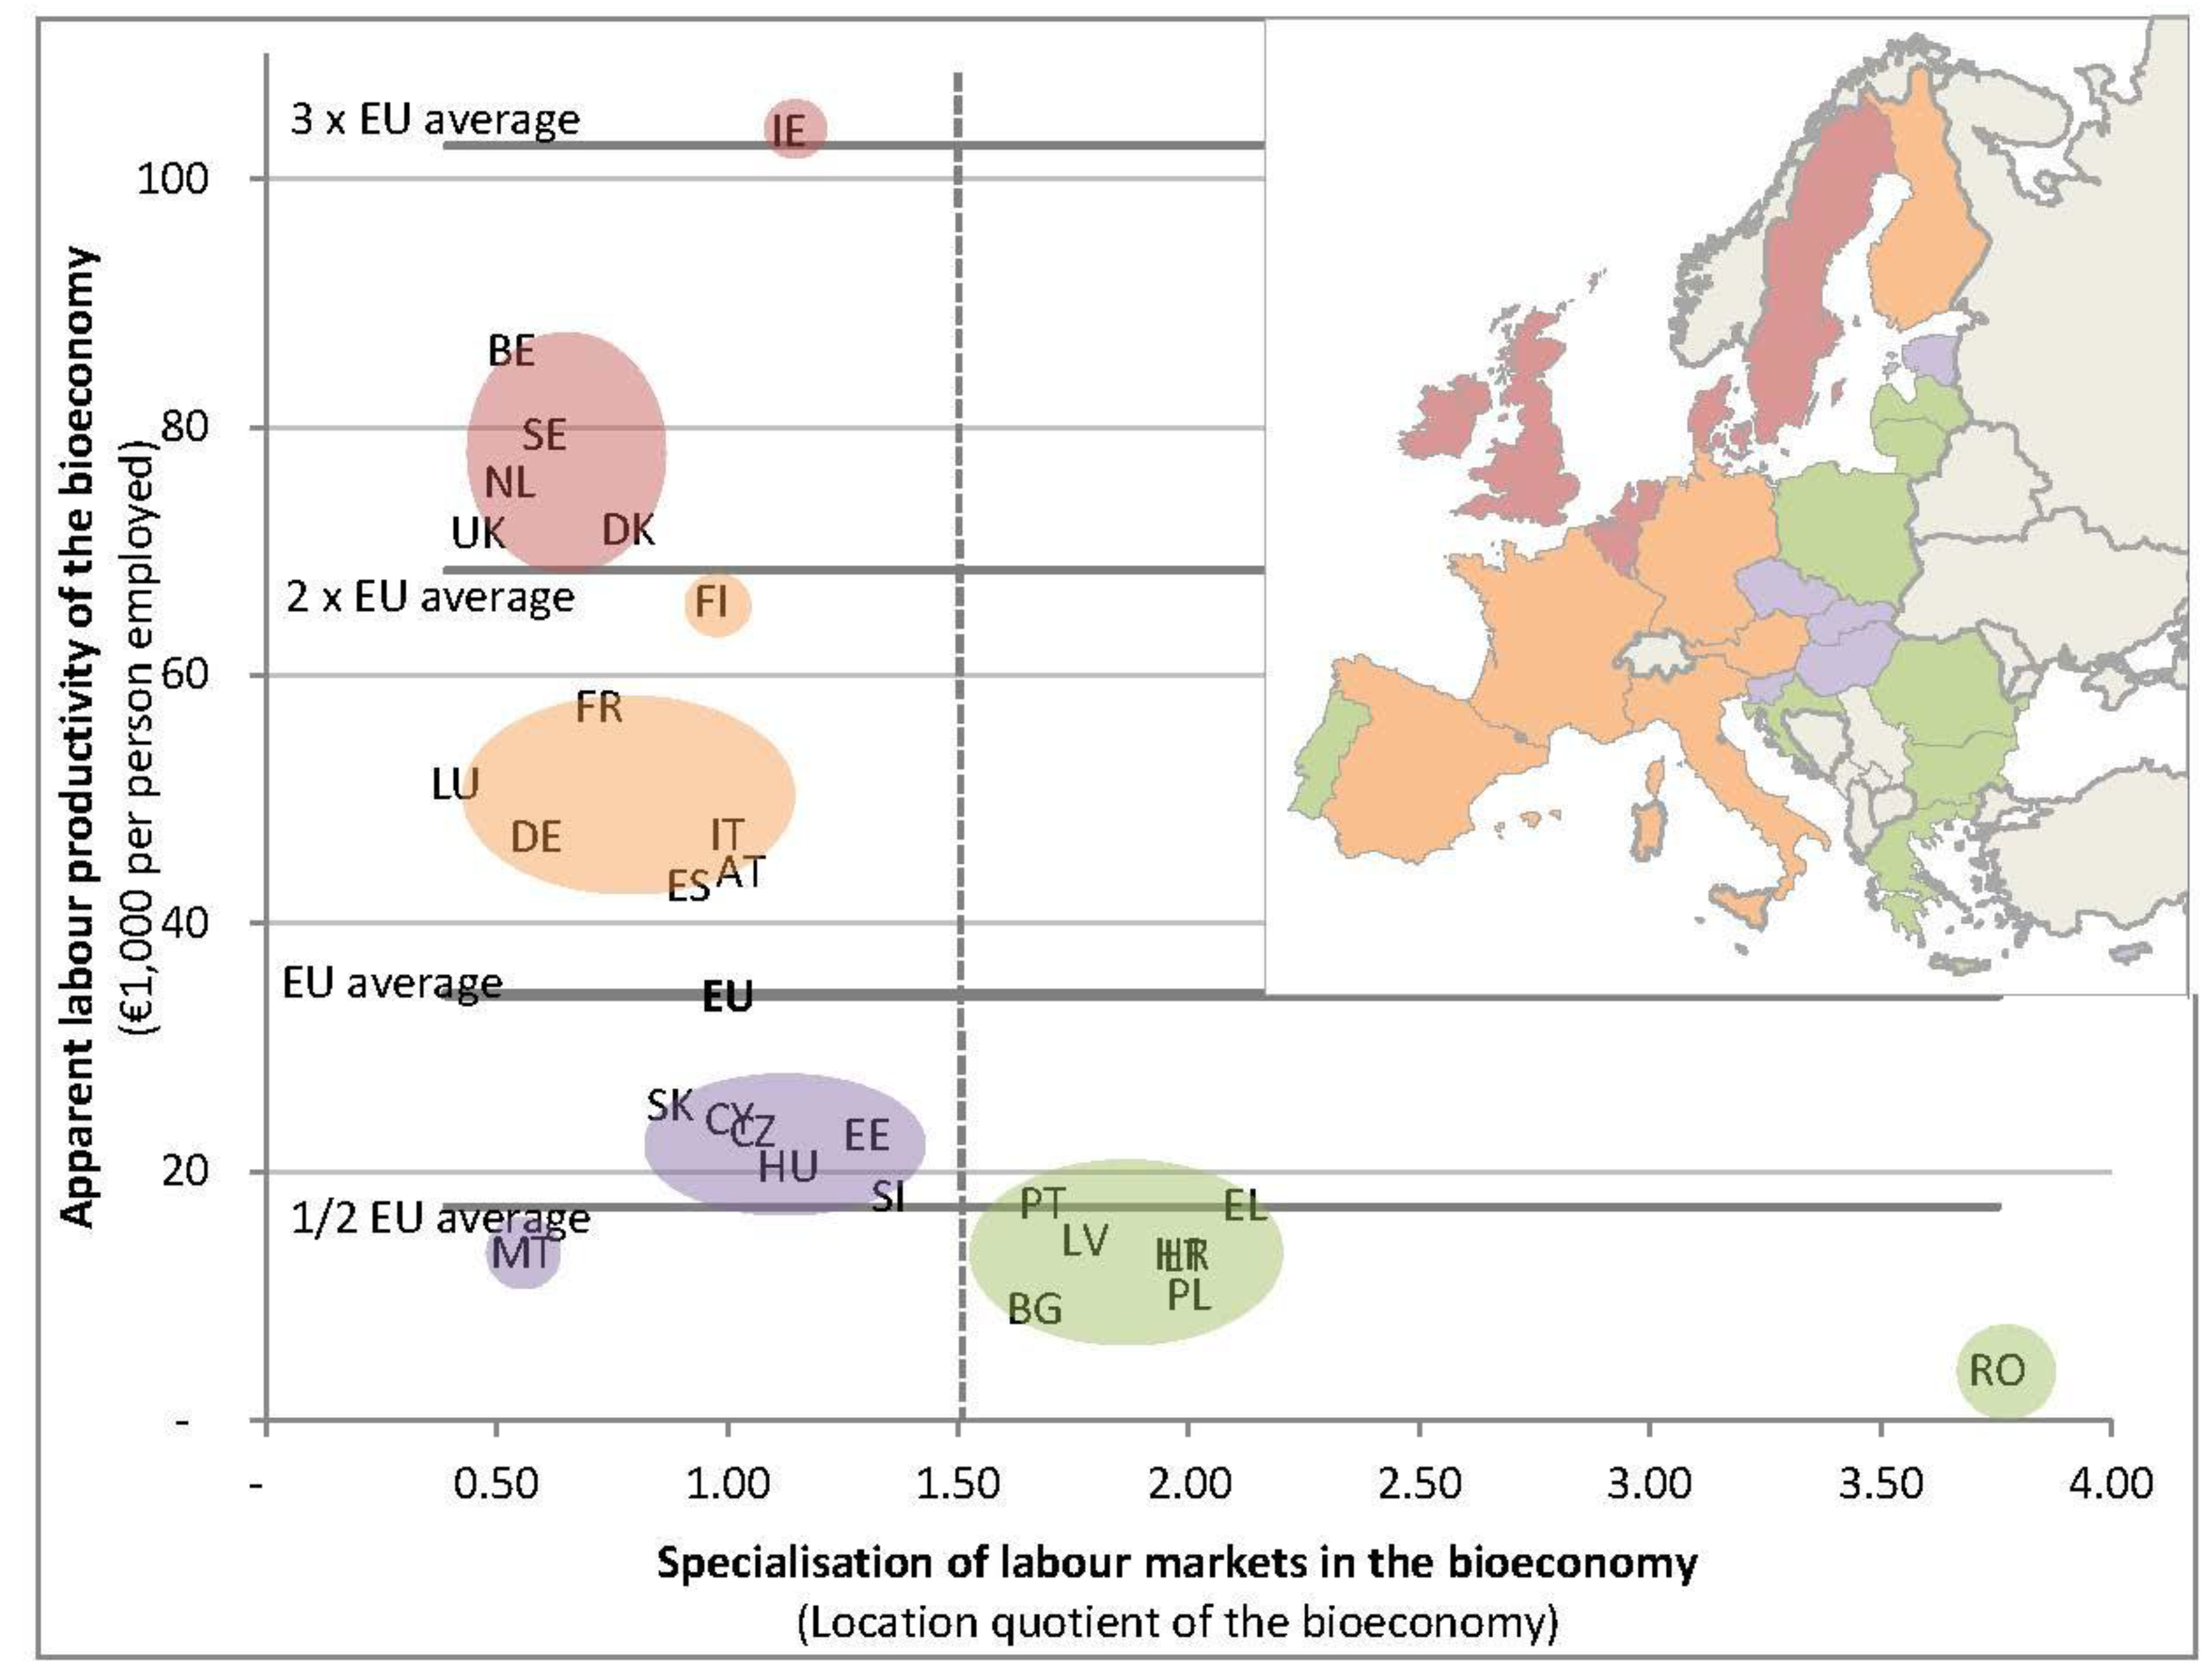
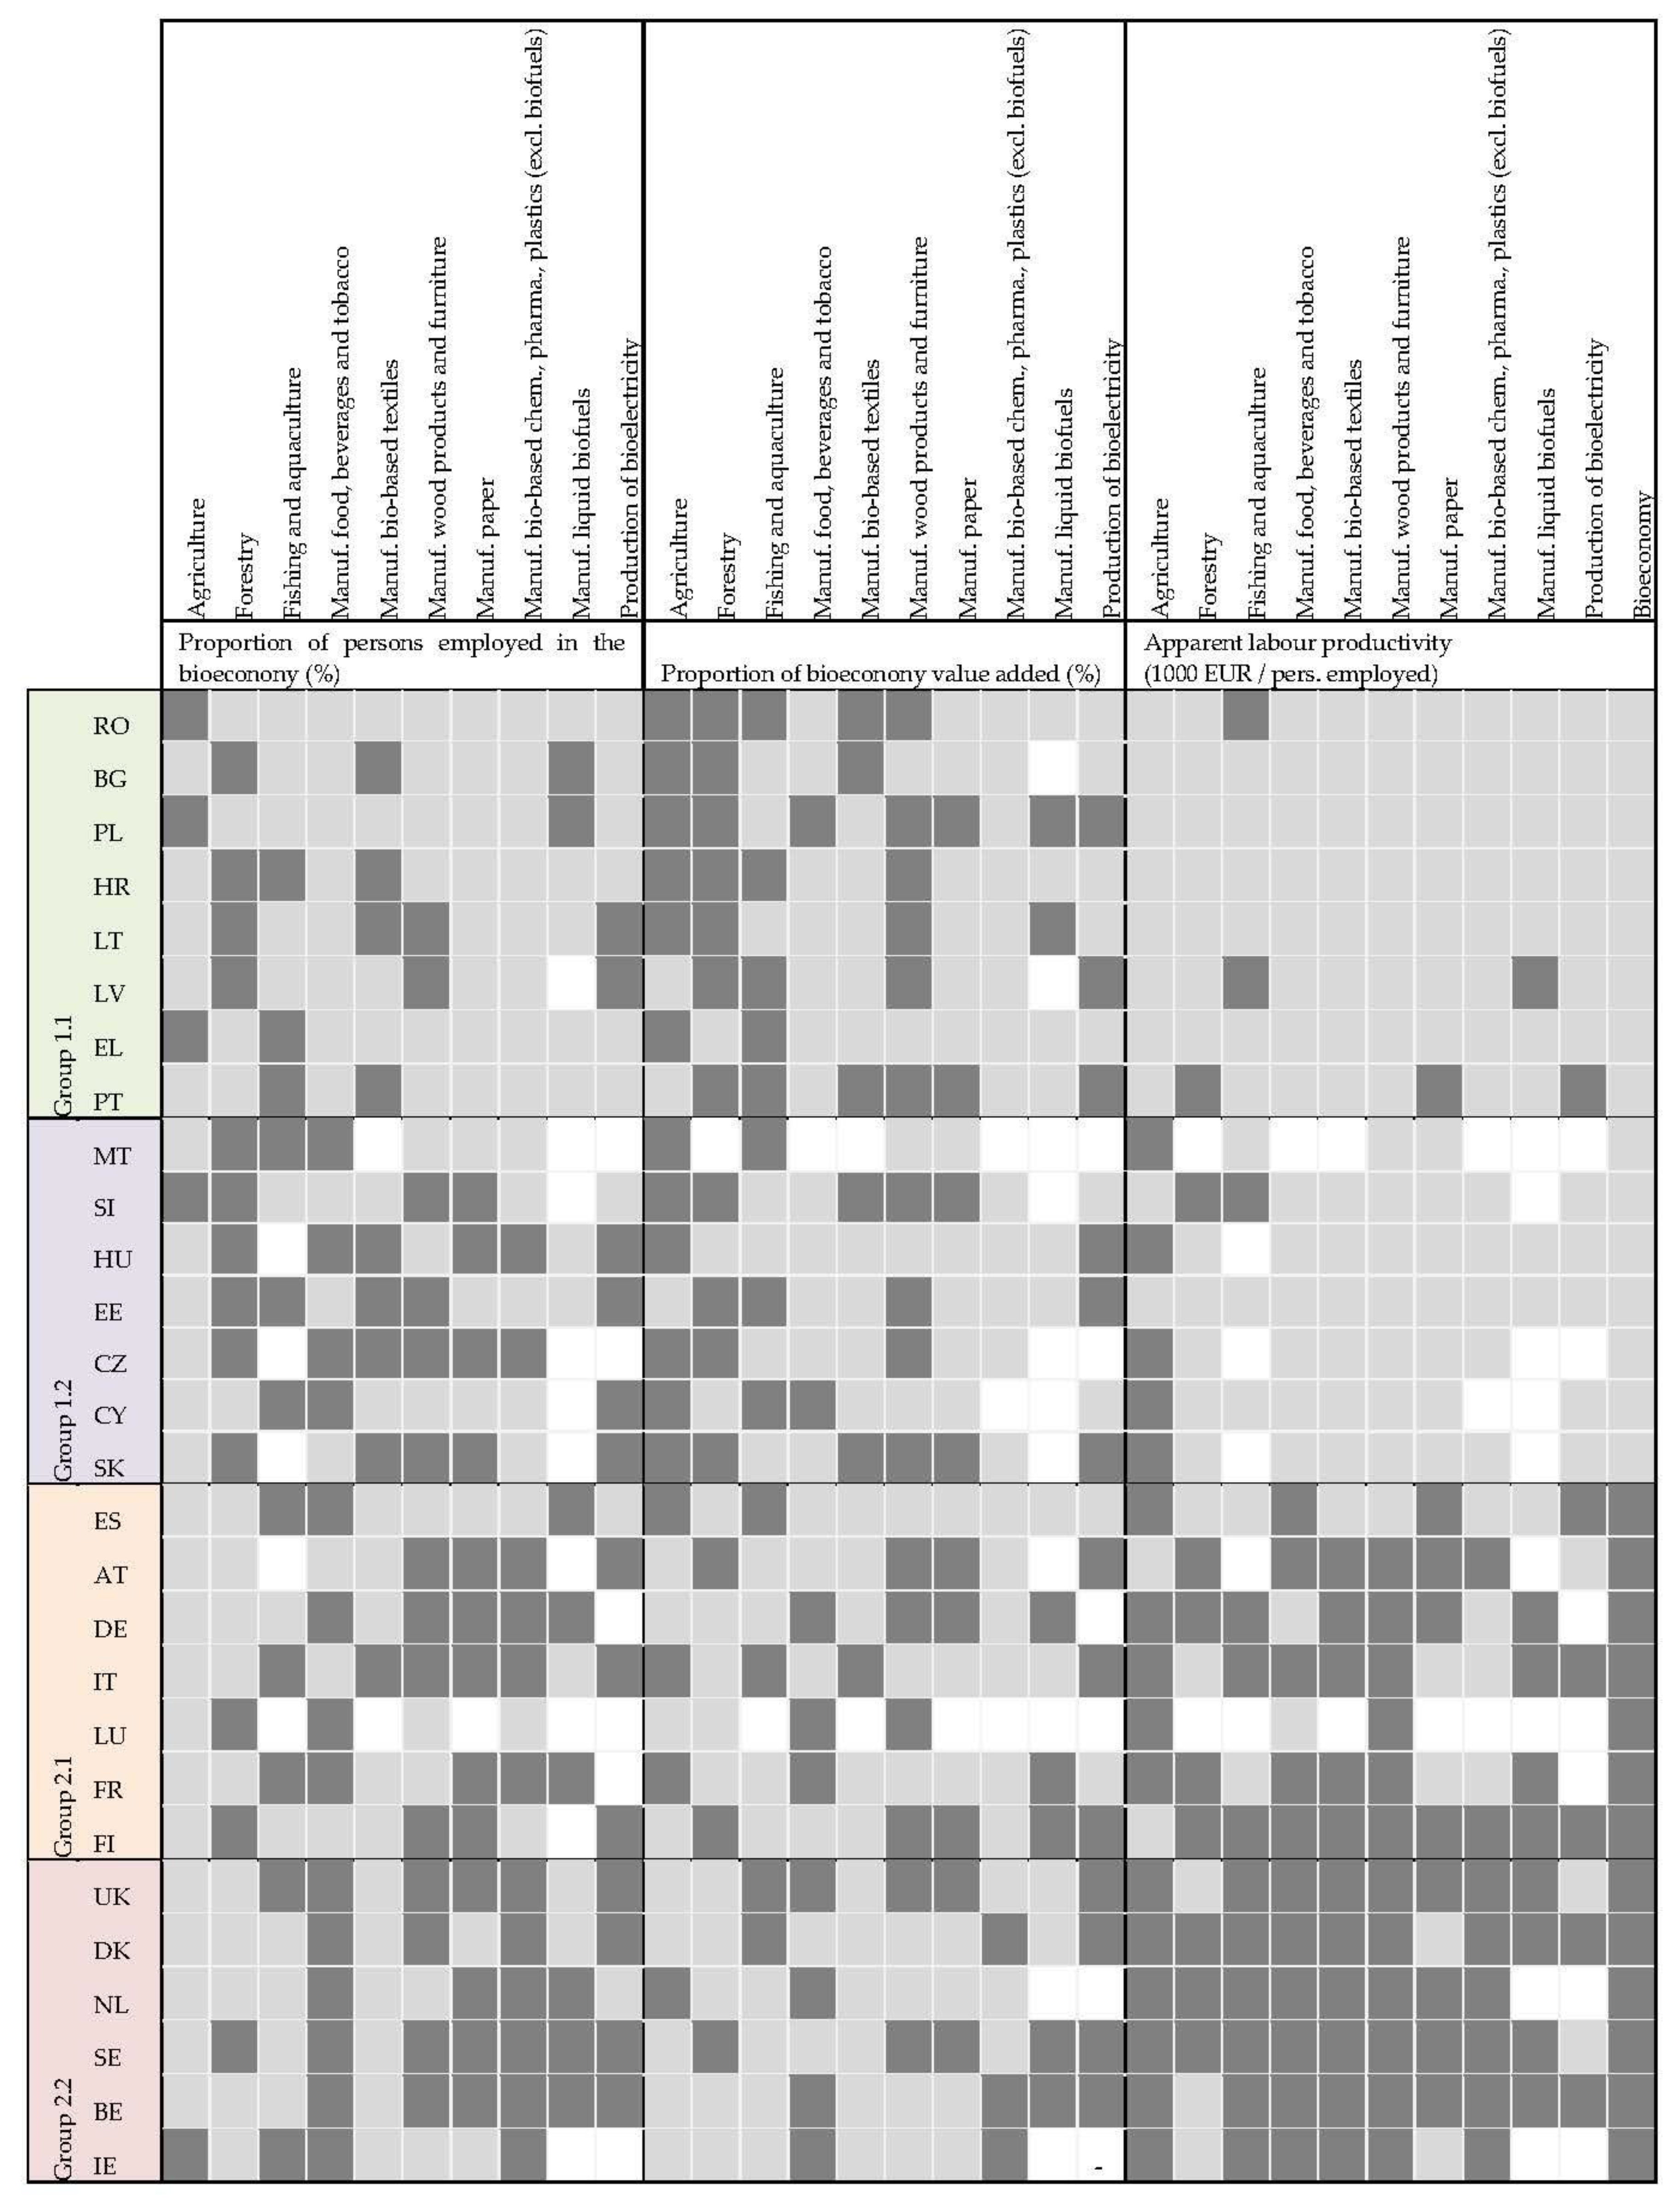
3.2. Clustering of EU Member States

The indicators shown in Section 2 illustrate considerable heterogeneity among EU Member States. As a first step to identify the state and potential evolution of Europe’s bioeconomy, we propose a clustering or typology for the EU Member States based on the socioeconomic indicators selected. The clustering reduces the complexity of the analysis of 28 countries and can therefore support monitoring and policy decision-making.
Policy initiatives already exist at the supra-national level. The Scandinavian countries of Denmark, Finland and Sweden have founded the Nordic Bioeconomy [13]. The BIOEAST initiative comprises the Central and Eastern European countries of Bulgaria, the Czech Republic, Hungary, Poland, Romania and Slovakia [14]. This initiative argues that an east-west divide exists in the EU, with eastern countries serving only as raw material providers for big companies in the west and having limited access to research. Developing bioeconomy strategies for these countries can contribute to overcome existing or perceived geographical imbalances and better exploit untapped potential.
Literature related to bioeconomy typologies is still in its infancy. Philippidis et al. [15], and Mainar Causapé et al. [16] employed disaggregated social accounting matrices and multipliers to analyse the bioeconomy of the EU. Employing the same tools of analysis, a similar case study was conducted for the Spanish economy (Cardenete et al.) [17]
A typology of European regions according to their bioeconomy profile and approach is proposed by Spatial Foresight et al. [18] with the aim of gathering stakeholders around specific bioeconomy sectors/products.
In this article we focus on a more aggregated and macro-economic analysis, taking into account two criteria for a typology: the concentration of national labour markets into the bioeconomy, and apparent labour productivity of the bioeconomy. The first criterion acts as a proxy for the employment situation, while the second reflects economic growth potential. This approach enables comparisons between countries, insights into the complex interactions of job and growth creation, and, finally, the identification of potential future pathways of countries that exhibit similar dynamic patterns.

3.2.1. Eastern Member States, Portugal and Greece (Group 1.1)

This group is defined by a strong specialisation of national labour markets in the bioeconomy (location quotient higher than 1.6 in 2015) but a level of apparent labour productivity of the bioeconomy below half the EU-28 level (i.e., less than €18,000 of value added per person employed in 2015). It comprises Romania, Greece, Lithuania, Poland, Croatia, Portugal, Latvia and Bulgaria (see Figure 2).
These Member States joined the European Union after 2004 and show the lowest levels of GDP per capita of the EU-28 (below €11,600 per capita), with the exception of Greece and Portugal, which entered the EU in 1981 and 1986 respectively and reached around €17,000 of GDP per capita in 2015 (far below the EU-28 level of €26,600 per capita (Eurostat sdg_08_10, http://ec.europa.eu/eurostat/web/products-datasets/-/sdg_08_10)).
Over half of the bioeconomy labour force in this group is concentrated in biomass-producing sectors (i.e., agriculture, forestry and the fishing sector), which generate 33–63% of the bioeconomy value added. The agriculture sector alone contributes between 38% and 81% of bioeconomy jobs and 23–55% of the value added. The agricultural focus is extremely strong in Romania and Greece, where it provides more than 70% of bioeconomy jobs and around 55% of the bioeconomy value added. In Latvia, Bulgaria and Lithuania, the relatively low contribution of agriculture to bioeconomy jobs (38–48%) is compensated for by a strong contribution of the forestry sector (6–14% versus 3% on average in the EU-28). The contribution of agriculture and forestry to the bioeconomy value added is also higher in this group than the average in the EU-28. The fishing sector contributes nearly 5% of the bioeconomy jobs in Greece, which is not negligible compared with other EU-28 Member States (1.2% on average across the EU-28).
As regards downstream bio-based value chains, the manufacture of food, beverage and tobacco is the second largest employing sector (7–24% of bioeconomy employment), after agriculture, and the second largest contributor to the bioeconomy value added (15–38%). Nevertheless, its relative contribution is below the EU-28 average in both employment and value added terms (see Figure 3). The strong forestry basis of Latvia and Lithuania has triggered the development of the manufacture of wood products and furniture (respectively 22% and 16% of bioeconomy jobs; 27% and 16% of the bioeconomy value added) but not the manufacture of paper sector (which is less than the EU average). The manufacture of bio-based textiles contributes more to the bioeconomy labour market in Portugal (17%), Bulgaria (15%), Croatia (7%) and Lithuania (6%) than on average in the EU (5.5%). Finally, the manufacture of bio-based chemicals, pharmaceuticals, plastic and rubber is under-represented in the bioeconomy labour market (less than 1.7% of bioeconomy employment) compared with the EU average (2.5%) as well as in value added terms (less than 4% of the bioeconomy value added versus 9% in the EU). The case of Portugal is remarkable: it reaches high levels of productivity compared with the other Member States of this group in forestry, the manufacture of wood products and furniture and the manufacture of paper sectors. Thus, these three sectors generate one-quarter of the bioeconomy value added in Portugal while employing only 11% of the bioeconomy labour force.
In summary, the bioeconomy pattern of this group is geared towards biomass-producing sectors and the manufacture of food, beverage and tobacco sector. Other low-productive manufacturing sectors can play a significant role according to historical sectoral specialisation (e.g., the manufacture of bio-based textiles in Portugal) or to biomass endowment (e.g., the manufacture of wood products and furniture in Latvia and Lithuania). More labour-productive sectors, such as the manufacture of paper and the manufacture of bio-based chemicals, pharmaceuticals, plastics and rubber, are not very developed. The apparent labour productivity in all bioeconomy sectors is lower than the EU-28 average, except in the Portuguese forestry sector. Therefore, there remains a large potential for the development of the bioeconomy in these Member States. This is in line with the research and innovation (R&I) bioeconomy index calculated in 2017. This index refers to the bioeconomy R&I maturity level of a given country or region. It derives from four variables: (i) the innovation capacity and activity, (ii) the existence of a specific bioeconomy strategy, (iii) the existence of bioeconomy-related clusters and (iv) the intensity level of bioeconomy-related activities [18]. In the case of Member States of group 1.1, the index does not exceed 5 on a scale from 1 to 10 in any of these Member States except Portugal (which has a level of 6/10) [18]. It is also important to note that, among these countries, only Latvia has its own bioeconomy strategy, the LIBRA. Drawn up in 2017, the strategy runs until 2030 [19].

3.2.2. Baltic and Central Member States (Group 1.2)

This group is defined by a medium specialisation of national labour markets in the bioeconomy on the EU-28 scale (location quotient from 0.9 to 1.3) and a level of apparent labour productivity of the bioeconomy of between half the EU-28 level and the EU-28 average level (i.e., €18,000 to €26,000 of value added per person employed in 2015). It comprises Slovakia, Cyprus, the Czech Republic, Estonia, Hungary, Malta and Slovenia (see Figure 2). Note that Malta presents a lower location quotient (1.6) and a lower bioeconomy value added per capita (€14,000) than the other Member States in this group. Nevertheless, we classify it in group 1.2 because this group is the closest to Malta’s characteristics.
These Member States joined the European Union after 2004. In 2015, their GDP per capita varied between €11,000 and €21,000, below the EU-28 average level of €26,600 per capita (Eurostat sdg_08_10, http://ec.europa.eu/eurostat/web/products-datasets/-/sdg_08_10) but in general higher than levels reached in group 1.1.
Agriculture and the manufacture of food, beverage and tobacco are the main sources of bioeconomy jobs and value added in group 1.2. This group differs from group 1.1 in that the highest levels of apparent labour productivity reached were in the agricultural sector. As a result, agriculture in group 1.2 contributes a similar proportion to the whole bioeconomy value added (18–48% according to the Member States) while employing a lower proportion of bioeconomy workers (24–46%) than in group 1.1. The very low proportion of agricultural jobs within the bioeconomy labour market reflects a sectoral development towards other biomass-producing sectors, in which the Member States are better endowed (e.g., in Malta the fishing sector provides 19% of bioeconomy jobs and in Estonia, Slovakia and the Czech Republic forestry provides 8–11% of bioeconomy jobs). The manufacture of food, beverage and tobacco contributes to the whole bioeconomy value added in a similar proportion to the Member States of group 1.1 (17–30%) and has an apparent labour productivity below the EU-28 average level (see Figure 3). However, the Czech Republic is an exception, with 47% of the bioeconomy value added generated by the manufacture of food, beverage and tobacco. The manufacture of food, beverage and tobacco is the top employing sector of the Maltese and Czech bioeconomies and the second in the other group 1.2 Member States (except Estonia).
The manufacture of wood and furniture is another important manufacturing sector of this group, in particular in Estonia, where it represents the main source of bioeconomy jobs (31%) and value added (34%). It is the third source of bioeconomy jobs in the other Member States of this group (except in Malta where the fishing sector contributes to 19% of bioeconomy jobs) and it generates 11% and 15% of the bioeconomy value added in the Czech Republic and Slovenia, respectively. The paper industry contributes 7–9% to the bioeconomy value added in these countries. Finally, the most labour productive sectors of the bioeconomy—i.e., the manufacture of bio-based chemicals, pharmaceuticals, plastics and rubber—are less developed than the average in the EU, Hungary’s and Czech’s manufacture of bio-based pharmaceuticals being an exception (see Figure 3).
This group of Member States could illustrate the initial stage of a bioeconomy transition characterised by the intermediate levels of apparent labour productivity achieved in low productive sectors. Intermediate levels of productivity are indeed observed in agriculture and forestry. Labour productivity remains low in the other bioeconomy sectors. Therefore, there is still potential for (i) improving the apparent labour productivity in bio-based manufacturing sectors and (ii) developing the bio-based industry in general. R&I bioeconomy indices confirm a low to medium maturity in bioeconomy R&I in this group of Member States (the index ranges from 1/10 to 6/10). The transition could be assisted in future years by national R&I orientations: the biochemical and biopharmaceutical sectors are a R&I priority in Slovenia, the Czech Republic and Slovakia; the biochemical sector alone is a priority in Estonia; and Malta and Slovenia focus their bioeconomy R&I on biorefineries [18]. Hungary has a 2011–2020 ‘National Environmental Technology Innovation Strategy’ in place [20] that addresses some sectors of the bioeconomy: renewable energy, agriculture and soil protection, the construction industry, and waste. R&I priorities in these Member States demonstrate efforts to develop the bio-based sectors.

3.2.3. Western Member further States (Group 2.1)

This group is defined by a low-to-medium specialisation of national labour markets into the bioeconomy on the EU-28 scale (location quotient from 0.4 to 1) and a level of apparent labour productivity of the bioeconomy between the EU-28 level and twice the EU-28 average level (i.e., €43,000 to €67,000 of value added per person employed in 2015). It comprises Austria, Spain, Italy, Germany, Luxembourg, France and Finland (see Figure 2). However, the classification of Finland in group 2.1 (‘Western Member States’) might be temporary, as it is close to meeting all the characteristics of the bioeconomy in group 2.2 (‘Northern Member States’); See Section 3.3). Note that Luxembourg will not be included in the following comments because of a lack of data for many sectors, which distorts the overall picture. Indeed, data for Luxembourg are available for only a few sectors: agriculture, the manufacture of food, beverages and tobacco, and the manufacture of wood products.
This group includes Member States that joined the EU between 1952 and 1995. They reach a medium level of GDP per capita (€23,100 to €36,200, Luxembourg being an outlier with €81,300 of GDP per capita).
Although agriculture and the food industry dominate the bioeconomy in this group of Member States, these states tend to be more diversified across sectors than those in group 1.2. A slightly higher proportion of bioeconomy workers is employed in the manufacture of paper and bio-based chemicals and pharmaceuticals. Higher apparent labour productivity levels are reached in all the bioeconomy sectors (see Figure 3), so high labour productive sectors contribute even more to the total bioeconomy value added. The bioeconomy profiles of France and Spain are squeezed into the agriculture and food industry sectors, which generate more than the three quarters of their bioeconomy value added. In contrast, the contribution of agriculture to the bioeconomy value added is low in Germany (16%) and Austria (17%). The food industry sector in these countries’ bioeconomies is pivotal (respectively 44% and 36% in value added) but they have also developed woody biomass value chains (respectively 25% and 36% of the bioeconomy value added from forestry and the manufacture of wood and paper) and the manufacture of bio-based chemicals, pharmaceuticals, plastics and rubber (12% for Germany and 7% for Austria).
Within this group, Finland presents a special profile with (i) the lowest representation of agriculture and the manufacture of food, beverages and tobacco in its bioeconomy (in terms of both jobs and value added) and (ii) among the highest levels of labour productivity in the EU-28 in forestry and the manufacture of wood and paper. Consequently, woody biomass value chains provide 61% of the bioeconomy value added in Finland (versus 10–36% in the other Member States of this group).
In more general terms, the higher sectoral diversification and productivity in this group suggest a higher maturity of the bioeconomy manufacturing sectors than in groups 1.1 and 1.2. Biorefineries and biochemicals are among the R&I priorities of all Member States of this group (except Luxembourg) as are biopharmaceuticals for all Member States except Italy [18]. In addition, most of these Member States have developed a national bioeconomy strategy, which reflects a certain political support to this sector. Indeed, national bioeconomy strategies were already in place in 2014 in Finland [21] and Germany [22]. National strategies were released more recently, in 2016 and 2017, in Mediterranean Member States: Spain [23], France [24] and Italy [25]. A bioeconomy policy paper is under development in Austria. Luxembourg is the only Member State of this group with no strong strategic orientation towards the bioeconomy.

3.2.4. Northern Member States (Group 2.2)

This group is defined by a low degree of specialisation of national labour markets in the bioeconomy on the EU-28 scale (location quotient from 0.4 to 0.8, except Ireland with 1.1) and the highest levels of apparent labour productivity of the bioeconomy in the EU-28 (i.e., €72,000 to €104,000 of value added per person employed in 2015, which is above twice the EU-28 average level). It comprises Denmark, the Netherlands, the United Kingdom, Sweden, Belgium and Ireland (see Figure 2).
This group comprises Member States that joined the EU between 1952 and 1995. Their GDP per capita is above the EU average (€31,300 to €51,400).
The bioeconomy of these Member States is close to that of group 2.1 but it differs in the even greater significance of the manufacture of bio-based chemicals and pharmaceuticals. Another characteristic of this group is that the manufacture of bio-based textiles is not well developed (fewer than 3% of bioeconomy jobs and less than 2% of the bioeconomy value added) and there is only one Member State, Sweden, that exhibits an orientation towards the woody biomass value chains. As in group 2.1, sectoral apparent labour productivities tend to be higher than in groups 1.1 and 1.2 except in agriculture and fishing. However, they are even higher than in group 2.1 in the manufacture of food, beverages and tobacco and in the manufacture of bio-based pharmaceuticals. Bioeconomy labour markets are dominated by jobs in agriculture and the food industry, but, because of the very high levels of labour productivity achieved in other sectors, the distribution among sectors of the bioeconomy value added is less concentrated. The major contributors are, in descending order, the manufacture of food, beverages and tobacco, the manufacture of bio-based pharmaceuticals, agriculture, the manufacture of paper and the manufacture of wood products and furniture.
R&I bioeconomy indices confirm a medium to high maturity in bioeconomy R&I in this group of Member States (the index ranges from 5/10 to 10/10). Biorefineries and the biochemical and biopharmaceutical sectors are R&I priorities in these Member States (except for the biochemical sector in Denmark, and the biopharmaceutical sector in Denmark and Ireland) [18]. All states in this group put a bioeconomy or a bioeconomy-related strategy in place between 2012 and 2015 (Denmark [26], the Netherlands [27], the United Kingdom [28], Sweden [29], Belgium (Flanders [30]) and Ireland [31]). Their bioeconomy strategies and visions tend to cover a wide variety of sectors, considering market and research and innovation aspects as well as more efficient and environmentally friendly processes.

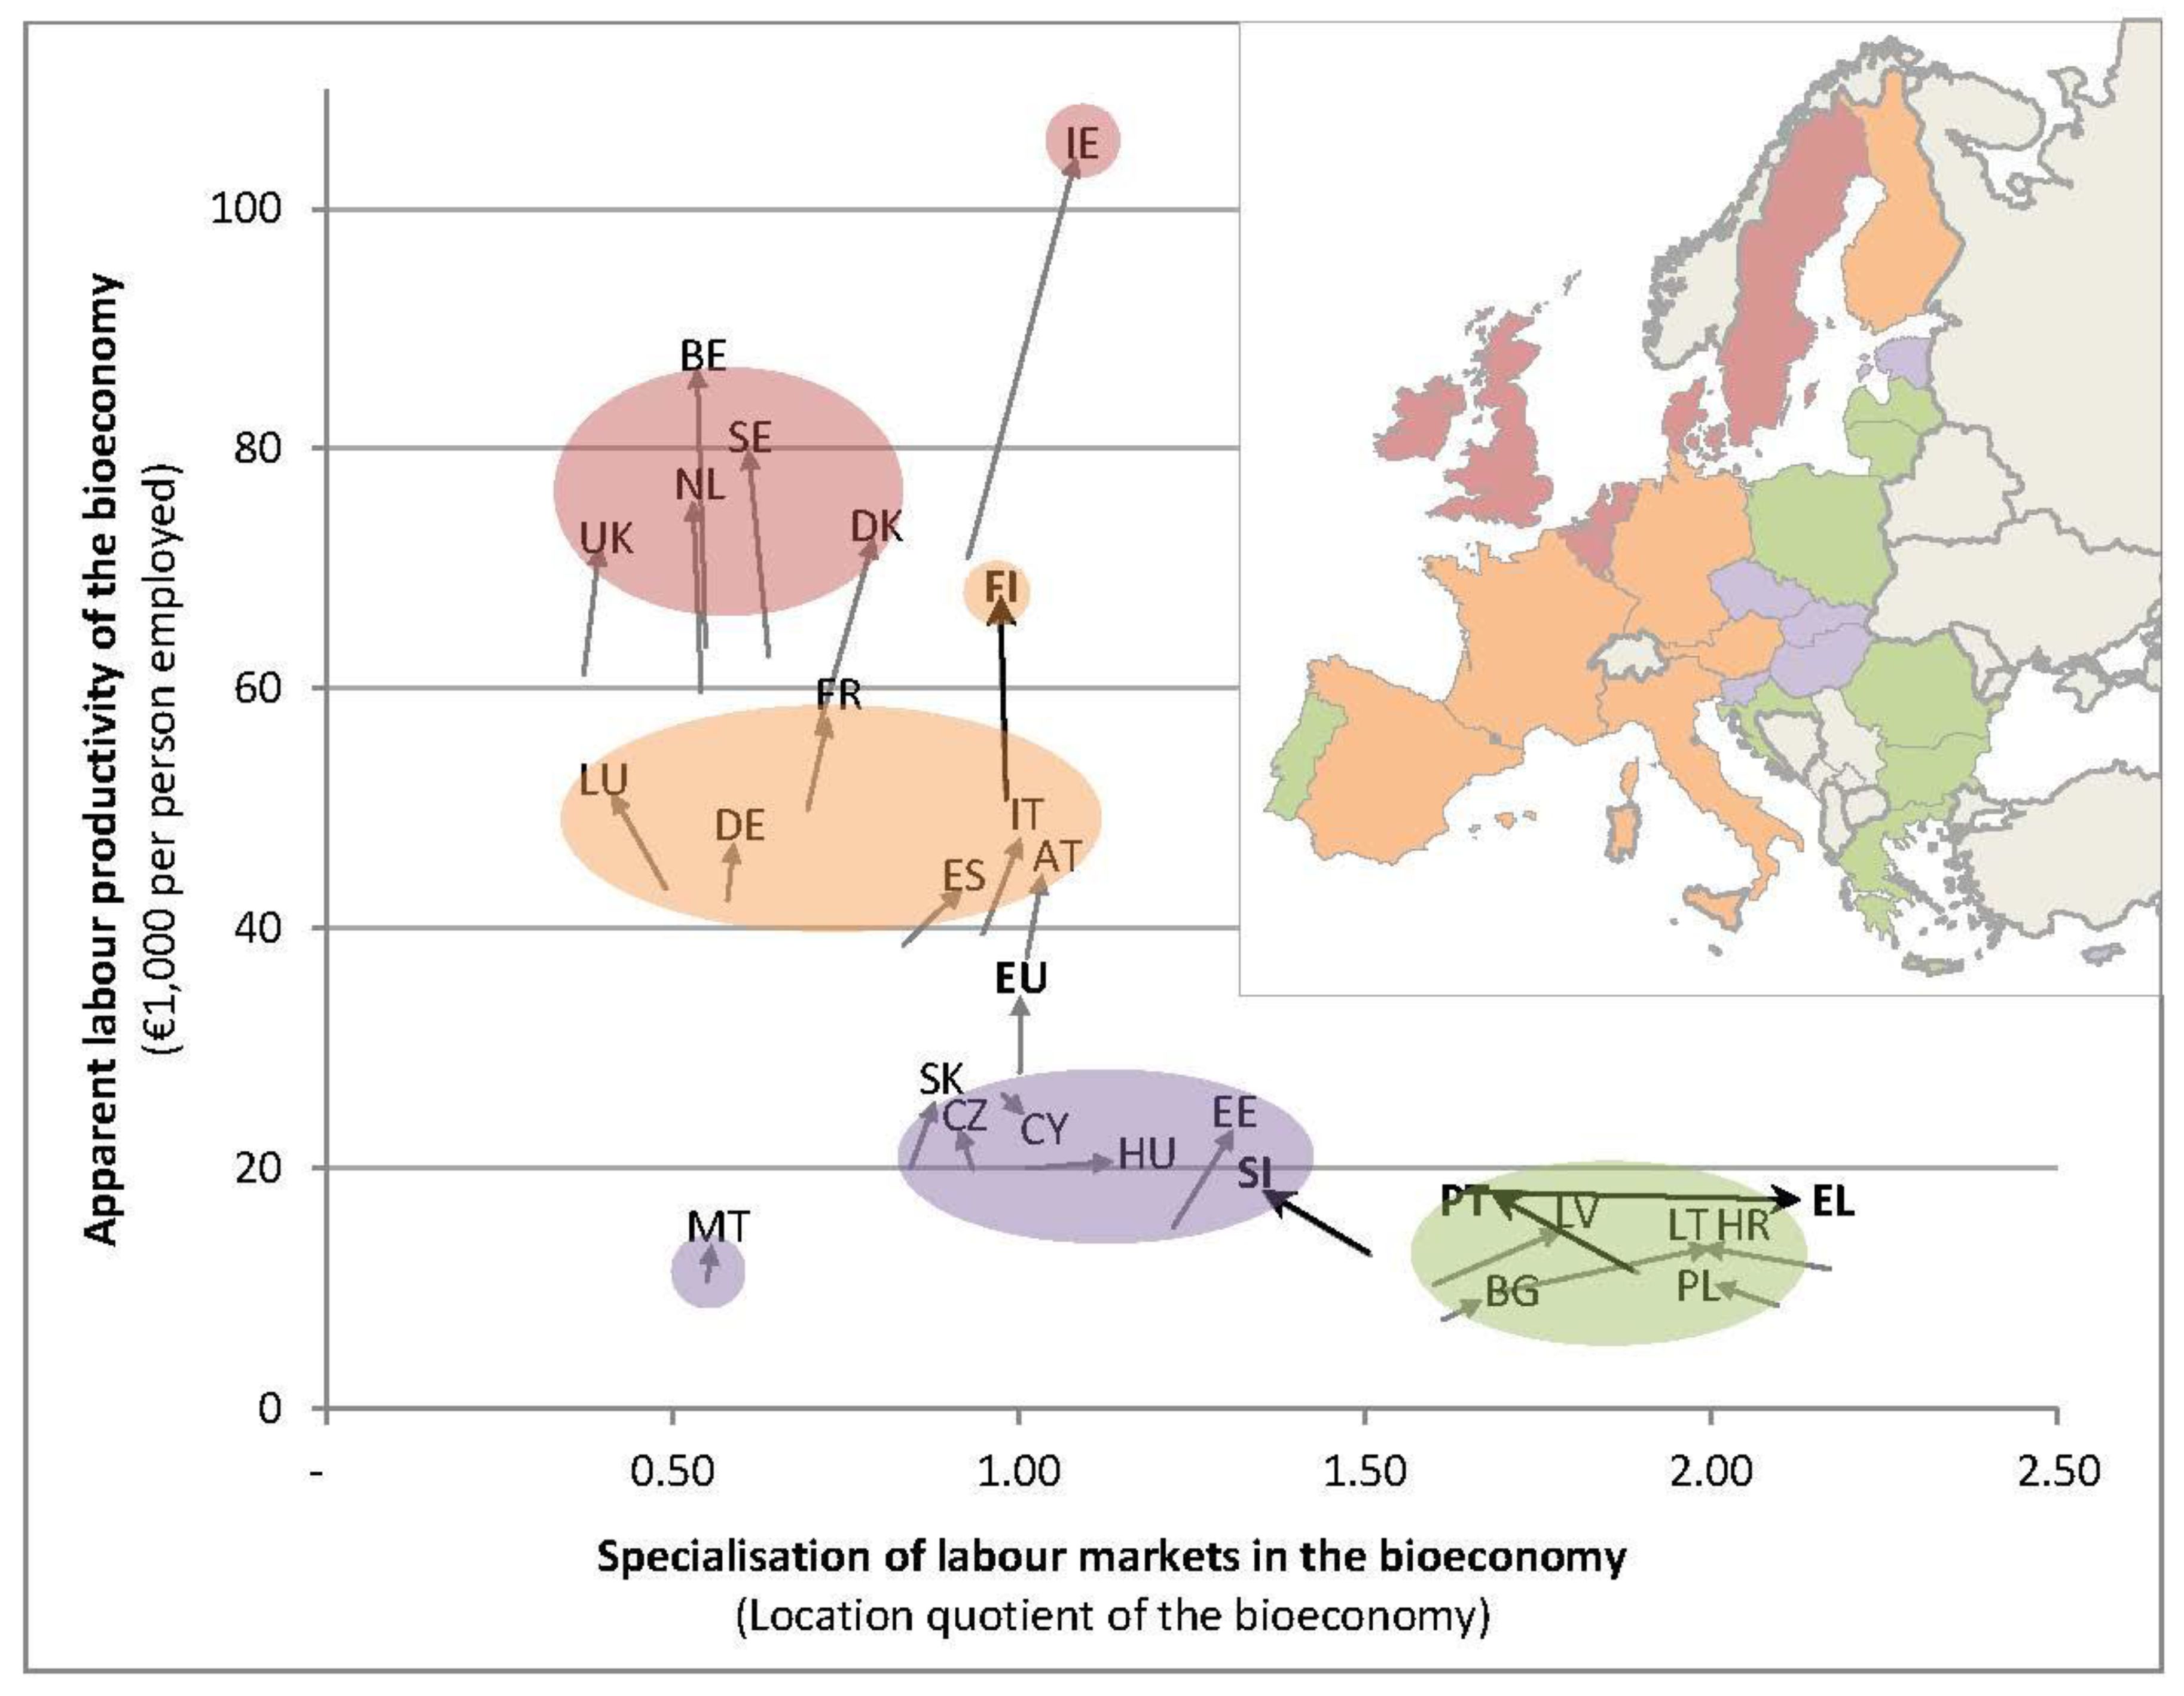
3.3. EU Member States in Transition

Over the period 2008–2015, the four bioeconomy patterns observed have evolved in a context of agricultural restructuring and a reduction of the agricultural labour force (1.5 million fewer persons employed in the agriculture sector in the EU-28 during this period), which was not compensated for with job creation in other bioeconomy sectors. During this same period, the apparent labour productivity has improved, with major gains in high labour productive sectors (growth of more than €13,000/person employed in the manufacture of paper, of bio-based chemicals, pharmaceuticals and plastics and in the production of bioelectricity) than in low labour productive sectors (growth of less than €6,000/person employed in agriculture and the manufacture of wood and bio-based textiles). A gradient is also observed alongside the four bioeconomy patterns identified: the apparent labour productivity increases by €10,000 to €33,000/person in group 2.2, by €5000 to €16,000/person in group 2.1, by −€2000 to €8000/person in group 1.2 and by 0 to €6000/person in group 1.1. Overall, bigger increases in bioeconomy value added are observed in Member States of groups 2.1 and 2.2 (except Spain and Luxembourg).
Although the four bioeconomy patterns continued between 2008 and 2015, a few Member States have experienced individual developments: Slovenia, Portugal, Greece and Finland.
Slovenia is a very interesting case, as it shows a type 1.2 profile in 2015 with some characteristics of type 1.1 that could be the mark of an uncompleted transition from group 1.1 to group 1.2. Slovenia’s characteristics of type 1.1 in 2015 are the relatively high specialisation of its labour market in agriculture (7% of total jobs, 59% of bioeconomy jobs), the low apparent productivity of agriculture and the low diversification of its bioeconomy (in particular the manufacture of food, beverages and tobacco, which accounts for only 16% of bioeconomy jobs).
Looking at Slovenia in 2008, its bioeconomy presented all the characteristics of a member of group 1.1, that is to say a location quotient higher than 1.5, an apparent labour productivity lower than half the EU-28 average and a high specialisation in agriculture with a low level of labour productivity (see Figure 4). Nevertheless, it had already achieved levels of apparent labour productivity at the top end of the group 1.2 range in many bioeconomy sectors (i.e., forestry, fishing, the manufacture of bio-based textiles, the manufacture of bio-based plastics and the manufacture of food, beverages and tobacco). It also already generated a GDP per capita comparable to those of Member States in group 1.2. Between 2008 and 2015, the apparent labour productivity of the Slovenian bioeconomy improved by €5000 of value added per person employed. Major improvements occurred in fishing, the manufacture of paper, forestry and the manufacture of bio-based chemicals, bio-based pharmaceuticals and bio-based plastics. Therefore, in 2015 the apparent labour productivity in Slovenia attained the first or second rank of group 1.2 in all bioeconomy sectors except agriculture and the production of bioelectricity.
Assuming that the Slovenian bioeconomy has been evolving towards a bioeconomy pattern of type 1.2 from a 1.1 pattern, the last step would be a rise in the level of apparent labour productivity in agriculture. This would also raise the overall apparent labour productivity of the bioeconomy. It would certainly be concomitant to a reduction in agricultural jobs, entailing a further reduction of the location quotient of the Slovenian bioeconomy.
Within group 1.1, the Portuguese bioeconomy has also evolved substantially so that, by 2015, its characteristics were closer to those of group 1.2. First, the Portuguese bioeconomy labour market was less concentrated in agriculture in 2015 (51% of bioeconomy workers) than it was in 2008 (62% of bioeconomy workers). The number of agricultural workers in Portugal has shrunk drastically (reducing by 234,000 workers during this period). This has been accompanied by a stronger specialisation in the manufacture of food, beverages and tobacco and in the manufacture of bio-based textiles (both of which employed 17% of bioeconomy workers in 2015 versus 13% in 2008). Second, the apparent labour productivity of the Portuguese bioeconomy has grown more (+€6000 of value added per person employed) than in other Member States of group 1.1. The production of bioelectricity generated €40,000 per person employed more in 2015 than it did in 2008. The manufacture of paper sector and the forestry sector recorded progress of around €30,000 per person employed, and the production of bio-based chemicals, pharmaceuticals and plastics sector was €10,000 more productive per person employed in 2015 than it was in 2008. Consequently, apart from the agriculture and fishing sectors, where labour productivity remained very low throughout the period, the Portuguese bioeconomy sectors attained the highest levels of apparent labour productivity within group 1.1. The labour productivity of forestry and the manufacture of paper is even higher in Portugal than in group 1.2. As a result, in 2015, the apparent labour productivity of the Portuguese bioeconomy was as high as half the EU-28 average, i.e., at the threshold between groups 1.1 and 1.2. Nevertheless, its location quotient remained high (1.7) compared with group 1.2. It seems that the non-bioeconomy sectors did not develop as fast as in the other EU Member States between 2008 and 2015, a period that was marked by a deep economic crisis in Portugal (the GDP per capita contracted from €17,200 to €16,600 in this period). Although the proportion of bioeconomy workers in the whole economy reduced from 17% in 2008 to 14% in 2015, this remains high compared with Member States of group 1.2 (where it was at most 11%). Finally, if the trends of 2008–2015 continue in the coming years, the Portuguese bioeconomy could complete the last steps of a transition and present a bioeconomy pattern of type 1.2.
The Greek case illustrates the opposite trend: in 2008, it displayed a hybrid bioeconomy pattern that positioned it between groups 1.1 and 1.2, but by 2015 Greece had consolidated its position within group 1.1. Indeed, over the 2008–2015 period its location quotient increased from 1.7 to 2.1 and its apparent labour productivity did not stay above half the EU-28 average threshold. The change in location quotient is linked with the very strong impacts of the 2008 economic crisis on the employment structure of Greece. Total employment in Greece decreased by 22% in this period, affecting the bioeconomy sectors to a lesser extent (11% of job losses). Within the bioeconomy, only the manufacture of bio-based textiles and the manufacture of wood and furniture reduced their labour market share. All other bioeconomy sectors either maintained or increased their standing in the national labour market, especially the agriculture sector, which contributed 10.69% of Greek jobs in 2008 and 12.37% in 2015.
The evolution of the apparent labour productivity of the Greek bioeconomy has to be put in perspective with the European dynamic: the bioeconomy labour productivity remained stable in Greece (around €18,000 per person employed) while it was improving in all the other EU-28 Member States (except Cyprus and Romania). As a result, Greece’s performance deteriorated compared with the EU-28 average: from above half the EU average in 2008, to just half the average in 2015.
The Greek case emphasises the relationship between the bioeconomy and the rest of the economy. In the same way, Greece has moved fast in a context of recent economic crisis, suggesting that it can catch up once the economic environment recovers.
The Slovenian, Portuguese and Greek examples are illustrations of ongoing developments within the Member States of groups 1.1 and 1.2. However, we have not observed any case of transformation of a bioeconomy pattern of type 1 (including 1.1 and 1.2) to type 2. This suggests that the necessary leap in productivity might be more difficult to achieve than a transition from group 1.1 to 1.2, or that it requires longer than the time period here observed, or that the enabling conditions for such a transition were not met between 2008 and 2015. In contrast, it seems that an evolution from a bioeconomy pattern of type 2.1 towards one of type 2.2 is unfolding in Finland. The Finnish bioeconomy has shown a leap in productivity from €51,000 per person employed in 2008 to €67,000 per person employed in 2015 and it is approaching the threshold of twice the EU average level. Labour productivity has grown faster in Finland than in the other bioeconomies of group 2.1 with major improvements in the manufacturing sectors (mainly biofuels, paper, bio-based chemicals, bio-based pharmaceuticals and wood) and the forestry sector. In 2015, the apparent labour productivity in woody biomass value chains reached levels equivalent to that of Member States of group 2.2. The bioeconomy strategy adopted in Finland in 2014 may reinforce this trend as it focuses on the sectors that have progressed more: the wood value chain (with actions in forestry, timber construction and bioenergy) and the manufacture of bio-based chemicals and pharmaceuticals as part of the strategic focus on the health sector [21]. In conclusion, the conditions seem to be met that will enable the Finnish bioeconomy to acquire the full characteristics of group 2.2, the group of Northern European Member States.

4. Discussion

4.1. Reflections on Turnover and Added Value as Economic Indicators

The 2012 Communication from the Commission to the European Parliament, the Council, the European Economic and Social Committee and the Committee of the Regions on ‘Innovating for Sustainable Growth: A Bioeconomy for Europe’ [1] presented the economic significance of the bioeconomy in terms of turnover. The JRC [5,6,32] and the nova-Institute for Ecology and Innovation [5,7] followed this approach and presented results at EU and Member State levels in terms of turnover.
Turnover corresponds to the total value of market sales of goods and services to third parties and therefore is, in most cases, higher than value added or the share of GDP [9].
Sectors with a high proportion of inputs (or high costs of bought-in goods and services) have a particularly high turnover. This becomes evident when directly comparing turnover and value added by bioeconomy sector, (gross) value added being defined by EUROSTAT as output minus intermediate consumption. As shown in Section 3.1, the turnover share of the manufacture of food, beverage and tobacco sector in the bioeconomy (51%) is far more important than its value-added share (38%), while the opposite is true in agriculture (17% of turnover share versus 28% of value-added share).
According to our investigations, ongoing research by the Food and Agricultural Organization of the United Nations (FAO) [33] and the MontBioeco study [34], most countries provide value-added data, for example Germany [35] or the Netherlands [36].
The authors of this article propose that, in the future, value added should be considered the main economic indicator instead of turnover, primarily because it avoids double-counting and provides the additional value created by a sector. Furthermore, it is more in line with EU Member States’ own calculations and allows for comparisons with national accounts.
The use of value added or GDP has several limitations, in particular in the context of sustainable development (see, for example, the World Economic Forum [37]). However, as one of several indicators describing the economic, social and environmental status of the bioeconomy, both provide key information on economic growth compared with the rest of the economy.

4.2. The Untapped Potential in Central and Eastern Europe

Many regions in Central and Eastern Europe have a strong agricultural tradition and have selected the bioeconomy as a smart specialisation strategy [38]. As already outlined in Section 3.2, the BIOEAST initiative assists Central and Eastern European countries (CEEC, this term is used throughout the rest of this chapter and also when the literature refers to new Member States) to operationalise their bioeconomy visions for 2030, drawing on their biomass potential to develop a sustainable increase in biomass production and circular processing of the available biomass and, in viable rural areas, also to develop an innovative, inclusive, climate-ready and inclusive growth model [14].
This article focuses on socioeconomic indicators to explain the development and potential of the bioeconomy in individual EU Member States and, eventually, in a cluster of states within the EU. It is not within the scope of this analysis to prove that much more biomass can be produced sustainably within CEEC to drive the development of their bioeconomies. Two main aspects are discussed below, which could support the argument of the untapped potential in CEEC: land abandonment and the increase of productivity.
Agricultural land abandonment, or outflow, in the EU is expected to continue at a rate of a decrease of 0.2% in utilised agricultural area (UAA) per year until 2030. This is, however, much lower than the average observed between 2011 and 2016, when UAA decreased by 0.7% per year. By 2030, arable land is projected to have decreased by 3% to reach 104 million ha [39]. For the CEEC, depending on the sources, different developments are plausible. According to the Agricultural Member States Modelling (AGMEMOD) model results, the sown area has not changed significantly in the past and is not expected to do so in the future [40]. On the other hand, Stürck et al. [41] came to the conclusion, in different modelled scenarios, that land abandonment will occur, particularly in Eastern and Southern Europe.
The EU in total shows only marginal growth of yield development for major crops in the EU, particularly because of the high yield levels already achieved, mainly in the EU-15 (Member States that joined the EU before 2014: Austria, Belgium, Denmark, Finland, France, Germany, Greece, Ireland, Italy, Luxembourg, the Netherlands, Portugal, Spain, Sweden and the United Kingdom) [39]. In contrast, the production of major crops is expected to increase significantly in CEEC, almost entirely through increased yields (e.g., for wheat and maize, increases of 15% and 50% respectively are projected for 2026). Notwithstanding, according to the AGMEMOD projections for 2026, the EU-15’s yields will still be around 40% higher than for CEEC [40]. The Global yield gap atlas (http://www.yieldgap.org/) explains the difference between actual yields and agro-climatically achievable yields in the same region. For CEEC, several examples underpin the existing gap from the northwestern EU countries [42]. Similarly, the potential from forestry and agroforestry residues could be further exploited [43].
The potential to provide more biomass from agriculture for different bio-based activities could be further enhanced through a development push for rural areas of CEEC, where, in some regions, small semi-subsistence farms still dominate [40]. Furthermore, double-cropping could substantially increase biomass output [42]. The same opportunity to increase productivity also applies, in principle, to animal production [40]. Higher productivity through an improved input/output ratio would therefore require less feedstock, which would then be available for other uses in the bioeconomy. In this context, the much smaller proportion of the processing industry in CEEC to date has to be stressed. Country-specific mapping of the potential for bio-based industries is provided by the Bio-based Industries Consortium for Poland [44] and Romania [45].
These considerations suggest the existence of an untapped potential in CEEC for further biomass production. Closing the yield gap would allow a higher level of labour productivity, which, all other things being equal, would reduce the location quotient and therefore further enable a transition path similar to that taken by northwestern EU countries.

4.3. Possible Strategies

The Member States typology developed in this paper suggests that, in spite of national specificities inherent to natural endowment and historical political and economic choices, including path dependencies, similarities in economic structures can help to identify type-specific needs and tailor bioeconomy development strategies.
The bioeconomy of group 1.1 (Eastern Member States) presents a strong specialisation—in terms of both employment and value added—in agriculture and the manufacture of food, beverages and tobacco, followed by low productive sectors. The bioeconomy of these Member States shows many similarities with that of group 1.2 (Baltic and Central Member States). In addition, the data from Slovenia indicate that a transition from a bioeconomy of type 1.1 to type 1.2 is possible. We might therefore expect future sectoral changes from the primary sector to the secondary sector as a first step of a transition towards a bioeconomy pattern of type 1.2. Such a transition can, of course, be supported by industrial and innovation policies, but the Greek case shows that it is also strongly dependent on the macro-economic environment: opposite sectoral changes occurred all over the Greek economic and financial crisis period. However, the agriculture sector in particular and the bioeconomy sectors more generally were less affected by job losses than the rest of the economy. The role agriculture plays in rural areas and as an economic and social buffer is not to be underestimated. The valorisation of biomass’s untapped potential could ease this transition process, starting with measures aimed at reducing the yield gap in these countries while preserving their natural capital.
The bioeconomy labour market of Member States of group 1.2 suggests that outflows from primary sectors have already occurred. Nevertheless, levels of labour productivity remain low compared with Northern and Western Member States. The productivity divide widened between 2008 and 2015 because of lower bioeconomy productivity growth in Member States of groups 1.1 and 1.2 than in Member States of groups 2.1 and 2.2. No Member State of group 1.1 or 1.2 has effected such a productivity leap to reach the levels attained in group 2.1. Kuusk et al. also concluded that the sectoral reallocation at stake in Central and Eastern European countries (CEEC) from low productive sectors to more productive ones did not lead to substantial productivity gains over the period 2001–2012: ‘In most of the CEE countries there has been some labour transfer into sectors with relatively higher initial productivity, whereas sectors with faster productivity growth over the year have on average seen lower employment shares. Nevertheless, given the relatively small size of the sectoral change effects, the contributions from the structural bonus and the structural burden are indeed very modest’ [46]. They quantify higher productivity gains within sectors than between sectors (i.e., gains arising from sectoral reallocation). Looking at industrialisation processes in CEEC, Stojčić and Aralica describe two opposite trends during the period 2000–2015 [47]: (i) restructuring of manufacturing sectors in the Czech Republic, Hungary, Poland, Bulgaria, Lithuania and Romania in terms of labour productivity versus (ii) deindustrialisation due to declining competitiveness in Slovakia, Estonia, Latvia, Croatia and Slovenia. They argue that export competitiveness was the main driver of the restructuring of the manufacturing sectors (trend (i)) and it is most likely the result of quality upgrading and of integration into higher segments of global value chains. So, in order to foster industrial processes in the manufacturing sector, they recommend targeting the industries with the largest market potential, supporting their integration into global value chains and supporting their segmentation into high value-added segments. They also stress that past industrial policies that centred around international technology transfers have fallen short in creating growth in productivity. Innovation in firms and industries in CEEC is most likely to emerge from a ‘doing-using-interacting’ (DUI) mode of innovation, i.e., experience-based innovation emerging within firms or within firm networks [48] (The DUI mode is opposed to the STI (science, technology and innovation) mode, which accompanies technology transfers). On the one hand, these recommendations align with Smart Specialisation Strategy (S3) EU policies in the sense that they are rooted in a regional assessment, in the targeting of regional sectoral advantages and in regional networks of industries and stakeholders [48]. On the other hand, Smart Specialisation Strategies emphasise the role of research, development and innovation (RDI) in territorial development, while Stojčić and Aralica expect more productivity growth and spillovers to come from market competitiveness than from innovation [47].
Labour productivity in the Member States of groups 2.1 and 2.2 already reaches very high levels. The development of the bioeconomy in these Member States is more oriented towards shifting production and manufacturing processes towards more resource-efficient and environmentally friendly processes. Note that such orientations are also relevant to the Member States of groups 1.1 and 1.2, in combination with the measures described above. They include realising the transition to a low-carbon economy by replacing fossil fuels with bio-based drop-ins and dedicated bio-based chemicals [49]. With this aim, the bioeconomy strategy of the European Union, as designed in 2012, gave a strong emphasis to investments in research, innovation and skills as one of the three pillars of the overall strategy. €975 million of EU funds are allocated to the Bio-Based Industries (BBI) Public–Private Partnership (PPP) for the period 2012–2020, complementing €2.7 billion of private investments. Annual calls finance development activities and fund the construction of pilot plants in strategic value chains. Optimisation of biomass flows is another component of the bioeconomy shift. It implies enhancing process efficiency, valorising byproducts and waste streams in the production of more diverse final products from initial feedstock (e.g., the biorefinery concept) as well as promoting the cascading use of bio-based products until the end of their lives. These concepts are already included in the Circular Economy Action Plan [50]. The European Commission’s Communication on the Circular Economy [51] called for the inclusion of these concepts in the Bioeconomy Strategy of the European Union after its revision in 2017. The updated bioeconomy strategy should be released in 2018.

Supplementary Materials

All the data used in this study are compiled in the JRC Bioeconomics dataset. Please find the bulk download at https://datam.jrc.ec.europa.eu/datam/perm/od/jrc-datam-biomass-estimates/download/dataset.zip. The data can also be browsed at https://datam.jrc.ec.europa.eu/datam/perm/od/7d7d5481-2d02-4b36-8e79-697b04fa4278. Pre-visualisations of the data are accessible as interactive infographics at https://datam.jrc.ec.europa.eu/datam/mashup/BIOECONOMICS.

Author Contributions

T.R. and R.M. conceptualised the original idea. R.M. wrote Section 1. T.R. wrote Section 2 and Section 3. Both authors contributed to Section 4.

Acknowledgments

This study has been financed by European Commission funding in the framework of an Administrative Arrangement between the Directorate-General for Research and Innovation and the Joint Research Centre (JRC). The authors would like to thank the nova-Institute for Ecology and Innovation, which prepared the methodology for indicator quantification jointly with the JRC in previous years and continues to collaborate on methodological updates. The authors are very grateful to Saulius Tamosiunas, who automated the calculations and made them available online at https://datam.jrc.ec.europa.eu/datam/public/pages/index.xhtml. The views expressed in this article are purely those of the authors and may not in any circumstances be regarded as stating an official position of the European Commission.

Conflicts of Interest

The authors declare no conflict of interest. The views expressed are those solely of the authors and should not in any circumstances be regarded as stating an official position of the European Commission.

Appendix A.

Table A1. Quantified Socioeconomic Indicators of the EU Bioeconomy in 2015 (number of persons employed, turnover, value added and apparent labour productivity).
SectorWorkersTurnoverValue AddedApparent Labour Productivity
Number of persons employed(€ million) (€ million) (€000 per person employed)
Agriculture9,227,200 380,164 173,597 19
Forestry539,000 50,10123,834 44
Fishing222,392 11,650 6957 31
Manufacture of food, beverages and tobacco4,544,452 1,153,006 233,408 51
Manufacture of bio-based textiles999,235 103,497 28,341 28
Manufacture of wood products and furniture1,407,184 173,724 47,165 34
Manufacture of paper643,104 186,616 45,590 71
Manufacture of bio-based chemicals, pharmaceuticals, plastics and rubber (excluding biofuels)444,967 177,044 56,314 127
Manufacture of liquid biofuels26,271 12,194 2560 97
Production of bioelectricity13,844 10,831 3138 217
Bioeconomy18,067,6482,258,827620,90334

References

  1. European Commission. Innovating for Sustainable Growth: A Bioeconomy for Europe; COM(2012) 60 Final; European Commission: Brussels, Belgium, 2012; p. 9. Available online: http://ec.europa.eu/research/bioeconomy/pdf/official-strategy_en.pdf (accessed on 24 May 2018).
  2. European Commission. Roadmap. Update of the 2012 Bioeconomy Strategy; European Commission: Brussels, Belgium, 2018; p. 3. Available online: https://ec.europa.eu/info/law/better-regulation/initiatives/ares-2018-975361_en (accessed on 24 May 2018).
  3. European Commission-DG RTD. Review of the 2012 European Bioeconomy Strategy; European Commission: Luxembourg, 2017; p. 86. Available online: https://ec.europa.eu/research/bioeconomy/pdf/review_of_2012_eu_bes.pdf (accessed on 24 May 2018).
  4. El-Chichakli, B.; von Braun, J.; Lang, C.; Barben, D.; Philp, J. Five cornerstones of a global bioeconomy. Nature 2016, 535, 221–223. [Google Scholar] [CrossRef] [PubMed]
  5. Ronzon, T.; Piotrowski, S.; M’Barek, R.; Carus, M. A systematic approach to understanding and quantifying the EU’s bioeconomy. Bio-Based Appl. Econ. 2017, 1. [Google Scholar] [CrossRef]
  6. Ronzon, T.; Lusser, M.; Klinkenberg, M.; Landa, L.; Sanchez Lopez, J.; M’Barek, R.; Hadjamu, G.; Belward, A.; Camia, A.; Giuntoli, J.; et al. (Eds.) Bioeconomy Report 2016; JRC Science for Policy Report, EUR 28468 EN; Publications Office of the European Union: Luxembourg, 2017; p. 124. [Google Scholar] [CrossRef]
  7. Piotrowski, S.; Carus, M.; Carrez, D. European Bioeconomy in Figures 2008–2015; Nova-Institute for Ecology and Innovation: Hürth, Germany, 2018; p. 16. Available online: http://biconsortium.eu/sites/biconsortium.eu/files/documents/Bioeconomy_data_2015_20150218.pdf (accessed on 24 May 2018).
  8. Eurostat. NACE Rev. 2 Statistical Classification of Economic Activities in the European Community; Eurostat Methodologies and Working Papers: Luxembourg, 2008; p. 367. Available online: http://ec.europa.eu/eurostat/web/nace-rev2 (accessed on 24 May 2018).
  9. European Commission. Commission Regulation (EC) No 250/2009 of 11 March 2009 implementing Regulation (EC) No 295/2008 of the European Parliament and of the Council as regards the definitions of characteristics, the technical format for the transmission of data, the double reporting requirements for NACE Rev.1.1 and NACE Rev.2 and derogations to be granted for structural business statistics. Off. J. Eur. Comm. 2009, 169. [Google Scholar]
  10. Eurostat. Databases. Available online: http://ec.europa.eu/eurostat/data/database (accessed on 24 May 2018).
  11. Scientific, Technical and Economic Committee for Fisheries (STECF). The 2017 Annual Economic Report on the EU Fishing Fleet (STECF 17-12); European Commission-Joint Research Center: Luxembourg, 2017; p. 493. [Google Scholar] [CrossRef]
  12. Scientific, Technical and Economic Committee for Fisheries (STECF). Economic Report of EU Aquaculture Sector (STECF-16-19); EUR 28356 EN, JRC104210; Publications Office of the European Union: Luxembourg, 2016; p. 451. [Google Scholar] [CrossRef]
  13. Refsgaard, K.; Teräs, J.; Kull, M.; Oddsson, G.; Jóhannesson, T.; Kristensen, I. The Rapidly Developing Nordic Bioeconomy: Excerpt from State of the Nordic Region; Nordic Council of Ministers: Copenhagen, Denmark, 2018; p. 18. ISBN 978-92-893-5443-1. [Google Scholar]
  14. BIOEAST. BIOEAST Vision Paper. BIOEAST-Central and Eastern European Initiative for Knowledge-Based Agriculture, Aquaculture and Forestry in the Bioeconomy. 2018, p. 15. Available online: http://www.bioeast.eu/article/bioeastvisionpaper23022018 (accessed on 24 May 2018).
  15. Philippidis, G.; Sanjuán, A.I.; Ferrari, E.; M’barek, R. Employing social accounting matrix multipliers to profile the bioeconomy in the EU member states: Is there a structural pattern? Span. J. Agric. Res. 2014, 12, 14. [Google Scholar] [CrossRef]
  16. Mainar Causapé, A.J.; Philippidis, G.; Sanjuán López, A.I. Analysis of Structural Patterns in Highly Disaggregated Bioeconomy Sectors by EU Member States Using SAM/IO Multipliers; JRC Technical Reports, EUR 28591; Publications Office of the European Union: Luxembourg, 2017; p. 36. [Google Scholar] [CrossRef]
  17. Cardenete, M.A.; Boulanger, P.; Del Carmen Delgado, M.; Ferrari, E.; M’Barek, R. Agri-food and biobased analysis in the Spanish economy using a key sector approach. Rev. Urban Reg. Dev. Stud. 2014, 26, 112–134. [Google Scholar] [CrossRef]
  18. Berman Group, Infyde. Bioeconomy Development in EU Regions. Mapping of EU Member States’/Regions’ Research and Innovation Plans & Strategies for Smart Specialisation (RIS3) on Bioeconomy for 2014–2020; Spatial Foresight, SWECO, ÖIR, t33, Nordregio; European Commission: Brussels, Belgium, 2017; p. 93. Available online: https://ec.europa.eu/research/bioeconomy/pdf/publications/bioeconomy_development_in_eu_regions.pdf (accessed on 24 May 2018). [CrossRef]
  19. The Latvian Ministry of Agriculture. Latvijas Bioekonomikas Stratēģija 2030. Riga, 2017; p. 29. Available online: http://tap.mk.gov.lv/doc/2017_12/ZMZin_071217_VSS831.2014.docx (accessed on 24 may 2018).
  20. Hungarian Ministry of Rural Development. National Environmental Technology Innovation Strategy 2010–2020; Hungarian Ministry of Rural Development: Budapest, Hungary, 2012; p. 16. Available online: http://kornyezettechnologia.kormany.hu/admin/download/b/4f/50000/NETIS_English.pdf (accessed on 24 May 2018).
  21. Finnish Ministry of Employment and the Economy. Sustainable Growth from Bioeconomy. The Finnish Bioeconomy Strategy; Finnish Ministry of Employment and the Economy: Helsinki, Finland, 2014; p. 15. Available online: http://biotalous.fi/wp-content/uploads/2014/08/The_Finnish_Bioeconomy_Strategy_110620141.pdf (accessed on 24 May 2018).
  22. Federal Ministry of Food and Agriculture (BMEL). National Policy Strategy on Bioeconomy; Federal Ministry of Food and Agriculture (BMEL): Berlin, Germany, 2014; p. 78. Available online: http://www.bmel.de/SharedDocs/Downloads/EN/Publications/NatPolicyStrategyBioeconomy.pdf?__blob=publicationFile (accessed on 24 May 2018).
  23. Ministerio De Económia Y Competitividad, Secretaría De Estado De Investigación Desarollo E Innovación. The Spanish Bioeconomy Strategy 2030 Horizon; Ministerio De Económia Y Competitividad, Secretaría De Estado De Investigación Desarollo E Innovación: Madrid, Spain, 2016; p. 44. Available online: http://bioeconomia.agripa.org/download-doc/102159 (accessed on 24 May 2018).
  24. Le Ministère de l’Écologie du Développement Durable et de l’Énergie, Le Ministère de l’Éducation Nationale de l’Enseignement Supérieur et de la Recherche, Le Ministère de l’Économie de l’Industrie et du Numérique, Le Ministère de l’Agriculture de l’Agroalimentaire et de la Forêt. Une Stratégie Bioéconomie Pour La France. Paris, France, 2017; p. 34. Available online: http://agriculture.gouv.fr/telecharger/83595?token=4b2095fafe14f075309cc193dda53d70 (accessed on 24 May 2018).
  25. Ministry for Economic Development (Co-Coordinator), Ministry of Agriculture Food and Forestry, Ministry of Education University and Research, Ministry of the Environment Land and Sea, Committee of Italian Regions, Agency for Territorial Cohesion, Italian Technology Clusters for Green Chemistry Agri-Food and Bluegrowth. BIT Bioeconomy in Italy. 2017; p. 74. Available online: http://www.agenziacoesione.gov.it/opencms/export/sites/dps/it/documentazione/S3/Bioeconomy/BIT_v4_ENG_LUGLIO_2017.pdf (accessed on 24 May 2018).
  26. Government, T.D. Denmark At. Work. Plan. For. Growth For. Water, Bio and Environmental Solutions. 2013, p. 12. Available online: http://em.dk/english/~/media/files/2013/12-03-13-summary-plan-for-growth-for-water-bio-etc.ashx (accessed on 24 May 2018).
  27. Netherlands Office for Science and Technology. The Bio-Based Economy in the Netherlands; Netherlands Office for Science and Technology: The Hague, Netherlands, 2013; p. 11. Available online: https://www.rvo.nl/sites/default/files/Bio%20Based%20Economy.pdf (accessed on 24 May 2018).
  28. HM Government. Building a High Value Bioeconomy. Opportunities from Waste. 2015; p. 38. Available online: https://www.gov.uk/government/uploads/system/uploads/attachment_data/file/408940/BIS-15-146_Bioeconomy_report_-_opportunities_from_waste.pdf (accessed on 24 May 2018).
  29. Formas. Swedish Research and Innovation Strategy for a Bio-based Economy. 2015, p. 34. Available online: http://www.formas.se/PageFiles/5074/Strategy_Biobased_Ekonomy_hela.pdf (accessed on 24 May 2018).
  30. The Interdepartmental Working Group for the Bioeconomy. Bioeconomy in Flanders. The Vision and Strategy of the Government of Flanders for a Sustainable and Competitive Bioeconomy in 2030; Flemish Government-Environment, Nature and Energy Department: Brussels, Belgium, 2014; p. 21. Available online: http://ebl.vlaanderen.be/publications/documents/55157 (accessed on 24 May 2018).
  31. Government of Ireland. Delivering our Green Potential, Government Policy Statement on Growth and Employment in the Green Economy. 2012; p. 45. Available online: https://dbei.gov.ie/en/Publications/Publication-files/Delivering-Our-Green-Potential.pdf (accessed on 24 May 2018).
  32. Ronzon, T.; Santini, F.; M’Barek, R. The Bioeconomy in the European Union in Numbers. Facts and Figures on Biomass, Turnover and Employment. Data Based on a Collaboration with Nova-Institute; European Commission Joint Research Centre: Brussels, Belgium, 2015; p. 4. Available online: https://ec.europa.eu/jrc/sites/jrcsh/files/JRC97789%20Factsheet_Bioeconomy_final.pdf (accessed on 24 May 2018).
  33. Bracco, S.; Calicioglu, O.; Gomez San Juan, M.; Flammini, A. Assessing the Contribution of Bioeconomy to the Total Economy: A Review of National Frameworks. Sustainability 2018, 10, 1698. [Google Scholar] [CrossRef]
  34. MontBioeco. Monitoring Bioeconomy–Current Approaches in EU Member States and at EU Level; MontBioeco: Helsinki, Finland; Available online: https://www.luke.fi/en/projects/montbioeco/ (accessed on 24 May 2018).
  35. Efken, J.; Dirksmeyer, W.; Kreins, P.; Knecht, M. Measuring the importance of the bioeconomy in Germany: Concept and illustration. NJAS-Wagen. J. Life Sci. 2016, 77, 9–17. [Google Scholar] [CrossRef]
  36. Heijman, W. How big is the bio-business? Notes on measuring the size of the Dutch bio-economy. NJAS-Wagen. J. Life Sci. 2016, 77, 5–8. [Google Scholar] [CrossRef]
  37. World Economic Forum. Agenda in Focus: Beyond GDP. Available online: https://www.weforum.org/focus/beyond-gdp (accessed on 24 May 2018).
  38. Central and Eastern European Regions and Stakeholders. Lodz Declaration of Bioregions; Central and Eastern European Regions and Stakeholders: Lodz, Poland, 2016; Available online: http://bioeconomy.lodzkie.pl/en/deklaracja-lodzka-16/ (accessed on 24 May 2018).
  39. Domínguez, I.P.; Fellmann, T.; Chatzopoulos, T.; Pieralli, S.; Jensen, H.; Barreiro-Hurle, J.; Micale, F. EU Commodity Market Development: Medium-Term Agricultural Outlook. Proceedings of the October 2017 workshop; JRC Conference and Workshop Reports, JRC109451; Publications Office of the European Union: Luxembourg, 2017; p. 133. [Google Scholar] [CrossRef]
  40. Salamon, P.; Banse, M.; Barreiro-Hurlé, J.; Chaloupka, O.; Donnellan, T.; Erjavec, E.; Fellmann, T.; Hanrahan, K.; Hass, M.; Jongeneel, R. Unveiling Diversity in Agricultural Markets Projections: From EU to Member States. A Medium-Term Outlook with the AGMEMOD Model; JRC Technical Report, 29025 EUR; Publications Office of the European Union: Luxembourg, 2017; p. 90. [Google Scholar] [CrossRef]
  41. Stürck, J.; Levers, C.; van der Zanden, E.H.; Schulp, C.J.E.; Verkerk, P.J.; Kuemmerle, T.; Helming, J.; Lotze-Campen, H.; Tabeau, A.; Popp, A.; et al. Simulating and delineating future land change trajectories across Europe. Reg. Environ. Chang. 2018, 18, 733–749. [Google Scholar] [CrossRef]
  42. Szabó, Z. Europe’s sustainable biomass potential is substantial. Euractiv, 2015. Available online: https://www.euractiv.com/section/central-europe/opinion/europe-s-sustainable-biomass-potential-is-substantial/ (accessed on 24 May 2018).
  43. Thorenz, A.; Wietschel, L.; Stindt, D.; Tuma, A. Assessment of agroforestry residue potentials for the bioeconomy in the European Union. J. Clean. Prod. 2018, 176, 348–359. [Google Scholar] [CrossRef] [PubMed]
  44. Bio-Based Industries Consortium. Mapping the Potential of Poland for the Bio-Based Industry; Bio-Based Industries Consortium: Brussels, Belgium, 2018; p. 40. Available online: http://biconsortium.eu/sites/biconsortium.eu/files/downloads/Country-Report-Poland.pdf (accessed on 24 May 2018).
  45. Bio-Based Industries Consortium. Mapping the Potential of Romania for the Bio-Based Industry; Bio-Based Industries Consortium: Brussels, Belgium, 2018; p. 34. Available online: http://biconsortium.eu/sites/biconsortium.eu/files/downloads/Country-Report-Romania.pdf (accessed on 24 May 2018).
  46. Kuusk, A.; Staehr, K.; Varblane, U. Sectoral change and labour productivity growth during boom, bust and recovery in Central and Eastern Europe. Econ. Chang. Restruct. 2017, 50, 21–43. [Google Scholar] [CrossRef]
  47. Stojčić, N.; Aralica, Z. Choosing Right from Wrong: Policy and (De) Industrialization in Central and Eastern Europe; EIZ Working Papers EIZ-WP-1703; EIZ: Zagreb, Croatia, 2017; p. 36. Available online: http://www.eizg.hr/UserDocsImages/publikacije/serijske-publikacije/radni-materijali/Choosing_Right_from_Wrong-Industrial_Policy_and_(De)industrialization_in_Central_and_Eastern_Europe.pdf (accessed on 24 May 2018).
  48. Jensen, M.B.; Johnson, B.; Lorenz, E.; Lundvall, B.Å. Forms of knowledge and modes of innovation. In The Learning Economy and the Economics of Hope; Anthem Press: London, UK; New York, NY, USA, 2016; Volume 155, pp. 155–182. [Google Scholar]
  49. Carus, M.; Dammer, L.; Puente, Á.; Raschka, A.; Arendt, O. Bio-Based Drop-in, Smart Drop-in and Dedicated Chemicals; Nova-Institute for Ecology and Innovation: Hürth, Germany, 2017; p. 3. Available online: http://bio-based.eu/download/?did=107519&file=0 (accessed on 24 May 2018).
  50. European Commission. COM/2015/0614 Final. Communication from the Commissionto the European Parliament, the Council, the European Economic and Social Committee and the Committee of the Regions. Closing the Loop-An. EU Action Plan for the Circular Economy; European Commission: Brussels, Belgium, 2015; p. 21. Available online: http://eur-lex.europa.eu/legal-content/EN/TXT/?uri=CELEX:52015DC0614 (accessed on 24 May 2018).
  51. European Commission. COM(2014) 398 Final. Communication from the Commission to the European Parliament, the Council, the European Economic and Social Committee and the Committee of the Regions. Towards a Circular Economy: A Zero Waste Programme for Europe; European Commission: Brussels, Belgium, 2014; p. 14. Available online: http://eur-lex.europa.eu/resource.html?uri=cellar:50edd1fd-01ec-11e4-831f-01aa75ed71a1.0001.01/DOC_1&format=PDF (accessed on 24 May 2018).
Figure 1. Sectoral apparent labour productivity in the EU-28 bioeconomy, 2015: bars show EU-28 apparent labour productivity; points show Member States’ apparent labour productivity. Note that apparent labour productivity in Ireland for the manufacture of bio-based pharmaceutical is out of scale on this graph, reaching 784 k€ per person employed.
Sustainability 10 01745 g001
Figure 2. Bioeconomy patterns across EU-28 Member States.
Sustainability 10 01745 g002
Figure 3. Heat map of the sectoral contribution to bioeconomy jobs and value added in EU Member States, 2015: light grey shows a contribution below the EU average, dark grey shows a contribution above the EU average, white indicates missing data.
Sustainability 10 01745 g003
Figure 4. Evolution of the location quotient and apparent labour productivity in the bioeconomy of the 28 EU Member States, 2008–2015 (the cases commented on in Section 3.3 are shown in bold). Note that Romania is missing since it is out of scale (location quotient of 3.76). Its position on the graph is almost unchanged in 2015 compared to 2008.
Sustainability 10 01745 g004
Table 1. NACE sectors considered part of the bioeconomy.
NACE CodeBioeconomy Sector (Parent Categories in Bold)
A01Agriculture
A02Forestry
A03Fishing and aquaculture
A032Aquaculture
A031Fishing
-Manufacture of food, beverages and tobacco
C10Manufacture of food
C11Manufacture of beverages
C12Manufacture of tobacco
-Manufacture of bio-based textiles
C13 *Manufacture of bio-based textiles
C14 *Manufacture of bio-based wearing apparel
C15Manufacture of leather
-Manufacture of wood products and furniture
C16Manufacture of wood products
C31 *Manufacture of wooden furniture
C17Manufacture of paper
-Manufacture of bio-based chemicals, pharmaceuticals, plastics and rubber (excluding biofuels)
C20 *Manufacture of bio-based chemicals (excluding biofuels)
C21 *Manufacture of bio-based pharmaceuticals
C22 *Manufacture of bio-based plastics and rubber
-Manufacture of liquid biofuels
C2014 *Manufacture of bioethanol
C2059 *Manufacture of biodiesel
D3511 *Production of bioelectricity
* hybrid sector.
Table 2. Data source for fully bio-based sectors.
Bioeconomy SectorNACE Code Used for CalculationsNumber of Persons EmployedTurnoverValue Added
AgricultureA01EUROSTAT—Labour Force Survey (lfsa_egan22d)EUROSTAT—Economic accounts for agriculture (aact_eaa01)EUROSTAT—National accounts (nama_10_a64)
ForestryA02EUROSTAT—Forestry Employment (for_emp_lfs)EUROSTAT—Forestry economic accounts (for_eco_cp)
FishingA03STECF 2014STECF 2016
Manufacturing sectorsC10; C11; C12; C15; C16; C17EUROSTAT—Structural Business Statistics (sbs_na_ind_r2)
Sources: [10,11,12].
Table 3. Contribution of bioeconomy sectors to the total bioeconomy labour market, turnover and value added (%), EU-28, 2015.
SectorWorkersTurnoverValue Added
Agriculture51.016.828.0
Forestry3.02.23.8
Fishing1.20.51.1
Manufacture of food, beverages and tobacco25.151.037.6
Manufacture of bio-based textiles5.64.64.6
Manufacture of wood products and furniture7.87.77.6
Manufacture of paper3.68.37.3
Manufacture of bio-based chemicals, pharmaceuticals, plastics and rubber (excluding biofuels)2.57.89.1
Manufacture of liquid biofuels0.10.50.4
Production of bioelectricity0.10.50.5

