Sustainability in Smart Farms: Its Impact on Performance


1
Area of Business, ESIC Business & Marketing School, Madrid 28223, Spain
2
Department of Applied Economics I, University of Rey Juan Carlos, Paseo de Artilleros s/n, 28032 Madrid, Spain
3
Department of Animal Science, University of Córdoba, Campus de Rabanales, 14071 Cordoba, Spain
*
Author to whom correspondence should be addressed.
Sustainability 2018, 10(6), 1713; https://doi.org/10.3390/su10061713
Submission received: 24 March 2018
/
Revised: 17 May 2018
/
Accepted: 18 May 2018
/
Published: 24 May 2018
(This article belongs to the Special Issue Sustainable Smart Cities and Smart Villages Research)
Abstract
:In Spain, more than 30% of producers have run out of business because of a lack of sustainability. They search for managerial guidelines that allow them to reach the farm’s economic viability. When trying to improve the performance of farms and farming systems, a complementary consideration of sustainability dimensions is required. The aim of this paper consists of offering a complementary and integrative approach from the sustainability concept in four different dimensions: economic; technological; organizational; and training in Manchego Cheese Protected Designation of Origin (PDO). Sustainability through the putting into practice of some managerial concepts has been able to reach better results and smarter farms. To perform this study, metrics to analyze each of the mentioned dimensions of sustainability have been applied to a sample of 157 farms with the main objective to identify the sustainability dimensions and its impacts on farm’s final results promoting smarter farms. The Structural Equation Model (SEM) has been applied to measure the impact of each dimension of sustainability on final farm’s results. Results reported that the farm’s economic and organizational sustainability have been influenced by the returns on investment.
1. Introduction
Sustainability is a concept first coined in ecology. It is composed by both, sustain and ability, and it is a property of systems to remain diverse and productive on time [1]. The term ‘sustainability’ should be viewed as humanity’s target goal of human-ecosystem equilibrium (homeostasis), while ‘sustainable development’ refers to the holistic approach and temporal processes that lead us to the end point of sustainability [2]. Moreover, bio economy is a managerial tool for sustainability. The European Commission indicates that bio economy is aimed to reach sustainable socio-economic development, through an efficient use of natural resources [3]. Spain chose a policy model of “sustainable intensification”, with a direct application in search of “smart farms”. Smart farms are accurate farms oriented to increase efficiency and reduce the environmental impacts of animal production practices. Farms must learn to implement technology properly to minimize cost and maximize efficiency [4].
This holistic approach of sustainability has to do with properly combining different skills and/or firm’s abilities to reach economic, technological, organizational, and training sustainability. Some researchers have linked sustainability with smarter production, smarter services, smarter environments and opportunities, and economic advantages [5,6,7,8,9].
Economic sustainability refers to the ability of an economy to support a defined level of economic production indefinitely. It is oriented to the analysis of the environment to understand customer needs better than competitors [10]. Technological sustainability refers to a more valuable use of technologies to reach best objectives and greatly reduce ecological impact among other technological benefits. It is referred to as the ability to integrate various interaction routines through interrelation with technologies [11]. Organizational sustainability refers to ensuring the sustainability of the organization concerning efforts to incorporate sustainability considerations into strategic and operational decision-making processes [12]. Training sustainability refers to a process that increases knowledge and sharpens skills, enhancing employee performance. Sustainability training helps improve staff and management’s knowledge of sustainability issues, as well as to develop their skills for managing a company sustainably [13,14].
This research offers a complementary and integrative approach to previous analysis by offering an exploration from the sustainability concept in four different dimensions: economic, technological, organizational, and training. Sustainability can explain the reasons why some farms through putting into practice some managerial concepts have been able to reach better results and therefore can be considered as smart farms. It is important to analyze and identify what are the main differences amongst farms in terms of sustainability. More sustainable farms can become an inspiration for the others in the drive to become smarter rural ecosystems [1,10].
The empirical analysis is applied to the PDO (Protected Designation of Origin) cheese brand in Castilla-La Mancha, Spain. This product generates over 55% of the economic value of this kind or products in Spain. However, more than 30% of producers have run out of business because of lack of sustainability. The PDO award purports the maximum international recognition of quality within the UE. Manchego Cheese PDO links a quality product to a territory and a traditional and sustainable production system. It is also a guarantee of food safety and food processing. The strategic value of this PDO lies in the perception of quality by the consumer. This is a determining factor in the purchase decision [3,12,15].
Literature in this regard, as [15,16,17], reduces the dimensions of variables by applying multivariate analysis (factor and principal components analysis). Schader et al. [2], Rangel et al. [4] and Spangenberg [10] building management and sustainable indicators by using a participative and consensus methodology; Ramdhani et al. [18], advanced in systematic analysis of trade-offs and synergies between sustainability dimensions; Van Hooft & Wollen [19] and Angón et al. [20] developed a methodology to choose semi-quantitative signals based on expert ranking decisions. Dealing with the validation of indicators, Chou & Chen [21] proposed the use of canonical correlation and evaluated the impact of indicators on final results. Opposite to the literature described in previous sentences, in this research the use of Structural Equation Model (SEM) is proposed to validate models defining causal relationships amongst variables. SEM analysis presents a great potential for exploratory analysis and goes in deep into the analysis of dependency, multiple and cross relations amongst latent variables, considering simultaneously, the measurement error of the estimation process.
The research question we try to answer is: does the implementation of sustainable practices, from the economic, technological, organizational, and training perspectives allow smart farms to reach best results? Therefore, the main objective of this research consists of analyzing the causal relationships among different dimensions of sustainability and final results at farms. From the empirical perspective, data have been collected from farms belonging to the sheep system in Castilla-La Mancha region, Spain. Unlike previous publications, in this article, as a first exploratory approach, SEM methodology has been applied, to deepen the knowledge of the four dimensions of a smart farm’s sustainability. In the following paragraph, the theoretical framework is presented.
2. The Theoretical Framework
To analyze the effect of sustainability on farm’s results, a brief description and a way of measuring each of the sustainability dimensions are considered in this analysis. Economic, technological, organizational, and training sustainability are described. As previously mentioned, these sustainability dimensions have been considered in the literature but, to our knowledge, an integrative approach of the four has not been built so far.
2.1. Economic Sustainability
Economic sustainability refers to the firm’s ability to diagnose the environment and understand the customer needs better than their competitors [14,15]. The capability of firms to get adapted to markets is a key issue to reach economic sustainability and because of that, firms must be aware of the environment and customer’s needs [16,17]. Ikerd [3] describe how the firm’s capability to get adapted to different markets is key. The authors of Lozano [13] and Ramdhani et al. [18], describe that the market product’s target shows the capability of the organization to get adapted, since the spread of markets and products is the capability result to respond to external opportunities. Therefore, the marketing from farms of products such as lambs, rams, live females and males, cheese, wool, manure, and different cheese varieties implies that previously a segment of customers demanding these products has been identified. The same happens with the direct commercialization to consumer or wholesaler, since an opportunity has been identified by widen customers and therefore increasing the activity field.
Smallholders live on the threshold of poverty, within fragile ecological systems showing a high degree of marginalization. Small-scale livestock provides resilience capability, increases the level of diversification and strengthens synergies among activities [19]. Mixed crop-livestock system, with a part of grazing native pasture and crop residues on communal lands, within a multifunctional livestock are frequent [1]. Milk production and quality depends on sheep’s feeding, as it is the case of the use of pastures, by making use of the natural resource coming from land. In the same way, ref. [4] relate intrinsic quality and nutritional milk content with the kind of animal management. The animal feeding relies on grass for the roughage, crop residues, by-products, and other local roughage that represent the major source of feed utilized in this livestock system. The Food and Agriculture Organization of the United Nations (FAO) [1] and Angón et al. [20] indicate that the use of endogenous resources contributes to sustainable livestock, mitigates environmental problems; reduces the dependence of external inputs and decreases production cost, increasing the system’s resilience [1].
Economic planning helps satisfying customer’s needs by means of the development of products. Planning reproduction implies a market analysis, determining how many animals would be required so that customers can value the final product. This way, reproduction planning would facilitate the exploration of future customer’s needs. The planning of any organizational process is based in the initial detection of customer’s needs with the main objective to reach firm’s strategic objectives. Lozano [13] and Chou & Chen [21] show examples of it. Henningsen et al. [22] highlight how managerial skills are key elements to improve firm’s economic results. By considering previous arguments, the present Hypothesis 1 is provided: The farm’s economic sustainability will positively influence the return of assets (ROA) and return on investment (RF) as profit indicators.
2.2. The Measure of Economic Sustainability
The access to information is key for organizations as managers who can identify changes in the markets and impacts in the detection capability [23,24]. Such information enables them to achieve a competitive advantage [25,26,27]. Being a member in “Manchego cheese” PDO and the incorporation of unified type feed systems can be considered as indicators of the detection capability. They both allow accessing to timely and accurate information for the achievement of the strategic objectives of livestock farms.
Doppelt [14] pointed out that the modern information systems allow organizations create new business according to customer needs. Thus, farms that keep registers have enough information on most demanded products and their evolution and, therefore, they can analyze this information to detect new niches. The domain market-product is the result of having developed a capability to respond to external opportunities [12,13]. Consequently, the variety in the sales of products implies the detection of new needs. Feeding has changed, increasing the weight of products that come from agriculture due to cultural changes [2], so farms that have land available to agriculture use and produce food, which responds to a detected need. This is similar to the use of grazing as it increases the quality of the product [4].
The purpose of planning is to meet the needs of customers through product development. This way, planning reproduction allows farms get adapted to future customers’ needs [14]. According to previous considerations, next table shows the different variables considered in this research to measure farm’s economic sustainability.
2.3. Technological Sustainability
The use of information systems provides technological sustainability to organizations [28,29]. Firm’s information systems allow making decisions on production. The information can have an impact in the way organization routines take place or in the design of new ones. Nieves [24] reinforces the key role that the access to information by managers plays as main path to reach better results when changes must be identified in the market and respond to them. According to his research, external relations impact on firm’s technological sustainability. Examples of technological sustainability can be found in the use of farm’s information systems. For example, by properly warehousing data, information systems allow making decisions on the level of reproduction capability of animals. This information can also promote changes on the existing organizational routines and in the design of new ones.
Although farms that belong to the sheep industry do not count on with modern information systems, as for example Big Data [30], we can consider that just having registers offer enough information on what the most demanded products are and how the demand on products is evolving. This permits a better analysis of the information and detects different customer’s segments with uncovered needs so far. Collins et al. [25] and Pearlson et al. [31] reinforce the importance for firms to access to proper information by allowing information to be located in the best position to reach a competitive advantage. From this perspective, being part of the “Manchego cheese” Protected Designation of Origin, as the including of unified breed systems of by products can be taken into account as indicators of technological sustainability since they allow the access to accurate and proper information to the achievement of farm’s strategic objectives. By considering previous arguments, the present Hypothesis 2 is provided: The farm’s technological sustainability will positively influence the return on assets (ROA) and return on investment (RF) as profit indicators.
2.4. The Measure for Technological Sustainability
For [11] the integration of knowledge is the result of the process of sharing and combining information arising from the interaction of group members that share their individual knowledge. Rangel et al. [4] and Bravo & Herrera [32] consider that knowledge management and organizational routines establish the firm’s technological sustainability as they allow the integration of the information. They stress the importance of properly using technology to conduct knowledge transfer. The authors of Satish & Yue [9] and Aquilani et al. [15] reinforced how knowledge includes data, information and experience. According to his analysis, knowledge means the combination of facts, analysis, trainings and lessons learnt that comprise knowledge for an individual. Petter et al. [33] describe how IT systems have migrated from being a tool to manage data and fulfill management reporting needs, to provide mechanisms for strategic management decisions, and promote collaboration amongst internal and external agents. Beath et al. [34] support how information technology has played an important role to enable knowledge management within organizations. The Food and Agriculture Organization of the United Nations (FAO) [1] explained the role of information and communication technologies as facilitators for communication issues and remarked their impact on the processing and transmission of information.
The Food and Agriculture Organization of the United Nations (FAO) [1] refer to the situation where hidden patterns and data knowledge are considered one of the most vital assets within organizations. In their view, making use of these assets must be a major concern for managers which can also lead them to improve business decisions. Besides, Beath et al. [34] highlight that a good system of internal information management increases firms’ sustainability by increasing its absorptive capability and integrating external knowledge into their activities. The farm’s events record system (births, death, sales, etc.) is a database that stores relevant information on farm’s operative process. This database allows the use and exchange of information among employees [31,32] and it can be used for decision-making, by increasing the information efficiency and resulting in a greater understanding than that provided separately by each of activities of the farm’s value chain.
The planning process refers to the definition of the firm’s goals and the more appropriate means to achieve them; that is, it involves making decisions in the present about the firm’s future and, according to [16] it is a firm’s organizational capability. Managers need to know the existing resources in the firm. It influences the development of sustainability [35,36] and information systems allow firms establish relationships with external environment [37]. They facilitate the coordination of employees and the development of behavioral patterns. Wang et al. [38] and Toro-Mújica et al. [39] described different ways to improve the business position, as example planning. According to previous considerations, next table shows the different variables considered in this research to measure farm’s technological sustainability.
2.5. Organizational Sustainability
Understanding how sustainability strategies and initiatives come to be perceived as legitimate by managers and executives is a fundamental step toward facilitating their adoption and effective implementation, since attitudes such as perceived legitimacy can influence an individual’s intention to act, and intentions are important antecedents to behavior. Effective organizational innovations—the successful introduction of new strategies, structures, or processes—are highly dependent upon the attitudes, support, and cooperation of employees [37]. In order to reach organizational sustainability, it is relevant to develop new markets and products, by properly coordinating innovative processes and behaviors [30,38].
Manchego cheese has been considered a product for national consumption until 2015. This year over a 60% of cheese was commercialized in the European Union or other countries; this means that firms have developed organizational sustainability through the opening of new markets. The development of different varieties of cheese, as for example light, implies the development of organizational sustainability too. Farms are each time more applying the sustainable concept to obtain and maintain a competitive edge due to their particular efficiency and effectiveness throughout several parts of the value chain. According to [31], a business is profitable if the value it creates exceeds the cost of performing the value activities. To gain a competitive advantage over its rivals, a company must either perform these activities at a lower cost or perform them in a way that leads to differentiation and a premium price (more value). A sustainable value chain can provide a differentiation in terms of value creation through sustainability [30].
Last years, an intensification and specialization of production has taken place at PDO farms [39]. Changes have been oriented to increase production, by means of higher qualified labor, the increase of technologies and the progressive decrease of grazing [20,40]. These structural changes imply a risk in the viability of farms, since they influence their multifunctional character and reduce the degree of resilience and complementarity amongst activities.
The implementation of process management programs in reproduction and genetic improvement have been identified as a major trend in this industry [4]. Different dimensions [20] compose the management of processes and its study requires from a dynamic and holistic process where the existent interactions amongst the different elements in the system are considered [30,41]. In this conceptual framework, the different activities constitute a process where the activities are managed in a systematic way [42]. According to what it has been explained in the Operative Program (2014), 96% of Small and Medium Size Firms (SMEs) in Castilla-La Mancha region present specific problems as a consequence of the low level in terms of capitalization, reduce turnover and difficulties in the access to finance, lower levels of inter-firm cooperation and lacks in the managerial, commercial, and innovation capabilities. This last agrees with the results obtained by [27] about the low performance on sheep production systems in Castilla-La Mancha. In the last years, some analyses have been done in this industry to better understand the situation and the future trends. Difficulty in accessing financial resources [41], lack of proper processes oriented to results [40], lack of technological packages and lack of managerial abilities [27] seem to be most outstanding problems. By considering previous arguments, the Hypothesis 3a is provided: The farm’s organizational sustainability will positively influence the return of assets (ROA) and return on investment (RF) as profit indicators.
2.6. The Measure of Organizational Sustainability
Organization sustainability implies the putting into practice of new processes to decrease the production or distribution, improvement of quality, or the production or distribution of new or significantly improved products [41].
The use of breeding techniques allows increasing the number of lambs per calving [39]. As [41] noted, productivity will increase as the reproductive index increases, since more liters of milk and kilograms of meat per lamb will be available. The use of reproductive techniques also may promote organizational sustainability. Explain how artificial insemination allows preserving the genetic variability of the species subject to a continuous process of improvement of its productive characteristics, which means a substantial introduction in the productive process. Process management programs in reproduction and genetic improvement increase organizational sustainability [40,41]. According to previous considerations, next table shows the different variables considered in this research to measure farm’s organizational sustainability.
2.7. Training Sustainability
Collins et al. [25] noted that as a complement to the production experience, firms also invest in training sustainability when they provide training to their employees. To understand the sources of a firm’s training sustainability, the attention must be paid to the structure of communication between the external environment and the organization, as well as among the subunits of the organization, and on the character and distribution of expertise within the organization. As [42] describes, it consists of acquiring and assimilating the external information by integrating it in the firm’s knowledge base with the main objective of improving processes and strategies applied to organizations. Firms that possess a high level of training sustainability, present high levels of learning capabilities, by properly integrating external information and converting it into knowledge that can be warehoused [30,42].
This way, as firms have access to different sources of information, as it can be the access to experts in the various activities realized in a farm (as the advisers and experts in PDO) workers will be able to improve their knowledge though including in the firm the external information accessed. The establishment of processes and the selection of people and leaders are fundamental, since the employees’ educational level is a key factor in the absorption capability [26,42]. By considering previous arguments, the Hypothesis 4 is described: The farm’s training sustainability will positively influence the return on assets (ROA) and return on investment (RF) as profit indicators.
2.8. The Measure of Training Sustainability
Different authors have stressed the importance of training, recruitment, and selection processes as absorption training sustainability indicators. Petter et al. [33] studied what factors are associated with the competitive success of Spanish small and medium enterprises (SME). They concluded that those SME that apply human resource practices of recruitment and selection and training achieve best results in 71.5% and 84.2% of farms, respectively. Wang et al. [38] referred to the concepts “knowledge absorption” and “training sustainability”. In their work, they performed an empirical study about the direct impact of IT support for knowledge management on knowledge-based dynamic capability that influences the final firm’s performance on a sample of 113 managers from manufacturing industries. To measure the training sustainability, five indicators were used: absorb new knowledge from external/market sources; absorb new knowledge from suppliers, competitors and customers; absorb new knowledge from educational/research establishments; absorb new knowledge from patents; and absorb new knowledge from personnel mobility. They concluded that higher levels of training sustainability were associated with higher levels of firm’s performance.
Murovec & Prodan [43] provided an empirical analysis with a sample based on the responses to Spanish and Czech Republic’s third Community Innovation Survey (CIS3). They distinguished between demand-pull training sustainability and science-pull training sustainability, and noted the training of personnel as determinant in both of them. Angón et al. [20] applied an innovative learning strategy that promotes the development of training sustainability to reach a better position of students in market. Baumgartner et al. [12] and [13] have stressed the importance of hiring new people, as a way of acquiring new ideas and experiences. Likewise, the firms take advantage of investing in training, hiring people becomes very important in a good recruitment and selection process. Training is a key factor. Beath et al. [34] pointed out in their study about the adoption of practices of integrated management since former survey participants presented the highest rates of adoption of practices requiring more knowledge or being more labor intensive. According to previous considerations, next table shows the different variables considered in this research to measure farm’s organizational sustainability.
2.9. Financial Indicators
Collins et al. [25] consider that value creation and profitability are interlinked concepts that cannot be divided. They distinguish between return on assets (ROA) and return on investments (ROI).
2.10. Return on Assets (ROA)
It measures the benefit before interests and taxes as the proportion between benefit before interests and taxes (BBIT) divided by the total net assets (TNA) at the organization. It can also be calculated as the product between the margin over sales and assets rotation. Where Margin over sales = BBIT/Sales; Assets turnover = Sales/TNA and Margin over sales represents to what extent benefits are related to farm activity, while assets turnover represents the efficiency in the use of assets.
2.11. Return on Investments (RF)
RF or ROI are measured as the division between the benefit after investments and taxes (BAIT) and firm’s equity. According to [25], return on investments depends on return on assets and how external funds are managed in assets presenting profitability over or under financial costs. Considering the approach provided by [44], in this research both metrics ROA and RF or ROI have been used to show final results. Some other authors have also used these same ratios to analyse final firm’s performance. Table 5 shows these studies. Figure 1 shows the conceptual model considered for this research.
Existing literature on sustainability indicators and performance was reviewed to support the indicators used in the research model. Four basic types of sustainability have been considered: economic; technological; organizational; and training. All four support a global sustainability concept.
3. Materials & Methods
The study area was the Spanish region of Castilla La Mancha (38°–41° N; 1°–5° W), whose surface area of roughly 800,000 ha with Mediterranean continental climate, dry winters and hot and dry summers. The study population was 907 farms of Manchego sheep from “La Mancha” region, into the Protected Designation of Origin (PDO) “Queso Manchego”. In addition, information in situ from the 157 smallholders in their farms was collected [27,39,40] through the application of a 226 question survey. A selection of sustainable indicators was conducted according to their relevancy on mixed cereal Manchego sheep system [41]. The indicators selection was based on an extensive literature review. Subsequently, the selection process consists of experts’ judgments by means of successive iterations of a questionnaire, to show convergence of opinions and to identify dissent or non-convergence [40].
Initially, the percentages of the farmers that accomplished the indicator have been calculated regarding each dimension of sustainability. This analysis allowed us to determine the weaknesses of the studied farms. All the attributes used for the implementation of the indexes are shown on Table 1, Table 2, Table 3, Table 4 and Table 5). The values of each variable were calculated by the Delphi method [27,30,42] using the opinion of 157 farmers. They were assessed by means of a one to five Likert scale, where one was the least important and five the most important. From a database with indicators collected through a survey [41] related to production and economic structure, organization, flock management, productivity, socio-economic aspects and farm management, 57 indicators of sustainability and performance were analyzed (Table 1, Table 2, Table 3, Table 4 and Table 5) [39,40,41]. Tables from 1 to 4 show the indicators associated with the different dimensions of sustainability, and Table 5 shows the indicators to measure results.
The relevance of this study is to find out if relationships among different dimensions of firm’s sustainability presented in the theoretical framework significantly influence financial results in sheep farming in Spain. We hypothesize that performance in the sheep-breeding sector in Spain is dependent on tangible and intangible factors. Quantitative analysis was carried out analyzing data collected from sheep farms in Central Spain. The same dataset analyzed in [41] is used to apply the theoretical framework presented and the classification of technological packages established by [20] were also considered. Two approaches to achieving business efficiency, sustainability and the results-based approach have been considered. Intangible cluster variables using groups of indicators that are directly measurable have been estimated. Allocation of these manifest variables follows from literature on sustainability namely economic, technological, organizational and training, as presented in the theoretical framework [10].
To evaluate the influence of sustainability on farm’s performance, an empirical analysis with a dataset of 157 farms has been performed. Four hypotheses have been formulated displayed in Figure 1 and described previously. Structural Equation Model (SEM) has been applied to measure the impact of each dimension of sustainability on final farm’s performance. Each set of indicators of sustainability have been facing to return of assets (ROA) return on investment (RF) as profit indicators. The hypotheses were disaggregated into Hia and Hib, respectively.
4. Results
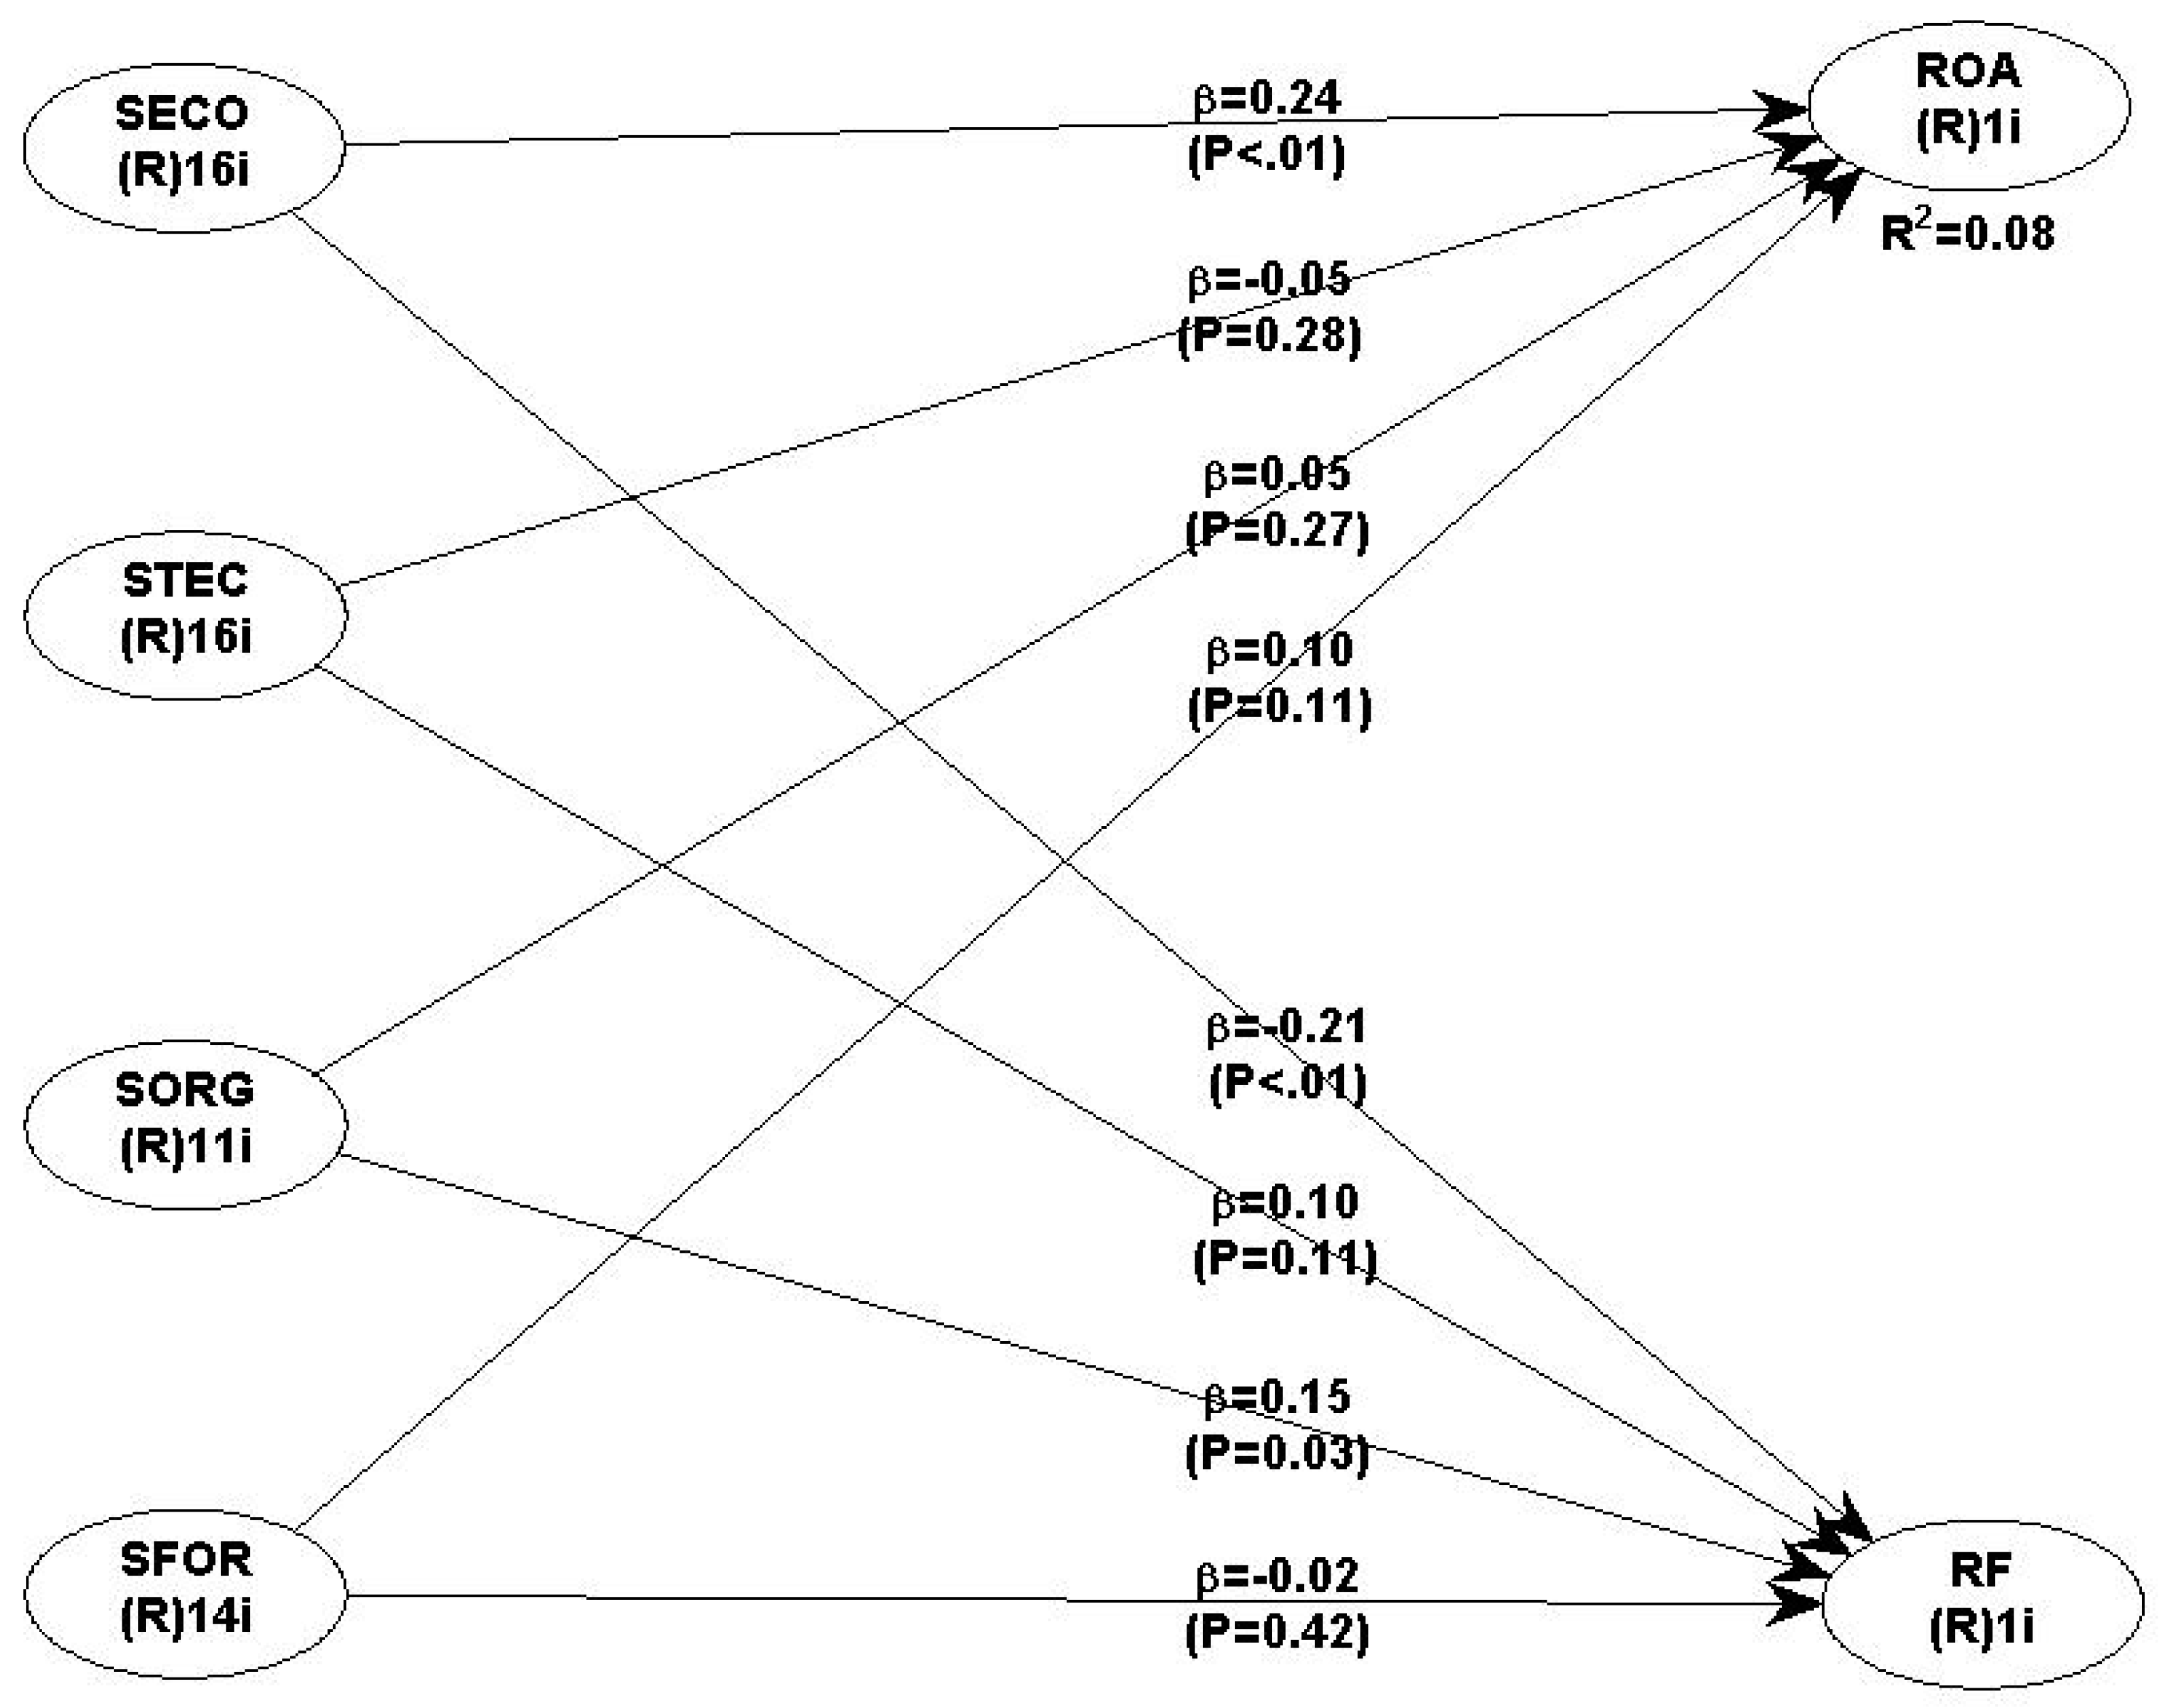
To test the posited hypotheses a non-lineal structural equations model with latent variables (types of sustainability) is specified and estimated. Figure 2 shows relationships results with its corresponding p-values. Arrows indicate posited relationships, and ovals latent variables representing sustainability and profits. Path (beta) coefficients were normalized, taking values between 0 and 1, measuring the strength and direction of the relationships. The model was estimated by means of Warp PLS 6.0 software [45].
Table 6 summarizes model fit and quality indices and its interpretation. The following indices were used to test hypotheses and model fit [45]: average path coefficient (APC); average R-squared (ARS); average adjusted R-squared (AARS); average block variance inflation factor (AVIF); average full collinearity VIF (AFVIF); Tennenhaus goodness-of-fit index (GoF); Sympson’s paradox ratio (SPR); R-squared contribution ratio (RSCR); statistical suppression ratio (SSR); and non-linear bivariate causality-direction ratio (NLBCDR). All quality indices met recommended thresholds.
A summary of the main model parameters values, and their corresponding p-values is presented in Table 7. This table shows the influence of the four types of sustainability on ROA and ROI (RF).
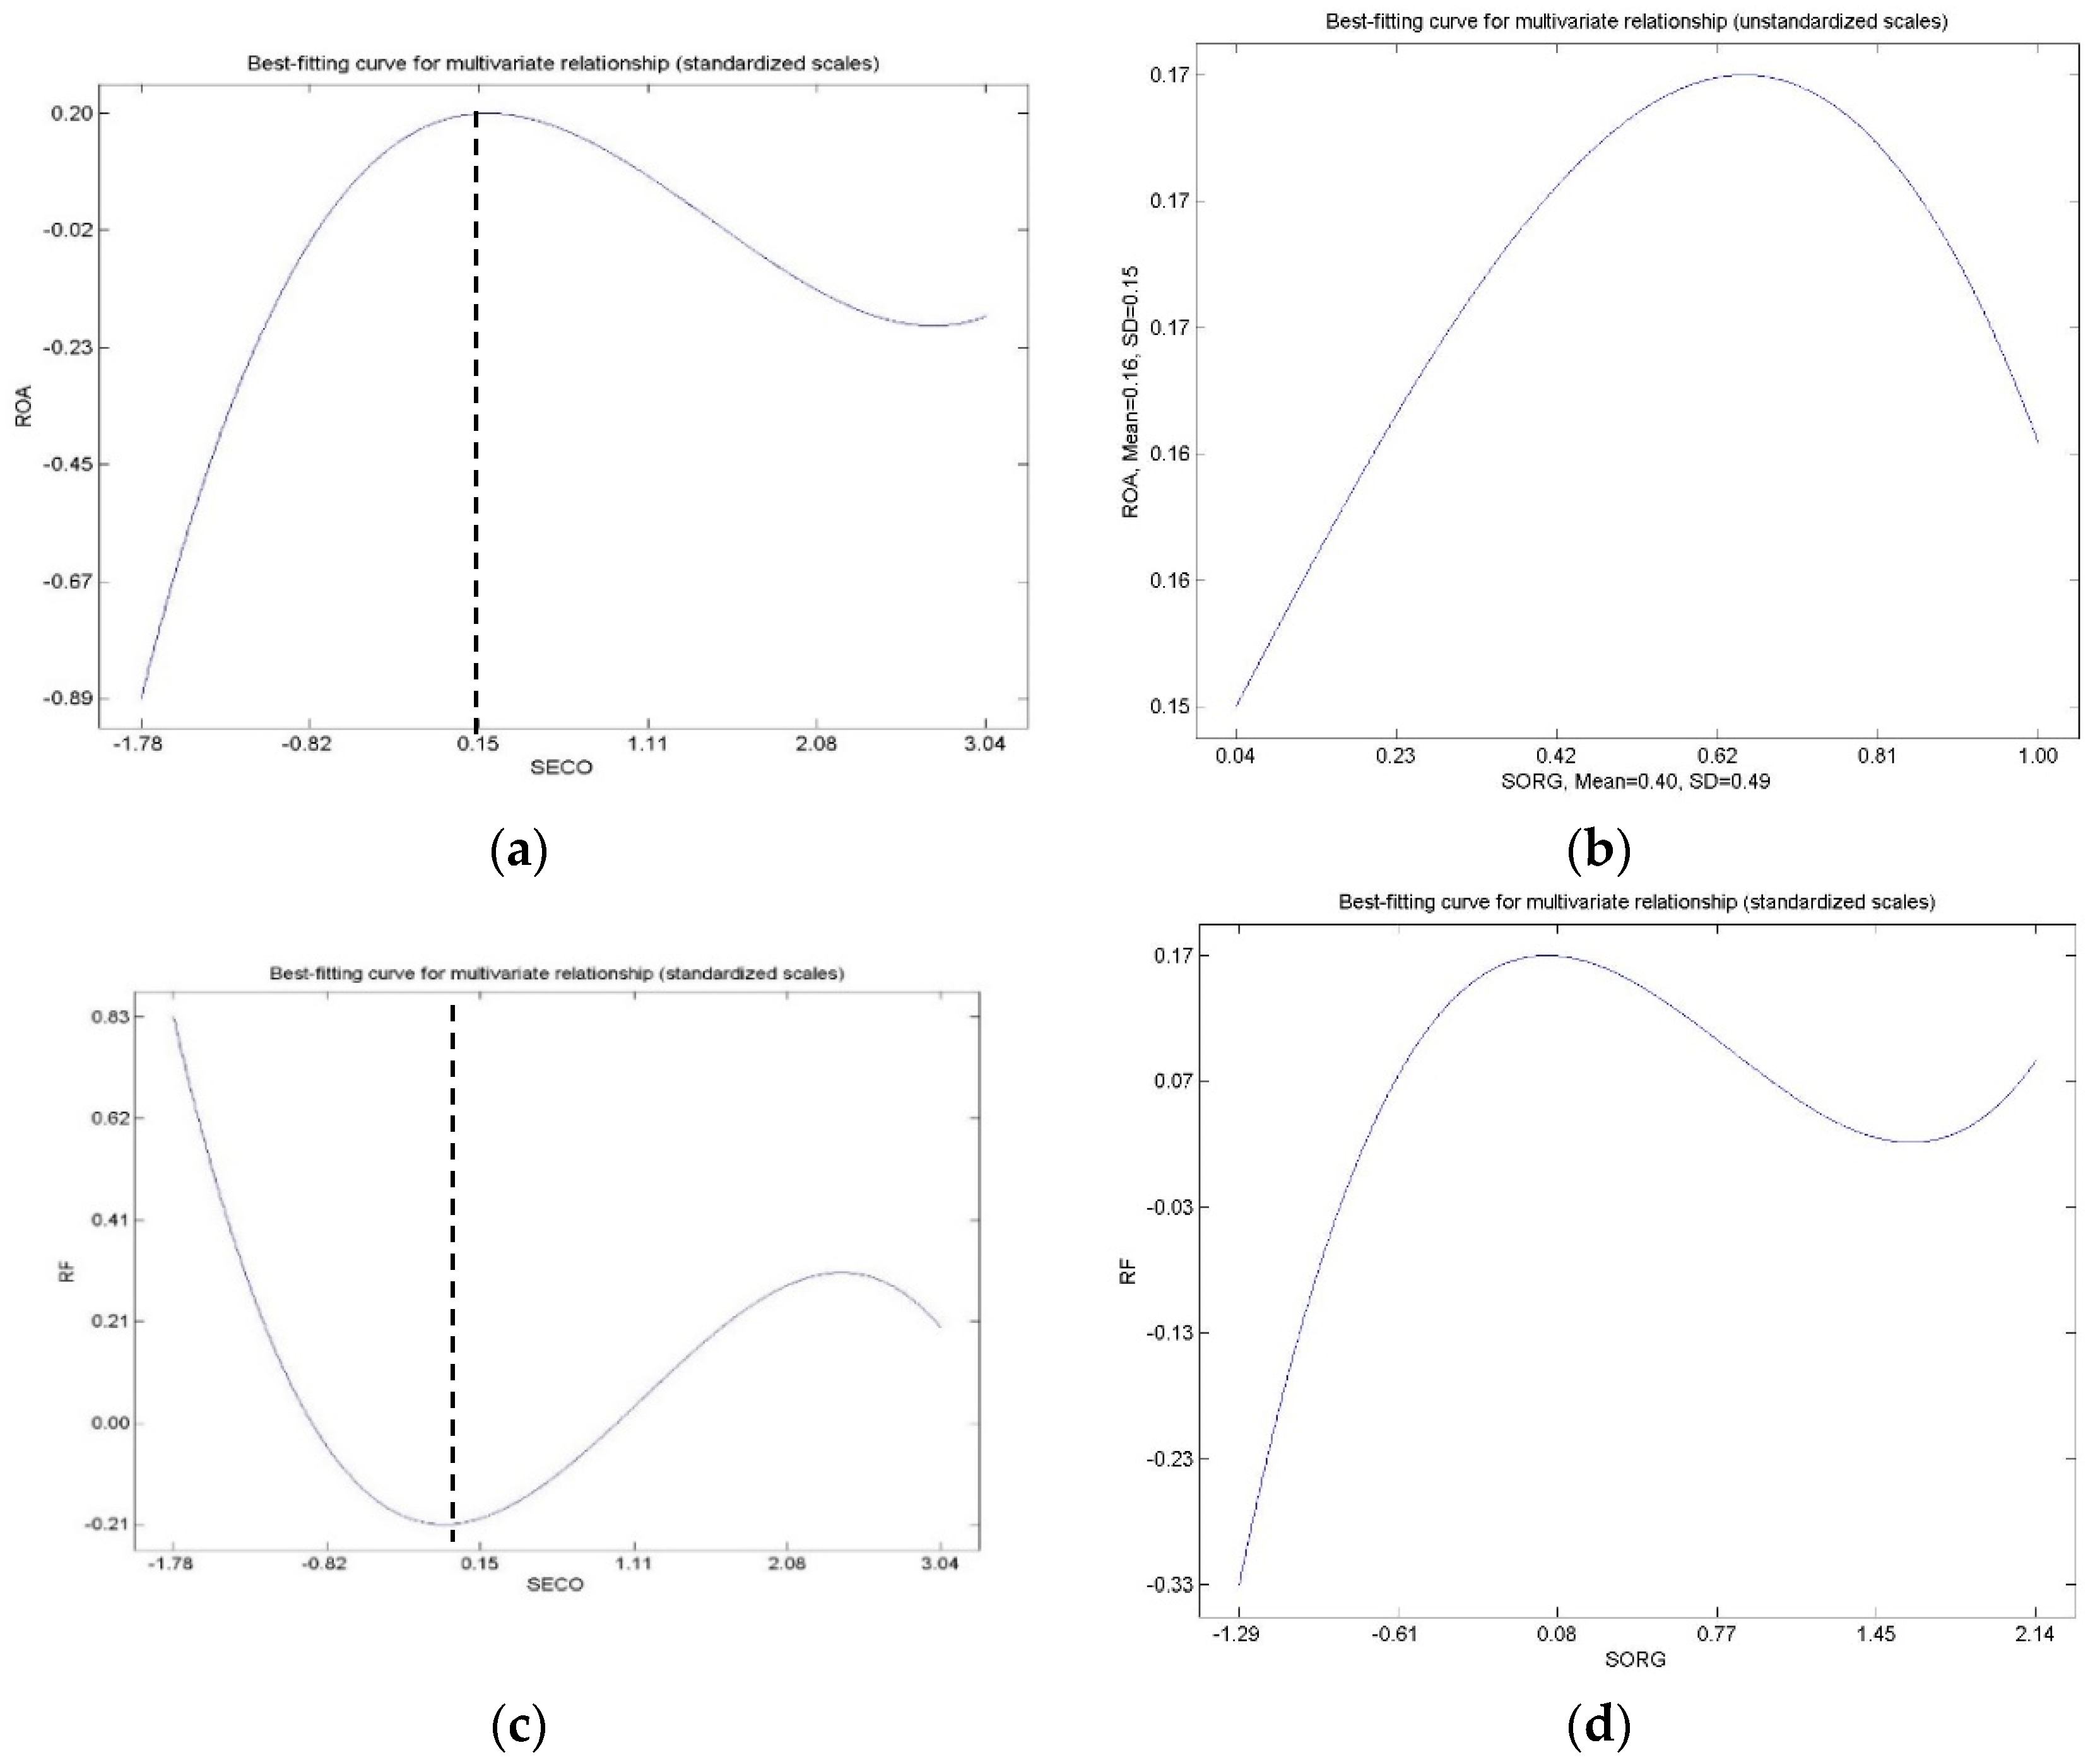
Estimation results show that Hypothesis 1a: the farm’s economic sustainability (SECO) will positively influence the return of assets (ROA) as profit indicator is accepted (p = 0.001). Figure 3 shows the behavior of these two magnitudes. At lower to middle levels, there is a strong positive relation the relationship between the both, followed by a decrease and stabilization.
Surprisingly, results relative to Hypothesis 1b: the farm’s economic sustainability (SECO) will positively influence the return on investment (RF) as profit indicators are also significant (p = 0.003), but the parameter sign is opposite to the expected (−0.210). Figure 3 shed light on this apparently odd result. To attain a positive relation between economic sustainability (SECO) and return on investment, SECO needs to reach a minimum level after which takes place the expected positive relationship. Hypothesis 3b: The farm’s organizational sustainability (SORG) will positively influence the return on investment (RF) as profit indicator is also confirmed (p = 0.027). Like the behavior of ROA against SECO there is a step initial relationship between SECO and RF (measured by ROI. Once a level is reached the intensity of the relationship oscillates, although a high level (Figure 3). Others posited hypotheses could not be confirmed at the required 95% confidence level (see Figure 2 or p-values Table 7).
5. Discussion and Implications
With respect to the main objective of this paper, we conclude that organizational, training, economic, and technological sustainability indexes used agreed and showed strong impact in performance indexes. The methodology applied to determinate the indexes were adequate. Rangel et al. [4] evaluated the incidence of indicators in the final results through logistic regression and seeks an ex ante evaluation of innovation. Nevertheless, the Structural Equation Model (SEM) has been a useful method to determine the quantitative relationship amongst sustainability indexes and the final results of the farms.
This is an exploratory analysis and results agree with [27,41] in cattle, [4,40] in double purpose cattle in Latin America that indicated the great difficulty of modeling an integrated mixed system with multiple synergies and trade-offs amongst activities [2,22]. Hypothesis 1 has been validated, where the farm’s economic sustainability influences the return of assets (ROA) and return on investment (RF). Same way, Hypothesis 3 has been partially accepted: The farm’s organizational sustainability was influenced by the return on investment (RF). In this sense, Hypothesis 3 is confirmed: The farm’s organizational sustainability (SECO) is influenced by the return on investment (RF).
In both cases, the low value of the determination coefficient in the model indicates the need to include other indexes to evaluate final results and this agrees with previous analyses done in mixed systems. The authors of [19] indicate the importance of deepening the knowledge of different objectives, potentials, limitations, and “right of being” of the farms [1,40]. These systems could be modelled by taking into account the four dimensions of sustainability proposal (economic, technological, organizational, and training). Moreover, the farmer’s objectives must be considered in order to achieve a good fit of the proposed model. The authors of The Food and Agriculture Organization of the United Nations (FAO) [1], Rangel et al. [4], Morantes et al. [27] and García-Martínez et al. [40] describe that smallholders in Mediterranean basin, American tropic (Mexico and Ecuador), and South Africa present similar strategic challenges: they seek food security, family welfare, and reduction of poverty. Most of the farms are of small-scale size and subsistence (85%), and only the 15% of the smallholders had clear business objectives and they were looking for an increased productivity [4,19]. In this context, ROA and RF may not be enough to explain results; this is an important reason that shows us why some result was in opposite to expected and the low determination coefficients obtained. In this way, [41] proposes using viability as an indicator. Farm’s viability is based on its economic results, and it must be calculated according to the ability of the farm to generate, over the long term, sufficient profits for guaranteeing the maintenance of the family unit. Therefore, it could be included in future analyses.
Hypothesis 1 has been validated: The farm’s economic sustainability (SECO) positively affects the return of assets (ROA). It was accepted with negative sign: The farm’s economic sustainability (SECO) affects the return on investment (RF). The opposite sign in both hypotheses mainly explains the effect of scale [20], the progressive intensification and the rising price of factors [39,41]. Figure 3a shows a first ascending section of the curve that concentrates the greatest part of farms, increases the economic dimension as consequence of an intensification in the system (more dimension and more productivity), and increases the ROA. Opposite, Figure 3b shows a decrease in the curve. This indicates how as production is intensified and more factors are acquired (land and animals mainly) the return on investments mainly decreases. In Manchega ewe’s case, land is a very limited resource that has already been distributed, and with difficult access [27,39,40]. It competes with other more profitable industries that show higher levels of return; i.e., it constitutes a strong barrier of entry and a high opportunity cost, which explains the increasing abandon of the activity. Once the point of inflexion has been overcome in both curves, the indicators behave as expected [41]. ROA in a decreasing way and RF in an increasing way according to [20] in technified pastoral systems. SORG behavior (Figure 3c,d) agrees with expectations; increasing both indicators (ROA and RF) as the curve moves to the right in the axis of abscissas. The response of the model is nonlinear (Figure 2 and Figure 3) according to the curve of diminishing returns of innovation [20,39]; Nevertheless, [41] and [40] indicate that larger size of the farm entail structural changes; such as more worker force, adjustments in management and more external inputs. Besides, larger scale not necessarily implies more economic efficiency [19,20,21,22]. In this case, the law of decreasing returns explains why the first hypothesis is accepted and the second is rejected.
The model proposed in Table 6, shows the four dimensions of sustainability and provides a priority according to their effect on ROA and RF. Economical dimension is the one that presents higher impacts on the indicators considered. The second one is the organizational dimension. The third one, the technological and last the training one presenting low values to the whole group of data as it has been indicated by [27,41] in these systems. The fourth is sustainability dimensions are dynamic and sequential in time according to the degree of the systems’ evolution [39].
Large intensive livestock farms in developed countries currently have serious problems of environmental, economic and animal welfare viability and high dependence of external inputs. It does not seem the most appropriate model for developing countries, which need their own model for territorial competitiveness with integrated mixed farms [18,19]. The circular economy proposes a change of production model with longer life cycles face a greater intensification of production [1,3,15]. This evolution agrees with [4,40,41] who indicate that those smallholders applying a low-cost strategy, using endogenous resources (native pastures, local breeds, etc.) and appropriate levels of innovation reach best results. In this way, the results showed: firstly, the important an economic dimension (H1) was considered and secondly, the organizational one was taken into account as a strategy to improve results (H3).
Apart from this, the research showed that the number of indicators used is high (57). Maybe the dimension could be reduced by applying multivariate techniques that enable the selection of indexes providing more discriminant capability. In this sense, the application of canonical discriminant analysis with graphical hypothesis-error and structure of a multivariate is suggested [27].
Future analysis should go in deep into the knowledge of interactions amongst sustainability indicators and final farm results. The implementation of improvement practices requires of a holistic and dynamic approach of sustainability, where the existent of synergies and trade trade-offs amongst the four sustainability dimensions should be considered [2,30]. The knowledge of the four types of sustainability is the first step to improve the feasibility and competitiveness of farms [39].
Author Contributions
C.D.-P.-H. has developed the theoretical framework; J.L.M.-B. has done de statistical analysis and A.G.-M. has provided the discussion and conclusions.
Funding
This research was funded by ESIC Marketing & Business School under UDI (Internal Research Units) Project.
Acknowledgments
The authors thank Essential Research Project on agricultural resources and technology run by the Spanish National Institute of Agricultural and Food Research and Technology in conjunction with regional authorities (RTA2011-00057-C02), for providing financial support for the survey.
Conflicts of Interest
The authors declare no conflict of interest.
References
- Food and Agriculture Organization of the United Nations (FAO). Sustainability Assessment of Food and Agriculture Systems (SAFA); FAO: Rome, Italy, 2014. [Google Scholar]
- Schader, C.; Baumgart, L.; Landert, J.; Muller, A.; Ssebunya, B.; Blockeel, J.; Weisshaidinger, R.; Petrasek, R.; Mészáros, D.; Padel, S.; et al. Using the Sustainability Monitoring and Assessment Routine (SMART) for the Systematic Analysis of Trade-Offs and Synergies between Sustainability Dimensions and Themes at Farm Level. Sustainability 2016, 8, 274. [Google Scholar] [CrossRef]
- Ikerd, J.E. The Essentials of Economic Sustainability; Kumarian Press: Bloomfield, CT, USA, 2012. [Google Scholar]
- Rangel, J.; Espinosa, J.; de Pablos-Heredero, C.; Barba, C.; Vélez, A.; Rivas, J.; García, A. Adoption of innovations and organizational practices in management, animal feeding and reproduction in dual-purpose bovine of small farms in Mexico. Rev. Científ. FCV-LUZ 2017, 27, 44–55. [Google Scholar]
- Boons, F.; Montalvo, C.; Quist, J.; Wagner, M. Sustainable innovation, business models and economic performance: An overview. J. Clean. Prod. 2013, 45, 1–8. [Google Scholar] [CrossRef]
- Höjer, M.; Wangel, J. Smart sustainable cities: Definition and challenges. In ICT Innovations for Sustainability; Springer: Cham, Switzerland, 2015; pp. 333–349. [Google Scholar]
- Tussyadiah, I.P.; Pesonen, J. Drivers and barriers of peer-to-peer accommodation stay—An exploratory study with American and Finnish travellers. Curr. Issues Tour. 2018, 21, 703–720. [Google Scholar] [CrossRef]
- Laszlo, C.; Zhexembayeva, N. Embedded Sustainability: The Next Big Competitive Advantage; Stanford University Press: Palo Alto, CA, USA, 2017. [Google Scholar]
- Satish, J.; Yue, L. What is corporate sustainability and how do firms practice it? A management accounting research perspective. J. Manag. Account. Res. 2016, 28, 1–11. [Google Scholar]
- Spangenberg, J.H. Economic sustainability of the economy: Concepts and indicators. Int. J. Sustain. Dev. 2005, 8, 47–64. [Google Scholar] [CrossRef]
- Weaver, P.; Jansen, L.; Grootveld, G.V.; Spiegel, E.V. Sustainable Technology Development; Greenleaf Publishing Book: Austin, TX, USA, 2017. [Google Scholar]
- Baumgartner, R.J.; Rauter, R. Strategic perspectives of corporate sustainability management to develop a sustainable organization. J. Clean. Prod. 2017, 140, 81–92. [Google Scholar] [CrossRef]
- Lozano, R. Creativity and organizational learning as means to foster sustainability. Sustain. Dev. 2014, 22, 205–216. [Google Scholar] [CrossRef]
- Doppelt, B. Leading Change toward Sustainability: A Change-management Guide for Business, Government and Civil Society; Routledge: Abington-on-Thames, UK, 2017. [Google Scholar]
- Aquilani, B.; Silvestri, C.; Ioppolo, G.; Ruggieri, A. The challenging transition to bio-economies: Towards a new framework integrating corporate sustainability and value co-creation. J. Clean. Prod. 2018, 172, 4001–4009. [Google Scholar] [CrossRef]
- Trondsen, T. Value chains, business conventions, and market adaptation: A comparative analysis of Norwegian and Icelandic fish exports. Can. Geogr./Le Géographe Canadien 2012, 56, 459–473. [Google Scholar] [CrossRef]
- Tomczak, T.; Reinecke, S.; Kuss, A. Introduction. In Strategic Marketing; Springer: Wiesbaden, Germany, 2018; pp. 1–18. [Google Scholar]
- Ramdhani, M.A.; Aulawi, H.; Ikhwana, A.; Mauluddin, Y. Model of Green Technology Adaptation in Small and Medium-Sized Tannery Industry. J. Eng. Appl. Sci. 2017, 12, 954–962. [Google Scholar]
- Van’t Hooft, K.; Wollen, T. Sustainable Livestock Management for Poverty Alleviation and Food Security; Cab International: London, UK, 2012; pp. 120–130. [Google Scholar]
- Angón, E.; Perea, J.; Toro-Mújica, P.; Rivas, J.; De-Pablos, C.; García, A. Pathways towards to improve the feasibility of dairy pastoral system in La Pampa (Argentine). Ital. J. Anim. Sci. 2015, 14, 643–649. [Google Scholar] [CrossRef]
- Chou, S.; Chen, J.C. Six Sigma-Based Optimization of Shrinkage Accuracy in Injection Molding Processes. World Academy of Science, Engineering and Technology. Int. J. Ind. Manuf. Eng. 2018, 5, 3. [Google Scholar]
- Henningsen, A.; Czekaj, T.G.; Forkman, B.; Lund, M.; Nielsen, A.S. The relationship between animal welfare and economic performance at farm level: A quantitative study of Danish pig producers. J. Agric. Econ. 2018, 69, 142–162. [Google Scholar] [CrossRef]
- Bhatt, G.D.; Grover, V. Types of information technology capabilities and their role in competitive advantage: An empirical study. J. Manag. Inf. Syst. 2005, 22, 253–277. [Google Scholar] [CrossRef]
- Nieves, J. Relaciones sociales, capacidades dinámicas e innovación: Un análisis empírico en la industria hotelera. Revista Europea de Dirección y Economía de la Empresa 2014, 23, 166–174. [Google Scholar] [CrossRef]
- Collins, C.; Clark, K. Strategic Human Resource Practices, Top Management Team Social Networks, and Firm Performance: The Role of Human Resource Practices in Creating Organizational Competitive Advantage. Acad. Manag. J. 2003, 46, 740–751. [Google Scholar]
- Mao, H.; Liu, S.; Zhang, J.; Deng, Z. Information technology resource, knowledge management capability, and competitive advantage: The moderating role of resource commitment. Int. J. Inf. Manag. 2016, 36, 1062–1074. [Google Scholar] [CrossRef]
- Morantes, M.; Dios-Palomares, R.; Peña, M.E.; Rivas, J.; Perea, J.; García, A. Management and productivity of dairy sheep production systems in Castilla-La Mancha, Spain. Small Rumin. Res. 2017, 149, 62–72. [Google Scholar] [CrossRef]
- Dao, V.; Langella, I.; Carbo, J. From green to sustainability: Information Technology and an integrated sustainability framework. J. Strateg. Inf. Syst. 2011, 20, 63–79. [Google Scholar] [CrossRef]
- Altieri, M.A. Agroecology: The Science of Sustainable Agriculture; CRC Press: Boca Raton, FL, USA, 2018. [Google Scholar]
- De-Pablos-Heredero, C.; Fernández-Renedo, C.; Medina-Merodio, J.A. Technical efficiency and organ transplant performance: A mixed-method approach. Int. J. Environ. Res. Public Health 2015, 12, 4869–4888. [Google Scholar] [CrossRef] [PubMed]
- Pearlson, K.E.; Saunders, C.S.; Galletta, D.F. Managing and Using Information Systems, Binder Ready Version: A Strategic Approach; John Wiley & Sons: Hoboken, NJ, USA, 2016. [Google Scholar]
- Bravo Ibarra, E.R.; Herrera, L. Capacidad de innovación y configuración de recursos organizativos. Intang. Cap. 2009, 5, 301–320. [Google Scholar]
- Petter, S.; Delone, W.; McLean, E.R. The Past, Present, and Future of “IS Success”. J. Assoc. Inf. Syst. 2012, 13, 341–362. [Google Scholar] [CrossRef]
- Beath, C.; Becerra-Fernandez, I.; Ross, J.; Short, J. Finding Value in the Information Explosion. MIT Sloan Manag. Rev. 2012, 53, 18–20. [Google Scholar]
- Shahbazi, R.; Haghshenas, M.; Nassiriyar, M.; Sadeghzadeh, A. Methodology Presentation for the Integration of Knowledge Management and Business Intelligence. Int. J. Serv. Sci. Manag. Eng. 2016, 3, 26–31. [Google Scholar]
- Daneels, E. Trying to become a different type of Company: Dynamic capability at Smith Corona. Strateg. Manag. Rev. 2010, 32, 1–31. [Google Scholar] [CrossRef]
- Wallace, J.C.; Butts, M.M.; Johnson, P.D.; Stevens, F.G.; Smith, M.B. A multilevel model of employee innovation: Understanding the effects of regulatory focus, thriving, and employee involvement climate. J. Manag. 2016, 42, 982–1004. [Google Scholar] [CrossRef]
- Wang, E.; Klein, G.; Jiang, J.J. IT support in manufacturing firms for a knowledge management, dynamic capability link to performance. Int. J. Prod. Res. 2007, 45, 2419–2434. [Google Scholar] [CrossRef]
- Toro-Mújica, P.; García, A.; Aguilar, C.; Vera, R.; Perea, J.; Angón, E. Economic sustainability of organic dairy sheep systems in Central Spain. Ital. J. Anim. Sci. 2015, 14, 3625. [Google Scholar] [CrossRef]
- García-Martínez, A.; Rivas, J.; Rangel, J.; Espinosa, J.A.; Barba, C.; De-Pablos-Heredero, C. A methodological approach to evaluating the technological innovation in small-scale farming. Future Internet 2016, 8, 25. [Google Scholar] [CrossRef]
- Rivas, J.; Perea, J.; Angón, E.; Barba, C.; Morantes, M.; Dios-Palomares, R.; García, A. Diversity in the dry land mixed system and viability of dairy sheep farming. Ital. J. Anim. Sci. 2015, 14, 179–186. [Google Scholar] [CrossRef]
- De-Pablos-Heredero, C.; Fernández-Valero, G.; Blanco-Callejo, M. Supplier Qualification Sub-Process from a Sustained Perspective: Generation of Dynamic Capabilities. Sustainability 2017, 9, 730. [Google Scholar] [CrossRef]
- Murovec, N.; Prodan, I. Absorptive capacity, its determinants, and influence on innovation output: Cross-cultural validation of the structural model. Technovation 2009, 29, 859–872. [Google Scholar] [CrossRef]
- Laaksonen, O.; Peltoniemi, M. The essence of dynamic capabilities and their measurement. Int. J. Manag. Rev. 2018, 20, 184–205. [Google Scholar] [CrossRef]
- Kock, N. Warp PLS 6.0; ScriptWarp Systems: Laredo, TX, USA, 2017. [Google Scholar]
Figure 1.
Conceptual model.
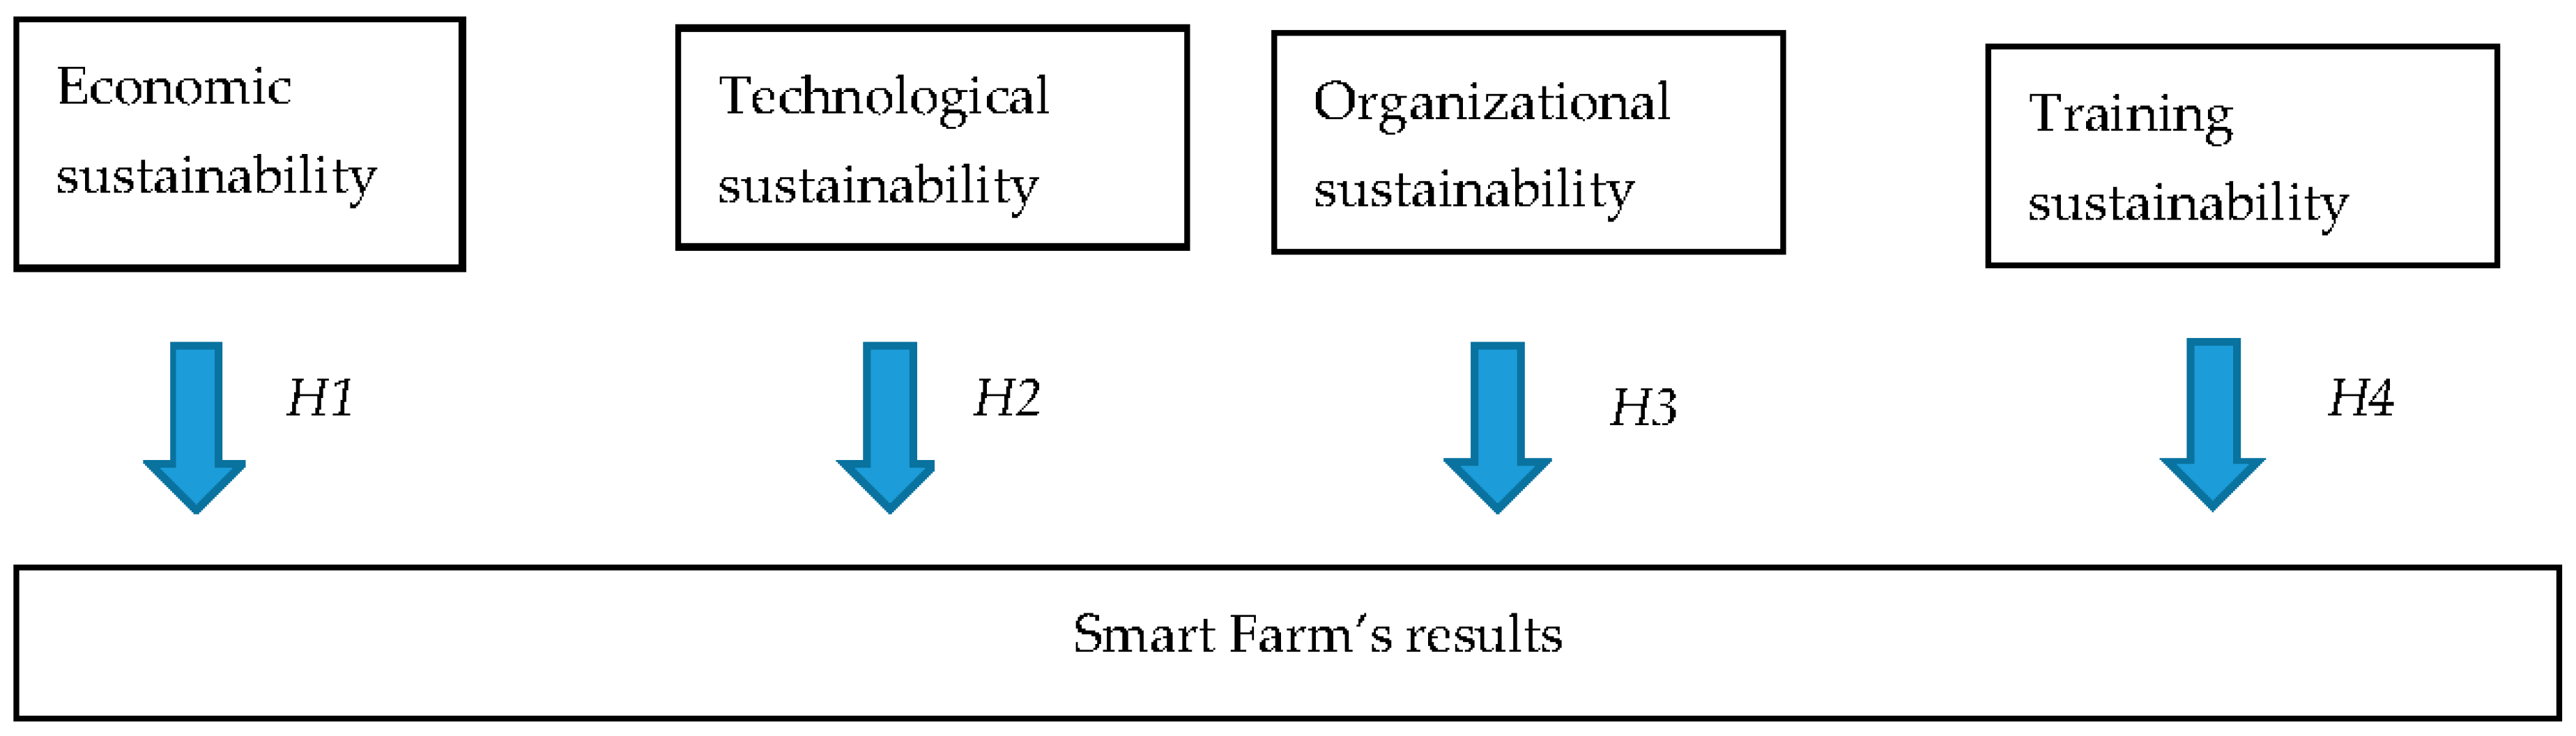
Figure 2.
Research Model Scheme and main results.

Figure 3.
Economic and Organizational sustainability (SECO and SORG) and final performance (return of assets (ROA) and return on investment (RF)) relationship curves. (a,c) Economic sustainability (SECO); (b,d) Organizational sustainability (SORG).
Figure 3.
Economic and Organizational sustainability (SECO and SORG) and final performance (return of assets (ROA) and return on investment (RF)) relationship curves. (a,c) Economic sustainability (SECO); (b,d) Organizational sustainability (SORG).


Table 1.
Indicators for measurement of economic sustainability.
| Indicator | Authors |
|---|---|
| MERCH—direct selling from consumer to wholesaler | [12] |
| CHVAR—kind of cheese sold | [14] |
| SLAMBS—selling of lambs | [12] |
| SRAMS—selling of milk per ewe | [1] |
| FSL—female sale | [27] |
| MSL—male sale | [12] |
| CHSO—cheese sold | [23] |
| WOSO—wool sold | [2] |
| MASO—manure sold | [12] |
| UNFE—use of unified as integral food system | [13] |
| SUBP—use of by-products as animal food | [13] |
| PRON—use of pastures | [13] |
| LANDA—use of agriculture for food production | [4,24] |
| REPRO—reproduction planning | [14] |
| KREC—availability of registers | [13] |
Table 2.
Indicators for measurement of technological sustainability.
| Indicator | Authors |
|---|---|
| REGB—system of registers (births, deaths, sales, etc.) | [12] |
| UINF—use of information to make decisions | [35] |
| MILK—milk control as a managing strategy | [16] |
| PLAN—planning of operational processes (reproduction, health, breed, etc.) | [9,15] |
| INTP—Integral planning of different areas | [37] |
| GENP—genetic improvement | [1] |
| DIET—degree of agreement between animal diet and level of production | [36] |
| MINE—use of minerals | [34] |
| SUPL—use of supplements | [33] |
| HEALP—use of health plans | [15] |
| HYGP—use of Hygienic plan | [30] |
| PREV—use of prevention plans | [35] |
| CONSE—conservation of extra materials | [4] |
| STRHE—Strategies for managing animals | [35] |
| TECH—technologies in the milking parlour | [27] |
| ECOG—use of echographia | [1] |
| ANDRO—andrological evaluations | [4] |
| ANSE—animal selection |
Table 3.
Indicators for measurement of organizational sustainability.
| Indicator | Authors |
|---|---|
| IDENT—individual identification of animals | [27,41] |
| CTPAR—control of internal and external parasites | [41] |
| HECON—health control in the udder and in milk quality | [39] |
| NIDIS—disinfection of the nipple after milking | |
| DRTR—application of drying treatment | [41] |
| STREF—putting into practice any strategy to improve the efficiency in the use of water and conservation of land | [40] |
| DISTR—the organization of different areas according to a logic sequences in terms of flowing of animals, machines and workers | [41] |
| DIMEN—availability of milking place according to the flock dimension and easy access to animals and workers | [39] |
| ATANK—availability of milking place a proper refrigeration (in terms of volume and capacity) | [40] |
| CLMI—availability of automatic cleaning equipment and use of protocols in the milking place | |
| ROEQ—availability of place and equipment for the artificial breed of lambs | |
| RPTE—the use of reproductive techniques (flushing, matting, hormonal treatments, etc.) | |
| INDR—reproduction index (birth/sheep/year) | |
| ARTI—the use of artificial insemination as a tool to improve genetics |
Table 4.
Indicators for measurement of training sustainability.
| Indicator | Authors |
|---|---|
| TRAIN—training actions | [43] |
| STARE—staff’s recruitment | [25] |
| SOING—sources of information | [13] |
| USEAD—use of advisors | [43] |
| TYAD—kind of advisors | [13] |
| CONA—conditions for advisors | [20] |
| GRASC—be part of a cooperative | [34] |
| KINDA—kind of cooperative | [16] |
Table 5.
Indicators for measurement of firm’s results.
| Indicator | Authors |
|---|---|
| ROA—return on assets RF (ROI)—return on investments | [3,17] [3,8,10] [6] |
Table 6.
Model fit and quality indices overview.
| Index | Value | Value Interpretation |
|---|---|---|
| Average path coefficient (APC) | (APC) = 0.112, p = 0.038 | Significant if p < 0.05 |
| Average R-squared (ARS) | (ARS) = 0.040, p = 0.154 | Significant if p < 0.05 |
| Average adjusted R-squared (AARS) | (AARS) = 0.014, p = 0.214 | Significant if p < 0.05 |
| Average block VIF (AVIF) | VIF (AVIF) = 1.874 | Acceptable if ≤ 5, ideally ≤ 3.3 |
| Average full collinearity VIF (AFVIF) | (AFVIF) = 3.320, | Acceptable if ≤ 5, ideally ≤ 3.3 |
| Tenenhaus GoF (GoF) | (GoF) = 0.146 | Small ≥ 0.1, medium ≥ 0.25; large ≥ 0.36 |
| Sympson’s paradox ratio (SPR) | (SPR) = 0.750 | acceptable if ≥ 0.7, ideally = 1 |
| R-squared contribution ratio (RSCR) | (RSCR) = 0.711 | Acceptable if ≥ 0.9, ideally = 1 |
| Statistical suppression ratio (SSR) | (SSR) = 1.000 | Acceptable if ≥ 0.7 |
| Non-linear bivariate causality direction ratio (NLBCDR) | (NLBCDR) = 0.750 | Acceptable if ≥ 0.7 |
Table 7.
Total effects and p-value.
| Types of Sustainability | |||||
|---|---|---|---|---|---|
| SECO | STEC | SORG | SFOR | ||
| Financial Indicators | ROA | 0.236 (0.001) | −0.047 (0.276) | 0.048 (0.272) | 0.096 (0.110) |
| RF | −0.210 (0.003) | 0.095 (0.112) | 0.150 (0.027) | −0.015 (0.424) | |
© 2018 by the authors. Licensee MDPI, Basel, Switzerland. This article is an open access article distributed under the terms and conditions of the Creative Commons Attribution (CC BY) license (http://creativecommons.org/licenses/by/4.0/).
Share and Cite
MDPI and ACS Style
De-Pablos-Heredero, C.; Montes-Botella, J.L.; García-Martínez, A. Sustainability in Smart Farms: Its Impact on Performance. Sustainability 2018, 10, 1713. https://doi.org/10.3390/su10061713
AMA Style
De-Pablos-Heredero C, Montes-Botella JL, García-Martínez A. Sustainability in Smart Farms: Its Impact on Performance. Sustainability. 2018; 10(6):1713. https://doi.org/10.3390/su10061713
Chicago/Turabian StyleDe-Pablos-Heredero, Carmen, Jose Luis Montes-Botella, and Antón García-Martínez. 2018. "Sustainability in Smart Farms: Its Impact on Performance" Sustainability 10, no. 6: 1713. https://doi.org/10.3390/su10061713
Note that from the first issue of 2016, this journal uses article numbers instead of page numbers. See further details here.