Growing Urbanization and the Impact on Fine Particulate Matter (PM2.5) Dynamics

State Key Laboratory of Urban and Regional Ecology, Research Center for Eco-Environmental Sciences, Chinese Academy of Sciences, Beijing 100085, China
*
Author to whom correspondence should be addressed.
Sustainability 2018, 10(6), 1696; https://doi.org/10.3390/su10061696
Submission received: 11 April 2018
/
Revised: 16 May 2018
/
Accepted: 18 May 2018
/
Published: 23 May 2018
(This article belongs to the Section Sustainable Urban and Rural Development)
Abstract
:Changes in urban air quality and its relationship with growing urbanization provide an important insight into urban development strategies. Thus, we collected remotely sensed PM2.5 concentrations, as well as urban population datasets, and analyzed the scaling relationship between changes in urban population and concentrations of PM2.5. The majority of large cities in North America and Europe had PM2.5 concentrations which decreased significantly. Only 2.0% of large cities in the U.S. were found to have significant positive trends. PM2.5 concentration trends of less than 0.5 μg/m3·year were found in all large cities of Africa and Latin America. However, PM2.5 concentration trends of more than 1.0 μg/m3·year were found in 56.7% of the large cities in Asia, where only 2.3% of the cities in China were found with significant negative trends, and no cities in India were found with significant negative trends. Large cities in Asia were found with contributions of 4.12 ± 4.27 μg/m3·year per million people, particularly large cities in China (5.40 ± 4.80 μg/m3·year per million people) and India (4.07 ± 3.07 μg/m3·year per million people). Significant negative or positive relationships were obtained between PM2.5 trends and population change rates in large cities of North America (R2 = 0.9195, p < 0.05) or Europe (R2 = 0.9161, p < 0.05). Moreover, a significant inverse “U-type” relationship (R2 = 0.8065, p < 0.05) was found between PM2.5 trends and population change rates in large cities of Asia. In addition, the positive or negative relationships between the trends in population and PM2.5 were obtained in typical low- and mid-income countries (e.g., China and India) or high-income countries (e.g., USA), respectively.
1. Introduction
More than 50% of the global population live in urban areas due to rapid urbanization derived from population migration occurring over the past several decades [1]. Compared to small cities, large cities can absorb higher populations because of its better employment opportunities, access to medical care, education levels, etc. Rapid population migrations and the intensive living and working conditions in high-density populated urban areas have impacted the ecology and the environment in these areas in many visible ways, including through environmental pollution and ecological change (e.g., air pollution and net primary productivity [2,3]). Thus, special concern is paid to the influence of world urbanization, especially the impact of increased population derived from intensive human activities on urban air quality, which is easily visible to both citizens and authorities [4]. As traditional air pollutants have been monitored and analyzed for quite some time, some traditional air pollutants (e.g., NO2) have been well examined in conjunction with changes in population in urban areas [5]. However, many other air pollutants, which may not be new but can now be monitored thanks to recent technological improvement, have not been well documented [4].
Fine particulates with less than 2.5 µm in diameter (PM2.5), which have toxic components that can negatively impact public health and meteorological visibility, are important major air pollutants in urban areas [6,7]. Traditional operational air quality monitoring stations provide very accurate records at certain locations [7,8,9,10]. But, the use of these records are limited by the spatial availability of the stations, and cannot illustrate the full-covered spatial patterns of PM2.5 concentration in long time-series on a global scale. Thus, satellite remotely sensed records of PM2.5 concentration together with complex models validated/calibrated by ground observations is highly suggested to be employed in order to present a quantitative spatial analysis [11,12,13].
For global scale urbanization research, the size of an urban population is an important and easy-to-compare factor to illustrate urbanization. It could explain the general regulation of urban development models. Urban air pollution has been highly attributed to urbanization in terms of urban population size in previous studies [4,5]. Therefore, to investigate the scaling relationship between changes in PM2.5 and growing urbanization in large cities, by using the full-covered PM2.5 concentration and United Nation urban population records at a global scale.
2. Materials and Methodology
2.1. Populations and Large Cities
In our research, large cities refer to cities with a population of more than 0.75 million, which is a general standard by the United Nations. The population records used, which are statistical records for each city in 2000 and 2010, were collected from World Urbanization Prospects (available at http://esa.un.org/unup/). The data provided the location of each large city, but without city boundary information. We then employed a moderate resolution imaging spectroradiometer (MODIS) global map of urban extent to overlay with the large city points [14,15]. A final global large cities’ polygon layer, with a spatial resolution of 0.5 × 0.5 km, was selected where both urban extent and large cities were identified. Finally, 456 large cities were selected: 252 in Asia, 50 in Europe, 53 in Latin America, 55 in America, 41 in Africa, and 5 in other areas (See Supplementary Materials for the details of those cities).
2.2. PM2.5 Concentration Trends in Large Cities
The PM2.5 concentrations were estimated with an optimal estimation algorithm based on top-of-atmosphere reflectance observed by MODIS products [12,13]. Practically, based on the simulation of a GEOS-Chem chemical transport model, the PM2.5 concentrations were estimated from a combination of MODIS and multi-angle imaging spectroradiometer (MISR) aerosol optical depth (AOD) with aerosol vertical profiles and scattering properties [11,12]. The global PM2.5 concentration dataset had a spatial resolution of 10 × 10 km as a three year moving average during 1999–2011, (available at http://fizz.phys.dal.ca/~atmos/martin/?page_id=140 [12]). The dataset was downloaded and used in this study, and the PM2.5 trend was calculated as the significant (p < 0.05) slope of the linear regression model at each pixel’s time series. Positive/negative trends were then defined as trends larger than zero or smaller than zero, respectively. Finally, the PM2.5 concentration trends were resampled to meet the resolution (i.e., 0.5 × 0.5 km) with the global cities’ polygon and then overlaid with the layer of the global large cities’ layer to obtain the PM2.5 concentration trends at each large city.
2.3. Scaling Relationship Analysis
At a global scale, comparing the relationship between urbanization and PM2.5 dynamics in large cities is one of the most appropriate and easy ways to understand the types of impacts urbanization has on the eco-environment. It can provide knowledge for policy-makers to select appropriate ways to design their strategies on both urban development and eco-environmental conservation. Thus, the scaling analysis was selected and carried out for this research. The PM2.5 concentration trends were first divided and averaged by the population change rates at every 10% interval to examine the variations of PM2.5 concentration change against urban population change. Then, correlation analysis was carried out between the mean PM2.5 concentration trends and their urban population change rates (which is the scaling relationship in our work) in large cities in different regions and countries to quantify the impact of growing urbanization on PM2.5 pollution change.
2.4. Potential Contribution of Urbanization to PM2.5 Concentration
Increasing PM2.5 concentration is expected to come from growing human activities that emit pollutants. However, an increase in human activities that polluted did not always come from an increase in urban population for each city. In low-technical, labor-based cities, human activities directly resulted from an increase in urban population, and urban population increase led to higher PM2.5 concentrations. However, in the case of high-technical, non-labor based cities, urban population increase did not necessarily lead to increases in PM2.5 concentrations. At a global scale, to simplify the potential contribution of growing urbanization, in terms of urban population change, to PM2.5 concentration, we assumed that the increase of urban PM2.5 concentration came from an increase in urban population, and therefore, took the PM2.5 concentration trend per increased capita as the potential contribution of urbanization to PM2.5 concentration.
3. Results and Discussion
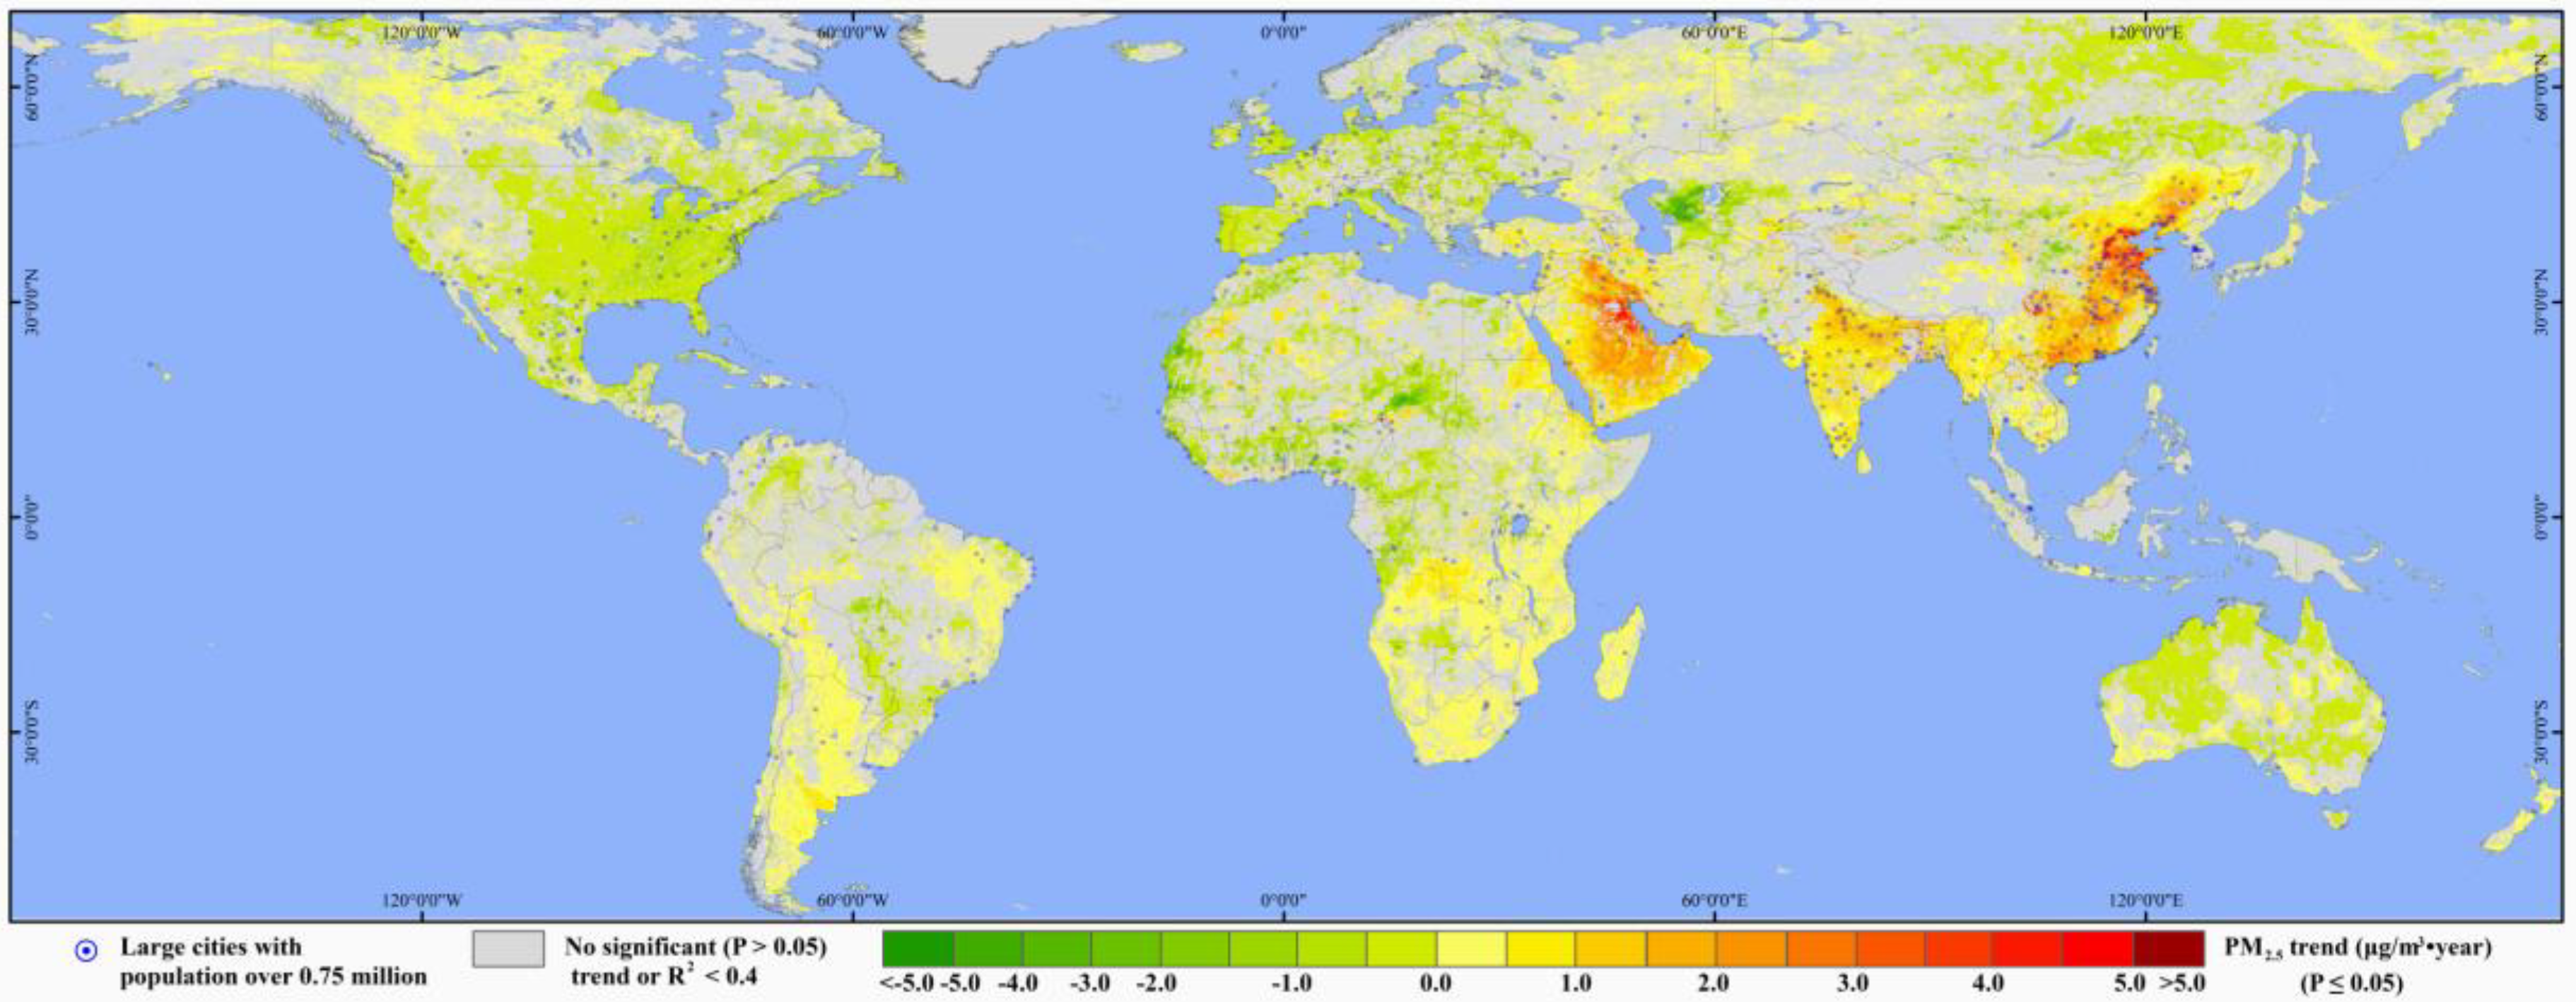
The significant trends (i.e., p > 0.05) of PM2.5 concentration were found to vary among regions (Figure 1). Four areas could be highlighted due to their significant negative/positive trends. Central and Eastern U.S. were observed with significant negative trends, indicating the improvement of air quality. The northeast, east, south, and southeast of China, India, and the Arabian Peninsula were found to have significant positive trends, indicating the degeneration of air quality.
Similar results were reported in some of the previous research [12,13,16,17], and the changes in East China were explained to have been primarily caused by the increase in urban population and the decrease in wind speeds [18,19]. However in the U.S., India, and the Arabian Peninsula, the reasons for the changes are still unknown and need further analysis.
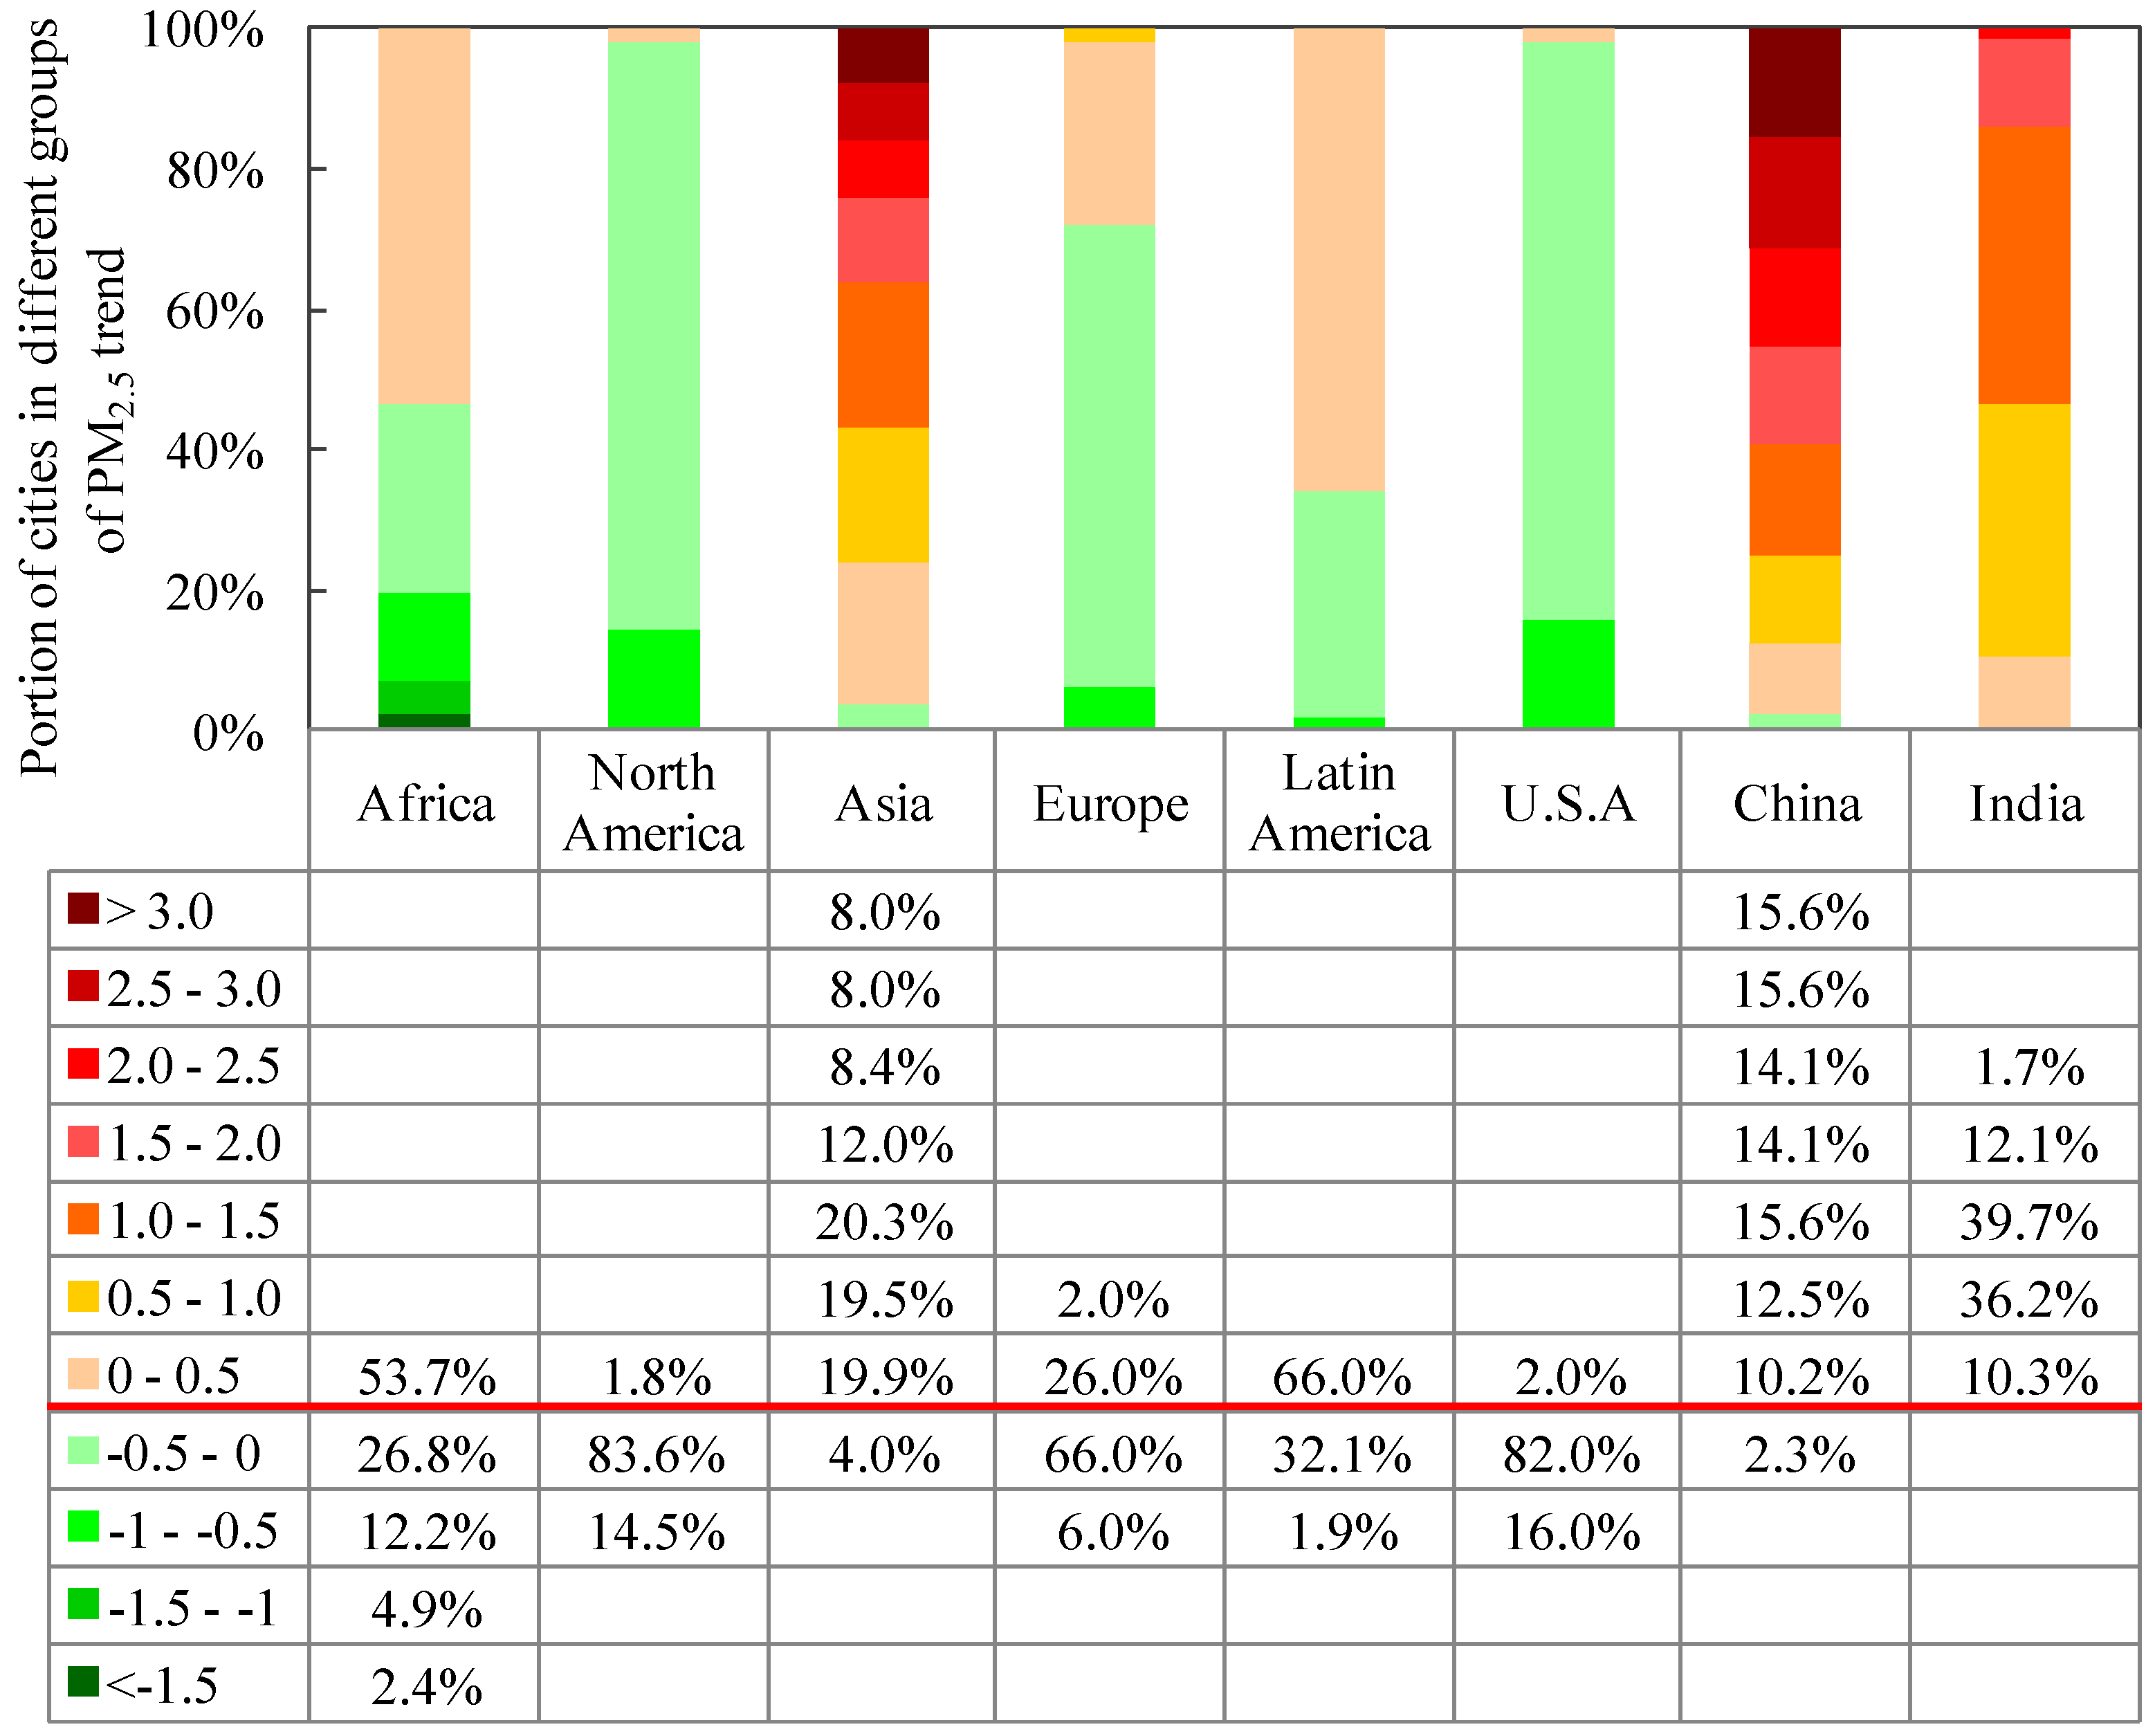
The significant trends of PM2.5 concentration in large cities were also varied (Figure 2). In continents dominated by high-income countries (i.e., North America and Europe), most cities observed significant decreases in PM2.5 concentrations, and only 1.8% and 28% of large cities in these two areas, respectively, observed significant increases of PM2.5 concentrations at less than 0.5 μg/m3·year. All large cities in Africa and Latin America were found to have PM2.5 concentration trends of less than 0.5 μg/m3·year, meanwhile 53.0% and 66.0% of their large cities, respectively, were found with increasing trends. Only 4.0% of the large cities in Asia had PM2.5 concentrations with significant negative trends, but 8.0%, 16.4%, and 32.3% of the large cities were found to have positive trends of more than 3.0 μg/m3·year, from 2.0–3.0 μg/m3·year, and from 1.0–2.0 μg/m3·year, respectively.
The significant trends of PM2.5 concentration in large cities were also different between large cities in typical high-income countries (e.g., U.S.) and typical low- and mid-income countries (e.g., China and India) (Figure 2). Only 2.0% of the cities in the U.S. were found with significant positive trends, which were less than 0.5 μg/m3·year. However, only 2.3% of the cities in China were found with significant negative trends, and no cities in India were found with significant negative trends.
Rapid urbanization in large cities on continents such as Europe and North America has largely finished, and therefore, there has been less of an impact on the environment. Anti-pollution measures in the U.S. and Canada have contributed to the decrease of PM2.5. In addition, the economic crisis (2007–2009) may have also affected the trend of PM2.5 [20,21]. Similar conditions can be found in Latin America, where 80% of the population lives in cities. However large cities in East Asia, particular China and India, are still undergoing rapid urbanization which brings strong negative impacts to the environment. Thus, the change of PM2.5 concentration should be a useful indicator to explain a development strategy that balances urbanization and environmental protection at the country level. Such information would highlight the development strategy which should be given more attention for environmental protection in countries experiencing rapid urbanization. Moreover, we believe that cooperation between the government and the public to mitigate the PM2.5 hazard would ensure a sustainable future, while accommodating low- and mid-income countries’ growing urbanization.
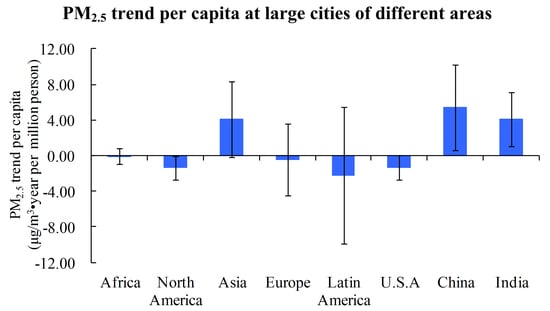
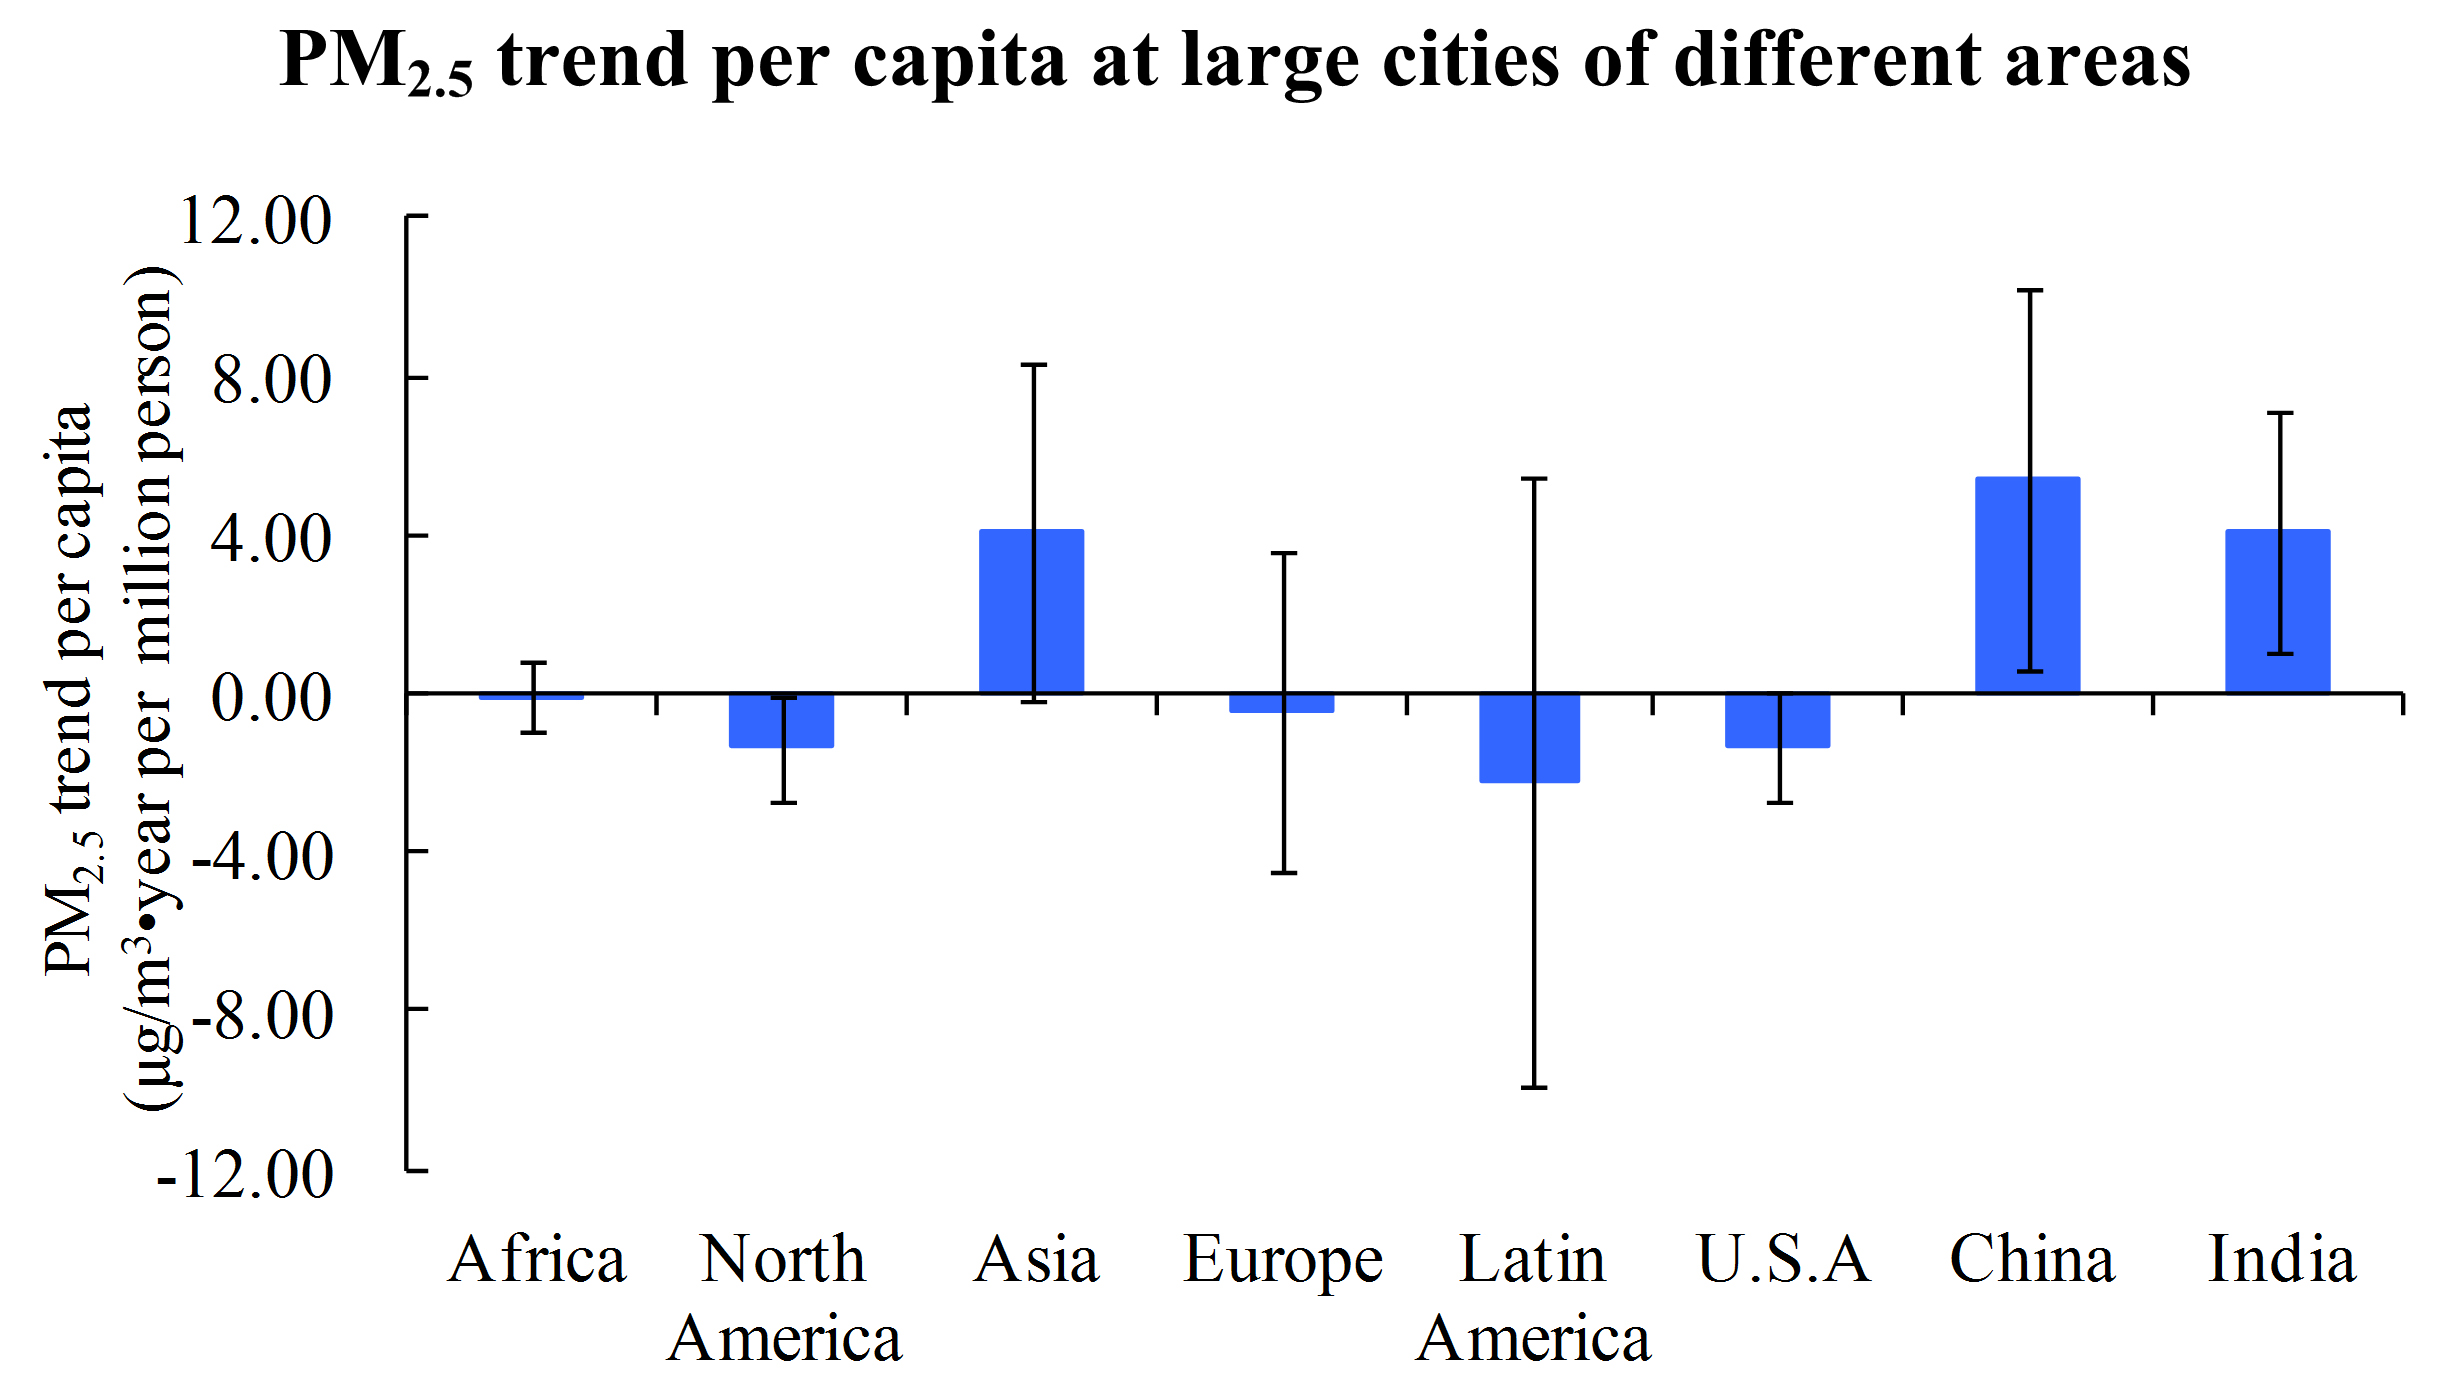
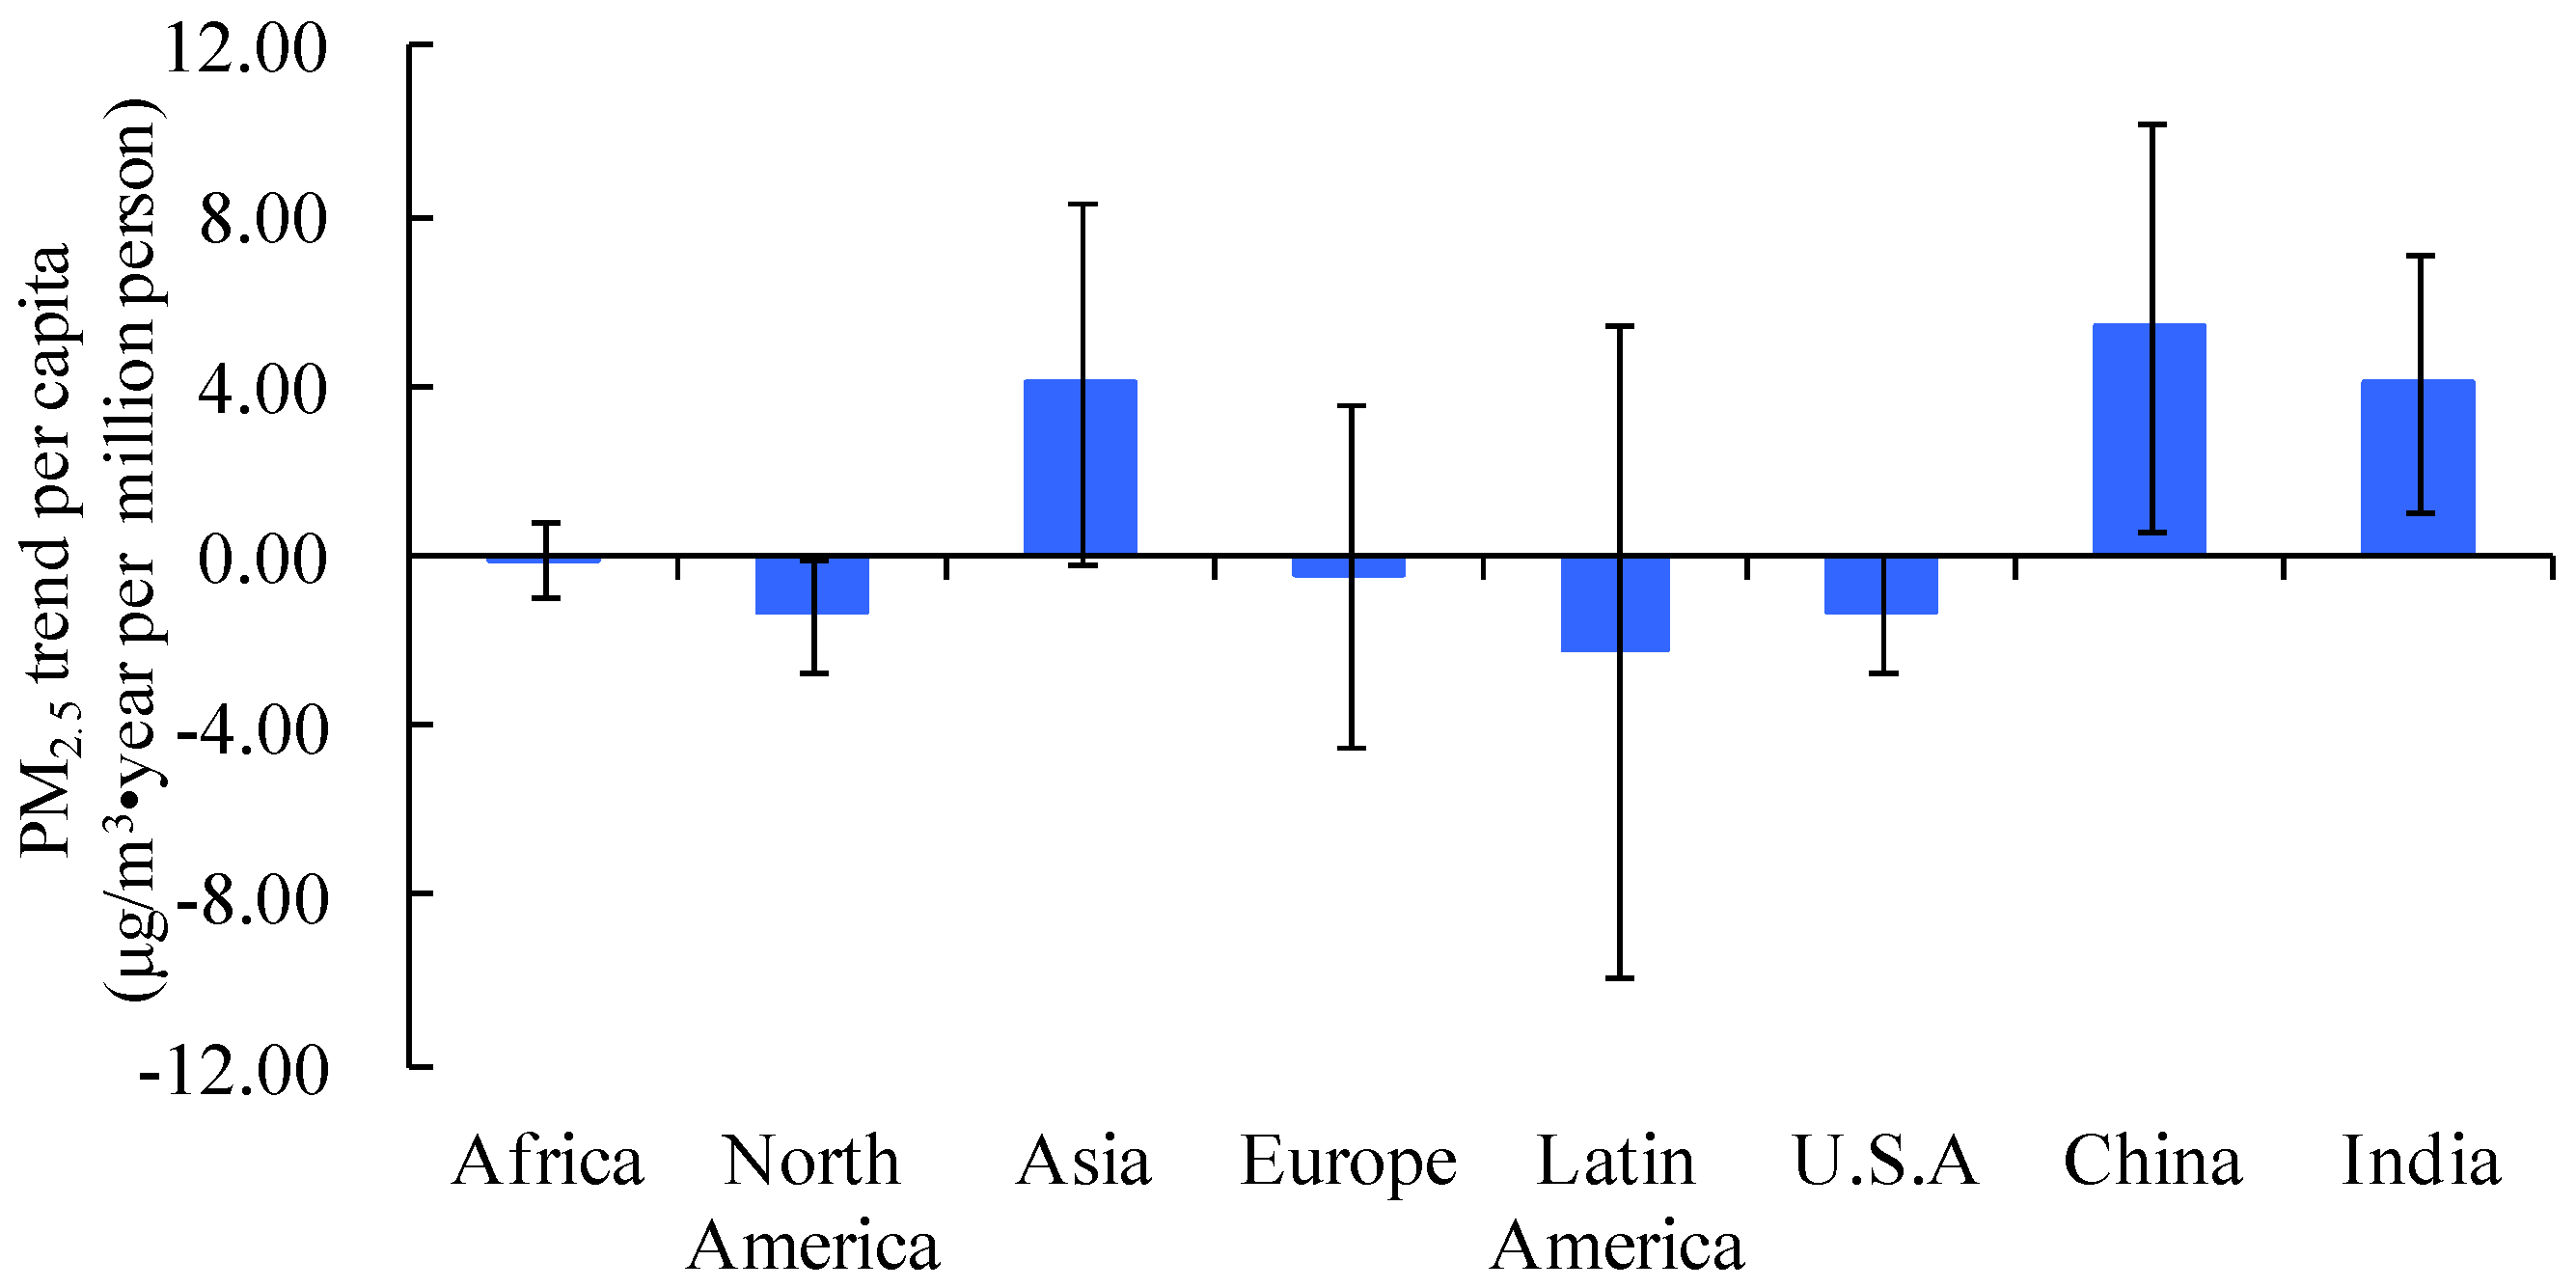
The contribution of population to PM2.5 changes were varied among continents, and between high-income and low- and mid-income countries (Figure 3). Large cities in Asia had an average and standard deviation of 4.12 ± 4.27 μg/m3·year per million people increase, while all large cities on the rest of the continents were found with contributions of less than or near the average and standard deviation of 4.12 ± 4.27 μg/m3·year per million people. Although large cities in the U.S. had a negative contribution to PM2.5 concentrations (−1.32 ± 1.37 μg/m3·year per million people), large cities in China (5.40 ± 4.80 μg/m3·year per million people) and India (4.07 ± 3.07 μg/m3·year per million people) had a positive contribution to PM2.5 concentrations.
Similar to our previous assertion that population increase did not necessarily result in environmental degeneration, the type of development could be the key factor. The contribution of population increase to PM2.5 concentration changes would suggest a sustainable development model between urbanization and environmental protection, particularly for large cities in rapidly urbanizing countries, (e.g., China and India). The types of development models in Europe, U.S, and Latin America have already provided a better strategy for development without bringing significant negative impacts to the environment. In addition, the values and patterns of the contributions in different regions and countries were similar to the previous analysis, which used only one year’s worth of data from the large cities [4]. It proved again that a method of spatial sequence instead of a time succession sequence can work when doing research on the impact of population on air pollution.
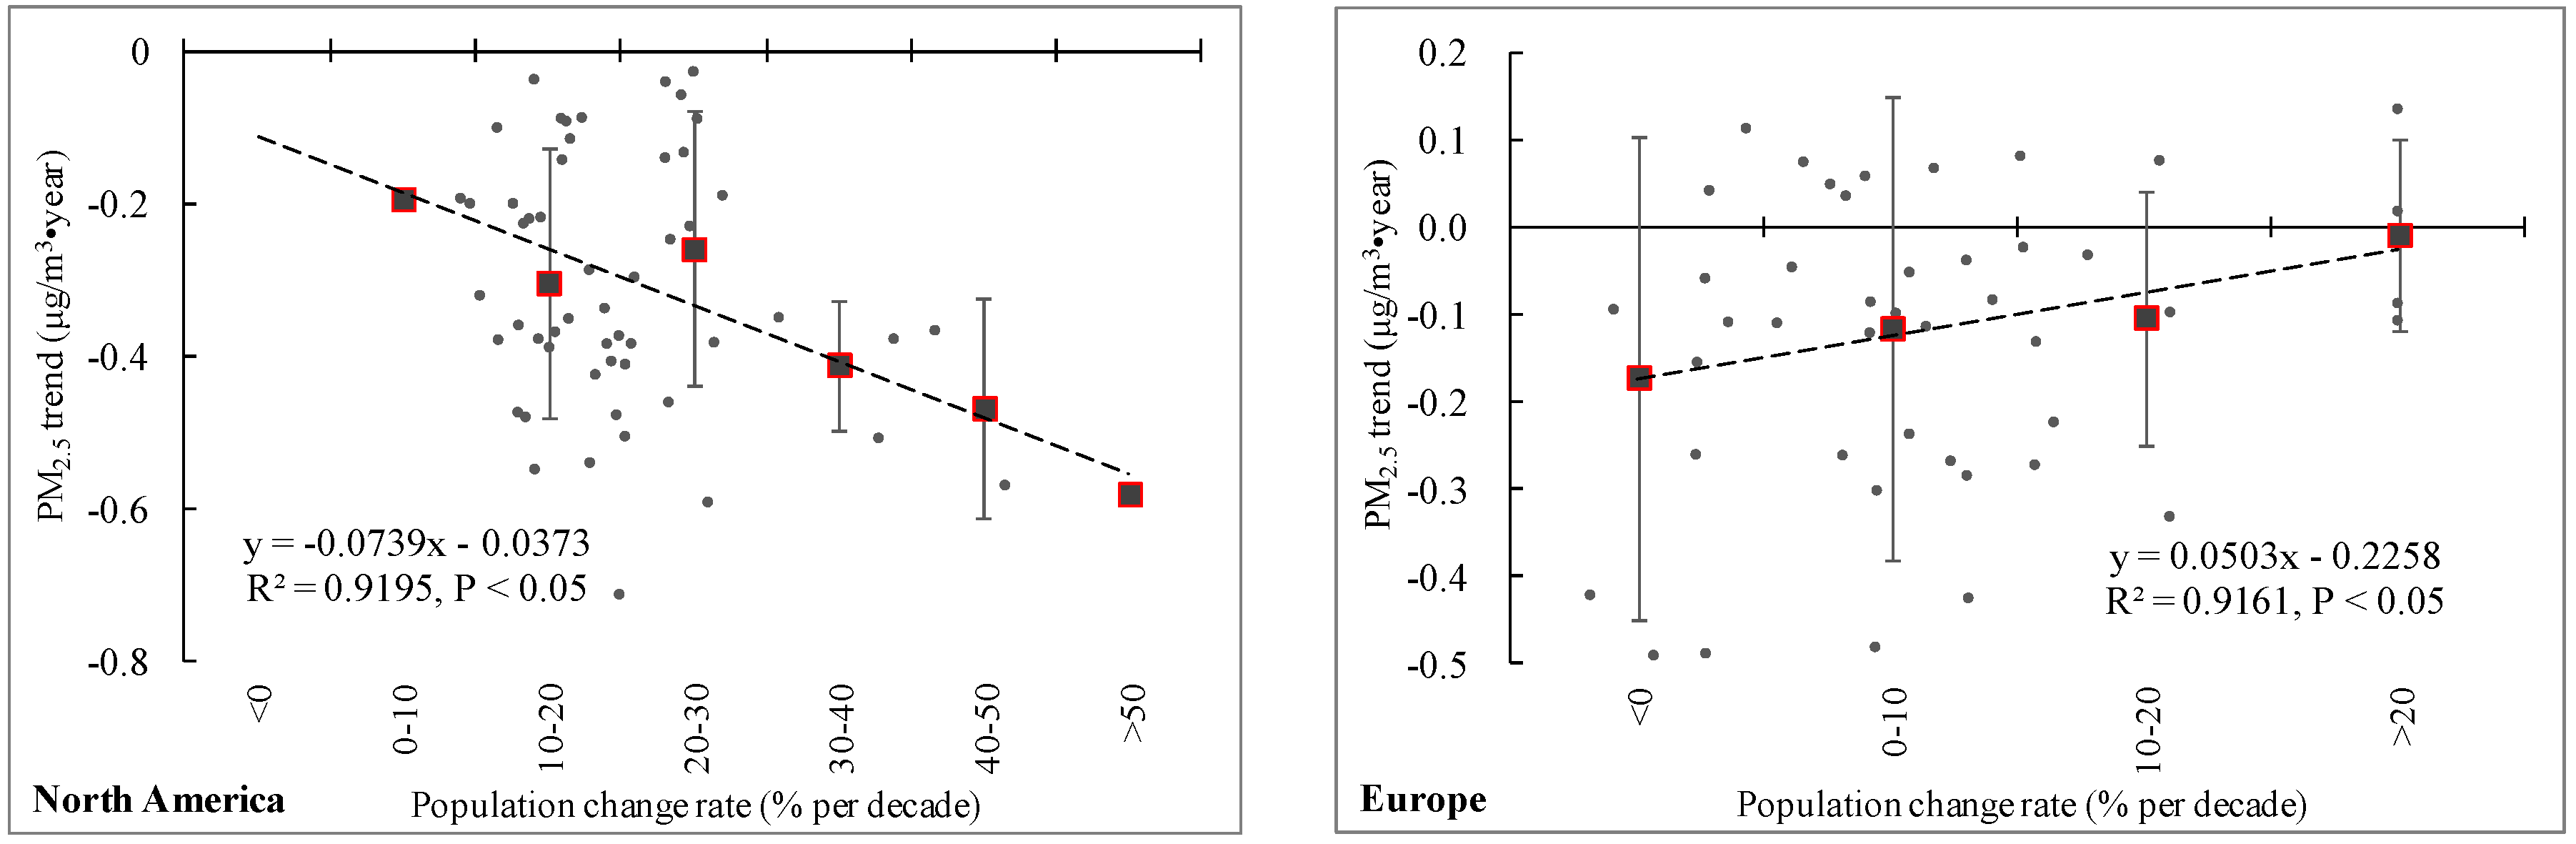
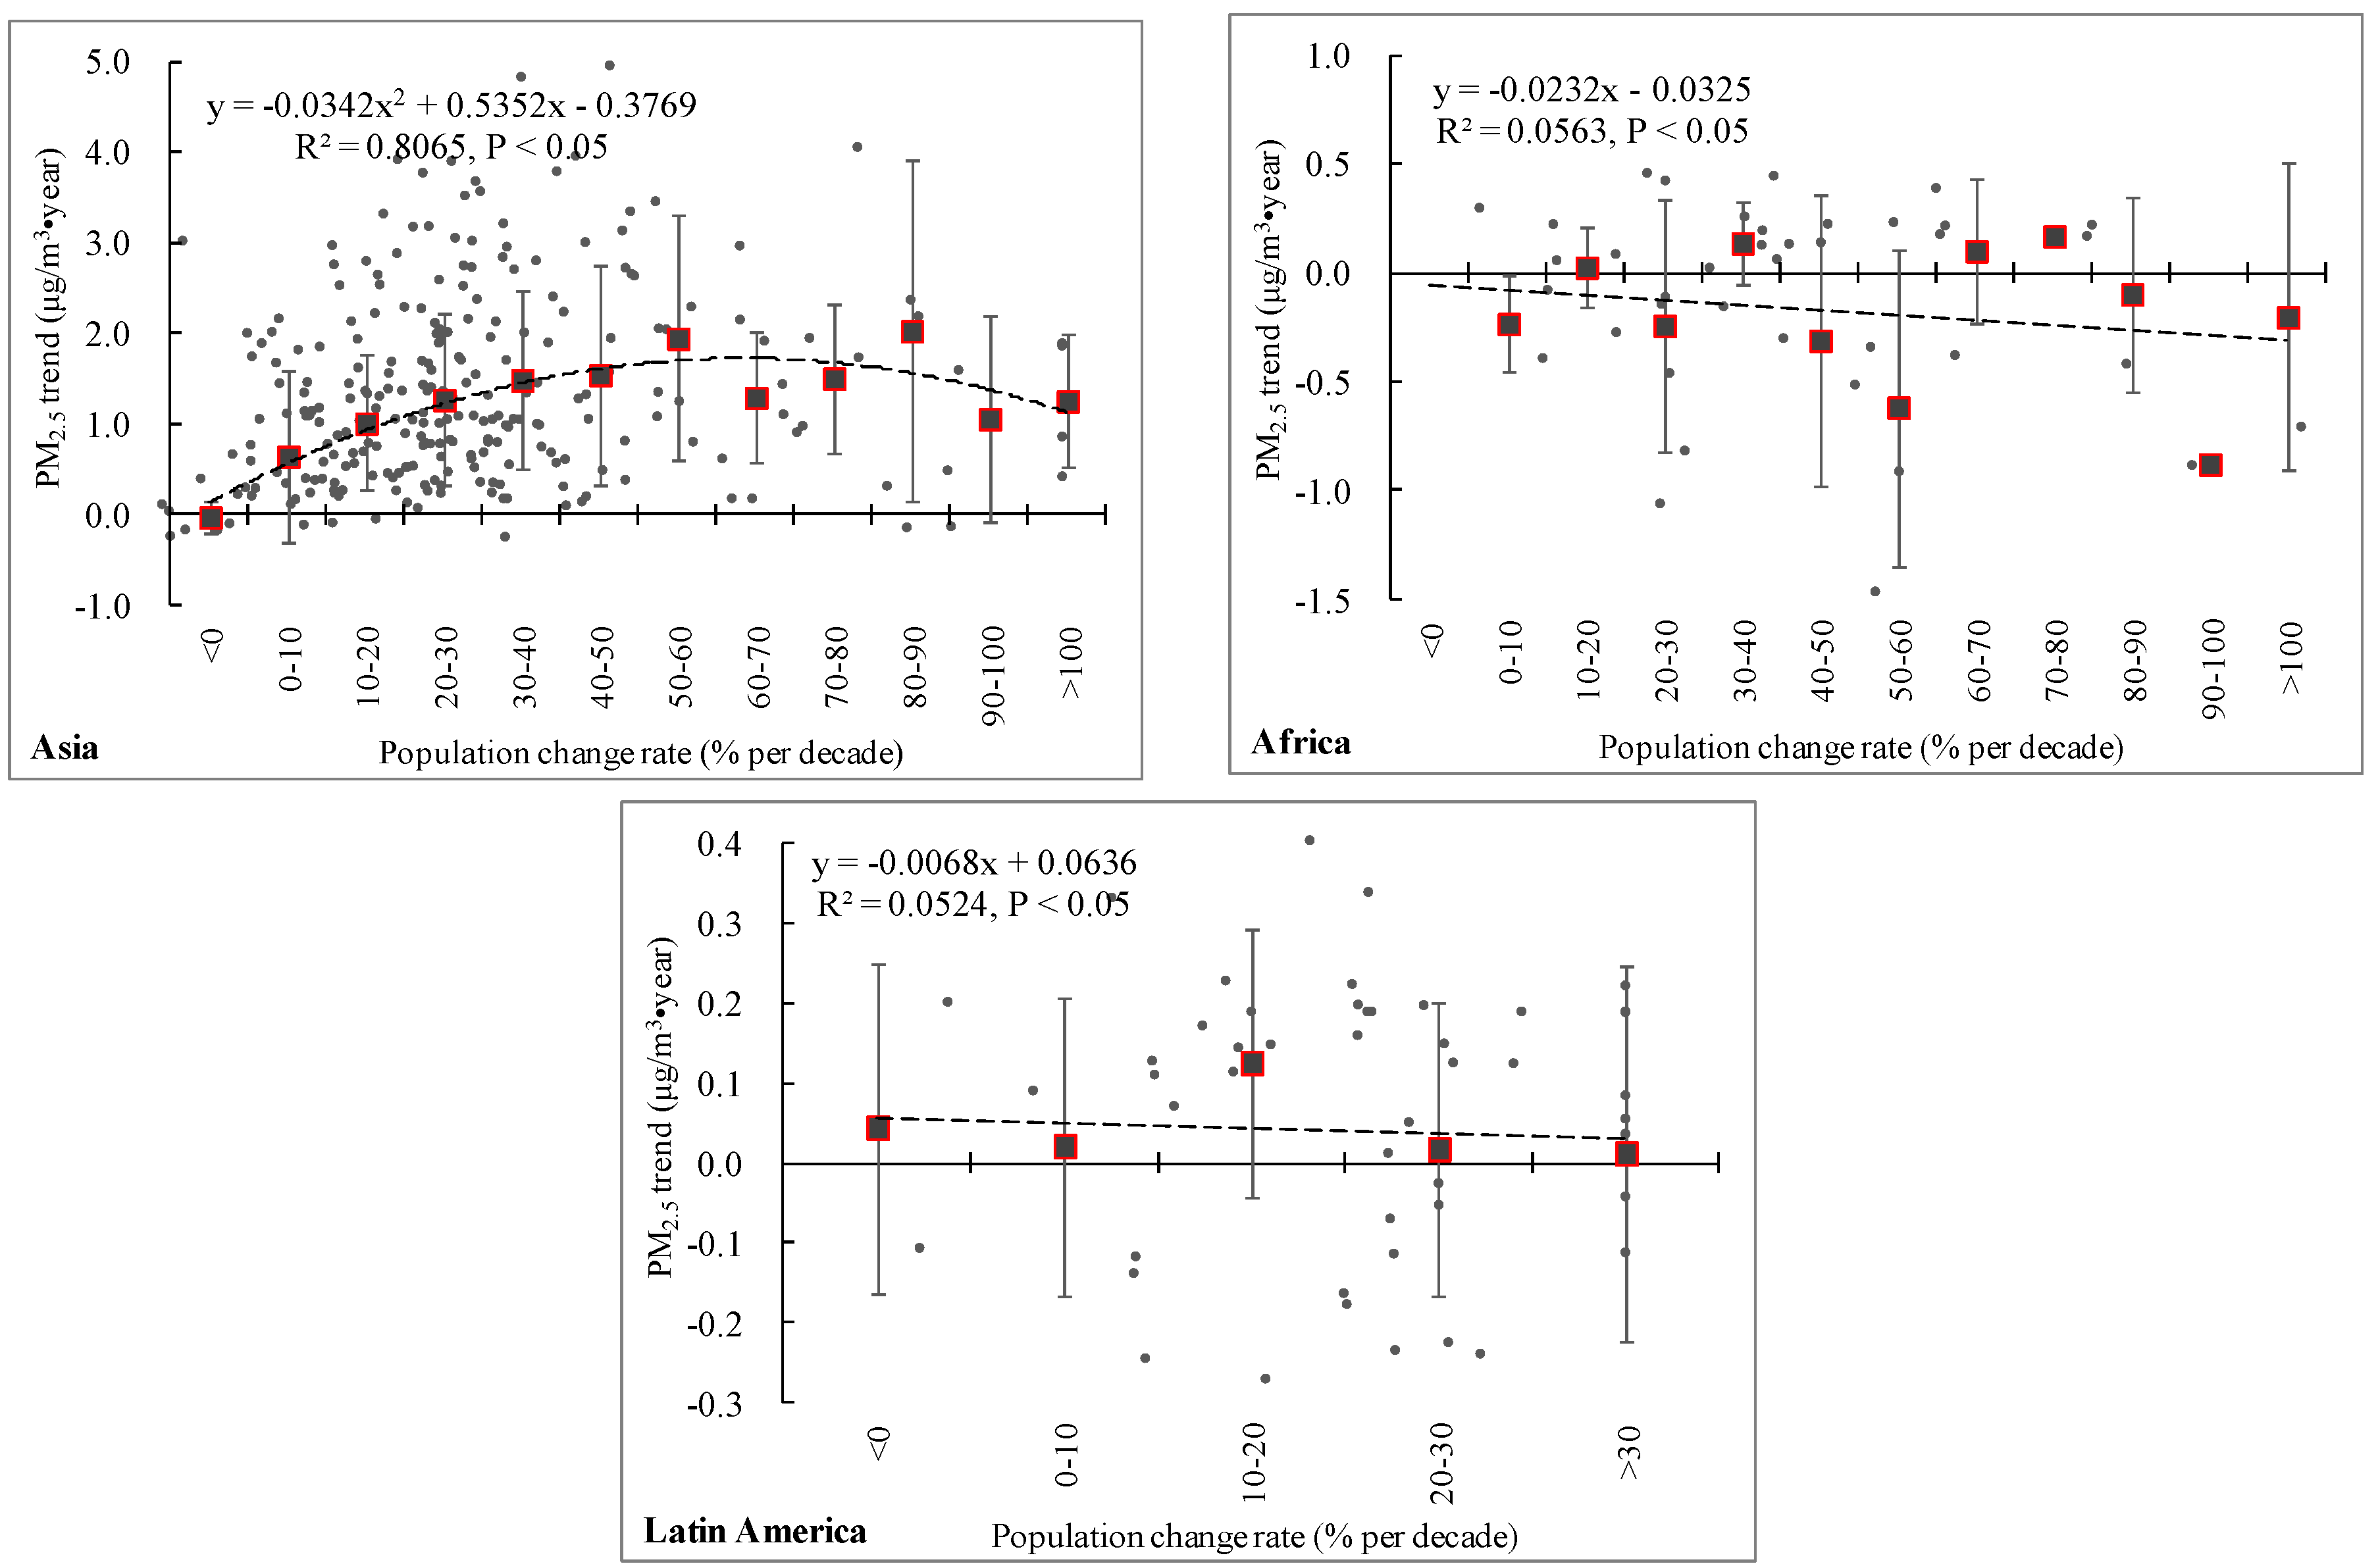
Diverse relationships between PM2.5 trends and population change rates in large cities were found in different areas (Figure 4). Significant negative relationships were mainly found in continents with high-incomes, while inverse, “U-type” relationships were mainly obtained in mid-income continents.
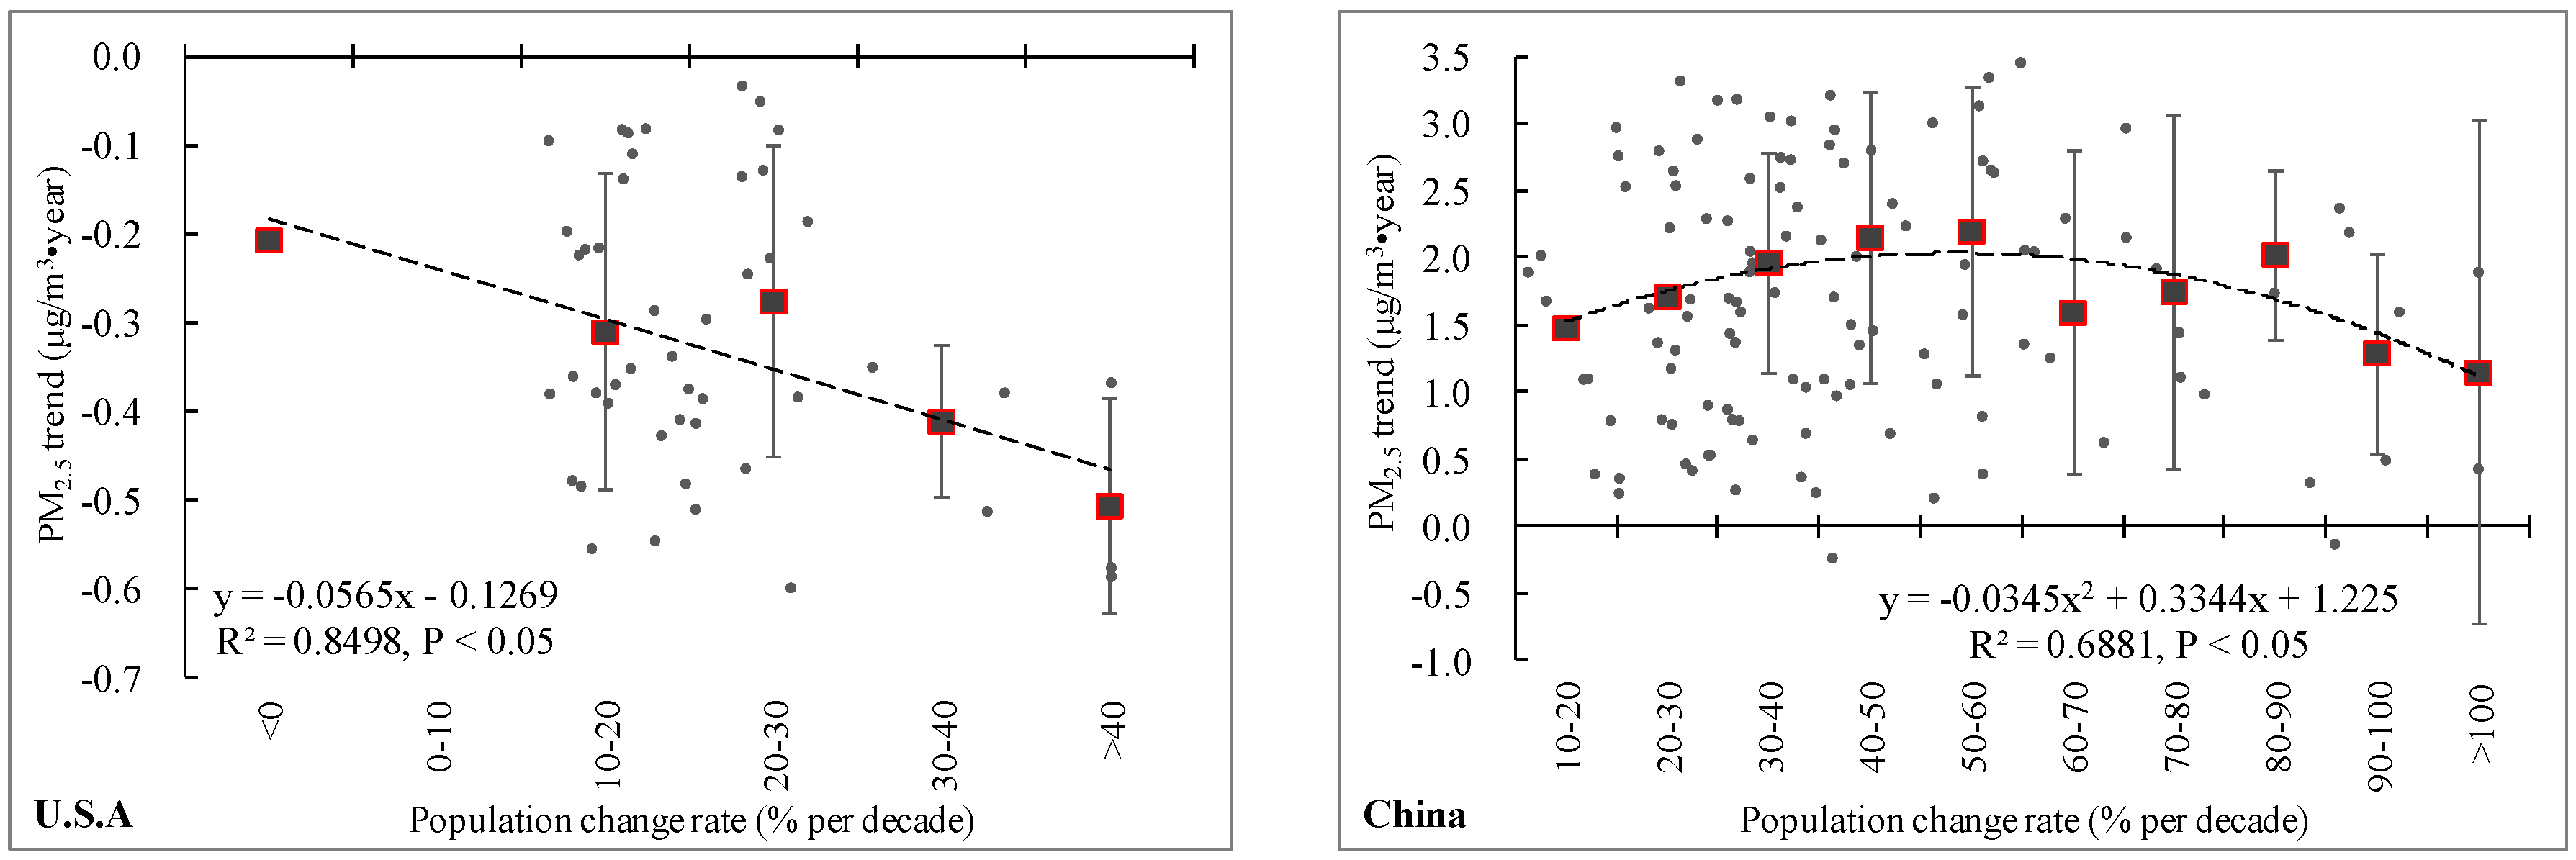
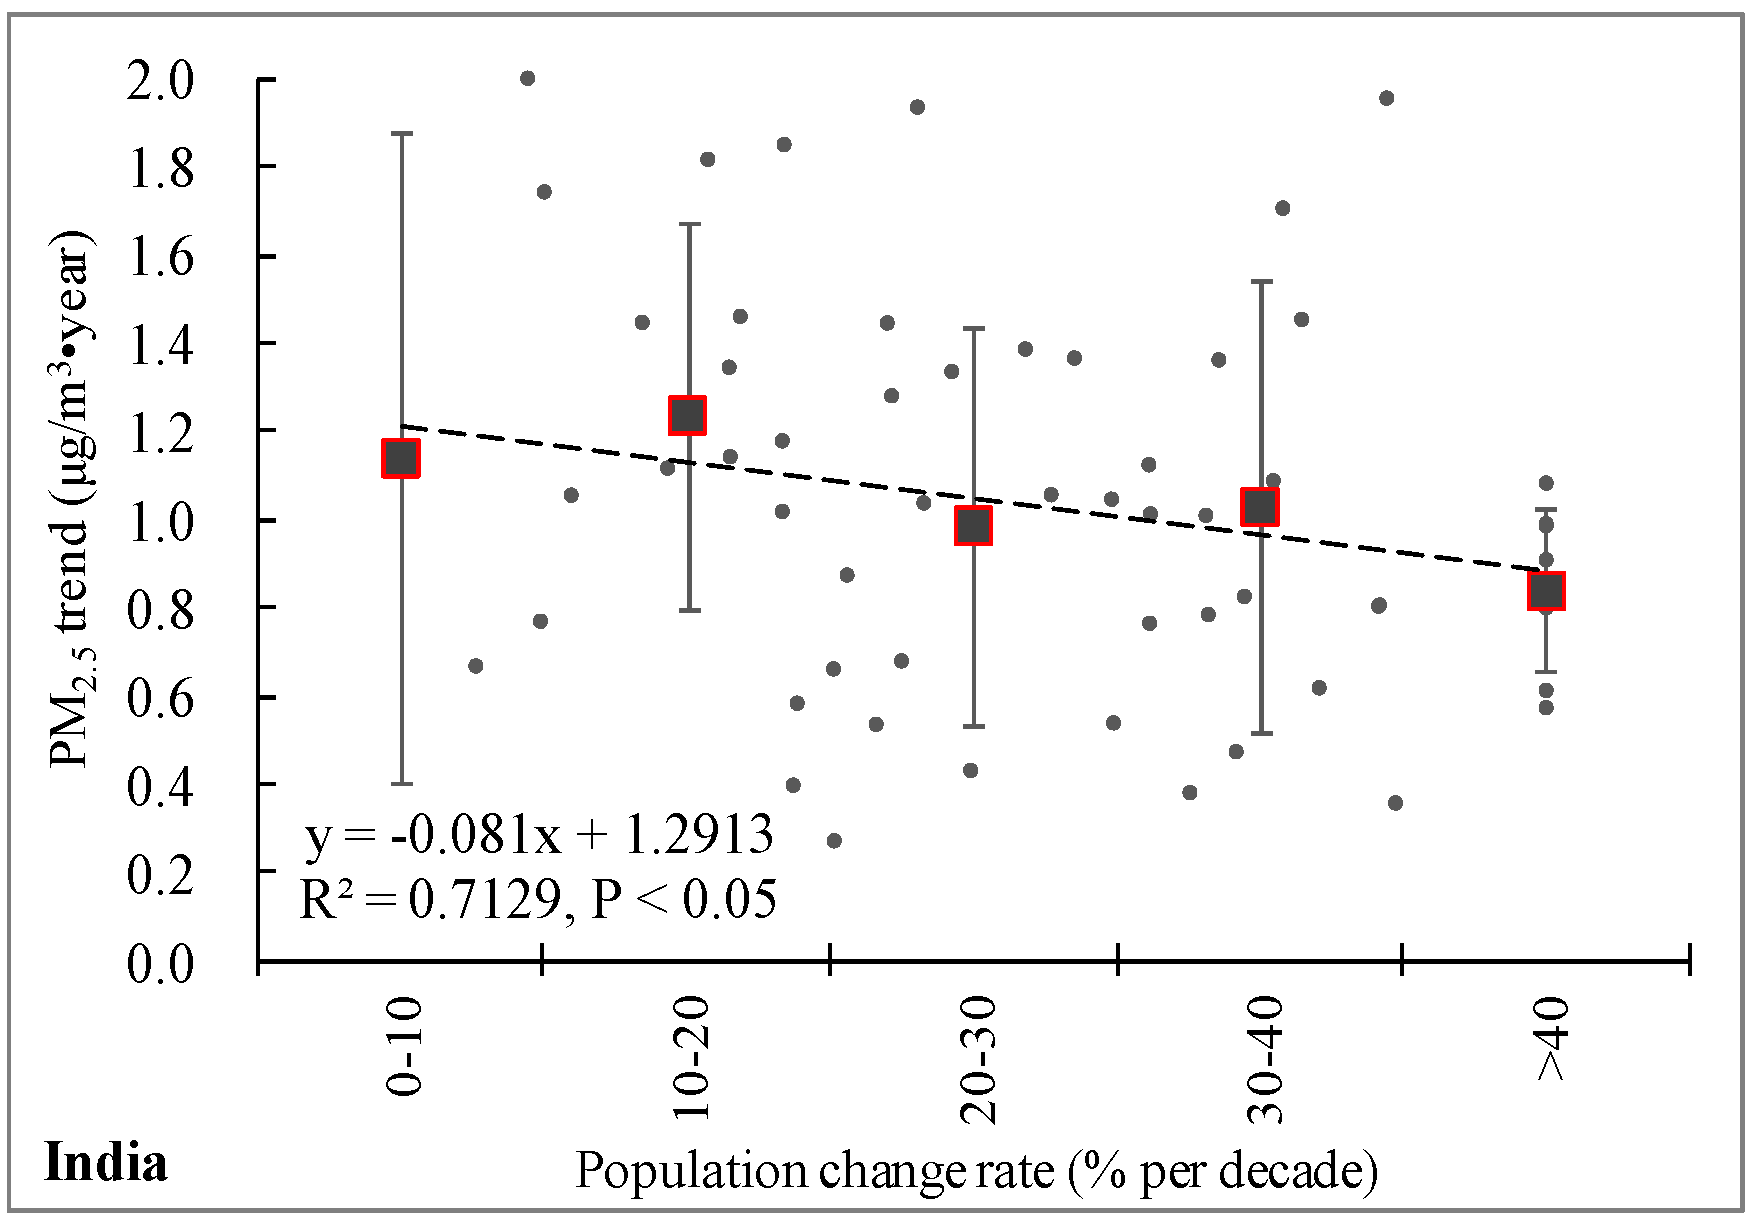
Similar to the scaling relationship among continents, the relationships were also different between typical low- and mid-income countries (e.g., China and India) and high-income countries (e.g., U.S) (Figure 5). Significant negative relationships were mainly found in countries with high-incomes, while “U-type” relationships were mainly obtained in mid-income countries.
Significant negative relationships were found between PM2.5 trends and population change rates in large cities in both India (R2 = 0.7129, p < 0.05) and U.S. (R2 = 0.8498, p < 0.05); however, population increases made large cities’ PM2.5 increase in India, but decrease in the U.S. China had a unique inverse “U-type” relationship between PM2.5 trends and population change rates in large cities; cities with increases in PM2.5 trends were found to have population increase rates of less than 60%, but cities with decrease of PM2.5 trends were found with population increase rates more than 60%.
These scaling relationships explain the relationship between environmental pollution and economic development. This follows the Environmental Kuznets Curve (EKC) hypothesis, which states that environmental pollution first increases and then decreases [22]. The results found in this work also follow the EKC hypothesis. For instance, in high-income continents/countries, population increased but PM2.5 concentration decreased, indicating a high level of development with consideration of both urban development and environmental improvement. In mid- and low-income continents/countries, the EKC hypothesis can also be found. For the case of China, when population change rates increased, the PM2.5 trend increased first and then decreased, indicating those cities were still before the peak points of their EKC. The large cities with larger population increase rates paid more attention to air pollution, making the PM2.5 increases smaller than the cities with lower population increase rates. This is highly attributed to the intensive environmental management in cities with rapid urbanization; some examples include Shenzhen and Guangzhou in South China, where their air pollution days and pollutants’ concentration decreased during the period.
Finally, the analysis in this work has some limitations which need to be considered in future research. The analysis in this work used a global scale dataset, which may have introduced errors into the results. First, the MODIS global map of urban extent introduces low errors for regions with low speeds of urban expansion (e.g., U.S. and Europe), but introduces considerable error in regions with high speeds of urban expansion (e.g., China). We therefore suggest to adopt new urban extent results, which could represent changes from 2000 to 2010 in the future, when such datasets are available. Furthermore, we are currently using the PM2.5 concentration at the near-surface total amount, which could be impacted by both nature (e.g., temperature, wind, precipitation, and humidity [23,24,25]) and anthropogenic emissions, which could be the direct emission of PM2.5 and secondary PM2.5 by emission of SO2, NO2, etc. (e.g., Reference [26]). Further detailed analysis in certain areas should also take into concern the source and meteorological factors beyond population amounts.
4. Conclusions
Urban air quality changes and their relationships with urbanization provide an important insight for understanding the urban development strategies of large cities in different countries. Moreover, such information would suggest that low- and mid-income countries with rapid urbanization should adopt better strategies to counteract increasing urban air pollution. Thus, we analyzed the scaling relationship between changes in urban population and PM2.5 concentrations. Our conclusions are:
- (1)
- Trends in PM2.5 varied among global regions. Central and Eastern U.S. were observed to have significant negative trends. The northeast, east, south, and southeast of China, India, and the Arabian Peninsula were found to have significant positive trends.
- (2)
- The contribution of population to PM2.5 changes were greatly varied among continents, and between high-income and low- and mid-income countries. Except for large cities in Asia, which had a 4.12 ± 4.27 μg/m3·year per million population increase, all large cities on the rest of the continents were found with contributions less than or near to 4.12 ± 4.27 μg/m3·year per million population. While, large cities in the U.S. had a negative contribution to PM2.5 concentrations, large cities in China and India had positive contributions to PM2.5 concentrations.
- (3)
- Different global areas identified diverse relationships between PM2.5 trends and population change rates in large cities. Other than the relationships in large cities in North America and Europe, a significant inverse “U-type” relationship (p < 0.05) was found between PM2.5 trends and population change rates in large cities in Asia. Particularly was China’s unique inverse “U-type” relationship between PM2.5 trends and population change rates in large cities. Cities with increasing PM2.5 trends were observed to have population increase rates of less than 60%, but cities with decreasing PM2.5 trends were observed to have population increase rates of more than 60%.
Supplementary Materials
The following are available online at https://www.mdpi.com/2071-1050/10/6/1696/s1, Figure S1: title, Table S1: title, Video S1: title.
Author Contributions
L.H. review the literature, designed the research, performed the research, analyzed the data, and wrote the paper; W.Z. review the literaure, analyzed the data, wrote and revised the paper; W.L. wrote and revised the paper.
Acknowledgments
This research was supported by the National Natural Science Foundation of China (41590841, and 41771201). In addition, the research received financial support from the National Key Research and Development Plan of China (Grant No. 2016YFC0503004); and the Key Research Project of Frontier Science of the Chinese Academy of Sciences (Grant No. QYZDB-SSW-DQC034-2).
Conflicts of Interest
The authors declare no conflict of interest. The founding sponsors had no role in the design of the study; in the collection, analyses, or interpretation of data; in the writing of the manuscript, and in the decision to publish the results.
References
- Population Division, Department of Economic and Social Affairs, United Nations. World Urbanization Prospects: The 2011 Revision; Population Division; Department of Economic and Social Affairs, United Nations: New York, NY, USA, 2012. [Google Scholar]
- Peng, J.; Shen, H.; Wu, W.; Liu, Y.; Wang, Y. Net primary productivity (NPP) dynamics and associated urbanization driving forces in metropolitan areas: A case study in Beijing City, China. Landsc. Ecol. 2016, 31, 1077–1092. [Google Scholar] [CrossRef]
- OECD. OECD Environmental Outlook to 2050: The Consequences of Inaction; OECD Publishing: Paris, France, 2012. [Google Scholar]
- Han, L.; Zhou, W.; Li, W. An optimum city size? The scaling relationship for urban population and fine particulate (PM2.5) concentration. Environ. Pollut. 2016, 208, 96–101. [Google Scholar] [CrossRef] [PubMed]
- Lamsal, L.; Martin, R.; Parrish, D.; Krotkov, N. Scaling Relationship for NO2 pollution and urban population size: A satellite perspective. Environ. Sci. Technol. 2013, 47, 7855–7861. [Google Scholar] [CrossRef] [PubMed]
- Lim, S.S.; Vos, T.; Flaxman, A.D.; Danaei, G.; Shibuya, K.; Adair-Rohani, H.; AlMazroa, M.A.; Amann, M.; Anderson, H.R.; Andrews, K.G.; et al. A comparative risk assessment of burden of disease and injury attributable to 67 risk factors and risk factor clusters in 21 regions, 1990–2010: A systematic analysis for the Global Burden of Disease Study 2010. Lancet 2012, 380, 2224–2260. [Google Scholar] [CrossRef]
- Han, L.; Zhou, W.; Li, W.; Li, L. Impact of urbanization level on urban air quality: A case of fine particles (PM2.5) in Chinese cities. Environ. Pollut. 2014, 194, 163–170. [Google Scholar] [CrossRef] [PubMed]
- Gupta, S.; Pebesma, E.; Mateu, J.; Degbelo, A. Air quality monitoring network design optimization for robust land use regression models. Sustainability 2018, 10, 1–27. [Google Scholar] [CrossRef]
- Buke, T.; Kone, A. Assessing air quality in Tukey: A proposed, air quality index. Sustainability 2016, 8, 73. [Google Scholar] [CrossRef]
- Wang, Z.; Ke, L.; Cui, X.; Yin, Q.; Liao, L.; Gao, L.; Wang, Z. Monitoring environmental quality by sniffing social media. Sustainability 2017, 9, 85. [Google Scholar] [CrossRef]
- Van Donkelaar, A.; Martin, R.V.; Brauer, M.; Kahn, R.; Levy, R.; Verduzco, C.; Villeneuve, P.J. Global estimates of ambient fine particulate matter concentrations from satellite-based aerosol optical depth: Development and application. Environ. Health Perspect. 2010, 118, 847–855. [Google Scholar] [CrossRef] [PubMed]
- Van Donkelaar, A.; Martin, R.; Brauer, M.; Boys, B. Use of satellite observation for long-term exposure assessment of global concentration of fine particulate matter. Environ. Health Perspect. 2015, 123, 135–143. [Google Scholar] [CrossRef] [PubMed]
- Boys, B.L.; Martin, R.V.; van Donkelaar, A.; MacDonell, R.; Hsu, N.C.; Cooper, M.J.; Yantosca, R.M.; Lu, Z.; Streets, D.G.; Zhang, Q.; et al. Fifteen-year global time series of satellite-derived fine particulate matter. Environ. Sci. Technol. 2014, 48, 11109–11118. [Google Scholar] [CrossRef] [PubMed]
- Schneider, A.; Friedl, M.; Potere, D. A new map of global urban extent from MODIS satellite data. Environ. Res. Lett. 2009, 4, 044003. [Google Scholar] [CrossRef]
- Schneider, A.; Friedl, M.; Potere, D. Monitoring urban areas globally using MODIS 500m data: New methods and datasets based on ‘urban ecoregions’. Remote Sens. Environ. 2010, 114, 1733–1746. [Google Scholar] [CrossRef]
- Han, L.; Zhou, W.; Li, W. City as a major source area of PM2.5 in China. Environ. Pollut. 2015, 206, 183–187. [Google Scholar] [CrossRef] [PubMed]
- Peng, J.; Chen, S.; Lv, H.; Liu, Y.; Wu, J. Spatiotemporal pattern of remotely sensed PM2.5 concentration in China from 1999 to 2011. Remote Sens. Environ. 2016, 174, 109–121. [Google Scholar] [CrossRef]
- Han, L.; Zhou, W.; Li, W. Increasing impact of urban PM2.5 in China. Sci. Rep. 2015, 5, 12467. [Google Scholar] [CrossRef] [PubMed]
- Lin, C.; Yang, K.; Huang, J.; Tang, W.; Qin, J.; Niu, X.; Chen, Y.; Chen, D.; Lu, N.; Fu, R. Impact of wind stilling on solar radiation variability in China. Sci. Rep. 2015, 5, 15135. [Google Scholar] [CrossRef] [PubMed]
- Robichaud, A.; Ménard, R. Multi-year objective analyses of warm season ground-level ozone and PM2.5 over North America using real-time observations and Canadian operational air quality models. Atmos. Chem. Phys. 2014, 14, 1769–1800. [Google Scholar] [CrossRef]
- Castellanos, P.; Folkert Boersma, F. Reductions in nitrogen oxides over Europe driven by evironmental policy and economic recession. Sci. Rep. 2012, 2, 265. [Google Scholar] [CrossRef] [PubMed]
- Stern, D.; Common, M.; Barbier, E. Economic growth and environmental degradation: The envrionmental Kuznets curve and sustainable development. World Dev. 1996, 24, 1151–1160. [Google Scholar] [CrossRef]
- Jacob, D.; Winner, D. Effect of climate change on air quality. Atmos. Environ. 2009, 43, 51–63. [Google Scholar] [CrossRef]
- Tai, A.; Mickley, L.; Jacob, D. Correlations between fine particulate matter (PM2.5) and meteorological variables in the United States: Implications for the sensitivity of PM2.5 to climate change. Atmos. Environ. 2010, 44, 3976–3984. [Google Scholar] [CrossRef]
- Jeong, J.; Park, R. Effect of the meteorological variability on regional air quality in East Asia. Atmos. Environ. 2013, 69, 46–55. [Google Scholar] [CrossRef]
- Huang, R.J.; Zhang, Y.; Bozzetti, C.; Ho, K.F.; Cao, J.J.; Han, Y.; Daellenbach, K.R.; Slowik, J.G.; Platt, S.M.; Canonaco, F.; et al. High secondary aerosol contribution to particulate pollution during haze events in China. Nature 2014, 514, 218–222. [Google Scholar] [CrossRef] [PubMed] [Green Version]
Figure 1.
Global PM2.5 trends from 1999–2011 in large cities.

Figure 2.
Portion of large cities in different PM2.5 trend groups at continental and typical country scales.
Figure 2.
Portion of large cities in different PM2.5 trend groups at continental and typical country scales.

Figure 3.
PM2.5 trends per capita in large cities in different countries and continents.

Figure 4.
Relationship between PM2.5 trends (Y-axis; μg/m3·year) and population change rates (X-axis; % per decade) in large cities on different continents. The bars in each figures indicate the standard deviations of each group. Significant negative relationships (R2 = 0.9195, p < 0.05) were obtained between PM2.5 trends and population change rates in large cities of North America. However, significant positive relationships (R2 = 0.9161, p < 0.05) were obtained between PM2.5 trends and population change rates in large cities of Europe. Moreover, a significant inverse “U-type” relationship (R2 = 0.8065, p < 0.05) was found between PM2.5 trends and population change rates in large cities of Asia. However, no significant relationships were found between PM2.5 trends and population change rates in large cities of Africa and Latin America.


Figure 5.
Relationship between PM2.5 trends (Y-axis; μg/m3·year) and population change rates (X-axis; % per decade) in large cities of typical high-income and low- and mid-income countries. The bars in each figures indicate the standard deviations of each group.
Figure 5.
Relationship between PM2.5 trends (Y-axis; μg/m3·year) and population change rates (X-axis; % per decade) in large cities of typical high-income and low- and mid-income countries. The bars in each figures indicate the standard deviations of each group.


© 2018 by the authors. Licensee MDPI, Basel, Switzerland. This article is an open access article distributed under the terms and conditions of the Creative Commons Attribution (CC BY) license (http://creativecommons.org/licenses/by/4.0/).
Share and Cite
MDPI and ACS Style
Han, L.; Zhou, W.; Li, W. Growing Urbanization and the Impact on Fine Particulate Matter (PM2.5) Dynamics. Sustainability 2018, 10, 1696. https://doi.org/10.3390/su10061696
AMA Style
Han L, Zhou W, Li W. Growing Urbanization and the Impact on Fine Particulate Matter (PM2.5) Dynamics. Sustainability. 2018; 10(6):1696. https://doi.org/10.3390/su10061696
Chicago/Turabian StyleHan, Lijian, Weiqi Zhou, and Weifeng Li. 2018. "Growing Urbanization and the Impact on Fine Particulate Matter (PM2.5) Dynamics" Sustainability 10, no. 6: 1696. https://doi.org/10.3390/su10061696
Note that from the first issue of 2016, this journal uses article numbers instead of page numbers. See further details here.