Effects of Urban Growth on Architectural Heritage: The Case of Buddhist Monasteries in the Qinghai-Tibet Plateau

1
School of Architecture, Southeast University, Nanjing 210096, China
2
Key Laboratory of Urban and Architectural Heritage Conservation (Southeast University), Ministry of Education, Nanjing 210096, China
3
School of Architecture, Nanjing Tech University, Nanjing 211800, China
*
Author to whom correspondence should be addressed.
Sustainability 2018, 10(5), 1593; https://doi.org/10.3390/su10051593
Submission received: 9 April 2018
/
Revised: 4 May 2018
/
Accepted: 11 May 2018
/
Published: 16 May 2018
(This article belongs to the Special Issue Cultural Heritage Conservation and Sustainability)
Abstract
:Urbanization is unavoidable on the Qinghai-Tibet Plateau, and it directly influences the region’s architectural heritage. This study aims to evaluate the changes in urbanization around 152 Buddhist monasteries (3 km × 3 km) from 1993 to 2013 located in the Qinghai-Tibet Plateau. To evaluate the changes, we adopt both nighttime light data and data from the Geographic Information System, which were verified by the spatial relationship between urban areas of Lhasa and monasteries on a meso-scale and the environmental changes around monasteries by visual interpretation on a micro-scale in the same phase. The results show that the level of urbanization around 43 monasteries has increased between 1993 and 2013, and the areas of significant influence from urban growth have expanded from Lhasa between 1993 and 2003 to the Yarlung Tsangpo River, Nyangqu, and Lhasa River regions, as well as to the surrounding areas of Xining, and Tibetan areas in Sichuan between 2003 and 2013. This study explores a method of monitoring the architectural heritage of the Qinghai-Tibet Plateau using “remote sensing big data”, which can provide data support for policy formulation, technical intervention, and targeted field investigation on architectural heritage by screening research objects.
1. Introduction
The world is experiencing the largest wave of urban growth in history. Fifty-four percent of the world’s population resided in urban areas in 2014 [1]; by 2050, 66 percent of the world’s population will reside in urban areas [2]. Consequently, the entire world is currently experiencing challenges in terms of balancing cultural heritage conservation and the requirements of urbanization. In this context, sustainable development, which is a complex, multidimensional, and evolving concept that encompasses environmental, economic, social, developmental, and cultural components, is highly valued worldwide [3,4,5]. Previously, the preservation of ecosystems, culture, nature, and the environment was considered a tool for facilitating economic growth, which was the main objective of sustainable development [6]. Today, eco-environmental, social, and cultural factors are considered important aspects of the process of sustainable development in addition to economic development [7,8], and all cultures and civilizations are believed to be crucial enablers of sustainable development [9]. Based on these perspectives, consensus has been reached among various governments and international organizations that protecting and safeguarding cultural and natural forms of heritage worldwide are important goals of sustainable development [10,11,12,13,14]. Architectural heritage as a kind of non-renewable cultural resource is a cultural advantage in promoting urban development.
At present, China has the largest urban population in the world and is one of the countries experiencing the fastest rate of urban population growth [1]. The country has experienced unprecedented urbanization during the past few decades: Its urban population rapidly increased from 173 million in 1978 to 793 million in 2016, and its built-up areas increased by 600 percent from 6720 km2 in 1981 to 38,593 km2 in 2016 [15,16]. In 2017, China’s urbanization rate was 58.5 percent [17] and by 2020, it is expected to reach 60 percent [18]. Rapid urbanization has given rise to a series of environmental and social concerns, as well as issues related to economic well-being, in China [19,20]. In some developed areas of the country, such as the Yangtze River Delta and Pearl River Delta, historic architecture is often now surrounded by new urban contexts. Although the architecture is protected, loss of context and functionality has transformed the status of these structures from symbols of living heritage to mere relics or tourist attractions that rarely enable people to imagine the traditional way of life unique to a region (Figure 1). The rapid disappearance of national or regional cultural characteristics has become a common side effect of China’s urbanization process.
Most of the architectural heritage sites of the Qinghai-Tibet Plateau (Q-T Plateau), with the exceptions of Lhasa and Xining, continued their natural evolutions uninfluenced by urbanization until the beginning of the 21st century. One reason for this is that the costs of urbanization in the Q-T Plateau are much higher than those in inland cities because of the altitude (the average altitude is more than 4 km), terrain, and climate of the region. In 2016, the total urban areas of Qinghai and Tibet were 5065 km2, which was just 1.27 percent of the nation’s total, although these two provinces comprise about 20 percent of China’s territory [15]. However, the original settings of heritage sites are likely undergoing rapid change today. During the period from 2003 to 2012, the growth rate of urbanization of the western region, where the Q-T Plateau is located, was higher than that of the eastern and central parts of China [21,22]. Since 1993, Tibet’s gross domestic product (GDP) growth rate has maintained a high increase of over 10 percent annually. In 2016, it ranked first in all provinces and autonomous regions by 11.5 percent, far exceeding the national GDP growth rate of 6.7 percent [15]. Following the completion of the Qinghai-Tibet railway in 2006, 100 million passengers were transported in the first 10 years, and the railway promoted enormous economic development of the Q-T Plateau [23].
The theories and doctrinal texts that emerged during the previous decades reflect how the evolving concept of cultural heritage conservation echoes the global trend of urbanization [24,25,26]. In 1964, the Venice Charter, or International Charter for the Conservation and Restoration of Monuments and Sites [27], specified internationally accepted principles of conservation based on the concept of authenticity. Accordingly, the definition of a historic monument encompassed both the specific architectural work and its urban or rural setting. Later, in 1976 and 1987, the principles that had been previously accepted were extended to include historic areas [28] and historic towns [29] as well. The Nara Document on Authenticity [30], which was published in 1994, provided a complementary perspective on authenticity from a broader scope of cultural diversity, for example, Asian heritage. In addition, the Charter on the Built Vernacular Heritage [31] discusses different aspects of built vernacular heritage and its vulnerability caused by the homogenization resulting from the global socioeconomic transformation. In 2000, several International Council on Monuments and Sites charters and declarations were dedicated to the safeguarding of cultural heritage sites based on various aspects, including the management of tourism, role of public communication and education, maintenance of authenticity during urban evolution, and links with intangible elements [32,33,34,35]. Recently, the Valletta Principles [36] and the historic urban landscape approach [37,38] specified the latest global agreement regarding heritage conservation by setting a positive answering approach to monitor continual change and urban growth. According to the Valletta Principles, a change to the natural and built environment is not automatically considered a threat; when appropriately managed, such a change can be developed as an opportunity to improve the architectural and cultural quality of historic towns.
These achievements, which are the results of worldwide consensus, provide useful guidance for maintaining sustainable relations between cultural heritage conservation and urban development. However, in-depth research is required to examine whether these constructs are applicable to the particularities of the Q-T Plateau. The historic urban landscape approach and methods of tourism management can be applied to Lhasa, the capital of Tibet, whose urban layers were formed during different periods, urban growth is relatively stable, and the largest threat to heritage conservation is the increase in tourism activities. Since the beginning of the 21st century, the assessment by the United Nations Educational, Scientific and Cultural Organization (UNESCO) of the Historic Ensemble of the Potala Palace (including the Potala Palace, Jokhang Temple Monastery, and Norbulingka) in recent years demonstrated that the pressures of urban development and growth in tourism-related activities may be one of the factors endangering the heritage sites [39]. The disclosure of this information is largely due to UNESCO’s demand for transparency in the information provided on World Cultural Heritage sites. However, most of the heritage sites other than the Historic Ensemble in the Q-T plateau are vernacular heritage sites, that is, they comprise communities housing themselves in traditional and natural ways. Today, similarly to the condition in the past, the authenticity of these architectural structure is not a matter of primary concern for communities. On the contrary, the impropriety of maintenance of a Buddhist monastery from the perspective of authenticity increases with its religious importance, as though the structure suffers from excessive religious devotion. As mentioned earlier, the authenticity of a monastery’s natural settings, comprising water, vegetation, and terrain, is probably much better preserved than its architecture. When an architectural structure complies with the characteristics of its environment, the structure embodies valuable information on the architectural history, archaeology, and historical geography of the region. Our ancestors ensured that their construction was compliant with the environment in the highest region on Earth; hence, safeguarding the relation between architecture and environment is undoubtedly essential and meaningful. Therefore, in such parts of the Q-T Plateau, which do not have adequate change detection or access to even basic geo-information, issues such as the number of architectural heritage sites affected by urbanization indicate irregularities in temporal evolution and spatial distribution and the architectural heritage sites that require more attention, since the sites must be accurately assessed in order to provide reliable data for policy formulation and technical interventions.
Although the architectural heritage of the Q-T Plateau draws much of its uniqueness from its relationships with the natural environment, which caused it to be known as the “Third Pole on Earth”, the existing research comes mainly from the scope of archeology and architectural history [40,41,42,43,44]. The layout, material, and construction of buildings are widely addressed; few researchers paid attention to the neighboring environment of the building. From the survey perspective, it involves both measuring technology and the drawing method [45,46]. State-of-the-art measurement technologies such as laser scanning and photogrammetry are insufficient when the targeted architectural heritage sites are large, lie close to geographical features, and are threatened by rapid urban growth. Using the computer-aided design software is not the ideal method when the measured data are much more than 2D vector lines. Such data require technologies with a large spatial scale to monitor and evaluate the architectural heritage sites of the Q-T Plateau from a macro perspective and combine monitoring results with survey data. Remote sensing data provide historical time series data and current information on urban spatial structure and city border regions. The geographic information system (GIS) is considered to be one of the most efficient tools for analyzing, mapping, and retrieving these remote sensing data, and these tools have been widely applied to mapping urban growth [47,48,49]; analyzing the impact of human activities on the climate, ecosystem, and environment of the Q-T Plateau [50,51]; cultural heritage management; and risk assessments near heritage sites [52,53,54].
This study employed a variety of satellite imagery and GIS technology to explore the method of assessing the impact of urban growth on the architectural heritage sites of the Q-T Plateau in recent years. Lhasa was selected as a case study to monitor the growth dynamics of the urbanization process around heritage sites and verify the accuracy of assessment methods. When these data are merged with other types of materials, such as historical documents, socioeconomic statistics, and architectural surveying achievements, governments can make informed decisions for urban planning and heritage preservation to realize a sustainable development strategy such as that required by the Q-T Plateau.
2. Materials and Methods
2.1. Study Site
The Q-T Plateau covers Tibet, Qinghai, Xinjiang, Sichuan, Yunnan, and Gansu. Most parts of Tibet and Qinghai are within its domain. Among the Q-T Plateau’s architectural heritage types (palace, monastery, manor, ruin, etc.), Buddhist monasteries are the most typical. Buddhism replaced Bön in the eighth century as the dominant religion of the Q-T Plateau. Buddhist monasteries are numerous and include wall paintings and sculptures, which form an integral part of the region’s architectural heritage. Many monasteries were organized into small town-like units to combine study, residence, and defense, and they continue to significantly influence their immediate areas in terms of religious rituals and public life. Because the physical organizations and social roles of these Buddhist monasteries may be influenced by urbanization and changing population characteristics, they are ideal subjects for this study’s analysis.
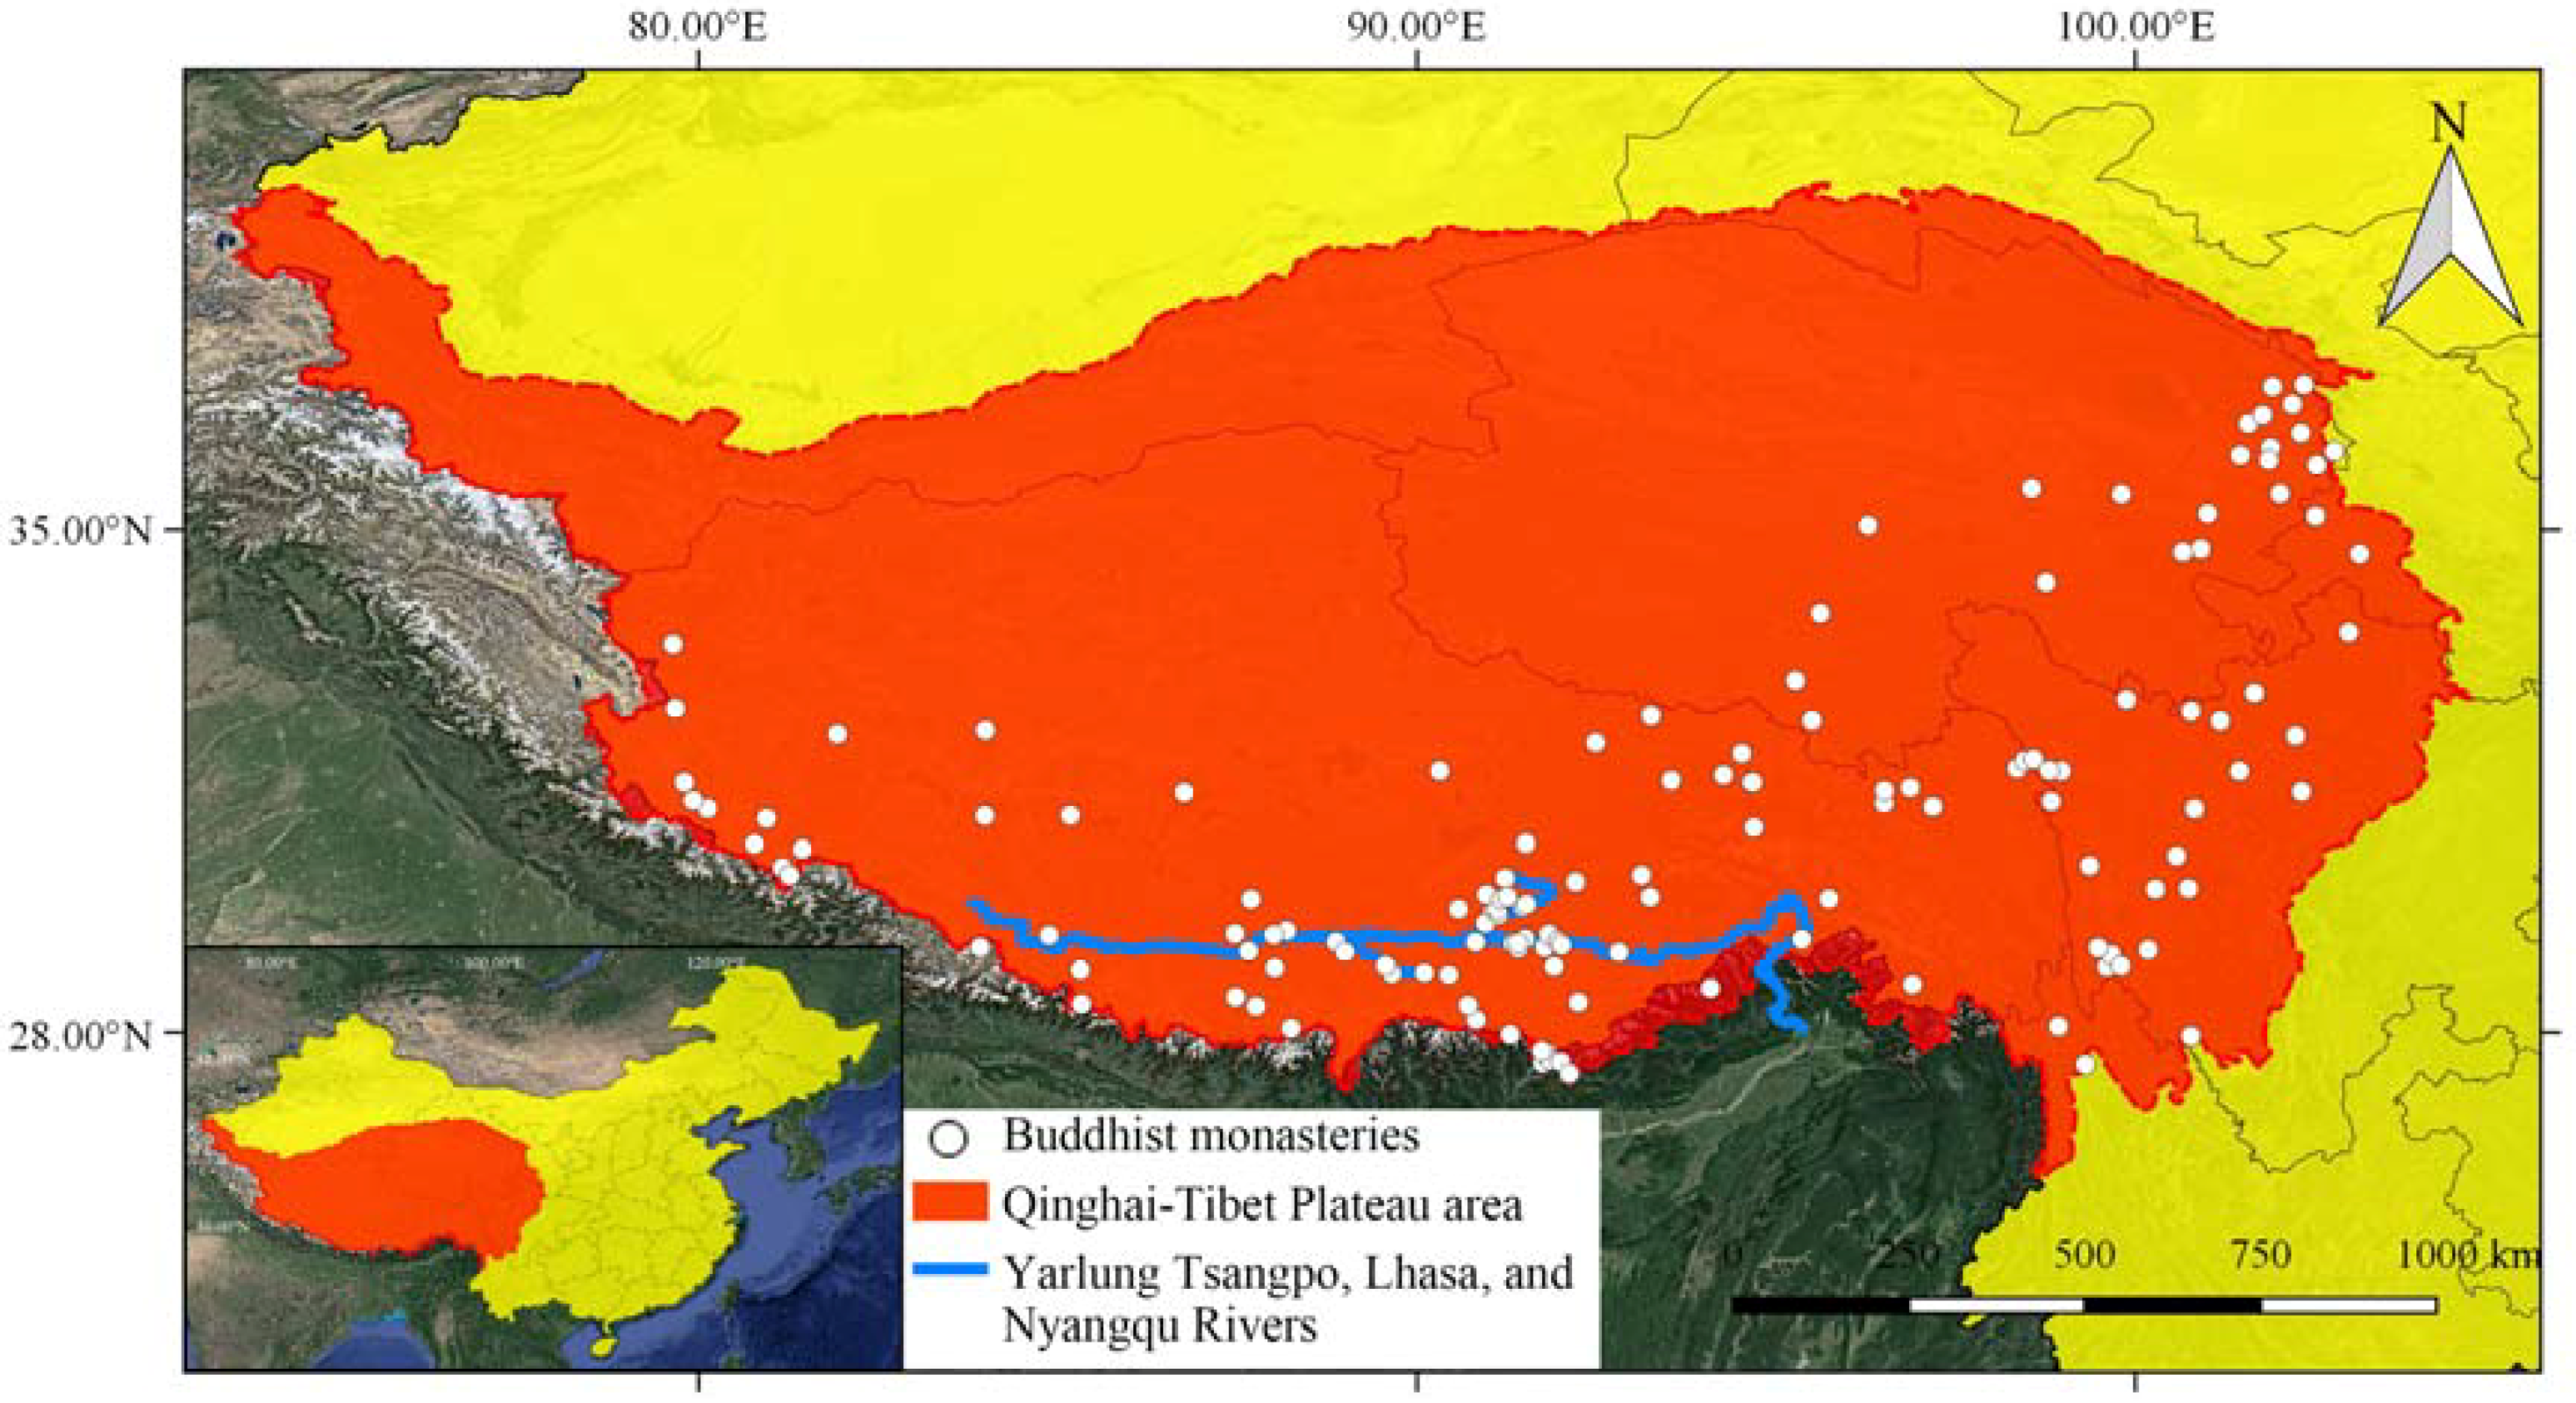
On the basis of the Law of the People’s Republic of China on the Protection of Cultural Relics, the immovable cultural relics in China are classified into three levels according to their importance: National Key Cultural Relic Protected Unit (highest level of importance), Provincial Key Cultural Relic Protected Unit (moderate level of importance), and City or Country Key Cultural Relic Protected Unit (lowest level of importance) [55]. This study analyzed 152 important Buddhist monasteries on the Q-T Plateau, including one that is World Heritage listed in the UNESCO catalogue (i.e., Jokhang Temple) [39], 56 National Key Cultural Relic Protection Units (including all Buddhist monasteries, which were National Key Cultural Relic Protection Units on the Q-T Plateau until 2013 (To date, there have been seven batches of National Key Cultural Relic Protected Units. In May 2013, the seventh batch of National Key Cultural Relic Protected Unit list was announced.)) [56], and 95 Provincial Key Cultural Relic Protection Units (not all the Buddhist monasteries of Provincial Key Cultural Relic Protection Units on the Q-T Plateau, because some Provincial Key Cultural Relic Protection Units are not published) [57]. Although the study’s objective was not to survey all monasteries on the Q-T Plateau, it was to include the most representative monasteries throughout the area in the sample to provide a balanced coverage of results on the geographical distribution of the influence of urbanization. Figure 2 depicts the distribution of the Buddhist monasteries in the study area, illustrating that such monasteries are very densely located around Xining; the Yarlung Tsangpo River; and Nyangqu River and Lhasa River regions, including Lhasa, Shigatse, and Shannan.
2.2. Data
Two types of satellite data were used in this study’s analysis: Nighttime Stable Light (NSL) imagery of Version 4 Defense Meteorological Satellite Program’s Operational Line-scan System (DMSP–OLS) Nighttime Lights Time Series (V4DNLTS) dataset and multi-temporal Landsat satellite imagery (Table 1). The V4DNLTS dataset provided by the National Oceanic and Atmospheric Administration website comprises of cloud-free annual composites made using all the archived 1-km resolution data during the period 1992–2013 [58]. This dataset included three types of data: cloud-free coverage, nighttime light data with no further filtering, and NSL data. The NSL data were in the WGS-84 coordinate system, spanning −180° to 180° in longitude and −65° to 75° in latitude. In the NSL data, the Digital Number (DN) value of each pixel was the average of the visible-band DN values of the lights of the cities, towns, and other sites with persistent lighting. The range of data values on the pixels was from 0 to 63, where a larger DN value indicated more intense light. Because NSL data include characteristics such as timelessness, economy, high time span, and space coverage and also detect low-intensity lights emitted from cities, small-scale residential sites, traffic roads, and traffic flows, it can comprehensively reflect human activity and is suitable for monitoring large-scale dynamic urban expansion [49,59,60]. Landsat satellite images were provided by the United States Geological Survey Earth Explorer [61]. The Landsat satellite data offered various bands with a diverse spectral range, which provided highly differentiated applications, such as monitoring urban growth and classifying the growth’s spatial and temporal characteristics [52,53]. Vector data on China’s municipal administrative divisions were obtained from the 1:1 Million Basic National Geographic Database of the National Catalogues Service for Geographic Information [57].
2.3. Analytical Methods
2.3.1. Analysis of the Urbanization Level in the Q-T Plateau
Although medium-resolution remote sensing images, such as Landsat images, are widely used in urban-scale land-use classifications, these images have problems such as low work efficiency and classification accuracy in the Q-T Plateau area because of the extremely low proportion of built-up areas, as well as cloud cover [49]. The NSL data of the V4DNLTS dataset not only avoid the above interference but also comprehensively reflect factors directly related to urbanization levels, such as built-up areas, industrial structures, GDP, and carbon emissions [62,63,64]. Thus, it is suitable for the purpose of this study, which is an analysis of the effect of urban growth on the architectural heritage in the entire Q-T Plateau area.
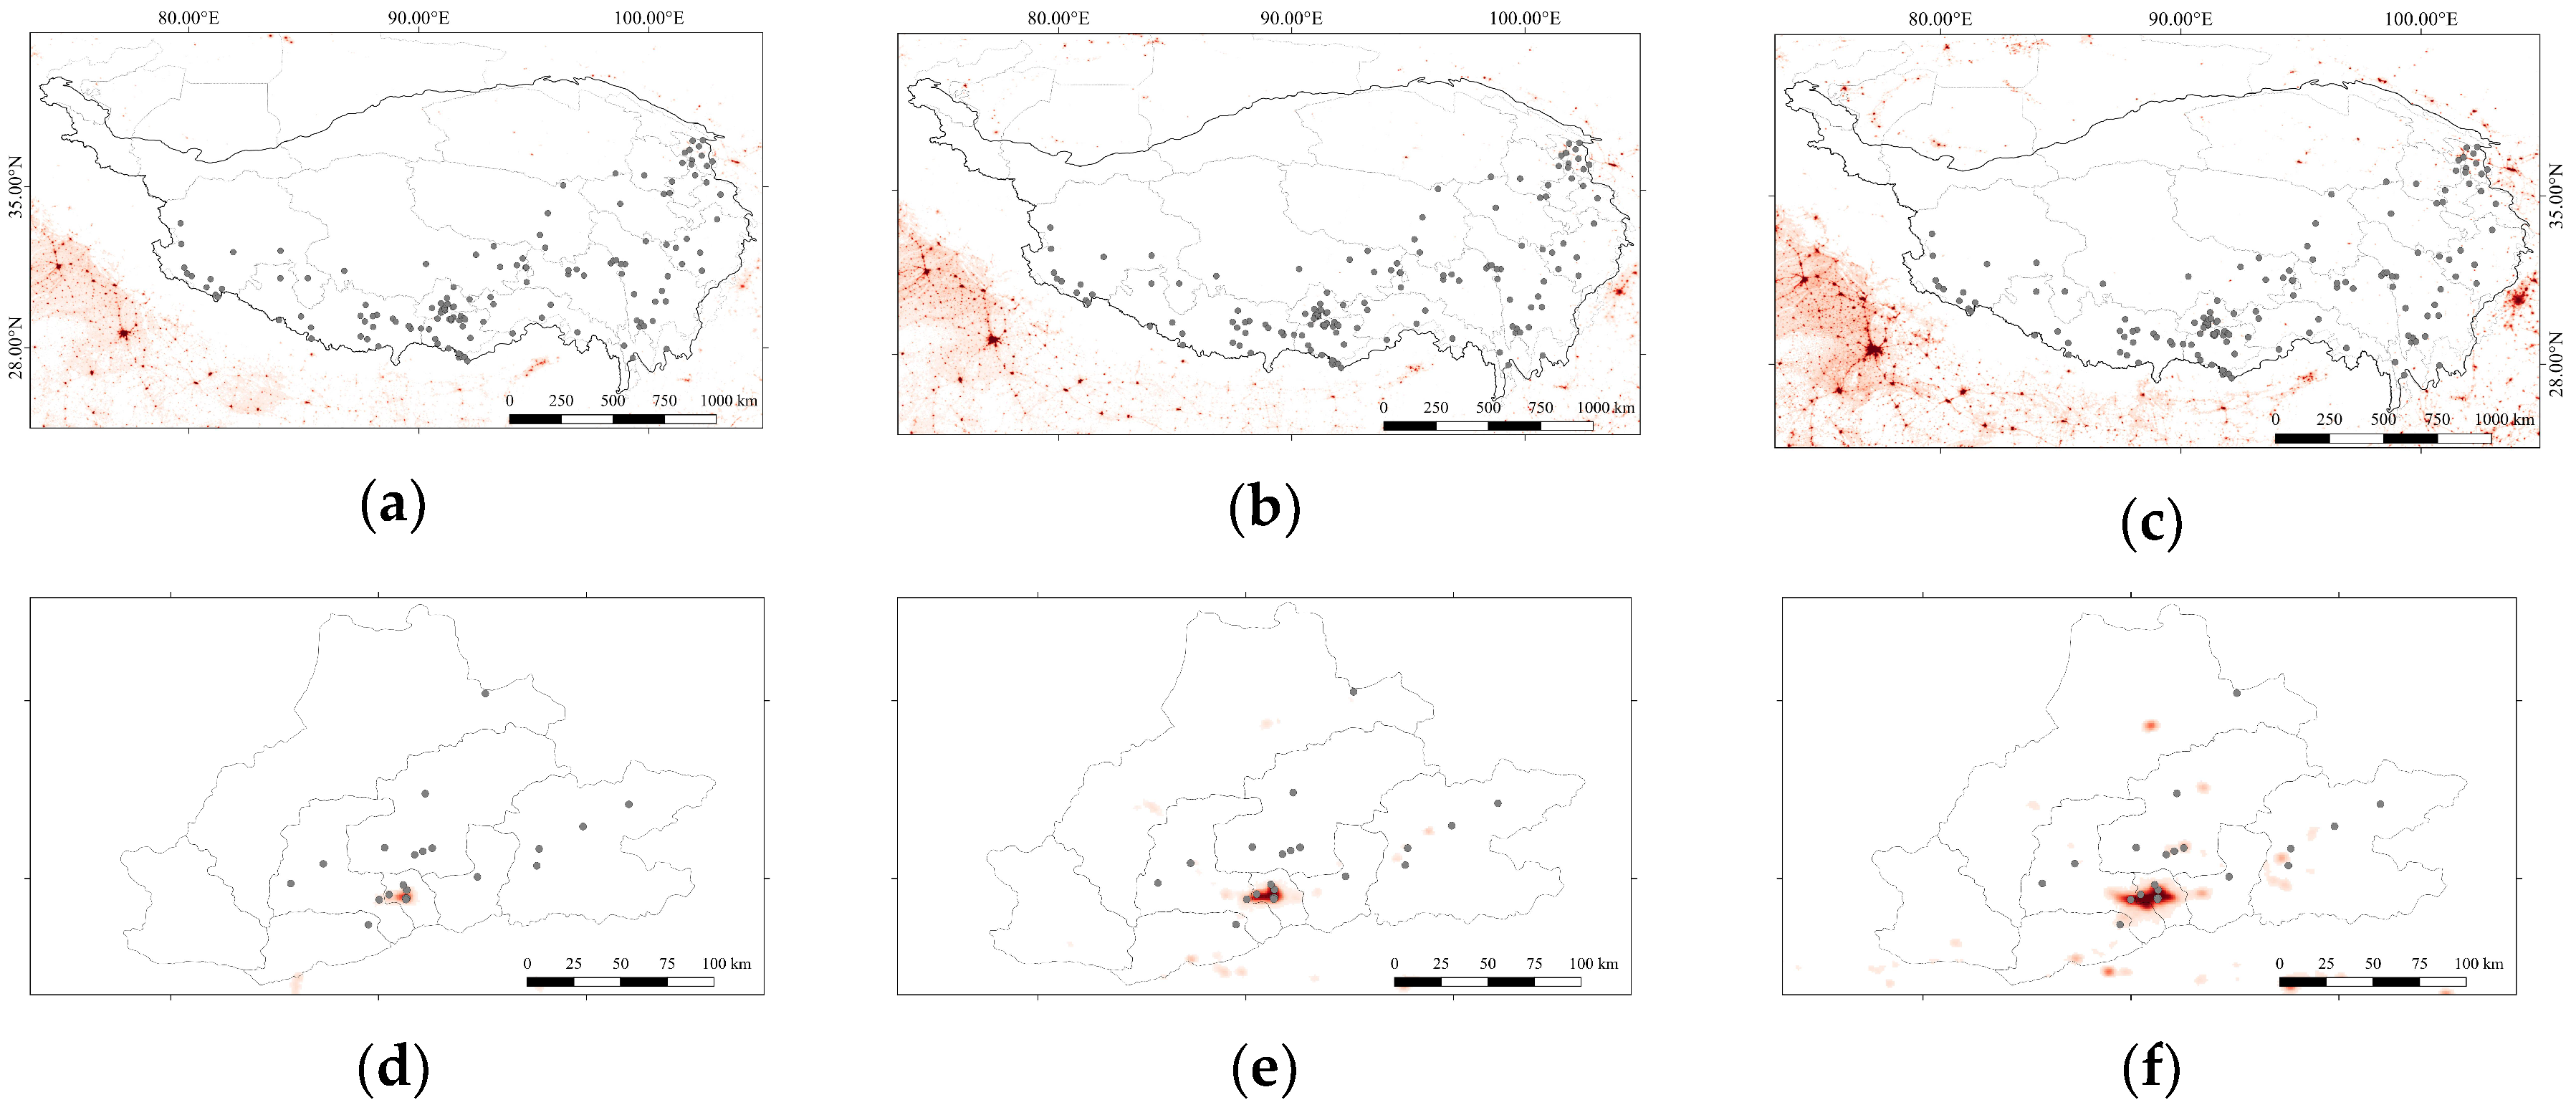
In this study, vector points for 152 Buddhist monasteries were imported into the open source GIS software Quantum GIS (QGIS) and registered geographically with 1993, 2003, and 2013 NSL data in the V4DNLTS dataset (F101993, F142003, and F182013) in the WSG84 coordinate system (Figure 3). Although the original NSL data lack onboard radiation correction and are not suitable for the quantitative comparison of continuous images for many years, this issue has little effect on the quantitative comparison over a 10-year span. Moreover, the existing correction methods are aimed at improving the overall accuracy at the global or national scale [65,66], which may cause new deviations in the analysis of the data for a part of the Q-T Plateau. Therefore, the original NSL data were used in this study, and their accuracy was verified by other methods. Because this study focuses on the environmental changes in the immediate vicinity of the monasteries and NSL data have a problem of the blooming of light pixels (i.e., the range of light pixels is larger than the actual built-up area) [67], buffer zones for monasteries were not created. Further, the bicubic spline interpolation algorithm was used to compute the DN value of the pixels in and surrounding the monasteries (3 × 3) in a weighted manner. The Un value is defined as follows:
Un = DNn/63.
In this equation, Un is the urbanization level around the monastery n. Since the range of NSL data values on the pixels was between 0 and 63, the range of Un values was theoretically between 0 and 1, with 0 representing the level of non-urbanization and 1 the maximum level of urbanization.
2.3.2. Analysis of Urban Growth in Lhasa
Lhasa was chosen to analyze the impact of urban growth upon monasteries and select samples to compare with the statistical results of the Un values on the meso-scale and micro-scale. On the meso-scale, details on the urban areas in Lhasa for 1993, 2003, and 2013 were extracted using Landsat satellite images corresponding to the NSL data, which was done by calculating the maximum likelihood of supervised classification techniques adopted by the plugin Semi-Automatic Classification (SCP) of QGIS [68]. The Kappa coefficient and overall accuracy values were used to assess the results of the land-use classification (Table 2) because the phenomena of “same spectrum/different objects”, “different spectrum/same objects”, and “mixed pixels of remote sensing images” could not avoid misclassification using the spectral values classification method [69]. Moreover, because of the unique geographical environment of the Q-T Plateau, the relationships between the physical direction of urban growth and the geo-environment were analyzed by combining the digital elevation model with hydrological information (found in the 1:1 Million National Basic Geographic Database of National Catalogues Service for Geographic Information). The urban areas in 1993, 2003, and 2013 and the geographical locations of monasteries were imported into the GIS environment, and the accuracy of Un values was assessed based on the spatial relation between the urban areas and monasteries. On the micro-scale, Corona and Google Earth satellite images were used to make visual judgments based on meso-objects. Since Google Earth’s earliest history on the Q-T Plateau appeared after 2000 and the changes around most monasteries began occurring after the start of the 21st century, the Google Earth satellite images of the Q-T Plateau obtained in 1993 were replaced with the Corona images from the 1970s.
3. Results
3.1. Urban Growth in the Q-T Plateau
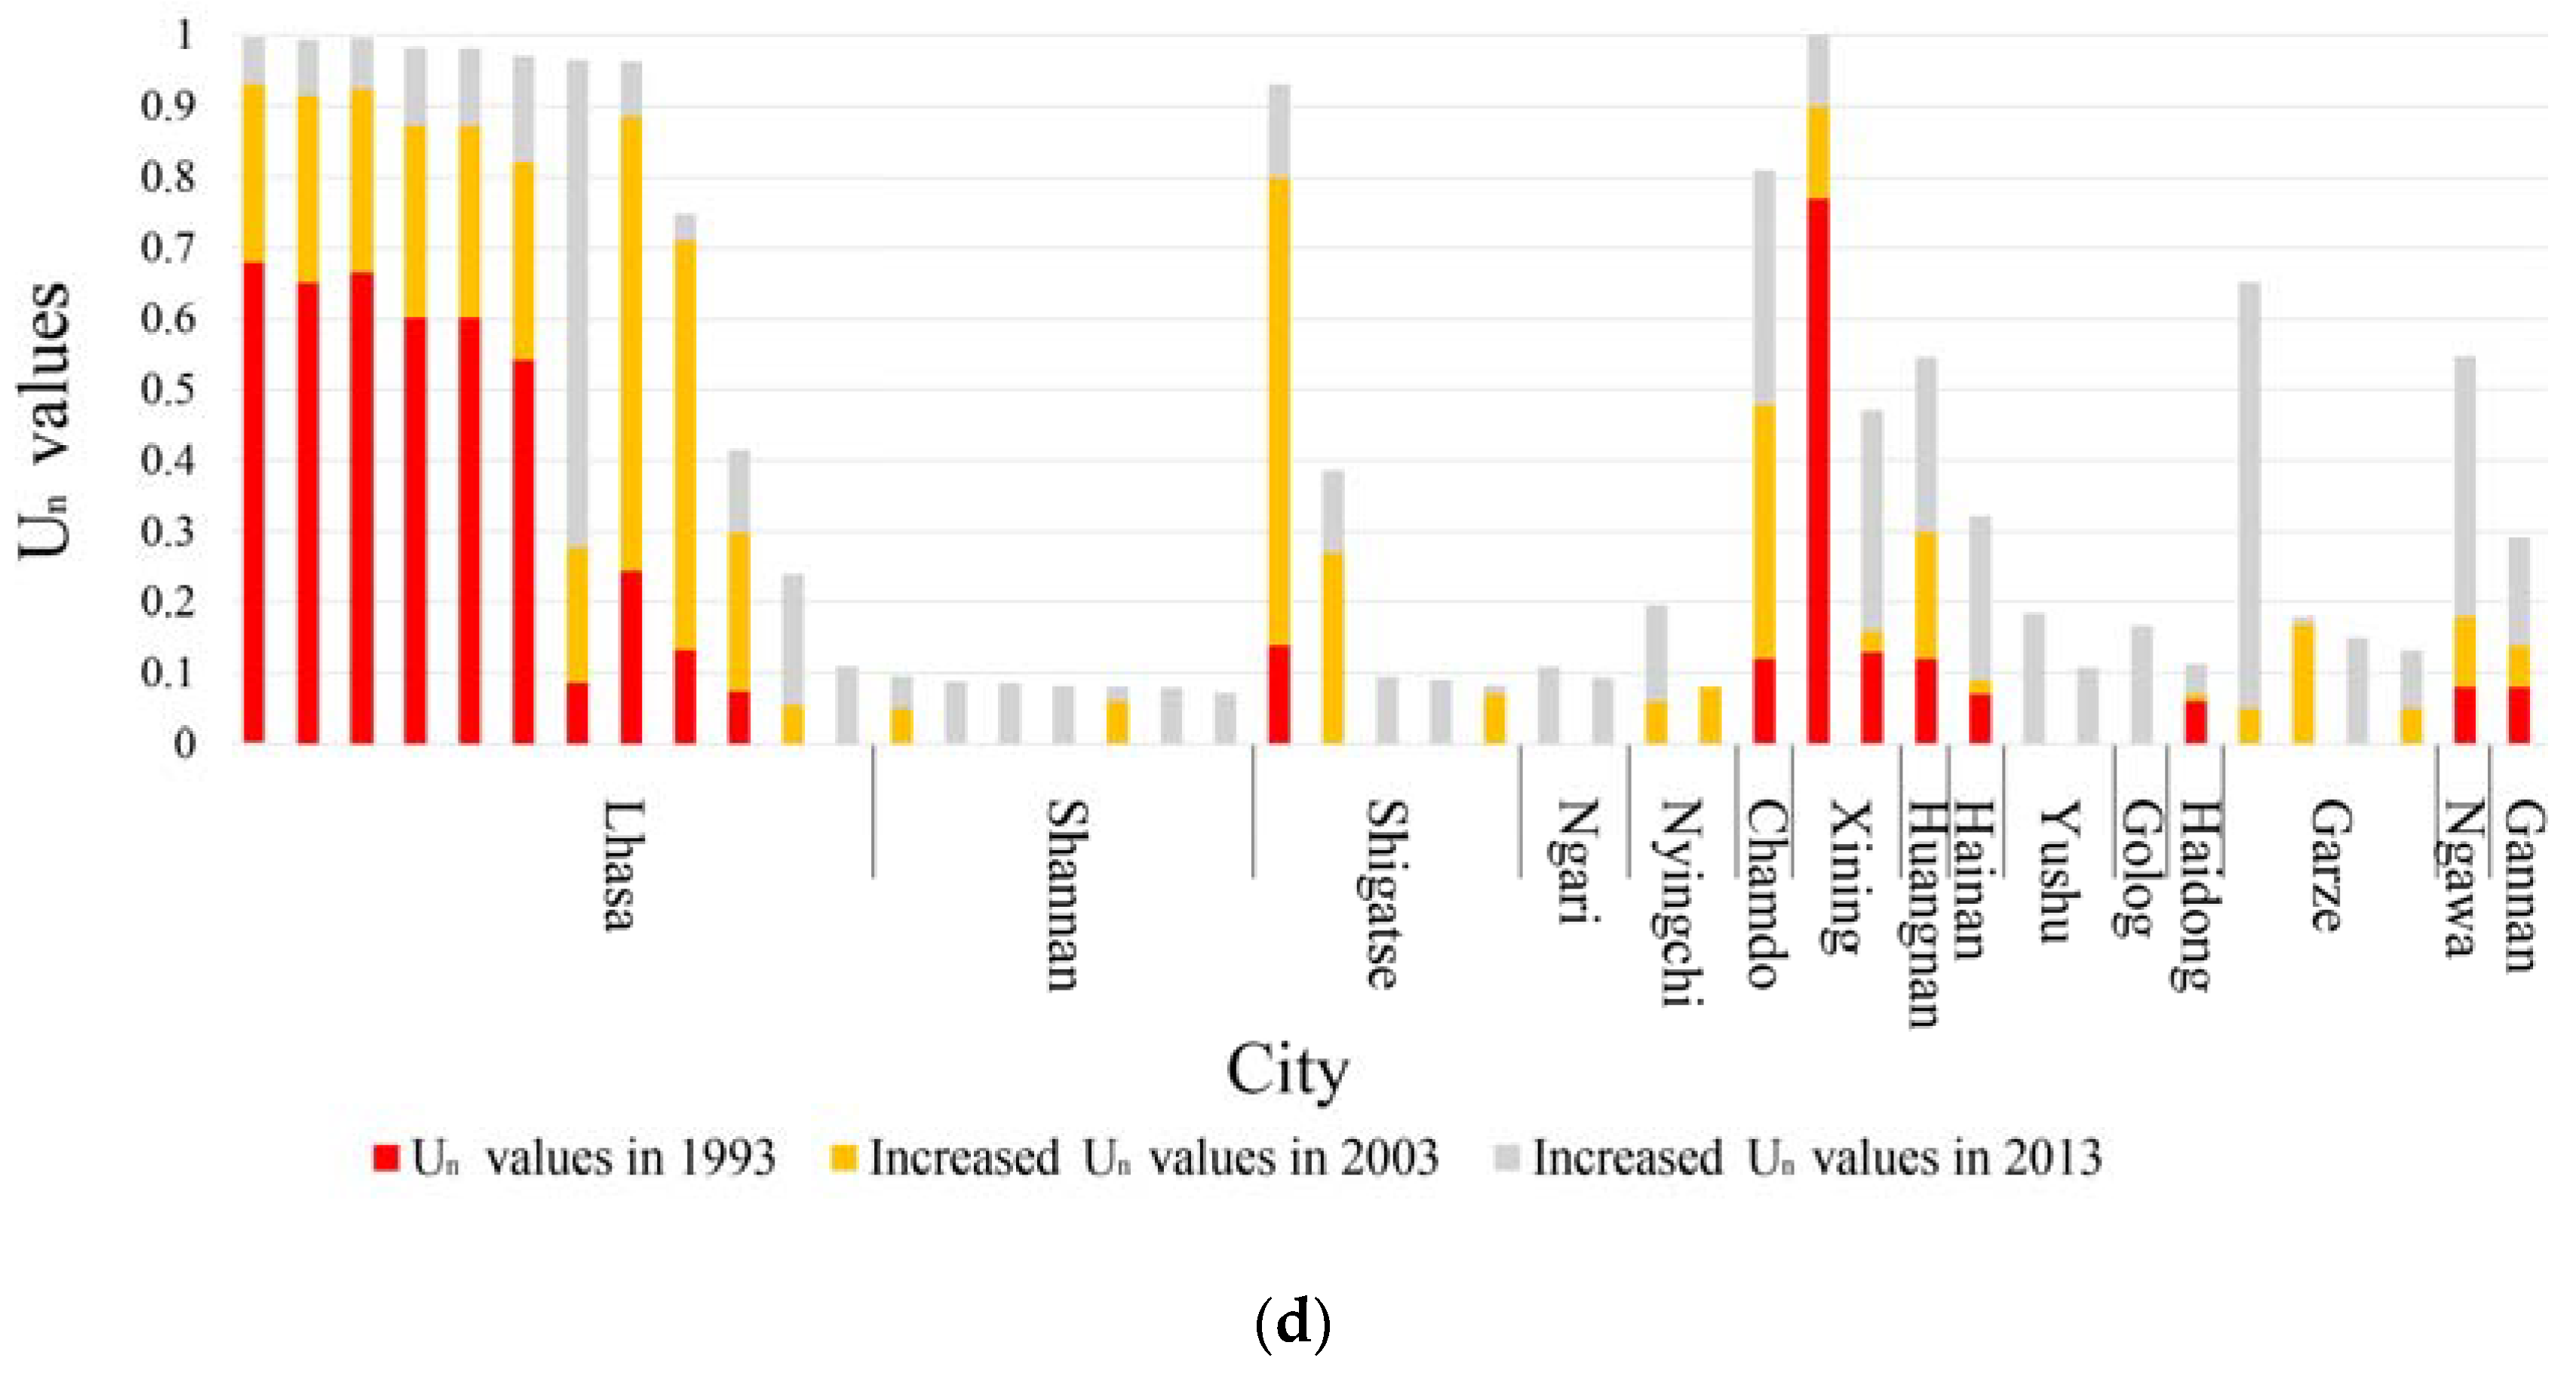
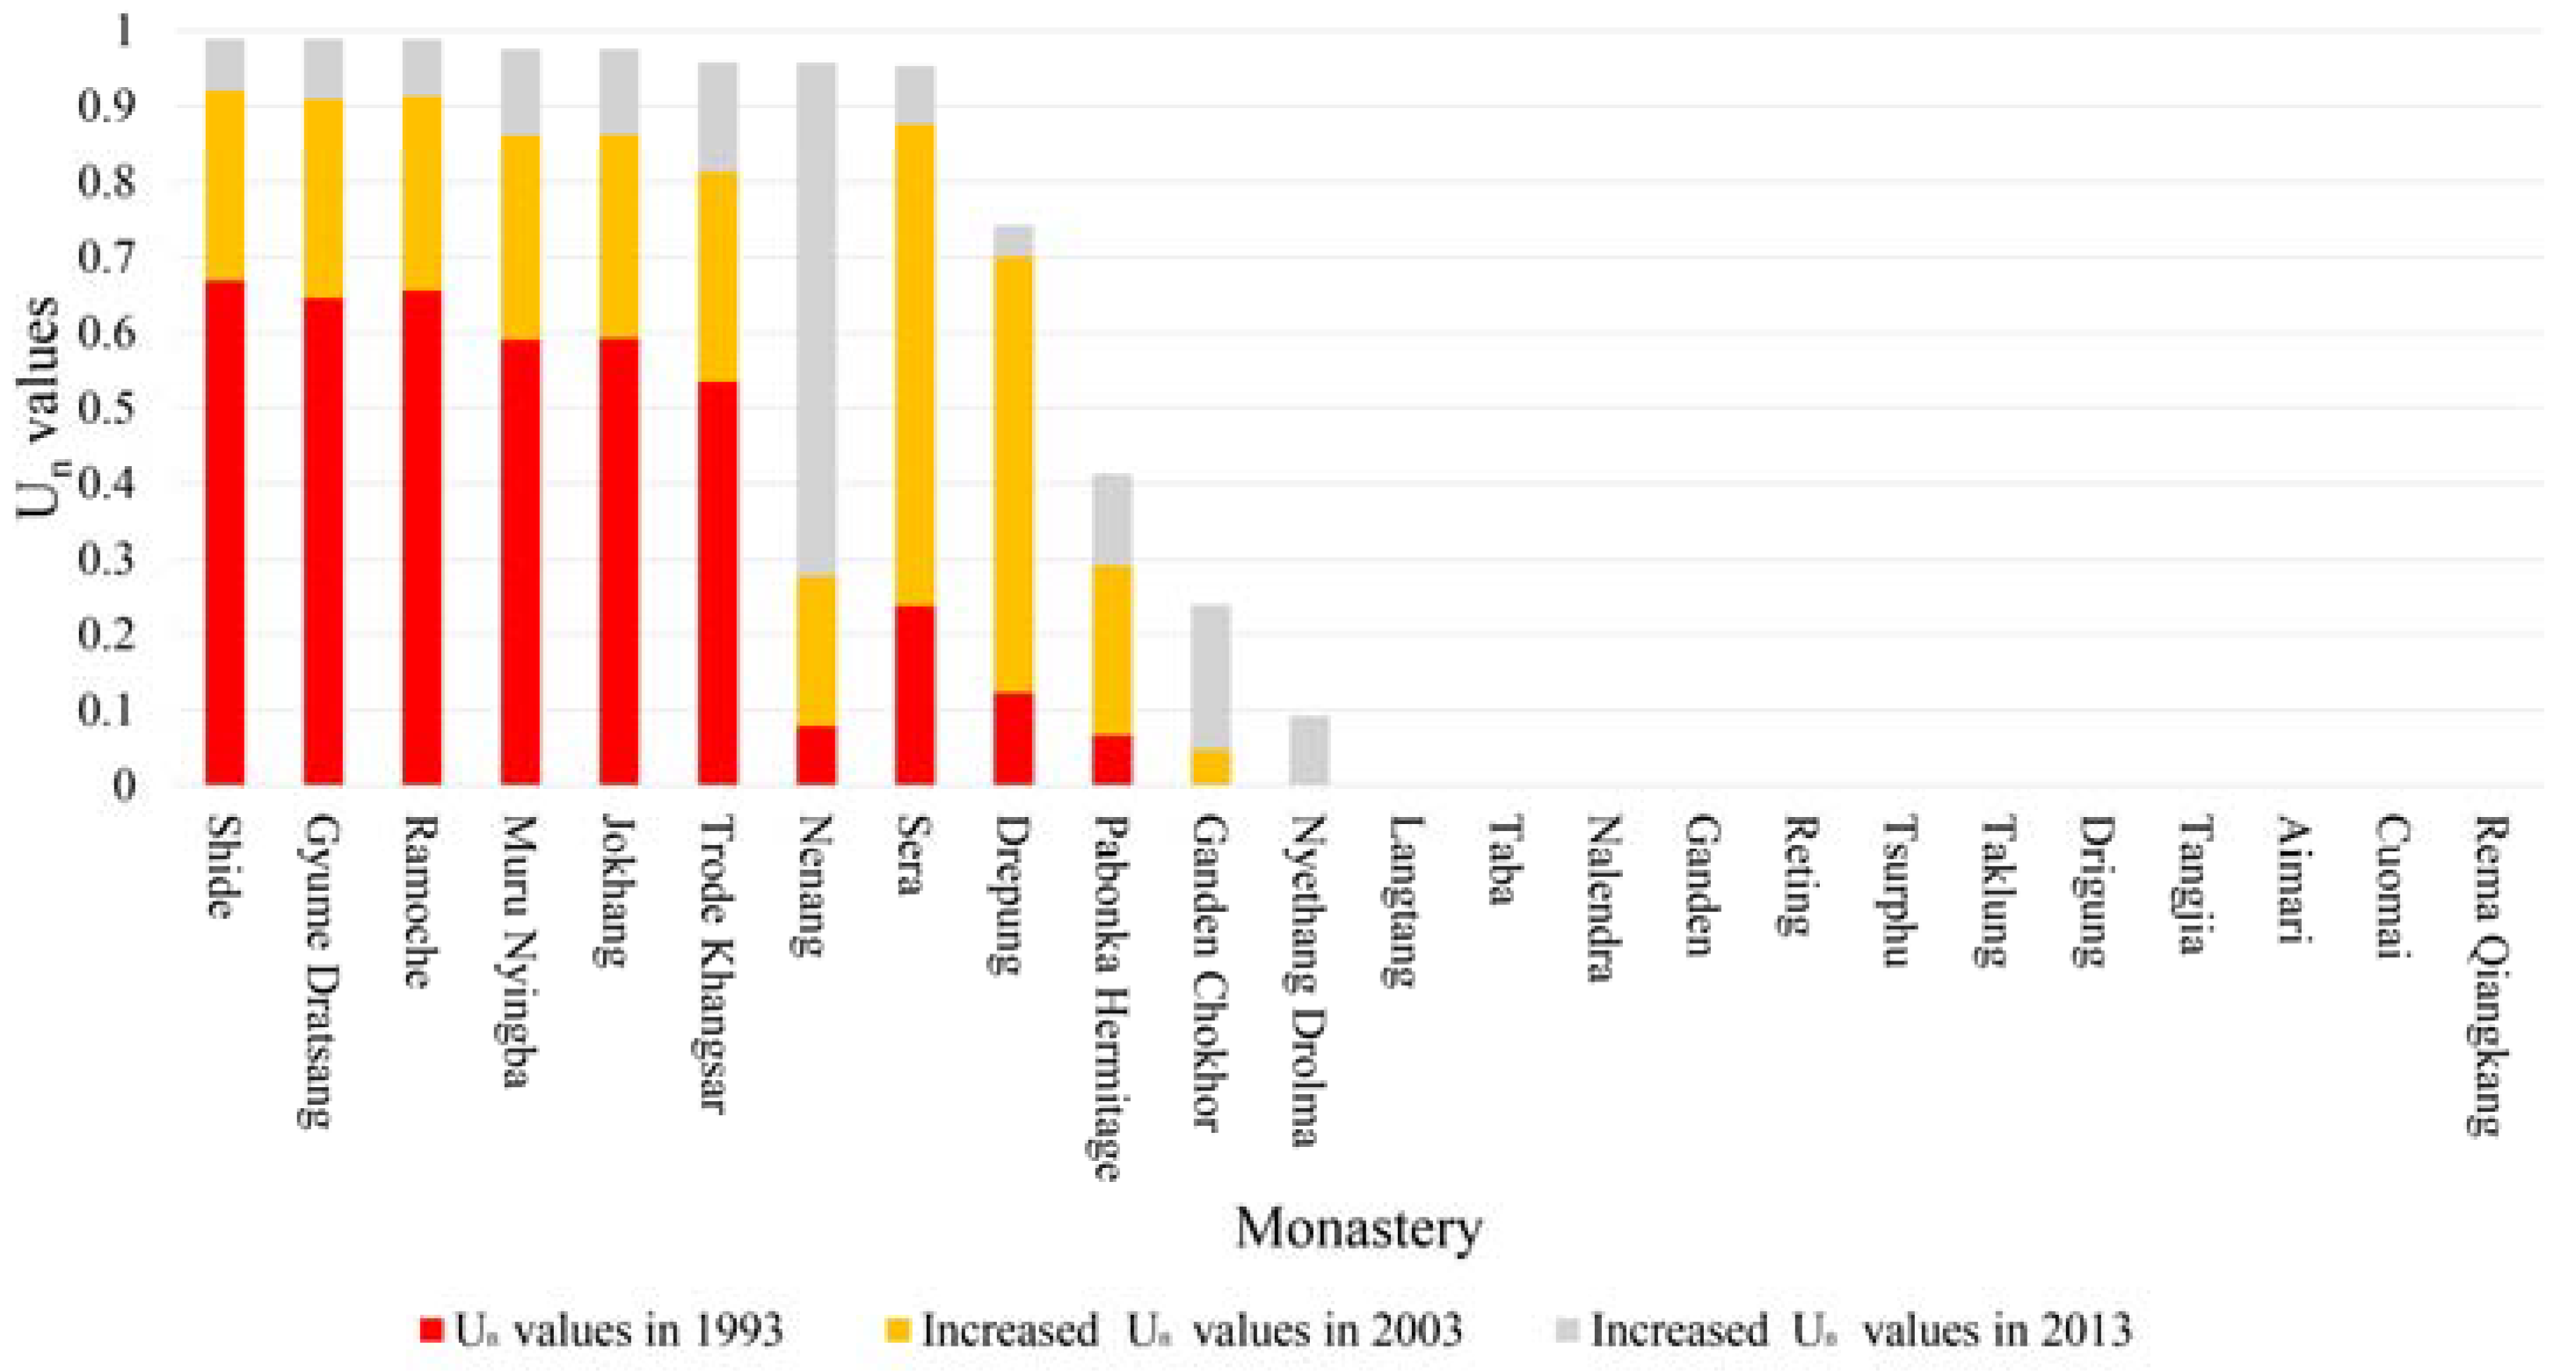
The statistics of the urbanization level (Un) around 152 monasteries in the Q-T Plateau during the period from 1993 to 2013 using NSL data are as follows (Figure 4):
- In 1993, there were 19 monasteries whose Un values were not 0. The seven monasteries with the highest Un values exceeding 0.5 were concentrated in Lhasa and Xining. The monasteries in other cities had low Un values, even Un values of 0.
- In 2003, the number of monasteries whose Un values were not 0 increased to 29. The monasteries with the highest Un values and largest increased Un values were still mainly concentrated in Lhasa. Also, the Un values of 10 monasteries were no longer 0; these were distributed in Shigatse (2), Shannan (2), Nyingchi (2), and Lhasa (1) in Tibet and Garze (3) in Sichuan.
- In 2013, there were 43 monasteries whose Un values were not 0. The Un values of most of the monasteries in Lhasa tend to be saturated (Un values close to 1). Compared to the period from 1993 to 2003, the monasteries with the largest increased Un values were now concentrated in Chamdo in Tibet and Garze and Ngawa in Sichuan, instead of Lhasa. Also, the Un values of 14 monasteries increased from 0; these were distributed in Shannan (5), Ngari (2), Shigaste (2), and Lhasa (1) in Tibet; Yushu (2) and Golog (1) in Qinghai; and Garze (1) in Sichuan.
- From a comprehensive analysis of the Un values between 1993 and 2013, it was found that the Un values of 43 monasteries increased, among which those of 24 monasteries grew from 0, whereas the Un values of 109 monasteries remained at 0. The areas that were significantly influenced by urban growth expanded from Lhasa to the Yarlung Tsangpo River, Nyangqu and Lhasa River regions, as well as the surrounding areas of Xining and Tibetan areas of Sichuan.
3.2. Urban Growth in Lhasa
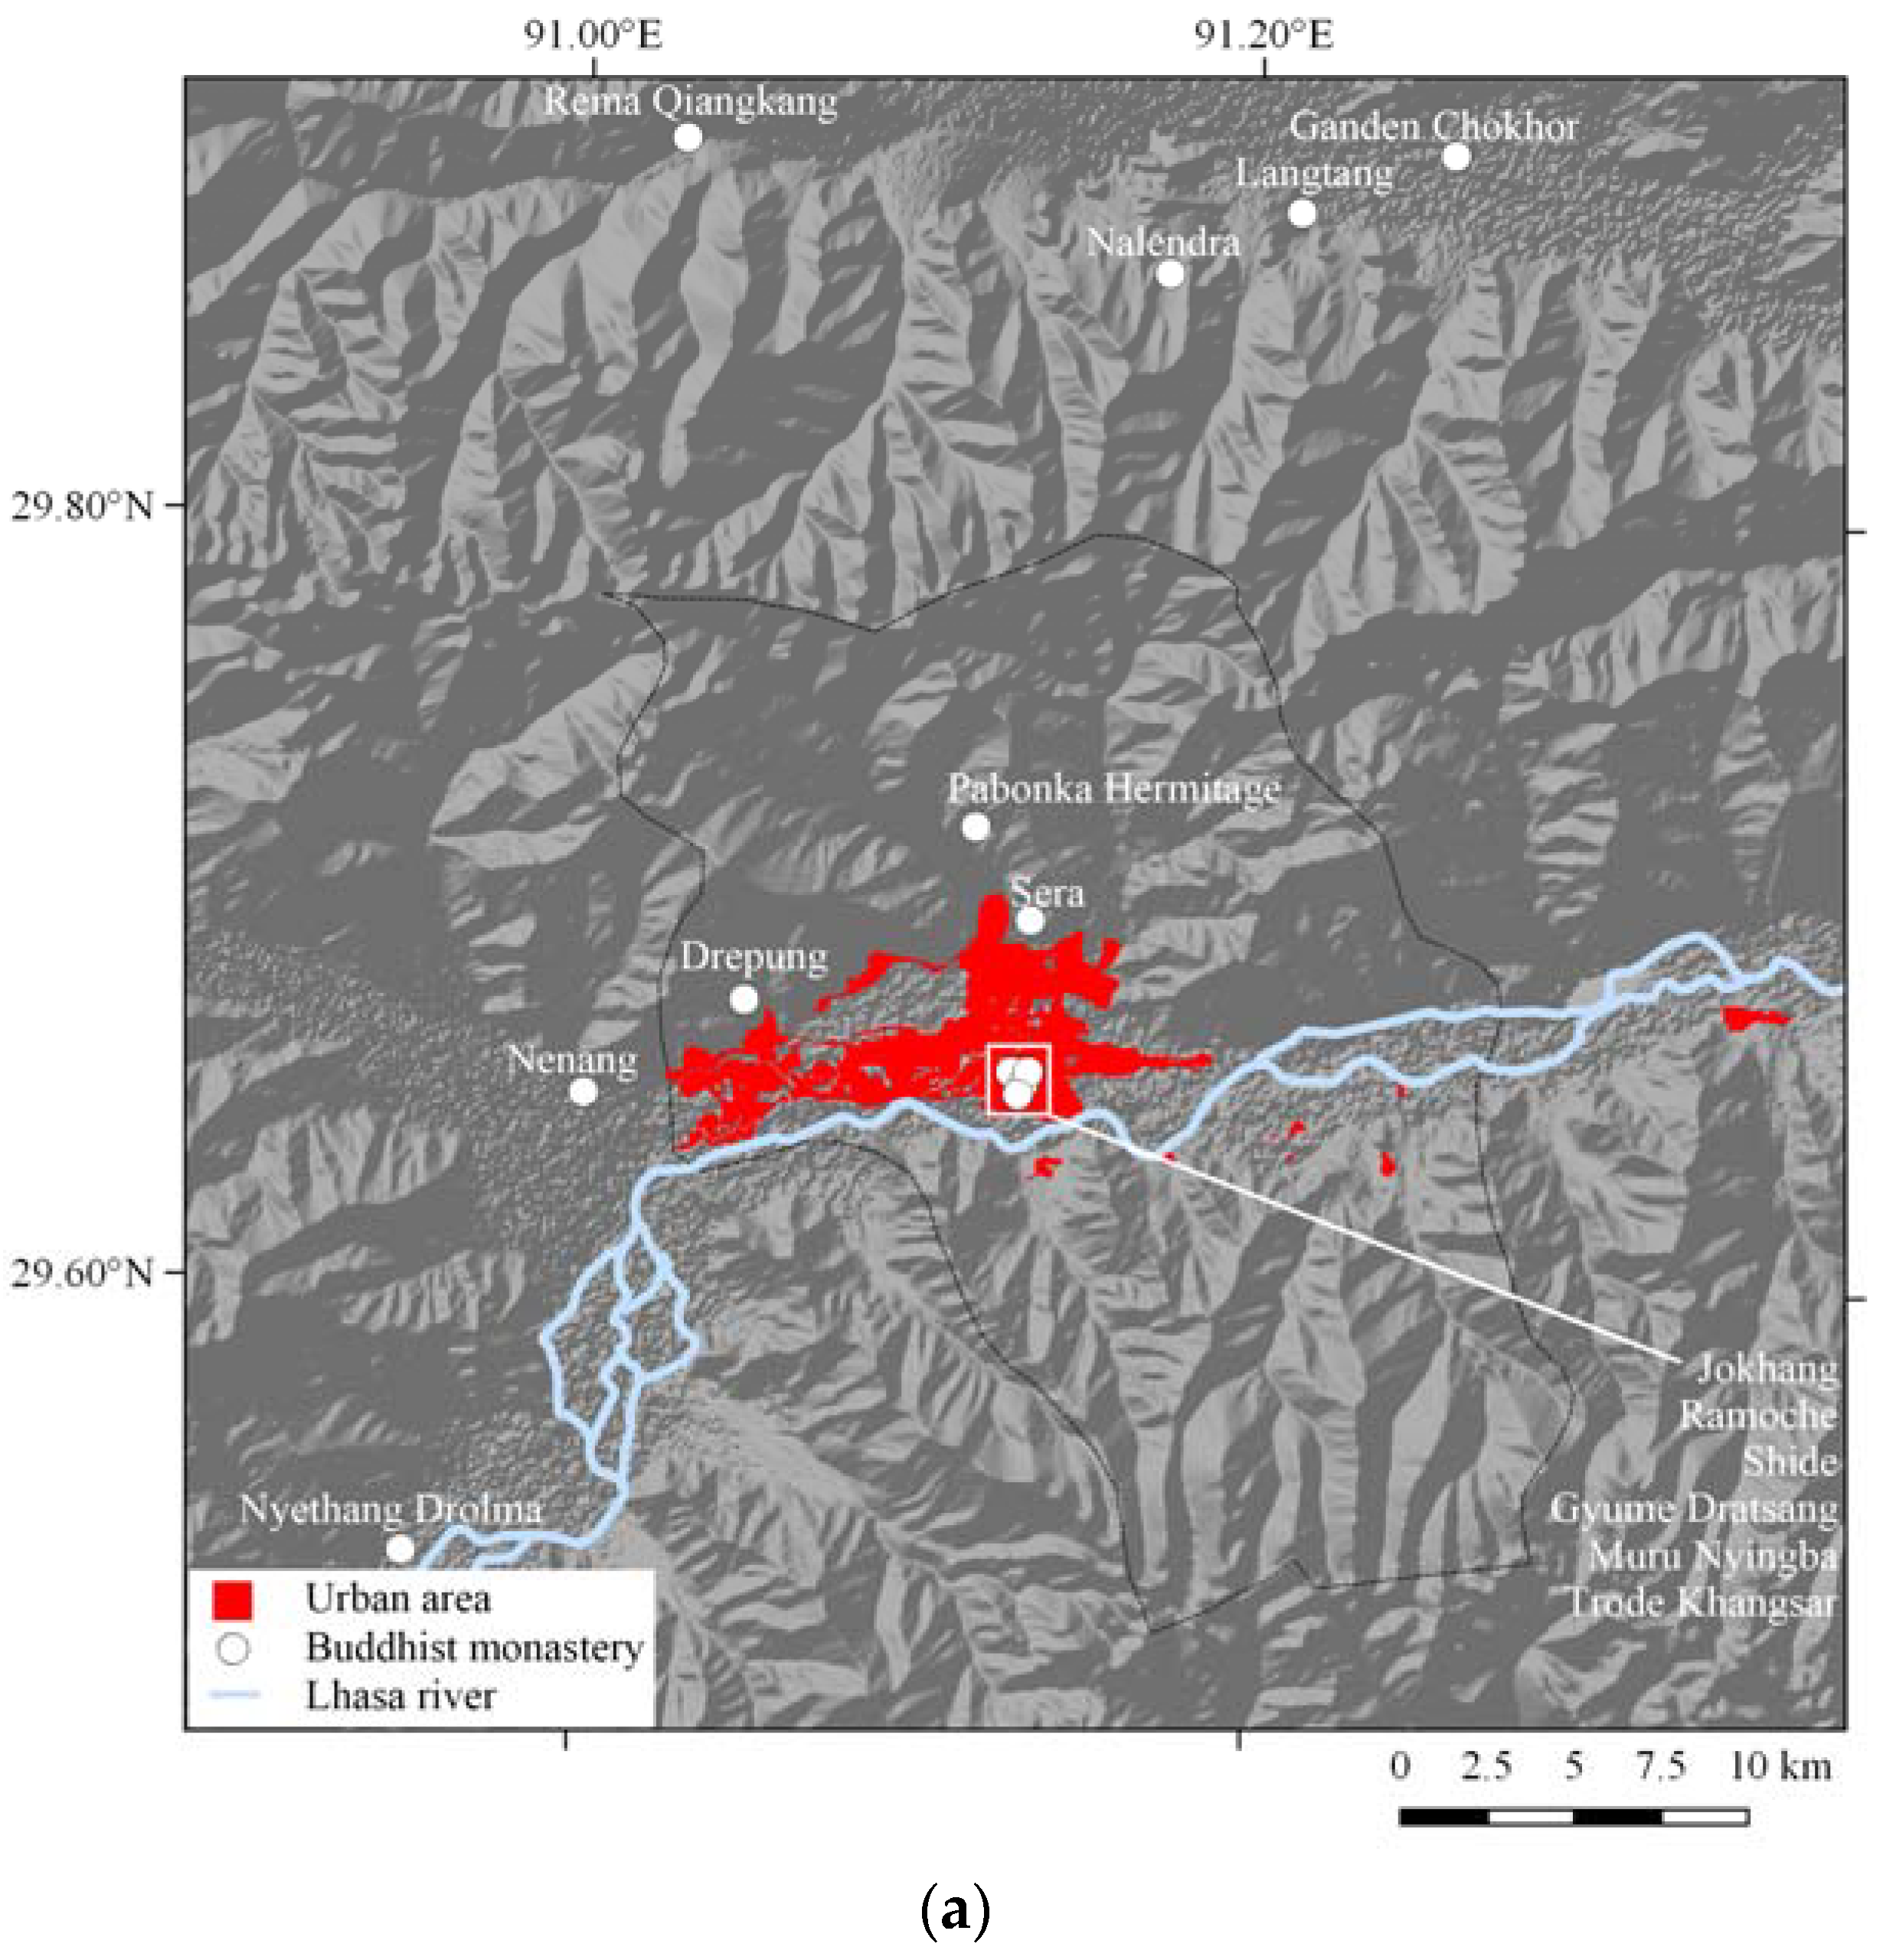
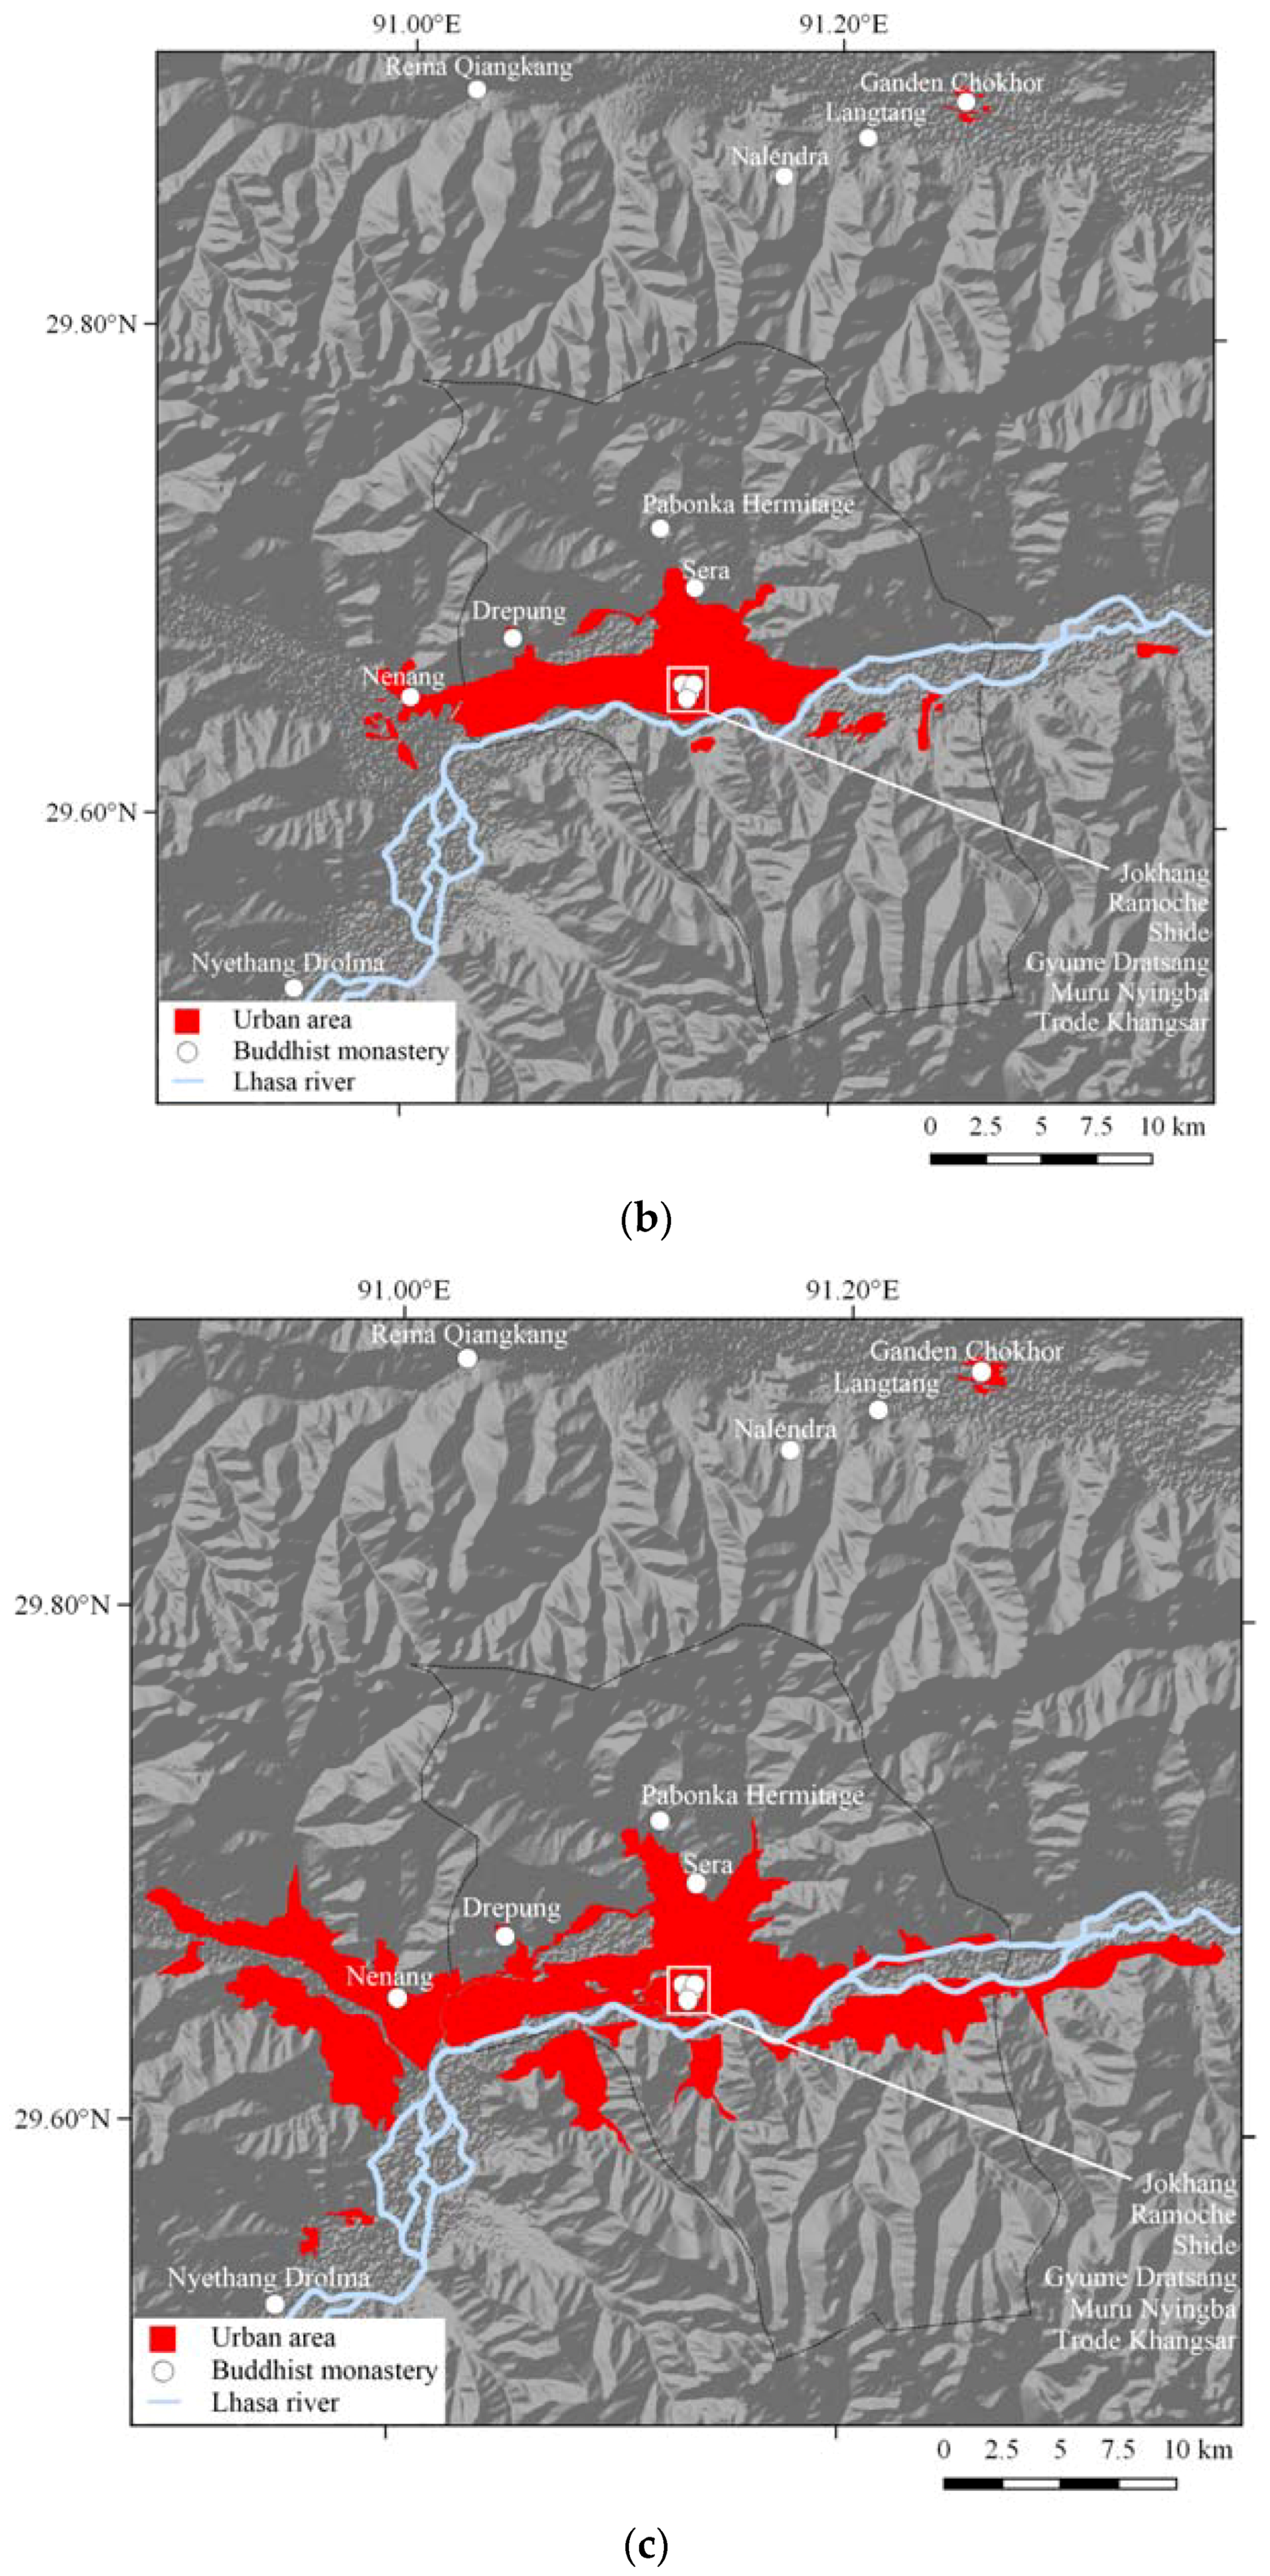
The analysis of Landsat imagery in Lhasa revealed that the urban areas were mainly located in Chengguan District (Figure 5). A detailed view of the results indicates that the urban area was about 33.6 km2 in 1996, which lay completely in Chengguan District; about 60.3 km2 in 2003, which expanded to the west of Doilungdeqen District and east of Dagze District; and, finally, about 135.6 km2 in 2013. Thus, Lhasa’s urban area increased by 2.67 km2/year, on average, between 1993 and 2003 and 7.53 km2/year, on average, between 2003 and 2013, the latter being the fastest growth experienced by Lhasa during the study period. The nature of urban growth on the Q-T Plateau depended on the geographical environment, which is mountainous with an undulating topography, in general. Lhasa’s urban areas are concentrated at the center of the Lhasa River valley and, before 1993, most of the urban growth occurred in the northern section of the Lhasa River. Since 1993, urban growth has continually expanded toward the east, west, and south. Currently, the Lhasa River valley is almost completely developed (Figure 6).
In addition, the trend of urban growth in Lhasa from 1993 to 2013 coincides with the growth of the monasteries’ Un values (Figure 7). The Un values of six monasteries—including Jokhang, Ramoche, and Shide—which were located in urban areas, steadily increased between 1993 and 2003 and became saturated (0.54–0.99) in 2013. Sera, Drepung, and Nenang, which were still outside the urban areas in 1993, were urbanized in 2003, and their Un values significantly increased (0.12–0.88). The Un value of Ganden Chokhor began to increase (0–0.05) during this time. In 2013, the Un value of Nyethang Drolma increased from 0 to 0.09. Since it is located in a relatively flat area in the Lhasa River valley, it is highly likely to be threatened by urbanization in the future. Until 2013, the Un values of 12 monasteries—including Taklung, Reting, Tsurphu, Ganden, and Drigung—which were still far away from urban areas, were constantly 0.
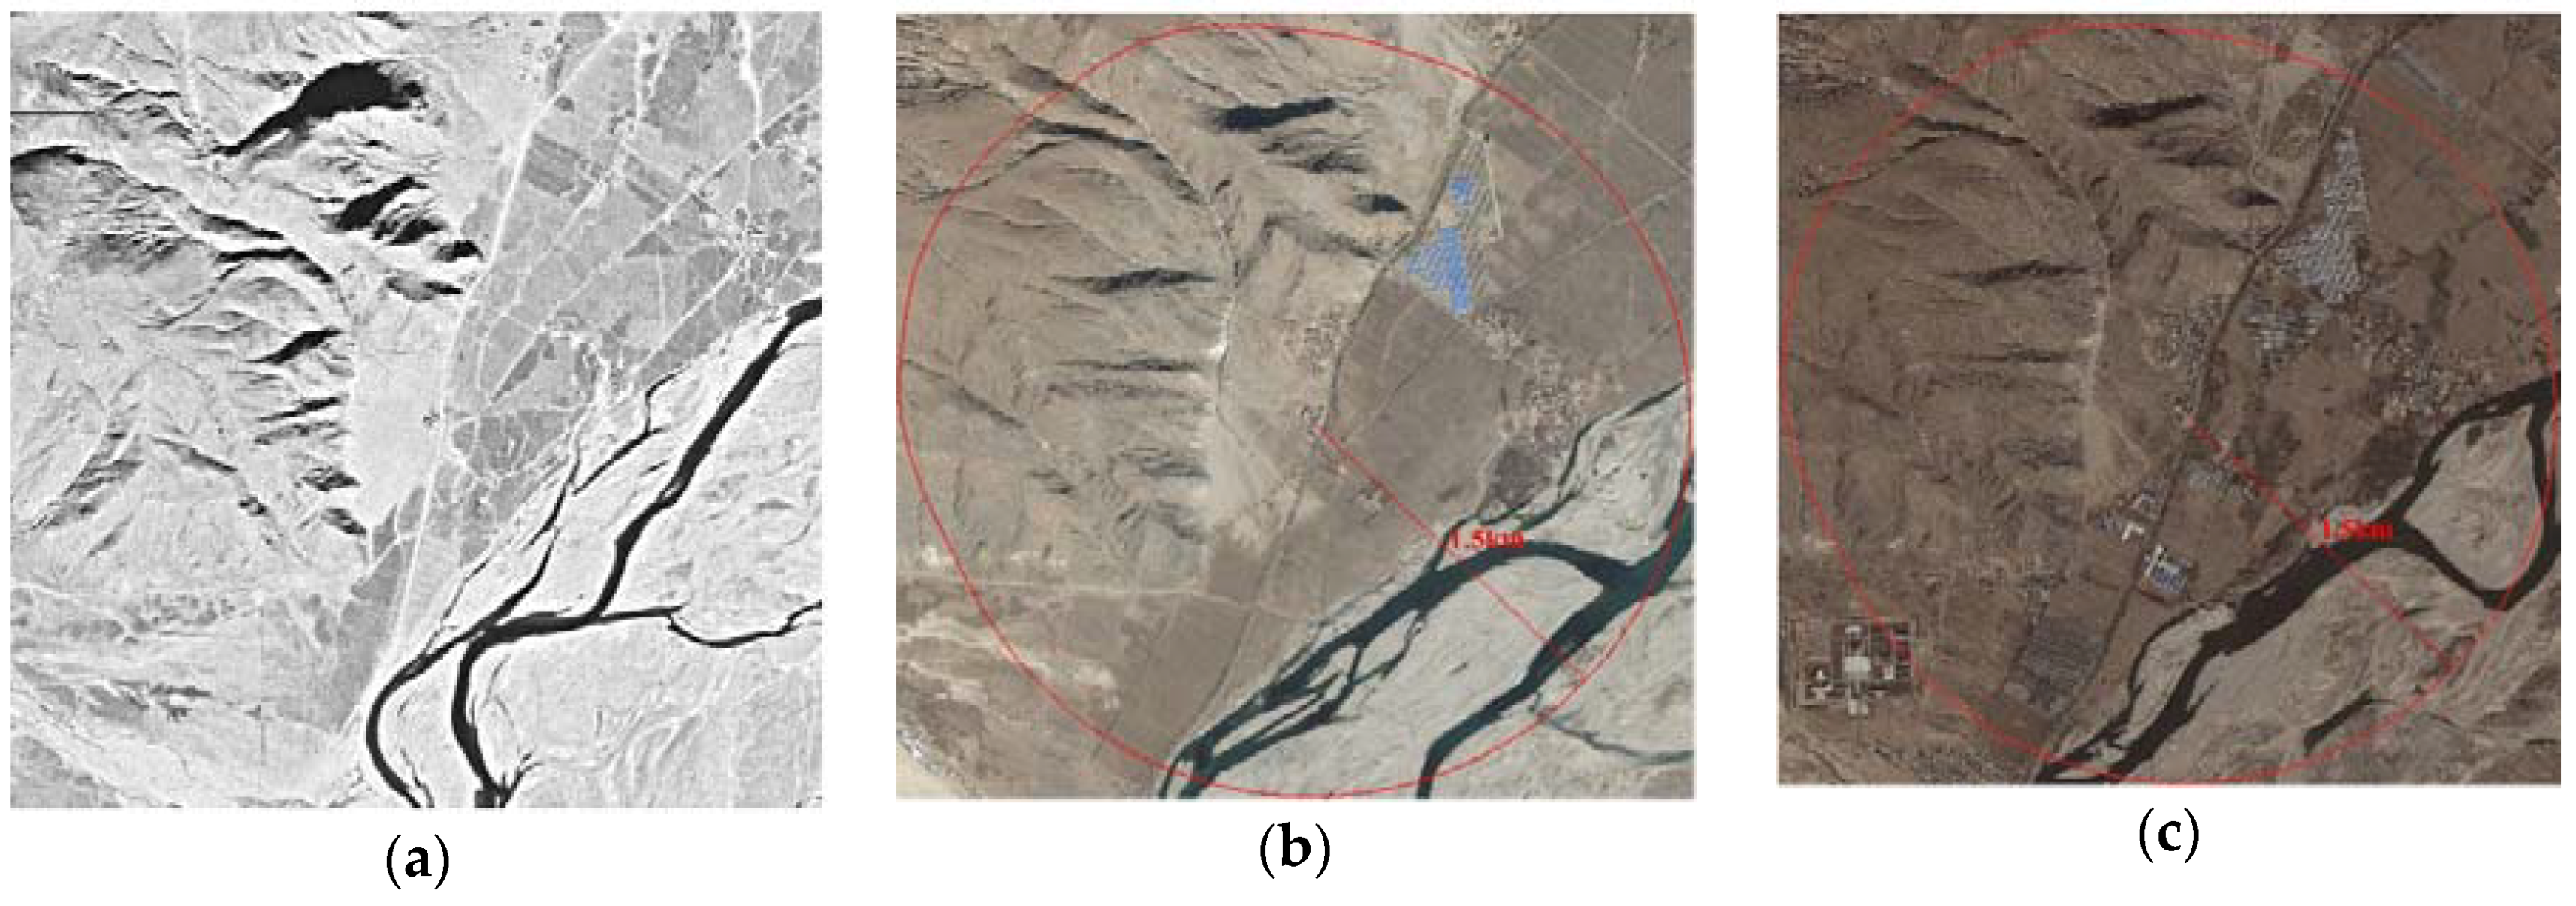
Micro-scale visual assessments were still consistent with macro statistics, but provided more details (Figure 8 and Figure 9). Compared with their situation in the 1970s, the environments of Drepung and Nyethang Drolma significantly changed in 2003. The urban area of Lhasa is less than 1.5 km away from Drepung, and a small-scale residential area has appeared around Nyethang Drolma. In 2013, the urban area did not extend as far as Drepung, but was concentrated around Nyethang Drolma, and the residential area was more dense and agricultural sheds and large-scale modern buildings were built. However, Drepung’s Un value of 0.07 in 2003 was exaggerated. This was related to the blooming phenomenon of light pixels in nighttime light data, which were too sensitive to be used in the survey of areas that were rapidly becoming urbanized. Fortunately, this did not affect the purpose of this study, which predicts how monasteries are being influenced by urbanization.
4. Discussion
Today, the natural environment of Buddhist monasteries in the Q-T Plateau is being threatened by rapid urban growth. A macro-level evaluation of this threat is urgently required to support policy formulation, technical intervention, and field research. The study uses nighttime light data from the period 1993–2013 to evaluate this threat using GIS. The results not only highlight such threats with reference to regional differences and temporal changes but also provide clues for classifying the monasteries into different types according to their risk levels.
Based on the statistical results provided in Section 3, 43 monasteries whose Un values increased during the past 20 years can be summarized into the following three types: (1) For seven monasteries, the Un values were high (more than 0.5) in 1993 and became saturated in 2013. This type of monastery is mainly located in large cities with high levels of urbanization, such as Lhasa and Xining, and most of these monasteries are famous tourist attractions, such as Jokhang and Ramoche. Tourism is the basis of the local economy and a driving force of urbanization [22]. The changes in the surrounding environment of the monasteries, which were safeguarded by relatively sound policies and planning [39,70], were completed in or before 2013. (2) For 11 monasteries, the Un values were 0 in 1993 and gradually increased till 2013 (less than 0.1) because of the oversensitivity of nighttime light data and the blooming phenomenon of light pixels in nighttime light data. This type of monastery remained outside urban areas in 2013; some examples are Nyethang Drolma in Lhasa and Kamsum-Sangkaling in Shannan. (3) For 25 monasteries, the Un values were very low or even 0 in 1993, and they increased rapidly from 1993 to 2013. In 1993, these monasteries were located in the centers of small cities; during the subsequent 20 years, the environment changed significantly due to rapid urban growth. Since this process often lacked efficient supervision of heritage protection, this type of monastery is facing the most serious threat to cultural heritage conservation. Unlike Lhasa and Xining, these cities are not covered by railway services and do not use tourism as the basis of their local economies. It is noted that the driving forces of urbanization in such cities are policies and investments [22]. Therefore, it is particularly important that the government comprehensively considers the conservation and management of architectural heritage sites through urban development policy making and planning. The current condition of the Palcho Monastery is an example of the negative effect of urban growth on the third type of monastery.
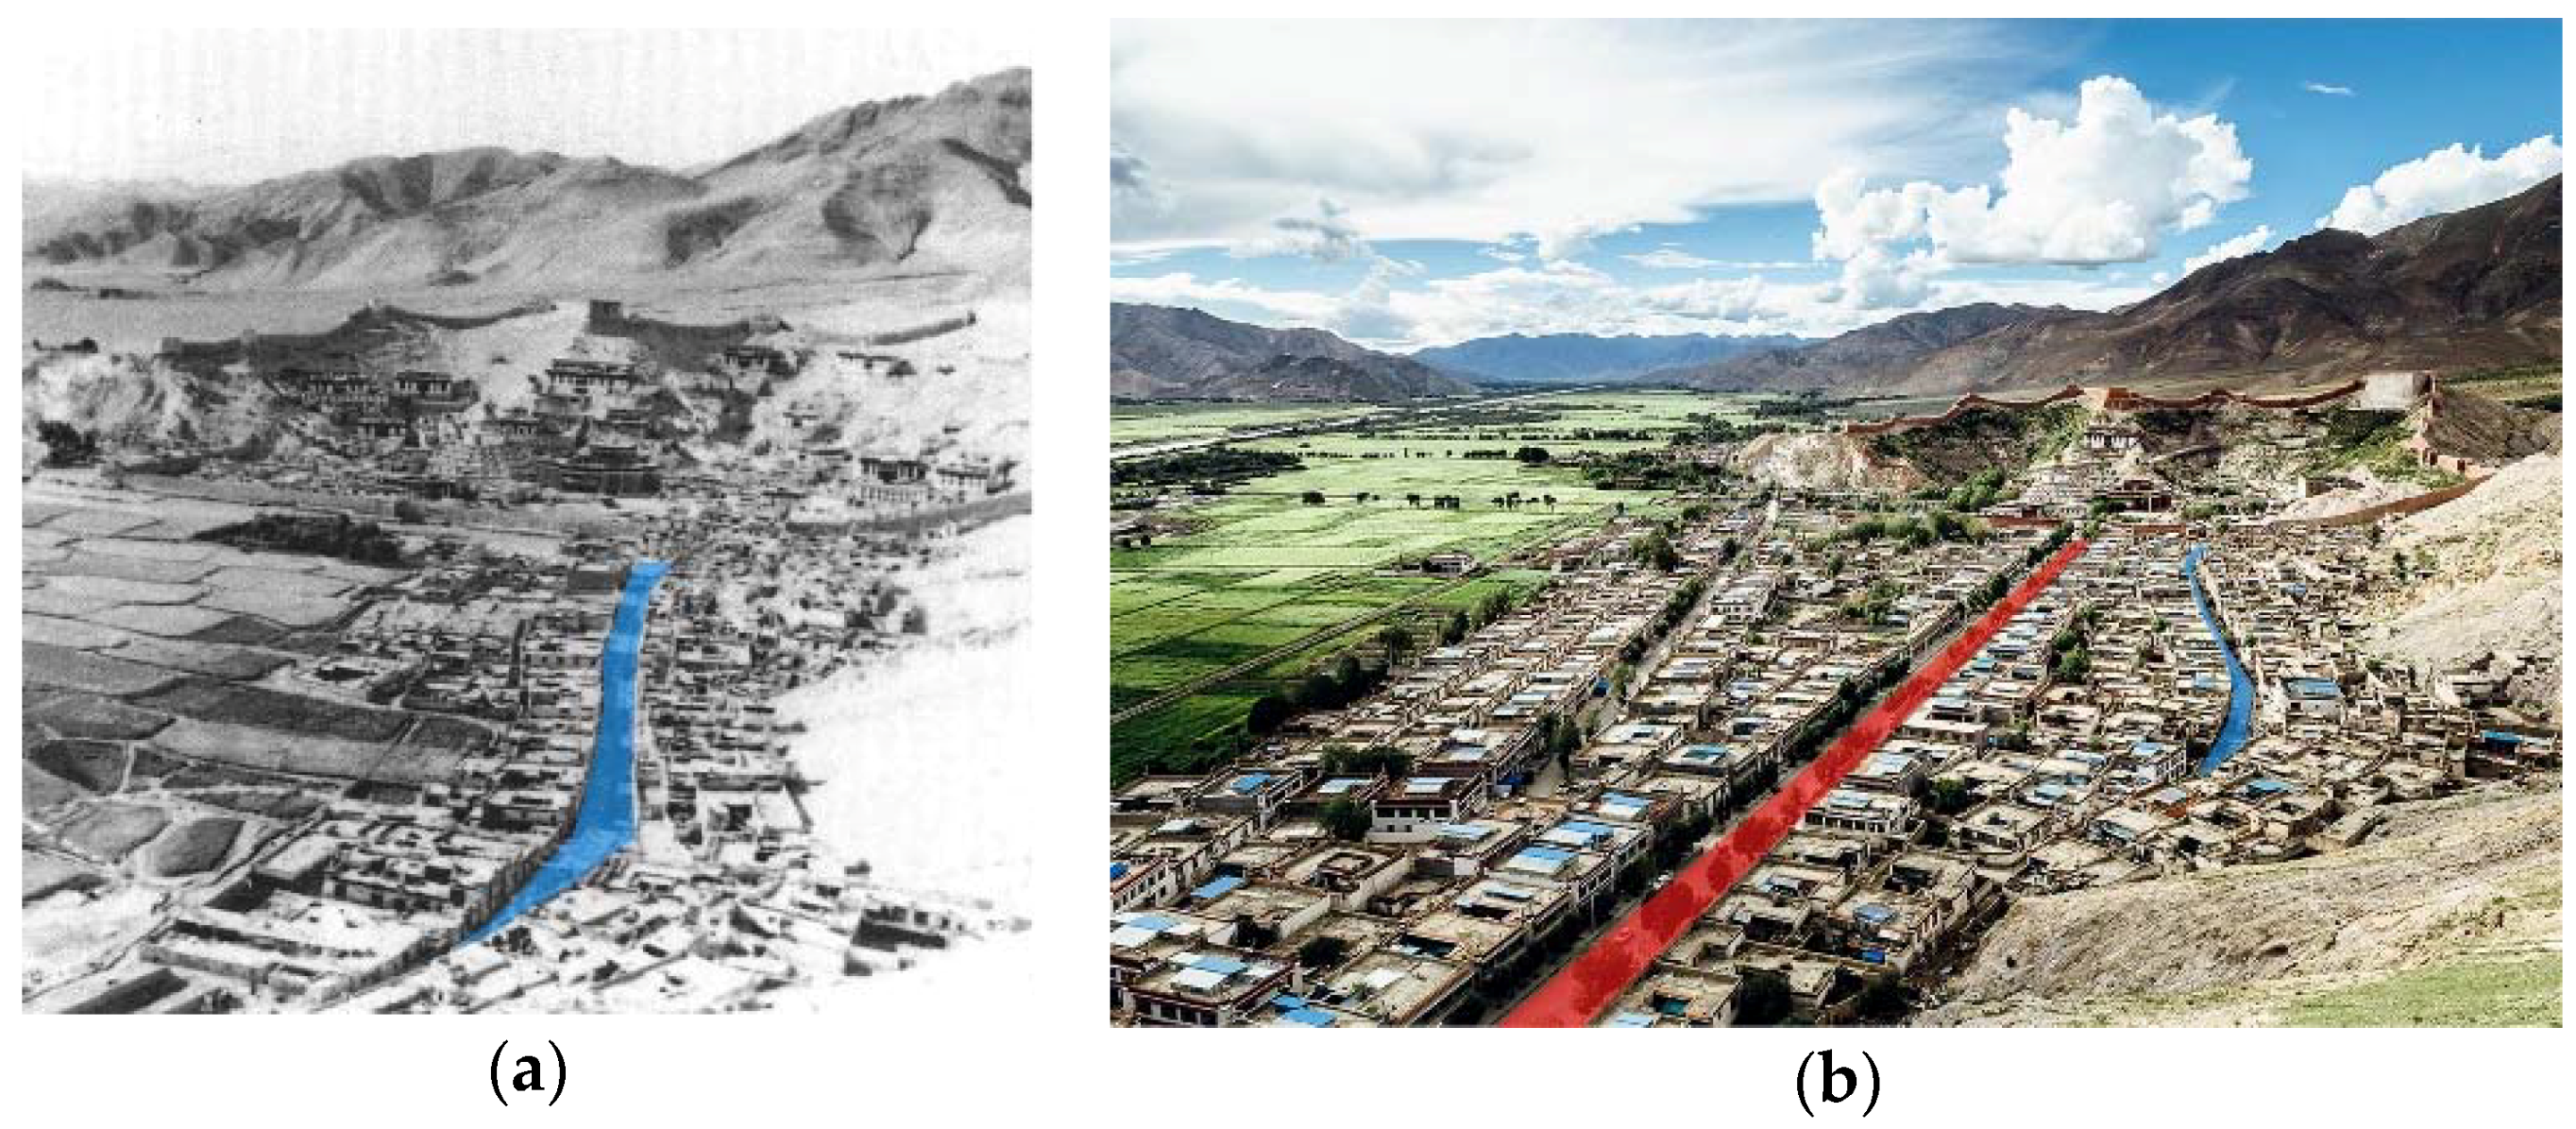
The Palcho Monastery, built in the 15th century, and Gyantse Dzong are the most important architectural heritage sites of Gyantse County in Shigatse. While the old city between them is key to the preservation of the historic urban landscape of Gyantse, rapid urbanization with the assistance of developed cities—Shanghai and Shandong Province—in recent years has given rise to a lack of supervision, and the demolition of historic buildings and construction of new ones by private parties occurs frequently in Gyantse’s old city. The overall renovation of the Palcho Monastery’s surrounding environment was completed around 2016. The Un values in the statistics of nighttime light data are also consistent with this observation: The peak of environmental change around the Palcho Monastery was between 1993 (Un = 0) and 2003 (Un = 0.27). The environment of the monastery that has not been affected by urban growth is depicted in Archaeological Studies on Monasteries of the Tibetan Buddhism (Figure 10a) [42]. In 1959, the Jarijiao Street was the only route connecting the Palcho Monastery and Gyantse Dzong, and the entrance of the Palcho Monastery was at the end of the Jarijiao Street. Every day, the residents of Gyantse would go to the Palcho Monastery through the Jarijiao Street to offer prayers. Hence, this street was an important spiritual location for local residents. Today, the entrance to the Palcho Monastery faces a new straight and wide road, that is, the Palcho Road, which divides Gyantse into the old city and the newly built part (Figure 10b). Due to the characteristic terrain and natural environment of the region, there were no straight roads in traditional Tibetan cities; therefore, the building of the Palcho Road changed the structural integrity of the Palcho Monastery, the old city, and Gyantse Dzong. Meanwhile, most tourists travel to the entrance of the monastery by taking a bus from the Palcho Road, whereas they rarely visit the Jarijiao Street. The spatial sequence, line-of-sight guidance, and psychological planning associated with the original arrival route no longer exist; this change has destroyed the structural integrity of the Palcho Monastery, the old city, and Gyantse Dzong and has made it difficult for tourists to obtain the spatial experience and feel the charm of the old city. It is noted that the residents of the old city do contribute to keep the traditions of the Palcho Monastery alive by organizing religious rites and public activities. The historic buildings in the old city have limited water and sanitary facilities; however, the rebuilding of private buildings in the old city of Gyantse is forbidden by the local government due to preservation reasons. As a result, some original residents have moved to the newly built part of Gyantse to lead more comfortable lives. If the Palcho Monastery and old city are preserved only superficially without enabling the effective improvement of the living conditions of the residents, the growth of the new city may cause the old city to become less widely inhabited and change the population structure in the region around the Palcho Monastery. Finally, due to the destruction of the city’s tangible and intangible elements, the Palcho Monastery and its surroundings will soon lose their authenticity and integrity.
Based on Un values and remote sensing images, the monasteries in similar situations are the Galden Jampaling Monastery in Chamdo, Sangpi Yin Monastery in Garze, Labrang Monastery in Gannan, and so on. For these monasteries, the valuable and unique characteristics of architectural heritage should be clearly recognized and supervised from the early stages of urban planning and development policies formulation themselves, and the measures for safeguarding the tangible and intangible elements comprising heritage should be strengthened. To realize the sustainable conservation and development of a region, policy makers must consider its architectural heritage, historic districts, and towns as organic parts of the urban ecosystem. In addition, to suppress the negative impact of urbanization, buffer zones can be set up around monasteries; they apply different management policies to different zones, such as the prohibition of renovation and construction in protective zones and the restriction of these activities in construction control zones. The extents of these buffer zones are fixed based on topographical, natural and built environmental, and other aspects such as infrastructure, land-use patterns, spatial organization, and visual relationships [9].
5. Conclusions
The effect of urban growth on the architectural heritage of the Q-T Plateau is a complicated issue requiring urgent resolution. On the one hand, we have very little information on the local architectural heritage sites in the plateau and, on the other, these sites have changed over the years at an unexpectedly high rate. Policy makers should view these changes from the perspective of development so that such changes can be transformed into timely opportunities for ensuring the conservation of architectural heritage and sustainable development of the urban ecosystem through appropriate management and guidance. This study evaluates the changes in urbanization that occurred from 1993 to 2013 in regions surrounding 152 Buddhist monasteries (3 km × 3 km) in the Q-T Plateau by adopting the NSL data of the V4DNLTS dataset and GIS data from 1993 to 2013. Macro-scale changes can be measured using a cost-effective method that uses open remote sensing data. The verification results show that this method can provide accurate data to support policy formulation, technical intervention, and field research on architectural heritage conservation. Based on statistical results, the monasteries whose environments have changed are divided into three types. Further, one type of monastery whose urbanization expanded noticeably from 1993 to 2013 should be particularly focused on, because they are suffering from the negative impact of urban growth due to them lacking effective supervision and protection policies.
This study has the limitation that it does not address the correction of successive nighttime light data at the scale of the Q-T Plateau. This would improve the temporal resolution of environment monitoring and impact evaluation by the monasteries. Moreover, we conducted no further studies on the 109 monasteries that had Un values of 0 in 2013, because these scores are related to trends of local urban growth, as well as other factors, such as the regional geographical environment, and more diverse data are required for integration. The future directions of this research include finding a solution to the aforementioned problem. Furthermore, in addition to considering multiple remote sensing datasets and a larger number of monasteries, additional types of data, such as geographical (river or terrain) and economic factors, must be considered. They would enhance the evaluation, monitoring, and early warning of the effects of urbanization on monasteries.
Author Contributions
H.Z. conceived and designed the study; H.Z. reviewed and edited the manuscript; Y.Z. and Z.S. collected and analyzed the data and wrote the paper. All the authors have read and approved the manuscript.
Acknowledgments
The study is funded by the National Natural Science Fund of China (51708285); Natural Science Fund of Jiangsu Province (BK20171009); Open Fund of Key Laboratory of Urban and Architectural Heritage Conservation (Southeast University), Ministry of Education, China (KUAL1608).
Conflicts of Interest
This manuscript has not been published or presented elsewhere in part or entirety and is not under consideration by any other journal. We have read and understood your journal’s policies, and we believe that neither the manuscript nor the study violates any of these. The authors declare no conflict of interest. The funding sponsors had no role in the design of the study; in the collection, analyses, or interpretation of data; in the writing of the manuscript; and in the decision to publish the results.
References
- Urban Population (% of Total). Available online: https://data.worldbank.org/indicator/SP.URB.TOTL.IN.ZS (accessed on 2 January 2017).
- World Urbanization Prospects: The 2014 Revision, Highlights (ST/ESA/SER.A/352). Available online: http://esa.un.org/unpd/wup/Highlights/WUP2014-Highlights.pdf (accessed on 18 November 2016).
- Ciegis, R.; Ramanauskiene, J.; Martinkus, B. The concept of sustainable development and its use for sustainability scenarios. Eng. Econ. 2009, 2, 28–37. [Google Scholar]
- The Future We Want (A/RES/66/288). Available online: https://sustainabledevelopment.un.org/index.php?menu=1298 (accessed on 18 November 2016).
- Action Plan on Cultural Policies for Development. Available online: http://www.lacult.unesco.org/docc/1998_Action_Plan_Cultural_Policies_for_Dev_UNESCO.pdf (accessed on 21 April 2018).
- Report of the World Commission on Environment and Development: Our Common Future. Available online: http://www.un-documents.net/our-common-future.pdf (accessed on 21 May 2017).
- United Nations Conference on Environment & Development Agenda 21. Available online: https://sustainabledevelopment.un.org/content/documents/Agenda21.pdf (accessed on 21 May 2017).
- United Nations Millennium Declaration (A/RES/55/2). Available online: http://www.un.org/millennium/declaration/ares552e.htm (accessed on 25 May 2017).
- The Operational Guidelines for the Implementation of the World Heritage Convention. Available online: http://whc.unesco.org/en/guidelines/ (accessed on 10 February 2018).
- Girard, L.F.; Nijkamp, P. Cultural Tourism and Sustainable Local Development; Ashgate Publishing, Ltd.: Farnham, UK, 2009. [Google Scholar]
- Transforming Our World: The 2030 Agenda for Sustainable Development. Available online: http://www.un.org/ga/search/view_doc.asp?symbol=A/RES/70/1&Lang=E (accessed on 20 May 2017).
- The New Urban Agenda. Available online: http://habitat3.org/the-new-urban-agenda/ (accessed on 22 April 2018).
- People’s Republic of China, National Development and Reform Commission, Development and Planning Department. Urbanization Plan for 2014–2020. Available online: http://ghs.ndrc.gov.cn/zttp/xxczhjs/ghzc/201605/t20160505_800839.html (accessed on 20 May 2017).
- Council of Europe Framework Convention on the Value of Cultural Heritage for Society (Faro, 2005). Available online: https://www.coe.int/en/web/conventions/full-list/-/conventions/rms/0900001680083746 (accessed on 24 April 2018).
- National Bureau of Statistics of the People’s Republic of China. China Statistical Yearbook 2017. Available online: http://www.stats.gov.cn/tjsj/ndsj/2017/indexch.htm (accessed on 26 October 2017).
- Fang, C. The urbanization and urban development in China after the reform and opening-up. Econ. Geogr. 2009, 29, 19–25. [Google Scholar]
- National Bureau of Statistics of the People’s Republic of China. The Statistical Bulletin of the People’s Republic of China on National Economic and Social Development in 2017. Available online: http://www.stats.gov.cn/tjsj/zxfb/201802/t20180228_1585631.html (accessed on 2 March 2018).
- Li, Q. Urbanization Rate of Resident Population Will Reach 60% in 2020. Available online: http://www.xinhuanet.com/politics/2016lh/2016-03/05/c_128775510.htm (accessed on 16 May 2017).
- Fang, C.L.; Liu, X.L.; Lin, X.Q. Stages correction and regularity analysis of urbanization course of China. Arid Land Geogr. 2008, 31, 512–523. [Google Scholar]
- Zhou, G.Z. China’s urbanization should be possessed of ourselves characteristic. Urban Dev. Stud. 2006, 13, 13–14. [Google Scholar]
- Liang, B.W.; Luo, Z.F. Spatial pattern and convergence of the level of new urbanization in Chinese cities at prefecture-level in recent 10 years. Mod. Urban Res. 2017, 5, 67–74. [Google Scholar] [CrossRef]
- Fang, C.L.; Li, G.D. Analysis and recommendation on the particularity and gradual mode of new urbanization in Tibet. Bull. Chin. Acad. Sci. 2015, 3, 294–305. [Google Scholar]
- The Capacity of the Qing-Tibet Railway Continues to Increase, and the Passenger and Cargo Traffic Continues to Get to High Record. Available online: http://www.xinhuanet.com/local/2016-06/28/c_1119125357.htm (accessed on 21 May 2017).
- Brandi, C. Teoria Del Restauro; Edizioni di Storia e Letteratura: Roma, Italia, 1963. [Google Scholar]
- Feilden, B. Conservation of Historic Buildings; Routledge: London, UK, 2007. [Google Scholar]
- Munoz-Vinas, S. Contemporary Theory of Conservation; Routledge: London, UK, 2012. [Google Scholar]
- International Charter for the Conservation and Restoration of Monuments and Sites (The Venice Charter 1964). Available online: https://www.icomos.org/charters/venice_e.pdf (accessed on 17 June 2015).
- Recommendation Concerning the Safeguarding and Contemporary Role of Historic Areas. Available online: http://portal.unesco.org/en/ev.php-URL_ID=13133&URL_DO=DO_TOPIC&URL_SECTION=201.html (accessed on 11 December 2017).
- The Washington Charter: Charter on the Conservation of Historic Towns and Urban Areas. Available online: https://www.icomos.org/charters/towns_e.pdf (accessed on 15 December 2017).
- The Nara Document on Authenticity (1994). Available online: https://www.icomos.org/charters/nara-e.pdf (accessed on 17 June 2015).
- Charter on the Built Vernacular Heritage. Available online: https://www.icomos.org/images/DOCUMENTS/Charters/vernacular_e.pdf (accessed on 22 April 2018).
- Xi’an Declaration on the Conservation of the Setting of Heritage Structures, Sites and Areas. Available online: https://www.icomos.org/xian2005/xian-declaration.pdf (accessed on 16 December 2017).
- The Quebec Declaration on the Preservation of the Spirit of the Place. Available online: https://whc.unesco.org/uploads/activities/documents/activity-646-2.pdf (accessed on 22 April 2018).
- ICOMOS Charter on the Interpretation and Presentation of Cultural Heritage Sites. Available online: http://icip.icomos.org/downloads/ICOMOS_Interpretation_Charter_ENG_04_10_08.pdf (accessed on 22 April 2018).
- International Cultural Tourism Charter: Managing Tourism at Places of Heritage Significance. Available online: https://www.icomos.org/charters/tourism_e.pdf (accessed on 26 January 2018).
- The Valletta Principles for the Safeguarding and Management of Historic Cities, Towns and Urban Areas. Available online: https://www.icomos.org/Paris2011/GA2011_CIVVIH_text_EN_FR_final_20120110.pdf (accessed on 5 February 2018).
- Recommendation on the Historic Urban Landscape. Available online: https://whc.unesco.org/uploads/activities/documents/activity-638-98.pdf (accessed on 8 February 2018).
- Bandarin, F.; Van Oers, R. The Historic Urban Landscape: Managing Heritage in an Urban Century; John Wiley & Sons: Hoboken, NJ, USA, 2012. [Google Scholar]
- United Nations Education, Scientific and Cultural Organization, World Heritage Centre. Available online: http://whc.unesco.org/en/soc/?action=list&id_site=707 (accessed on 12 January 2017).
- Wang, Y.P. The Architecture Heritage in Lhasa; Southeast University Press: Nanjing, China, 2005. [Google Scholar]
- Chen, Y.D. Studies on Chinese Tibetan Architecture; China Architecture & Building Press: Beijing, China, 2007. [Google Scholar]
- Su, B. Archaeological Studies on Monasteries of the Tibetan Buddhism; Cultural Relics Press: Beijing, China, 1996. [Google Scholar]
- Pu, W.C. Tibetan Buddhist Monasteries of Gansu and Qinghai; Qinghai People’s Publishing House: Xining, China, 1990. [Google Scholar]
- Larsen, K.; Sinding-Larsen, A. The Lhasa Atlas: Traditional Tibetan Architecture and Townscape; Serindia Publications: Chicago, IL, USA, 2002. [Google Scholar]
- Zhang, Y.Y.; Sun, Z. Usability of architectural heritage surveying technologies in Tibet. Huazhong Archit. 2018, 36, 52–56. [Google Scholar]
- Ding, Y.; Zhang, J.P.; Wang, G.L. Application of 3D laser scanning technology in protection of Palcho Monastery. Tradit. Chin. Archit. Gard. 2010, 3, 24–28. [Google Scholar]
- Weng, Q. A remote sensing-GIS evaluation of urban expansion and its impact on surface temperature in the Zhujiang Delta, China. Int. J. Remote Sens. 2001, 22, 1999–2014. [Google Scholar] [CrossRef]
- Xiao, J.; Shen, Y.; Ge, J.; Tateishi, R.; Tang, C.; Liang, Y.; Huang, Z. Evaluating urban expansion and land use change in Shijiazhuang, China, by using GIS and remote sensing. Landsc. Urban Plan. 2006, 75, 69–80. [Google Scholar] [CrossRef]
- Liu, Z.; He, C.; Zhang, Q.; Huang, Q.; Yang, Y. Extracting the dynamics of urban expansion in China using DMSP-OLS nighttime light data from 1992 to 2008. Landsc. Urban Plan. 2012, 106, 62–72. [Google Scholar] [CrossRef]
- Peng, J.; Liu, Z.H.; Liu, Y.H.; Wu, J.S.; Han, Y.N. Trend analysis of vegetation dynamics in Qinghai-Tibet Plateau using Hurst exponent. Ecol. Indic. 2012, 14, 28–39. [Google Scholar] [CrossRef]
- Chen, B.X.; Zhang, X.Z.; Tao, J.; Wu, J.S.; Wang, J.S.; Shi, P.L.; Zhang, Y.J.; Yu, C.Q. The impact of climate change and anthropogenic activities on alpine grassland over the Qinghai-Tibet Plateau. Agric. For. Meteorol. 2014, 189, 11–18. [Google Scholar] [CrossRef]
- Lasaponara, R.; Murgante, B.; Elfadaly, A.; Qelichi, M.M.; Shahraki, S.Z.; Wafa, O.; Attia, W. Spatial open data for monitoring risks and preserving archaeological areas and landscape: Case studies at Kom el Shoqafa, Egypt and Shush, Iran. Sustainability 2017, 9, 572. [Google Scholar] [CrossRef]
- Agapiou, A.; Alexakis, D.D.; Lysandrou, V.; Sarris, A.; Cuca, B.; Themistocleous, K.; Hadjimitsis, D.G. Impact of urban sprawl to cultural heritage monuments: The case study of Paphos area in Cyprus. J. Cult. Herit. 2015, 16, 671–680. [Google Scholar] [CrossRef]
- Pappu, S.; Akhilesh, K.; Ravindranath, S.; Raj, U. Applications of satellite remote sensing for research and heritage management in Indian prehistory. J. Archaeol. Sci. 2010, 37, 2316–2331. [Google Scholar] [CrossRef]
- People’s Republic of China, Standing Committee of the National People’s Congress. Law of the Peoples’ Republic of China on the Protection of Cultural Relics (2017 Amendment). Available online: http://www.sach.gov.cn/art/2017/11/28/art_1034_121351.html (accessed on 10 December 2017).
- People’s Republic of China, State Council of the People’s Republic of China, State Administration of Cultural Heritage. List of National Key Cultural Relic Protection Units. Available online: http://www.sach.gov.cn/col/col1644/index.html (accessed on 11 December 2017).
- People’s Republic of China, State Bureau of Surveying and Mapping, National Catalogue Service for Geographic Information. 1:1 Million Basic National Geographic Database. Available online: http://www.webmap.cn/commres.do?method=result100W (accessed on 5 August 2017).
- Version 4 DMSP-OLS Nighttime Lights Time Series. Available online: https://ngdc.noaa.gov/eog/dmsp/downloadV4composites.html (accessed on 10 October 2016).
- Ma, T.; Zhou, C.; Pei, T.; Haynie, S.; Fan, J. Quantitative estimation of urbanization dynamics using time series of DMSP/OLS nighttime light data: A comparative case study from China’s cities. Remote Sens. Environ. 2012, 124, 99–107. [Google Scholar] [CrossRef]
- Lo, C.P. Urban indicators of China from radiance-calibrated digital DMSP-OLS nighttime images. Ann. Assoc. Am. Geogr. 2002, 92, 225–240. [Google Scholar] [CrossRef]
- USGS EarthExplorer. Available online: https://earthexplorer.usgs.gov/ (accessed on 16 October 2016).
- Chen, J.; Zhuo, L.; Shi, P.J.; Ichinose, T. The study on urbanization process in China based on DMSP/OLS data: Development of a light index for urbanization level estimation. J. Remote Sens. 2007, 7, 168–175. [Google Scholar]
- Zhuo, L.; Chen, J.; Shi, P.J.; Gu, Z.H.; Fan, Y.D.; Ichinose, T. Modeling population density of China in 1998 based on DMSP/OLS nighttime light image. Acta Geogr. Sin. 2005, 60, 266–276. [Google Scholar] [CrossRef]
- Li, D.R.; Yu, H.R.; Li, X. The spatial–temporal pattern analysis of city development in countries along the Belt and Road Initiative based on nighttime light data. Geomat. Inf. Sci. Wuhan Univers. 2017, 42, 711–720. [Google Scholar] [CrossRef]
- Pandey, B.; Zhang, Q.L.; Seto, K.C. Comparative evaluation of relative calibration methods for DMSP/OLS nighttime lights. Remote Sens. Environ. 2017, 195, 67–78. [Google Scholar] [CrossRef]
- Cao, Z.Y.; Wu, Z.F.; Kuang, Y.Q.; Huang, N.S. Correction of DMSP/OLS night-time light images and its application in China. Geoinf. Sci. 2015, 17, 1092–1102. [Google Scholar] [CrossRef]
- Small, C.; Pozzi, F.; Elvidge, C.D. Spatial analysis of global urban extent from DMSP-OLS night lights. Remote Sens. Environ. 2005, 96, 277–291. [Google Scholar] [CrossRef]
- Congedo, L. Semi-automatic classification plugin documentation. Release 2016, 4, 29. [Google Scholar] [CrossRef]
- Wang, Y.Y.; Li, J. Classification methods of land use/cover based on remote sensing technology. Remote Sens. Inf. 2004, 1, 53–59. [Google Scholar]
- Urban Overall Planning of Lhasa. Available online: http://www.gov.cn/zhengce/content/2017-08/08/content_5216625.htm (accessed on 10 January 2018).
Figure 1.
Architectural heritage site Xue Zhai Bridge surrounded by modern houses.
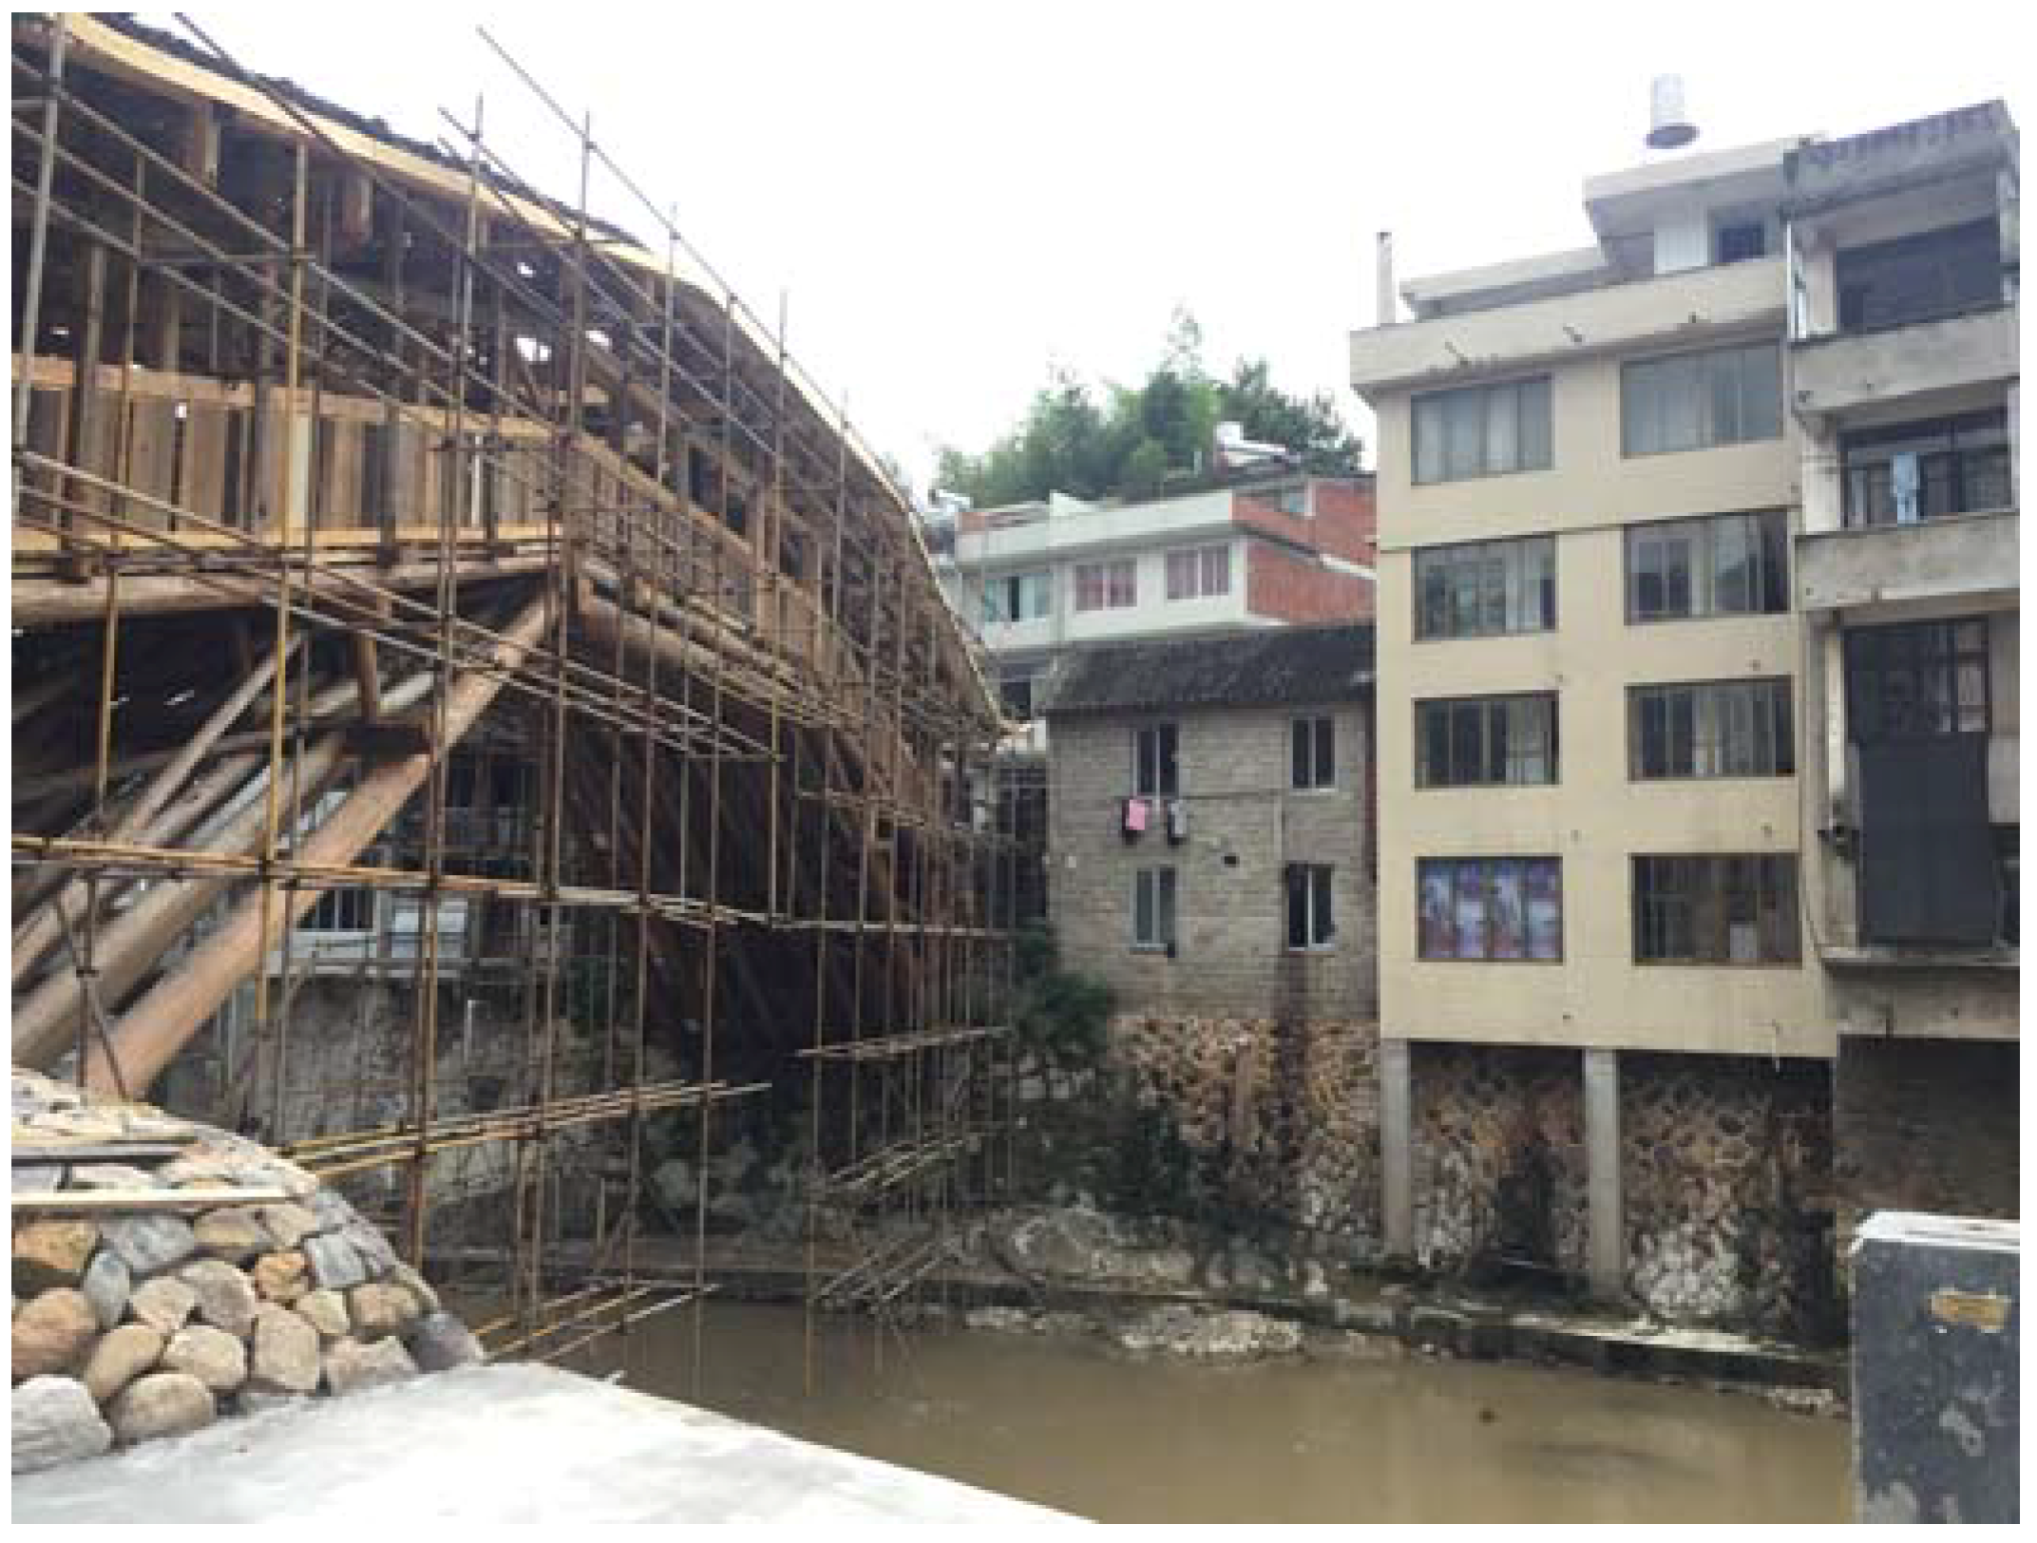
Figure 2.
Locations of Buddhist monasteries in the study area.

Figure 3.
NSL images of the Q-T Plateau and Lhasa: (a) 1993 NSL images of the Q-T Plateau; (b) 2003 NSL images of the Q-T Plateau; (c) 2013 NSL images of the Q-T Plateau; (d) 1993 NSL images of Lhasa; (e) 2003 NSL images of Lhasa; (f) 2013 NSL images of Lhasa.
Figure 3.
NSL images of the Q-T Plateau and Lhasa: (a) 1993 NSL images of the Q-T Plateau; (b) 2003 NSL images of the Q-T Plateau; (c) 2013 NSL images of the Q-T Plateau; (d) 1993 NSL images of Lhasa; (e) 2003 NSL images of Lhasa; (f) 2013 NSL images of Lhasa.

Figure 4.
The results of Un values of 152 monasteries from the Q-T Plateau analysis: (a) Distribution of Un values concentration of 152 monasteries on the Q-T Plateau in 1993; (b) Distribution of Un values concentration of 152 monasteries on the Q-T Plateau in 2003; (c) Distribution of Un values concentration of 152 monasteries on the Q-T Plateau in 2013; (d) The statistics of Un values of 152 monasteries on the Q-T Plateau from 1993 to 2013.
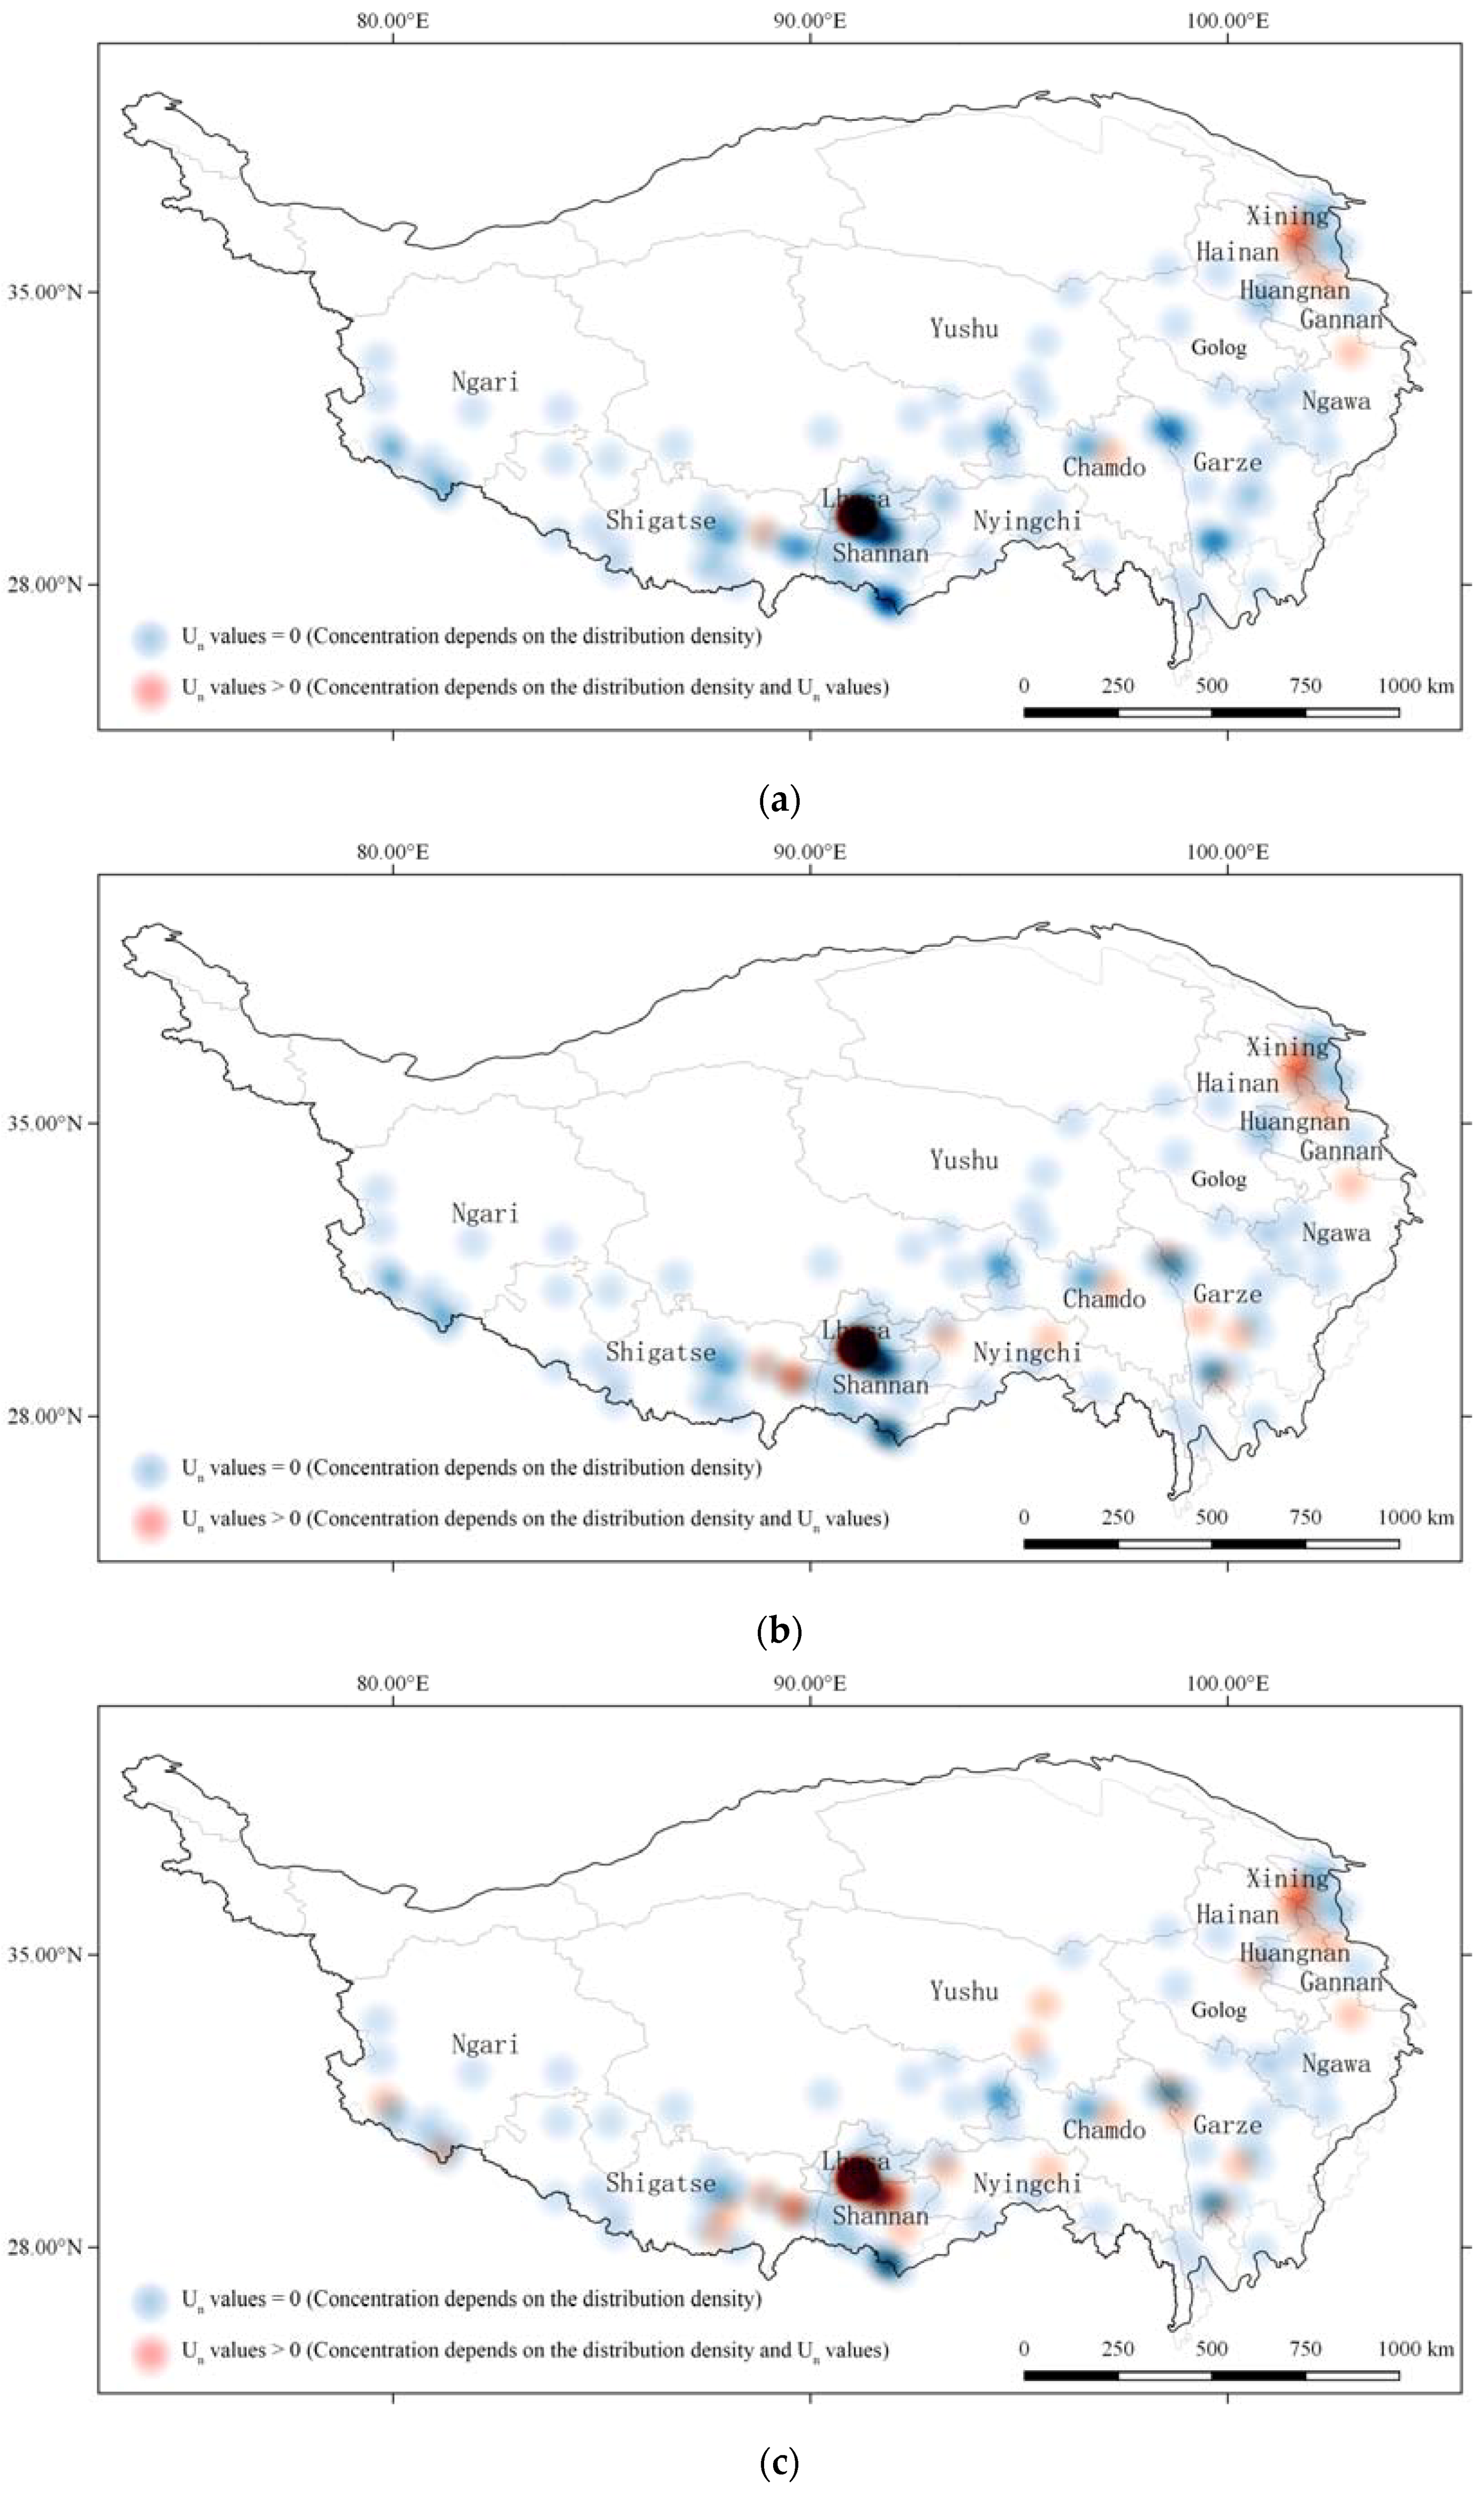

Figure 5.
The urban growth of Lhasa from 1993 to 2013.
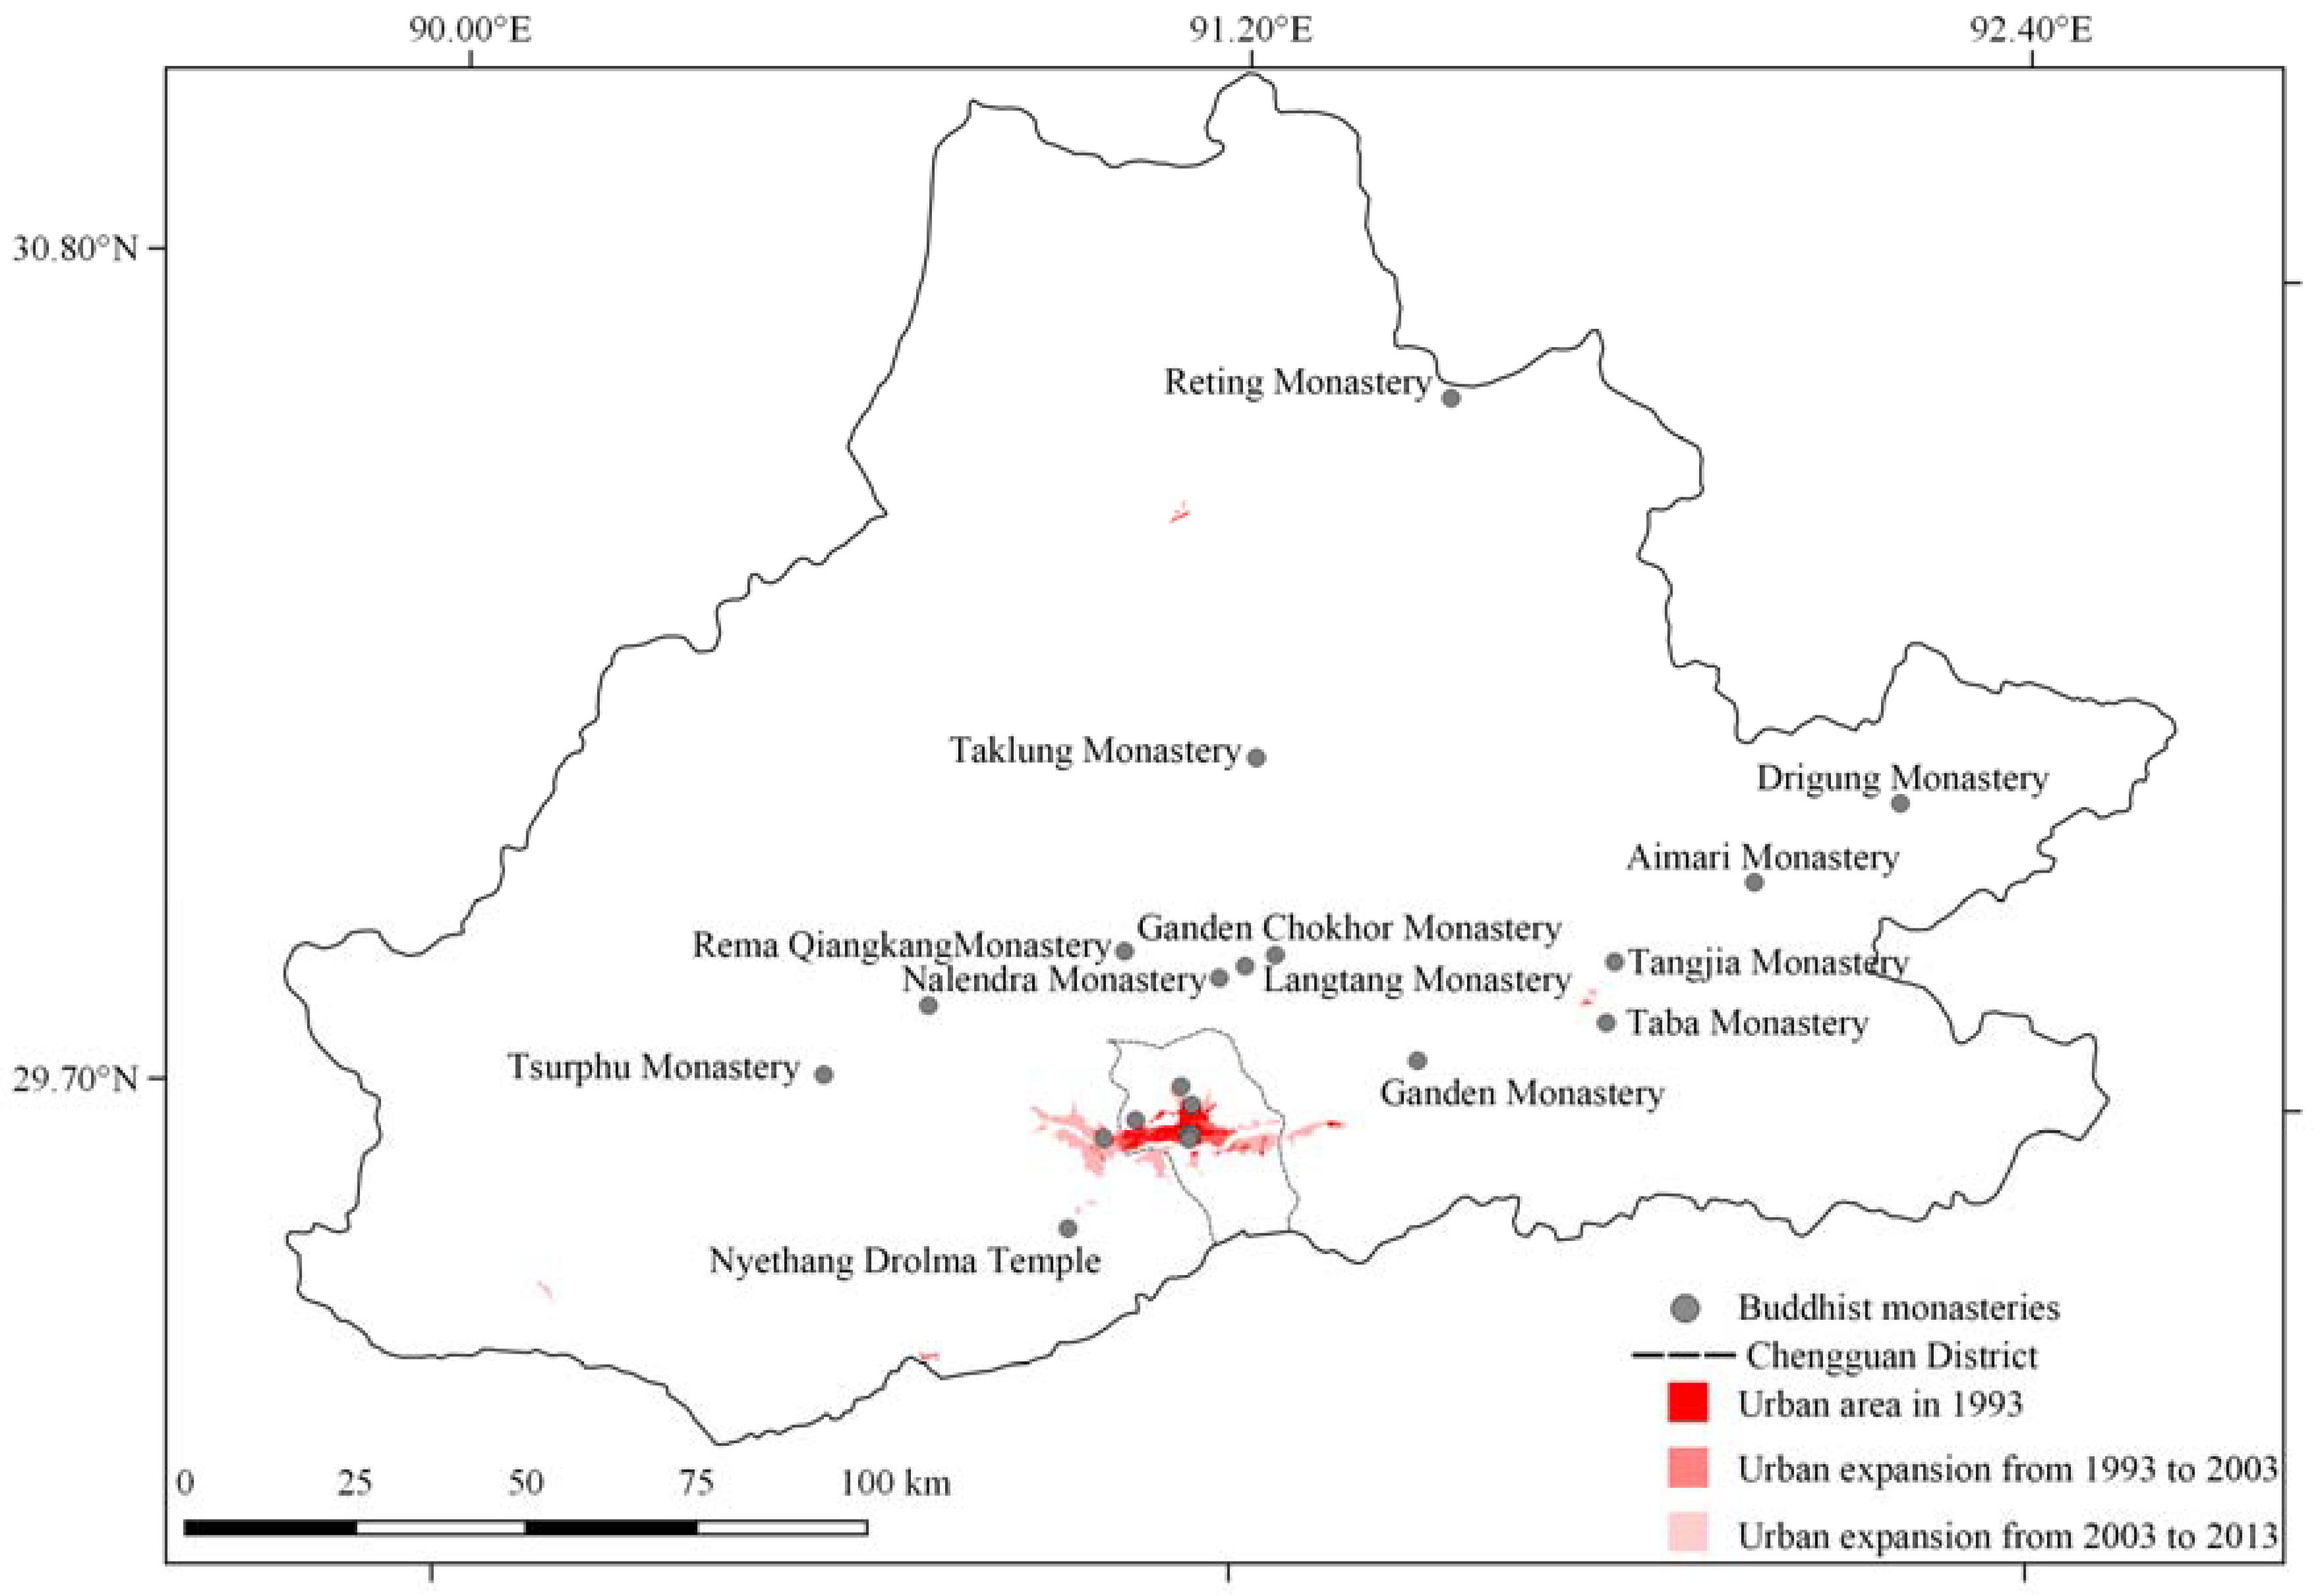
Figure 6.
Urban areas in Lhasa from 1993 to 2013: (a) 1993; (b) 2003; (c) 2013.


Figure 7.
The statistics of monasteries’ Un values in Lhasa from 1993 to 2013.

Figure 8.
Historical environment changes in Drepung within 1.5 km: (a) 1976; (b) 2003; (c) 2013.
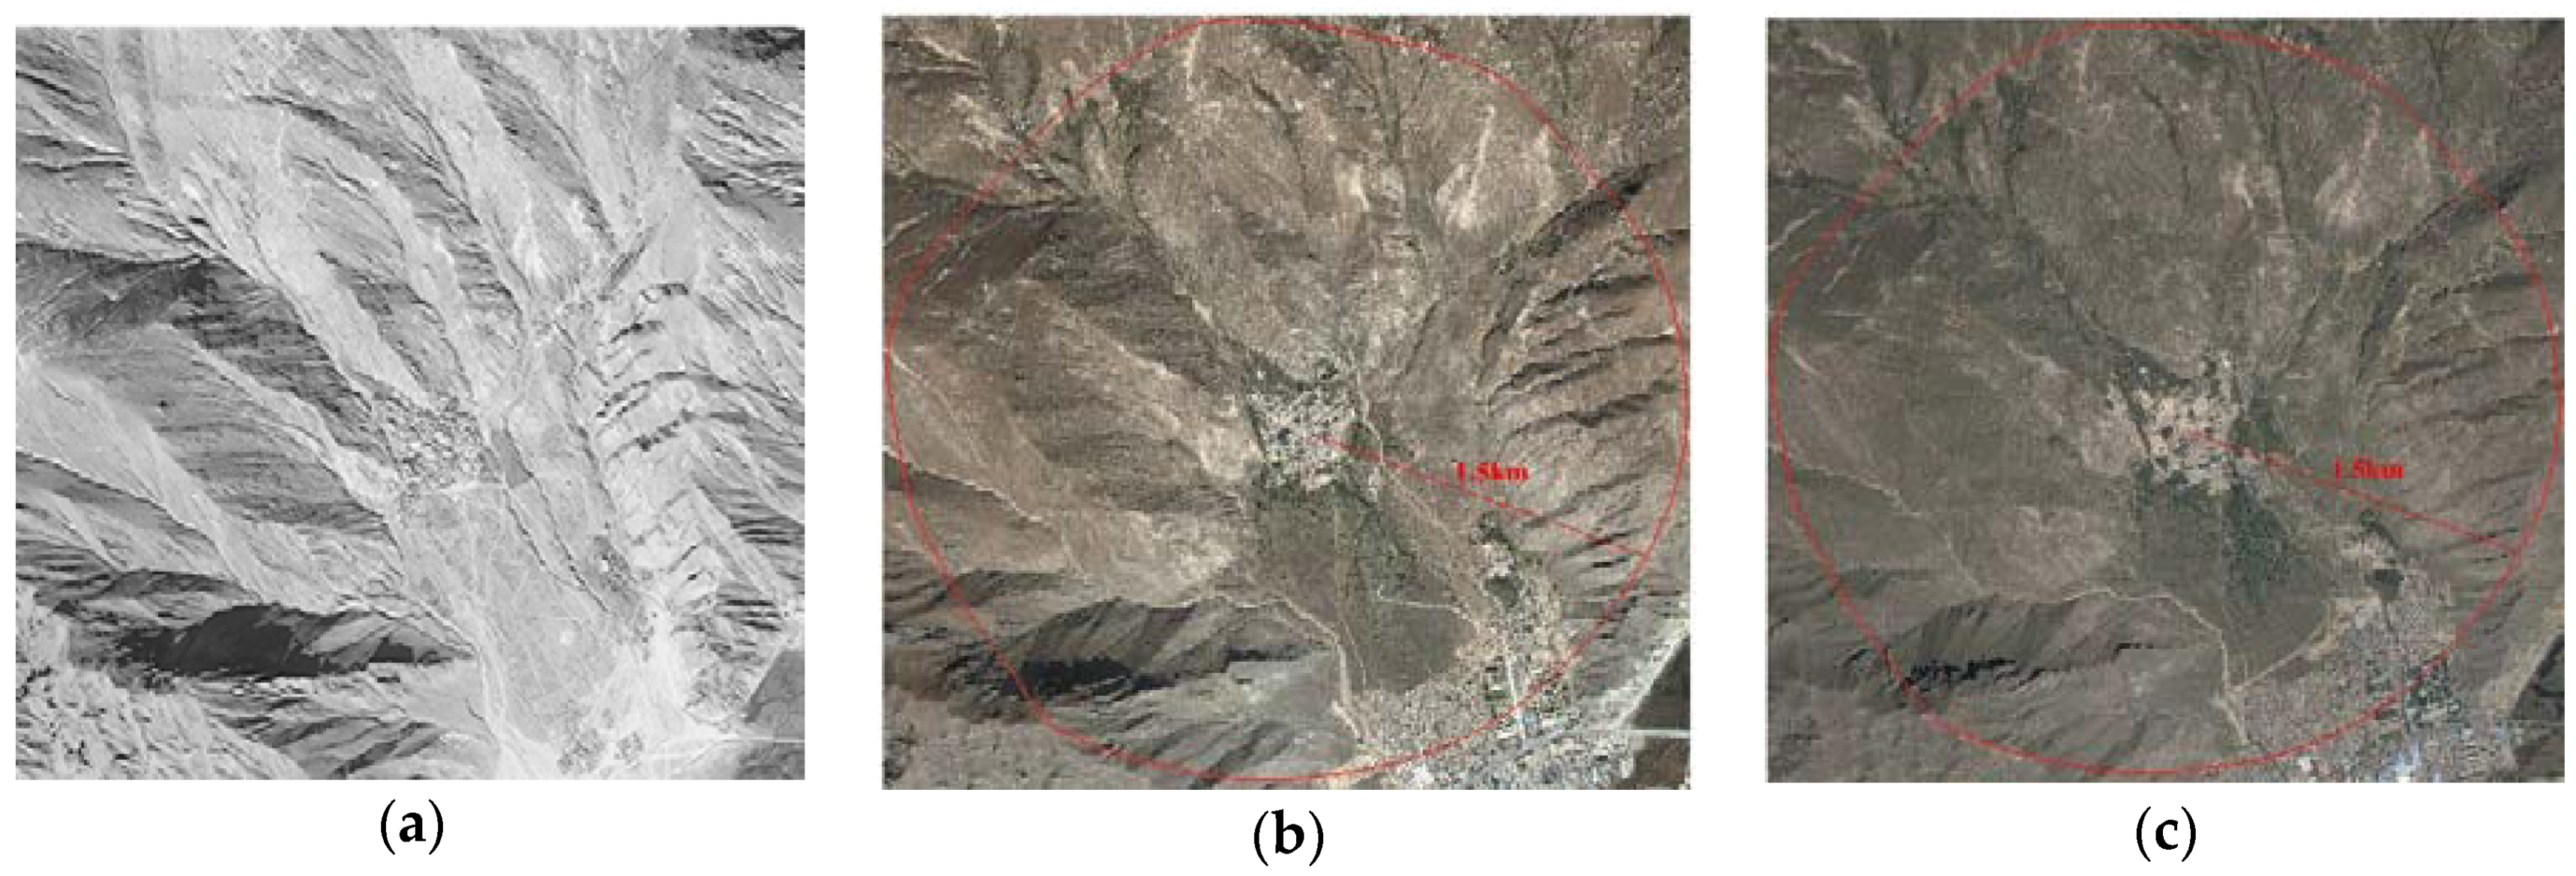
Figure 9.
Historical environment changes in Nyethang Drolma within 1.5 km: (a) 1976; (b) 2003; (c) 2013.
Figure 9.
Historical environment changes in Nyethang Drolma within 1.5 km: (a) 1976; (b) 2003; (c) 2013.

Figure 10.
Comparison of the arriving route to Palcho Monastery in 1959 and 2016: (a) In 1959; (b) In 2016.
Figure 10.
Comparison of the arriving route to Palcho Monastery in 1959 and 2016: (a) In 1959; (b) In 2016.


Table 1.
Data sources.
| Number | Satellite | Sensor | Spatial Resolution | Temporal Coverage |
|---|---|---|---|---|
| 1 | DMSP | OLS | 1 km | 1993, 2003, and 2013 |
| 2 | Landsat 5 | TM | 30 m | October 1993 |
| 3 | Landsat 5 | TM | 30 m | November 2003 |
| 4 | Landsat 8 | OLI | 30 m | November 2013 |
Table 2.
Sources of land-use classification in Lhasa.
| Year | Kappa Coefficient | Overall Accuracy (Percent) |
|---|---|---|
| 1993 | 0.82 | 95.94 |
| 2003 | 0.94 | 97.92 |
| 2013 | 0.98 | 99.26 |
© 2018 by the authors. Licensee MDPI, Basel, Switzerland. This article is an open access article distributed under the terms and conditions of the Creative Commons Attribution (CC BY) license (http://creativecommons.org/licenses/by/4.0/).
Share and Cite
MDPI and ACS Style
Zhang, Y.; Zhang, H.; Sun, Z. Effects of Urban Growth on Architectural Heritage: The Case of Buddhist Monasteries in the Qinghai-Tibet Plateau. Sustainability 2018, 10, 1593. https://doi.org/10.3390/su10051593
AMA Style
Zhang Y, Zhang H, Sun Z. Effects of Urban Growth on Architectural Heritage: The Case of Buddhist Monasteries in the Qinghai-Tibet Plateau. Sustainability. 2018; 10(5):1593. https://doi.org/10.3390/su10051593
Chicago/Turabian StyleZhang, Yingying, Hong Zhang, and Zheng Sun. 2018. "Effects of Urban Growth on Architectural Heritage: The Case of Buddhist Monasteries in the Qinghai-Tibet Plateau" Sustainability 10, no. 5: 1593. https://doi.org/10.3390/su10051593
Note that from the first issue of 2016, this journal uses article numbers instead of page numbers. See further details here.