How to Encourage Recycling Behaviour? The Case of WasteApp: A Gamified Mobile Application
by
 ,
,
Aguiar-Castillo Lidia
1,* ,
,
Rufo-Torres Julio
2,
De Saa-Pérez Petra
3 and 
Perez-Jimenez Rafael
1,* 1
IDeTIC, Universidad de Las Palmas de Gran Canaria, 35001 Las Palmas de Gran Canaria, Spain
2
Lightbee S.L., PCT Tafira, Edif. Poliv. III, 35017 Las Palmas de Gran Canaria, Spain
3
Universidad de Las Palmas de Gran Canaria, Dpto. Economia y Dirección de Empresas, 35001 Las Palmas de Gran Canaria, Spain
*
Authors to whom correspondence should be addressed.
Sustainability 2018, 10(5), 1544; https://doi.org/10.3390/su10051544
Submission received: 6 April 2018
/
Revised: 28 April 2018
/
Accepted: 9 May 2018
/
Published: 12 May 2018
Abstract
:Gamification lies in using elements explicitly designed for games in non-playful environments to achieve the player’s commitment and to encourage the development of specific behaviors. These tools can also be used as persuasion when it is intended to influence users’ behavior. The boundary would be in what we can call “gamipulation”—the use of game-design elements that impel the user towards undesired behaviors. Gamification has been identified as a promising strategy for achieving sustainable practice among citizens. Through an H2020 EU project, an application has been developed to attain these goals within the framework of some tourist cities. This study attempts to evaluate the intention to use this gamified-application based on premises such as expected benefits, expected threats, technical knowledge, and personal features. A theoretical model has been validated through a survey of 79 experts in some pilot cities before the use of the application. The results showed that only the expected social benefits and the perceived risks have a direct and significant influence on the intention to adopt the sustainability application based on gamification. Moreover, there is a moderating effect of perceived risk on the relation between expected functional benefits and the intention of using WasteApp. It is noteworthy that, although the perceived risks make the user recognize the functionality of the application with less intensity, these perceived risks do not make the user stop using WasteApp. Therefore, it is important to point out the implications derived from the study for the design of sustainability applications based on gamification, such as the need to give visibility of the user in the networks, to expose useful and difficult to obtain information from other sources, and to develop low-level game-design elements.

1. Introduction
One of the main problems that tourism destinations face is waste management, especially those with a high concentration of seasonal tourism versus a relatively small resident population. A poor waste collection and administration policy affects the sustainability of the destination from an ecological point of view and has a significant impact on the perceived quality of the tourist city by the traveller. This situation is further aggravated by the rise of accommodation models based on the collaborative economy, in which it is necessary for the voyager to interact directly with the waste collection and processing services at the destination. The information technologies offer solutions that can mitigate, at least partially, the problems generated by waste management to a tourist town, such as the adaptive organization of collection routes, depending on how full the waste bins are, and using sensor technologies and Internet of Things devices. Another possibility is the enactment of information policies on collection times, waste separation policies, etc., using social networks, to allow and facilitate a “green behaviour.” From a more coercive sight, one might consider implementing surveillance policies that penalize uncivil or unsatisfactory behaviour with the norms fixed by the destination, although promoting “good practices” in the tourist seems a more desirable actuation. For the latter, the use of Information and Communication Technologies (ICT) to support gamification approaches is an attractive alternative. This concept is based on the use of gaming techniques in non-playing environments, which offer unique possibilities for the creation of tools that educate in sustainable behaviour [1,2]. In some scenarios, gamification can help to guide individuals’ behaviour toward desired ends or stimulate their motivation when tedious and unrewarding activities are performed (such as finding a waste bin for recycling) [3]. In a similar vein, the gamification approaches, that aim the sustainability education of tourists and residents, have proved their effectiveness [4]. Gamification pretends to introduce game characteristics based on psychological and behavioural theories, besides elements of fun, play, and humor. The use of gamification, for the improvement of sustainable behaviour, demonstrates the adaptive capacity of the organizations to changing environments [5]. Gamification tries to promote intrinsic motivations towards some activities, using game design features and the use of points, leaderboards, feedback, badges, a search for achievements, and clear goals [6,7,8].
The primary aim of this study is knowing the acceptance of mobile gamification in the context of tourist city sustainability. In this case, gamification is used as an interface between tourists, organizations, and local communities to promote responsible and ethical behaviour [4]. Despite the fact that most tourists declare themselves in favour of sustainable tourism, the percentage of them that maintain a “green” behaviour during their holiday is scarce. The tourists, in general, are focused, during their vacations, in leading a more comfortable life than during their daily life, so it is difficult to convince them to adopt behaviours that take them out of their comfort zone [4]. The aim is to present a strong incentive that will lead them to search and to use the waste recycling areas. In light of this idea, a mobile application based on gamification has been developed.
Gamification has proved successful in many areas [9]. It takes advantage of fun, competition, rewards, and game mechanics in diverse environments to promote marketing practices, to motivate employees, or to bring about behavioural changes beneficial to society in the long run. For example, their ability to drive some individuals to engage in physical activity [10,11], to save energy [12,13], or to foster sustainable nutrition behaviour [14], has been widely corroborated [15]. Although gamification has, indeed, been used in education more extensively [16], gamification can influence the behaviour of citizens about events around so-called smart cities, such as e-government, tourism, culture, education, etc.
This work is framed in the field of sustainable tourism by recycling behaviours. In this sense, some innovative experiments have been made, such as the gamification of garbage cans with emoticons that reward the user with smiles and sounds [17]. Another interesting test is found in the called ‘bincam’, which consists of a camera that captures the image every time the recycling bin is used and uploads it to a social network. The application offers the visualization of the individual use of the dustbin. In this way, it not only encourages one’s own behaviour but also takes advantage of the social influence and dynamics of communications. It is a potential source of change in personal attitude and conduct [18]. On the other hand, the Volkswagen campaign called “The Fun Theory” presented several environmental interventions. “The World’s Deepest Bin” was placed in a public park, so that every time someone tossed something, there was a whistle that simulated a great depth and an explosion at the bottom. In a single day almost twice as much garbage was collected as the same trash can without the sensor. Within the same campaign, they added in a glass recycling bin a system of lights and points that encouraged people to insert the bottles in an individual hole to get positioned in lists of leadership. It was also a success that demonstrated that gamification achieves recycling behaviours in people.
The work is structured as follows: First, the developed application and its design are addressed. The theoretical background encompasses an adaptation of the technology acceptance model (TAM) and the theory of self-determination (TSD). Next, the methodology and the empirical approach are presented. The following section shows the analysis and the primary results. Finally, some discussion and conclusions are included.
2. Materials and Methods
This study is part of a global project under the EU research initiative H2020 in a consortium of 11 cities (Nicosia, Syracuse, Santander, Ponta Delgada, Lisbon, Tenerife, Dubrovnik, Nice, Copenhagen, Kavala, and Florence). The research proposal consists of the development of an application of gamification and geolocation that indicates the recycling points closest to the user situation and that, in return for their waste separation behaviour, provides a series of awards.
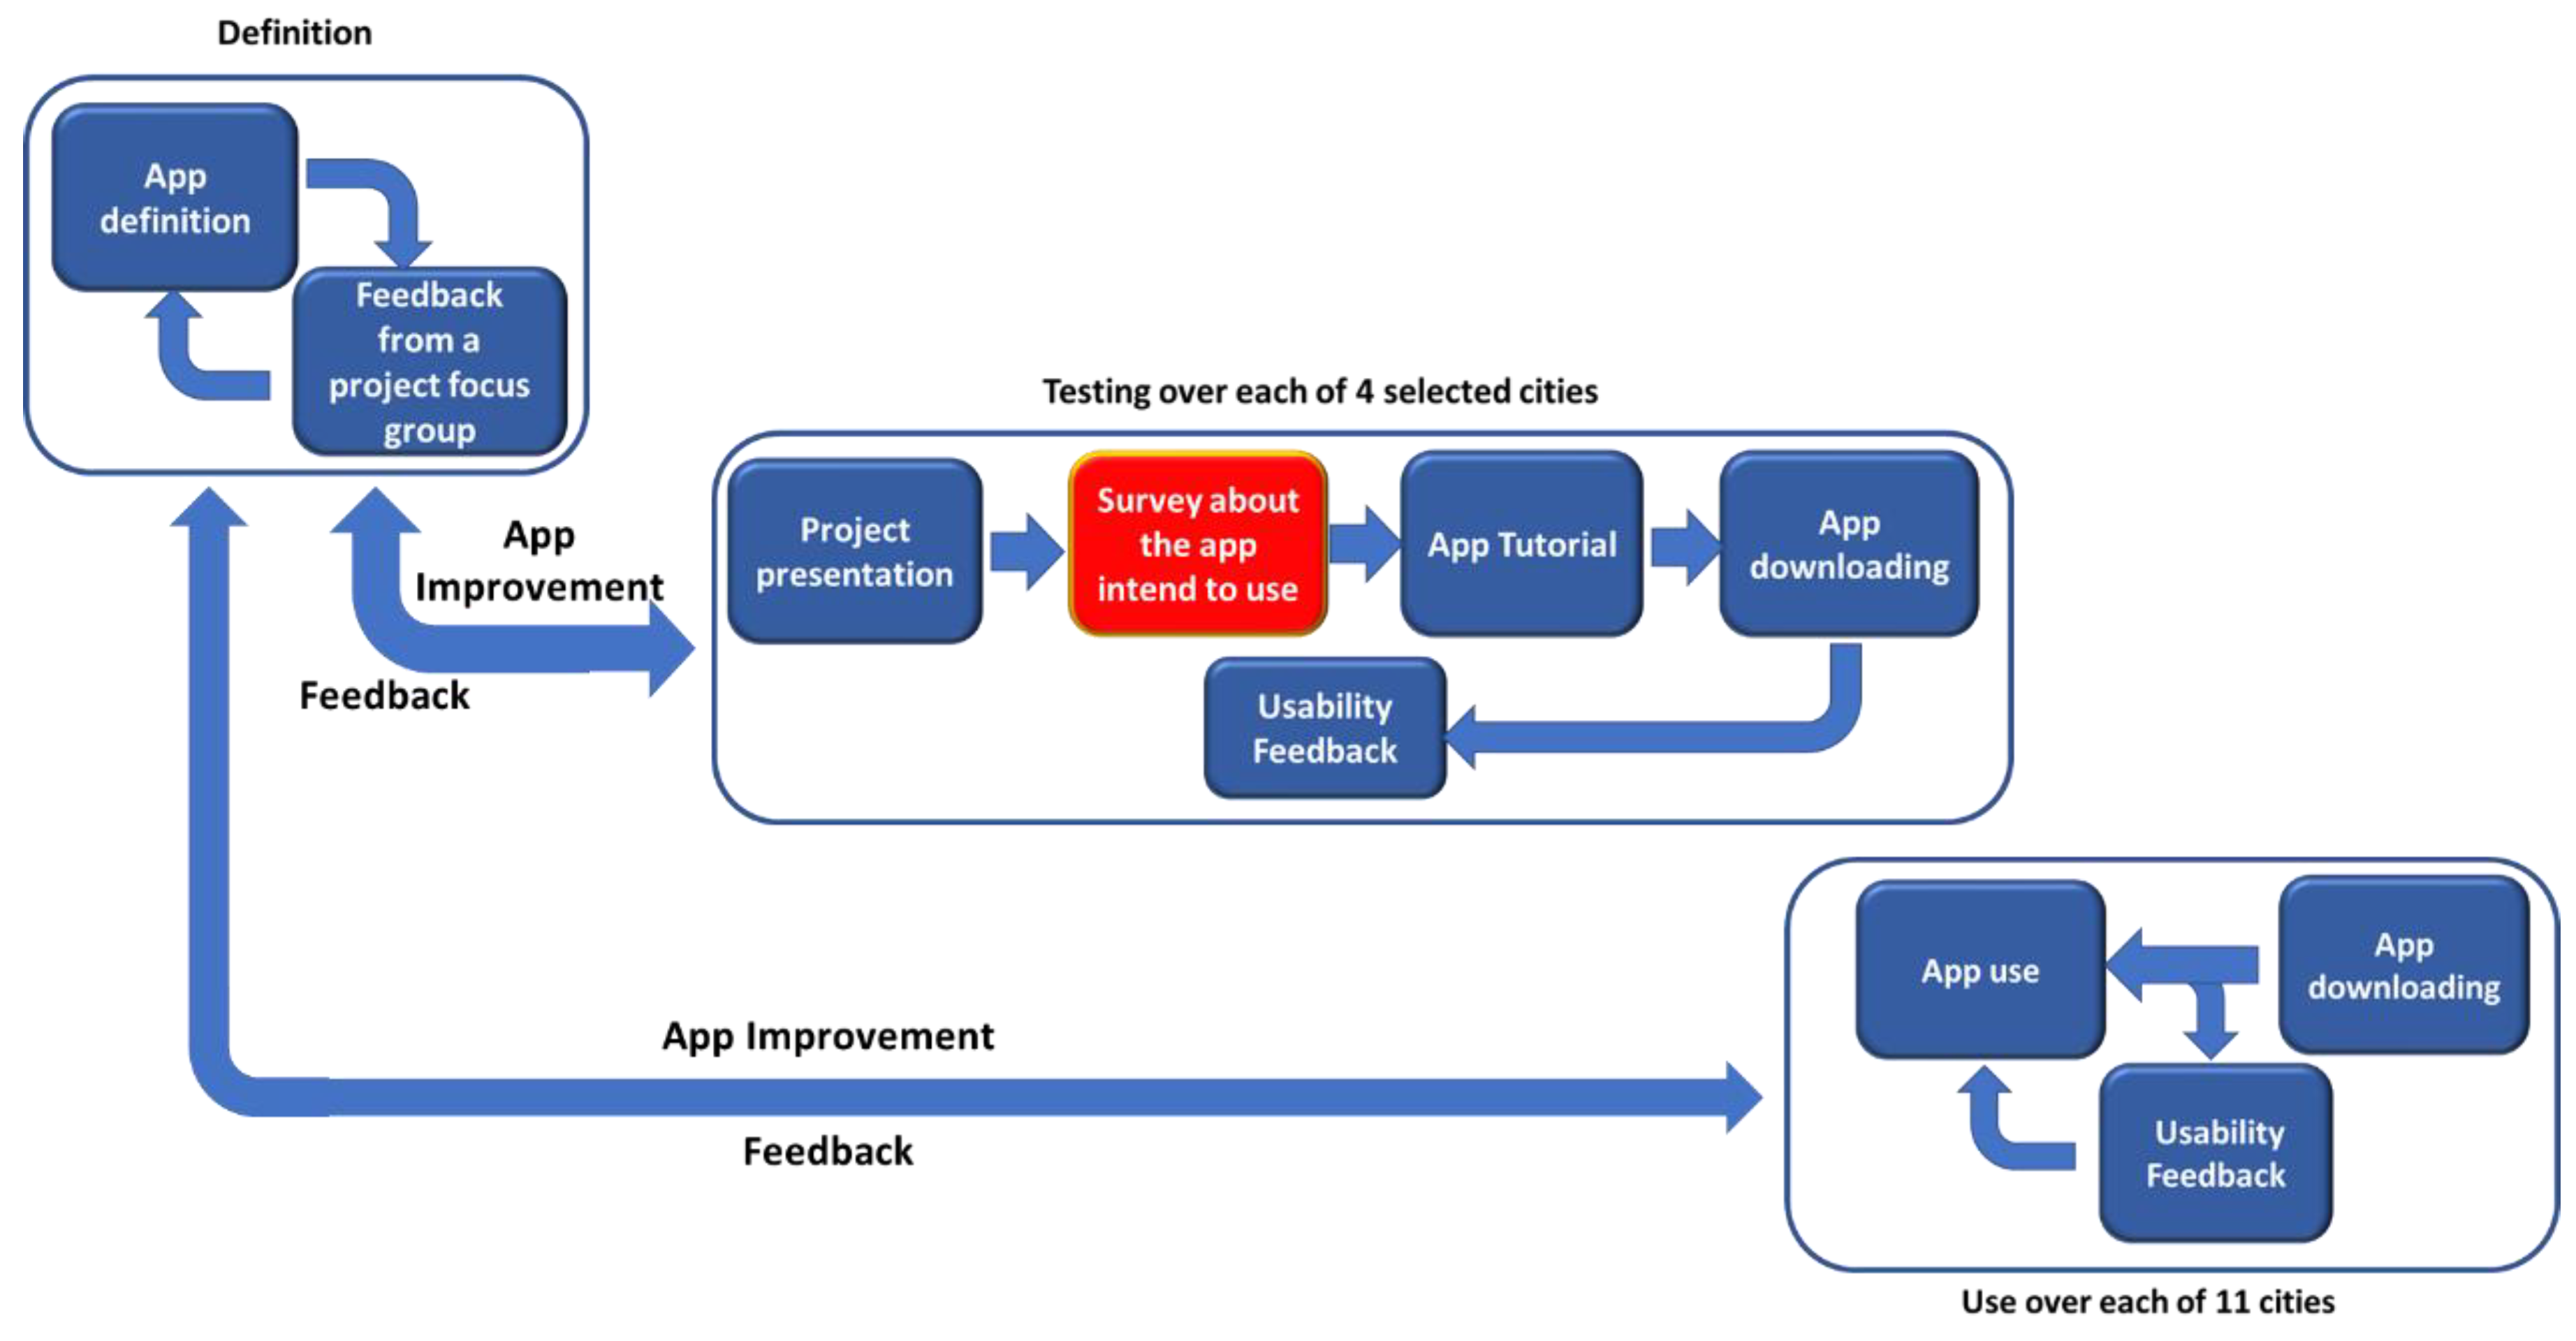
Regarding the overall app design, it can be roughly divided into three main phases: First, the application was defined and refined with the feedback from a technical focus group mainly included the engineers involved in the design and implementation. After that, a set of four pilot cities selected (Santander, Puerto de la Cruz, Ponta Delgada, and Nice) was used to verify the intent to use the application from a group of potential users. This task, marked in red in the block diagram (see Figure 1), has been used to the primary job explored in this paper. Thus, the outcome of this study was analysed to validate or to refute the hypotheses that have been presented in this work. Finally, the opinions of potential users were used to re-define the app before implementing the final version to be used in the whole set of participant cities. Nevertheless, continuous feedback from the app users is also obtained to enhance both utility and usability of the implemented application. The last phase of the project will involve the implementation of the process in eleven European cities, which will allow for more robust and more generalized data, with a more significant number of social and cultural environments.
2.1. WasteApp
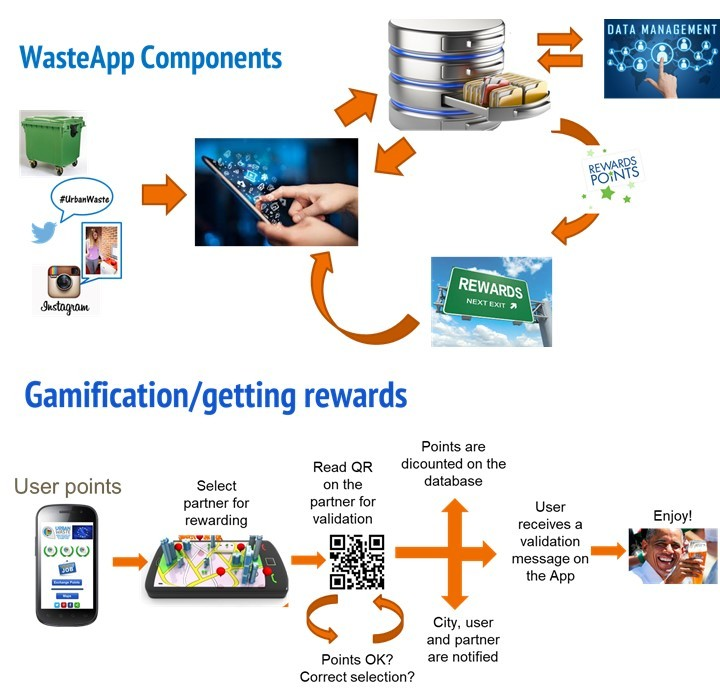
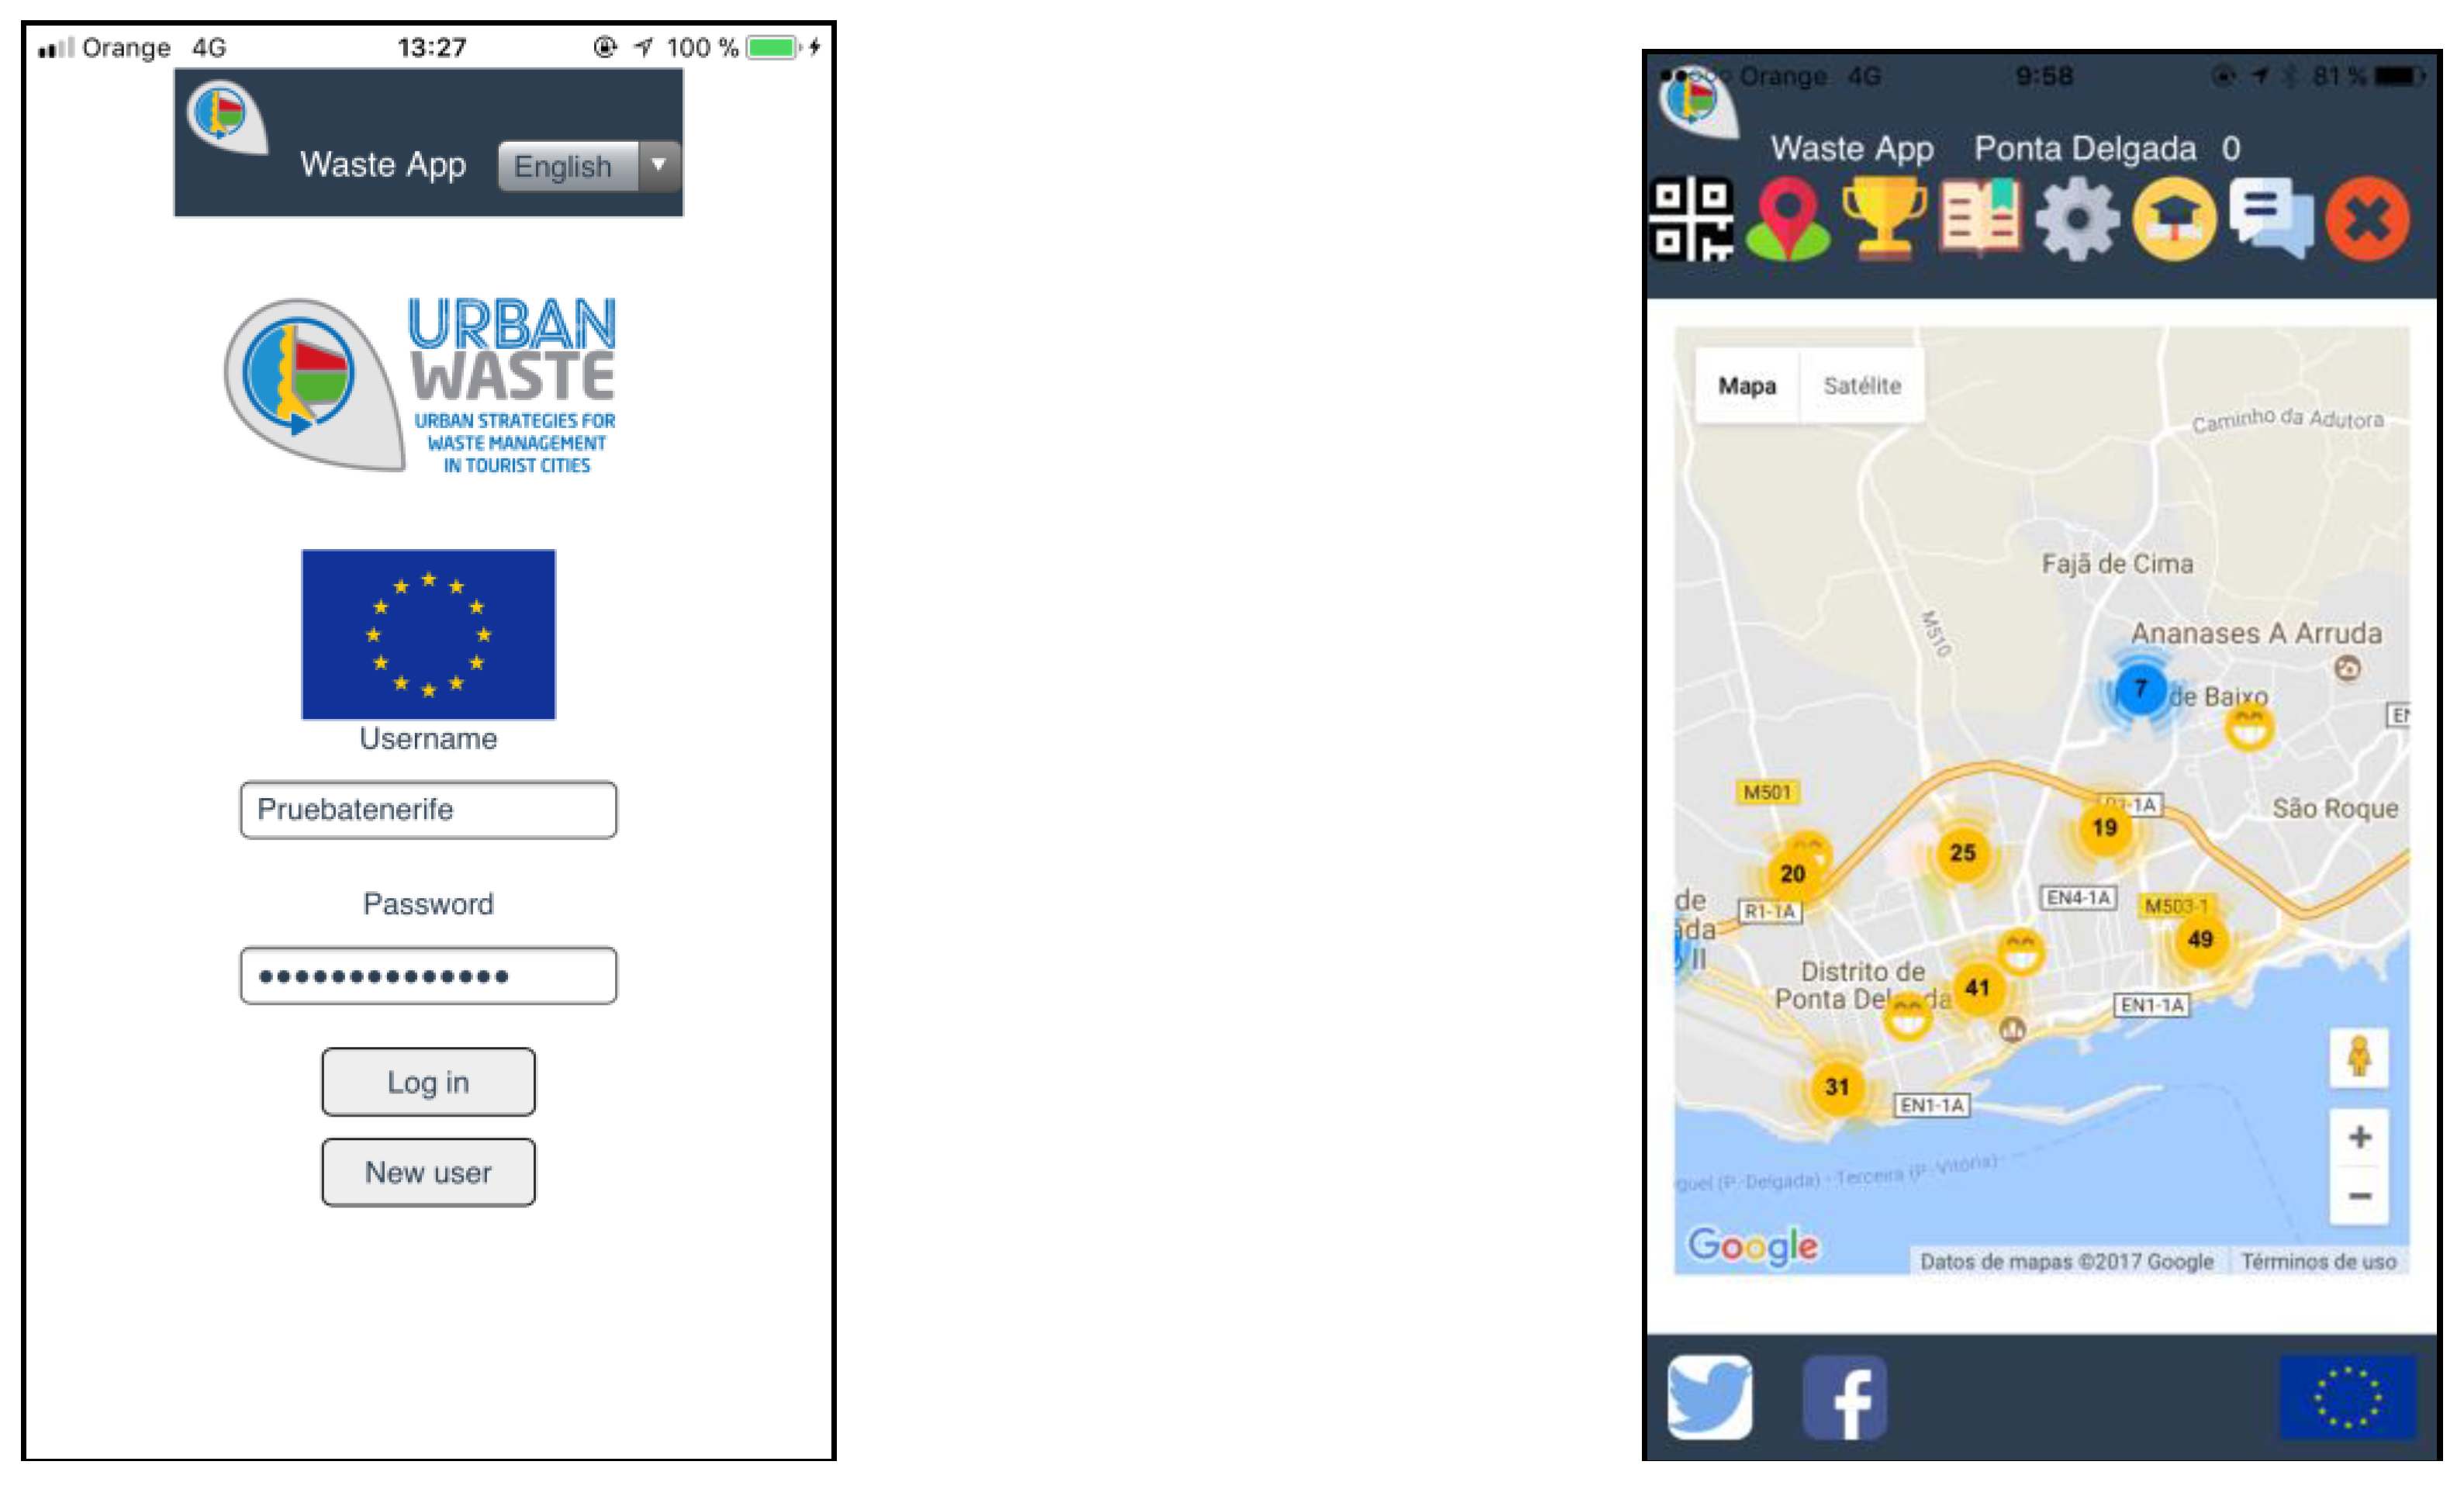
WasteApp is an application for mobile devices, which is part of the URBAN-WASTE H2020 project [19]. It is aimed at tourists in which a triple objective is pursued. On the one hand, it is intended to make users aware of the right use of infrastructures for the selective collection of waste; on the other hand, it is a question of using the application as a platform for an extensive gathering of data for further analysis concerning the tourists’ waste separation behaviour. Additionally, this application provides tourist information and collects complaints from users. Finally, it seeks to inform the user about policies and ways of recycling in each city, indicating waste collection points, collection times, and other data of interest to the tourist. The application follows a paradigm based on gamification to achieve the mentioned objectives. The proposed gamification relies on obtaining points that can be exchanged for prizes in the pilot cities of the URBAN-WASTE consortium. The mechanisms of securing points are the reading of QR codes located in the waste bins of the towns and the posting of comments on social networks using the project hashtag. These trashcans appear on a map provided by the application (see Figure 2). Furthermore, each city has an offer of awards that tourists can exchange for the corresponding points.
Privacy has been guaranteed since no personal data has been requested to avoid problems and compliance with European and national standards on data protection. Additionally, access has been provided through login and password identification, too, with a salt coding to improve security. Finally, the username and password are deleted to elude possible difficulties about the data.
2.2. Design of the Application
The gamified application has been developed using the MDA (mechanics, dynamics, aesthetics) paradigm [20]. According to the nomenclature of the framework, the following stratification is defined:
- Mechanics. In this layer, the algorithmic relationships and data structures that make up the game are established. Within this level are the databases, the definition of variables, and the algorithmic model of the game. In the case of WasteApp, the mechanics are based mainly on an SQL (Structured Query Language) database in which the waste bin positions of the selective waste collection, the programming of QR codes, and the algorithm of gain and exchange of points are stored.
- Dynamics. The dynamics include the user’s utilization of mechanics and the interactions of the internal structures of the game itself. For WasteApp, it is mainly the process of obtaining points through the reading of QR codes and the subsequent exchange for prizes.
- Sensations. The final objective of the game is to evoke an emotional response from the user. In this case, the target is directly related to three primary mechanisms: the implicit reward of knowing that contributes to the sustainability of the place visited, obtaining points and, finally, the tangible reward received (see Figure 3).
Other restrictions were:
- The game must run on both IOS® and Android®.
- The game philosophy is based on a points-reward strategy in which the users obtain points by reading QR codes located on waste bins.
- Each city must be independent.
The last constraint, which comes from the project’s proposal itself, directly drives the game to a Challenge-oriented one. The sensations to be evoked on the user include the following:
- Usefulness. The app aims to provide a useful tool to the users.
- Challenge. The users are encouraged to keep on using the application looking for rewards.
- Social/Ecology conscience. The project’s background is intended to transmit to the users.
- To fulfil the above aesthetics, the simple mechanics proposed in the first place were:
- The users have information about the waste collection infrastructure on an interactive map.
- The users earn points by reading QR codes on the waste bins. Each city has a prize catalogue, and the needed marks are fixed to look for hooking up and not discouraging users.
- Some eco-tips (waste related ecology tips) are displayed on the users’ screens after they read QR codes. Additionally, some points are provided for tweeting using the project’s hashtag.
- Each city has its independent database.
In a lower level of description, the application had not only a mobile-based interface, but also a relational database in MySQL and a server-side backend in PHP (Hypertext Preprocessor) both developed to process the information. Under this framework, the programmer and end-user sides address the design, since the MDA flow is bidirectional.
2.3. Implementation Details
The implementation has been carried out using the PhoneGap Cordova® multi-platform, which compiles the software for both IOS® and Android. The relational databases involved in the project have been implemented in MySQL®. QR codes have been designed to give the tourist’s position and the points associated with the particular waste bin (see Figure 4).
3. Theoretical Framework and Hypotheses Development
This paper proposes a conceptual model that explains those factors that influence the intention of using a gamified application to promote the recycling behaviour of tourists. To that end, the technology acceptance model (TAM) has been adapted to evaluate the intention to use the technology, as a previous phase of the technology acceptance that could have an application that encourages the recycling behaviour. Therefore, the study focuses on the balance between costs and benefits that underlies this model, where perceived functionality is an essential factor for the technology acceptation [21]. However, since both the social and hedonic aspects seem fundamental in an application based on gamification, the extended TAM, as well as the Self-Determination Theory (SDT), have been used to support the hypotheses that will be presented [22]. As Changsok [23] argues, gamification applications in smart tourism have an inherent hedonistic value of game mechanics.
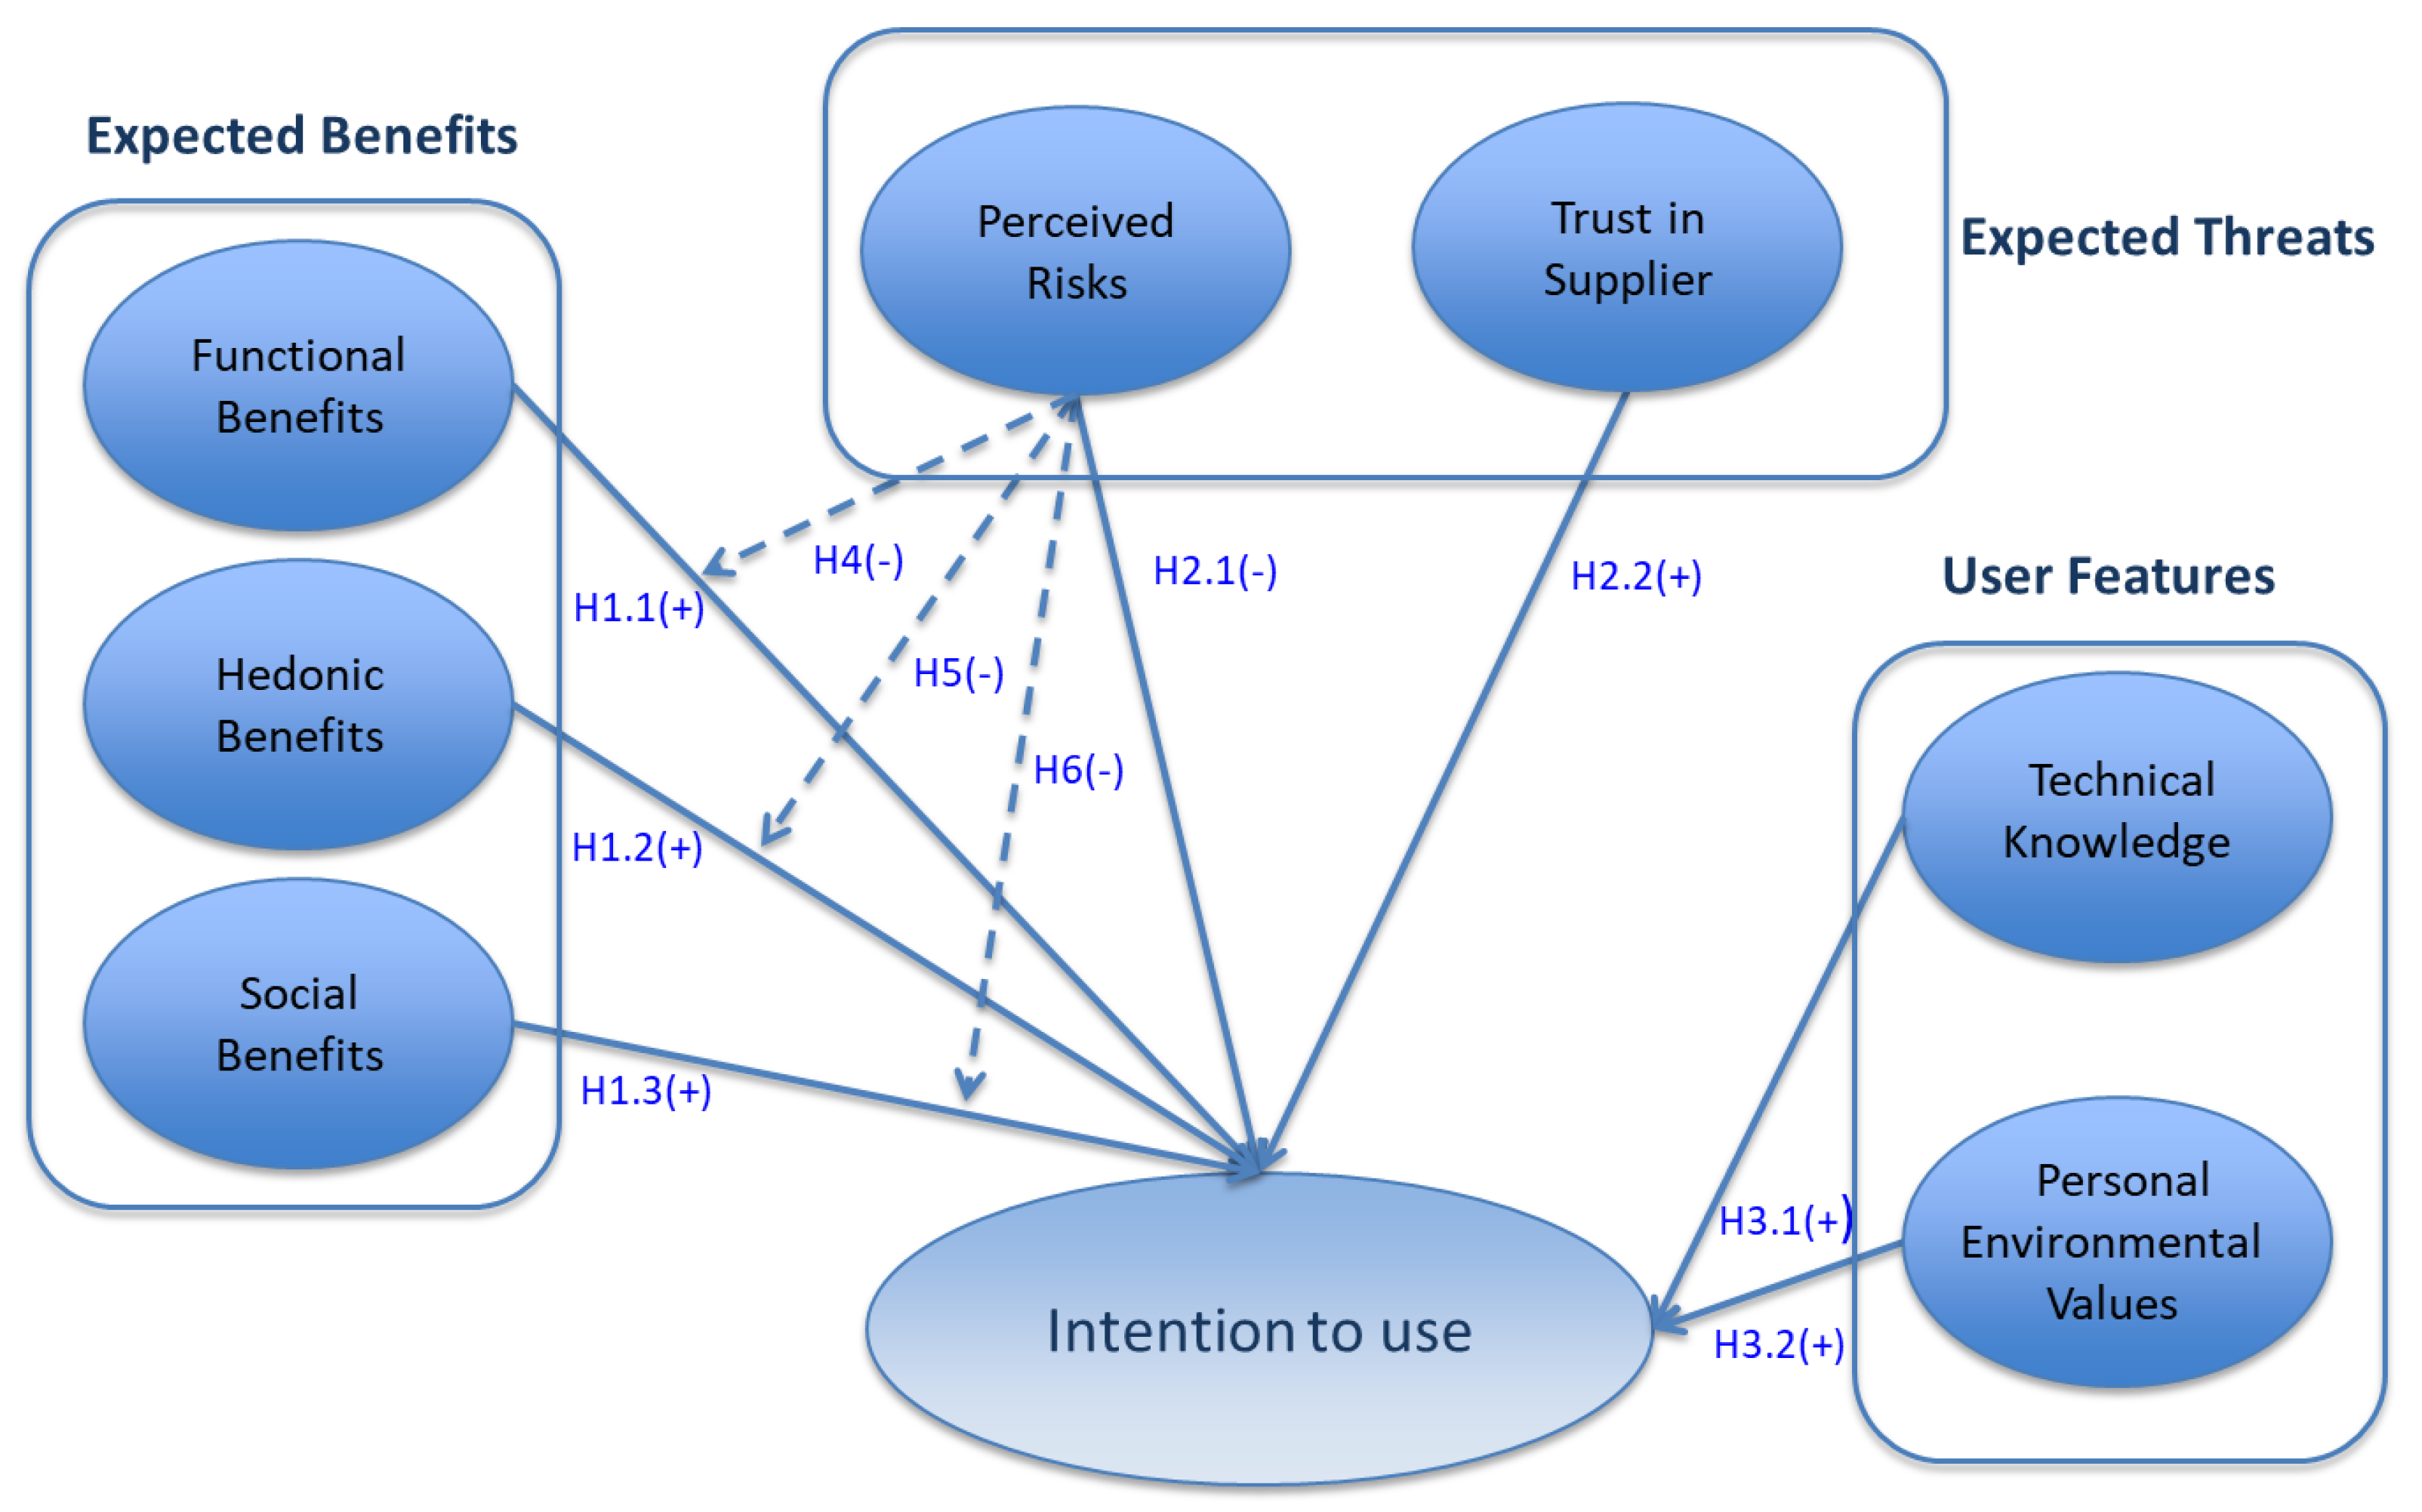
The research establishes empirically verifiable hypotheses that explore the cause-consequence relationships of expected benefits, threats, and user features with the reaction of the user to the designed application, as shown in Figure 5.
3.1. Expected Benefits
Perception of benefits is critical in determining the user’s reaction, and whether they will disclose private information in return for the expected benefits. It appears that an attribute of sustainability is not sufficient to motivate a particular behaviour in a consumer. The SDT [24] states the existence of two types of motivation: intrinsic and extrinsic. Intrinsic motivation consists of the realization of activity by itself, rather than by its separable consequences. Individuals tend to participate in activities regardless of the reward they can obtain from its attainment. In contrast, extrinsic motivation consists of executing operations to earn tangible rewards [25]. In the gamification context, the features of the user could influence in the “amplification of the intrinsic values.” [26] Only if the user is inclined towards green conduct, the expected benefits will further encourage their sustainable actions [27].
The user of a technology expects advantages and some authors identify economic and utility, hedonic and symbolic benefits. Economic and utility benefits are related to quality products and proven functionality. However, hedonic benefits are linked to the discovery, entertainment, sensing, and emotional satisfaction that may result from the use of applications. Symbolic advantages are related to membership and recognition that one may have regarding particular status, respect, esteem, and consideration [28].
Some studies have shown that mobile users are familiarized to the use of some technologies and, consequently, to their benefits. An example of those techniques is the use of Radio Frequency identification (RFID) tags and their associated benefits [29]. In this study, the QR codes that the user should scan in the waste bins also fits the benefits of the adoption of technology theory [30].
Furthermore, researchers also argue that the level of user participation in technology depends on the expected functional (information acquisition), social and hedonic benefits [31,32]. Based on these premises, the following hypothesis is proposed:
Hypothesis 1.
Expected benefits are positively associated with the user’s intention to use the gamified application. It has three sub-hypotheses:
3.1.1. Expected Functional Benefits
The relationship between functional benefits and user participation is a major factor in determining the adoption or rejection of a mobile tourist application in the course of a trip since one of the fundamental motivations of travellers is to obtain useful information for their stay [33]. The tools available in the applications enable the travellers to keep up to date on those sites that they may be interested in [31], in this case, those points where they can recycle waste. Thus, the following hypothesis is proposed:
Hypothesis 1.1.
Expected functional benefits are positively associated with the user’s intention to use the gamified application.
3.1.2. Expected Hedonic Benefits
If we consider gamification from the perspective of the extended TAM, and especially perceiving information systems as utilitarian, the literature suggests that the perceived utility mainly motivates the use of useful information systems and hedonism by perceived enjoyment [21,34]. Additionally, other authors [8] indicate that both utilitarian and hedonic expected benefits strongly drive the use of gamification. Based on these premises, the following hypothesis is proposed:
Hypothesis 1.2.
Expected hedonic benefits are positively associated with the user’s intention to use the gamified application.
3.1.3. Expected Social Benefits
The benefits derived from gamification can act as determinants of the intention to use the technology. In general, the user’s reaction is based on the belief that specific results are associated with particular behaviours. Furthermore, attitudes toward behaviour and social influence are reliable predictors of the intention to act [35,36].
On the other hand, when ideologies such as sustainability and green consumption are involved, they are influenced by both reputation and economic concern [37]. This idea is supported by the SDT [38] that postulates that the motivations for consumer behaviour may be intrinsic and extrinsic, with the first emerging from the enjoyment related to the given activity, while the latter is connected to external social pressure, such as reputation. Thus, the following hypothesis is proposed:
Hypothesis 1.3.
Expected social benefits are positively associated with the user’s intention to use the gamified application.
3.2. Expected Threats
There is proven evidence to demonstrate the use of approaches by mobile users to limit the access of the technology to their private areas. Some of these detected strategies are information retention, deception, and the search for information that helps users manage perceived threats in their relationships with technology. All this provides a foundation for the extended Communications Private Management (CPM) theory [39].
Hypothesis 2.
Expected threats are negatively associated with the user’s intention to use the gamified application. It has two sub-hypotheses:
3.2.1. Perceived Risk
The perceived risk is the consumer’s perception of the uncertainty and adverse consequences that may result from a particular service. This perceived risk is a significant factor influencing the reaction of the user in the intention to use the technology. This fear exists when consumers cannot adequately predict the consequences of their behaviour and, in this sense, several studies show that perceived risk has a negative impact on consumer attitudes [40].
In support of these claims, a study by Pew market research centre found that the collection by firms of personal information through mobile devices, search engines, and websites causes particular anxiety in consumers. This concern has come at the point to that 68% of users are against personalized advertising [41]. This reaction is well supported by industry data showing that consumers increasingly rely on technologies that allow them to block ads from websites or arrived via mobile [42], to avoid undesired e-mails [43], and to register in follow-up lists [44].
When consumers are called upon to interact with technology, this can be perceived as intrusive, especially when users are aware of threats to their privacy [45]. The threat to privacy is a primary component to be taken into account in customer perceptions when interacting with some technologies, such as QR codes [46,47,48]. Sensitivity to privacy influences the reaction of consumers to the adoption of new technologies. For example, several studies [49,50,51] state that RFID may be associated with adverse reactions due to ethical and confidentiality issues arising from its use. From these premises, the following hypothesis is proposed:
Hypothesis 2.1.
Perceived risk is negatively associated with the user’s intention to use the gamified application.
3.2.2. Trust in the Supplier of the Application
Research related to the adoption and acceptance of technologies involving personalization on websites and mobile phones suggests that confidence in the provider and their ethical practices play a critical role in user attitudes and behaviours [52,53,54]. In such a context, consumers are less cautious about sharing their data when they have confidence in the provider of the application that collects them [55]. Moreover, perceived trust and risk are two of the major components that contribute to user privacy concerns [56]. Historically, confidence works in conjunction with recognized danger in predicting behaviours, and the confidence-risk binomial is considered the most influential variable in technology acceptance or rejection response [57]. From these premises, the following hypothesis studied is proposed:
Hypothesis 2.2.
The trust in the supplier is positively associated with the user’s intention to use the gamified application.
3.3. User´s Features
It has been found that the lack of specific technical knowledge is an antecedent of the adoption or rejection of the consumers of new technologies. Users with limited RFID or QR knowledge, or less experience with these techniques, perceive the technological attributes as less relevant than those with a great deal of experience and expertise [58]. Moreover, several studies confirm that the user’s own beliefs are strongly determinant of the acceptance of gamification [59]. If the activities that are being gamified already have an intrinsic value to the individual, then their gamification can improve the motivational stimuli of the participants, mainly if the game narrative covers essential aspects of the experience. If players are not involved in the gambling activity, the mere insertion of gaming tools, in particular, if it is spoken of extrinsic rewards, will not adequately incentivize the individual to take any action [26,60].
Hypothesis 3.
The user’s features are positively associated with the user’s intention to use the gamified application. It has two sub-hypotheses:
3.3.1. Technological Knowledge
Within proximity marketing, some premises that can influence the consumer when approaching the service, such as sensitivity to privacy [29] and technology-related anxiety which has already been previously exposed, and a lack of technological know-how [61], have been detected.
This lack of knowledge can cause the user to be suspicious and to believe that some chips cannot be merely deactivated, that information is being provided to the supplier without the consent of the user, or that they take over sensitive data, such as those associated with credit cards. Moreover, consumers may believe that their geolocation data is being used by companies or governments for illegal purposes [62].
On the other hand, lack of knowledge means that consumers are not aware of how their behaviour and private information can be used by different entities and for very different purposes [63]. From these premises, the following hypothesis is proposed:
Hypothesis 3.1.
The technical knowledge is positively associated with the user’s intention to use the gamified application.
3.3.2. Personal Values
The CPM theory states that individuals maintain an internal dilemma between privacy and disclosure of their data, whether or not to share private information with others. The primary driver behind this decision is the individual value judgment of risks versus the benefits of revealing concrete data in a given context, all moderated by their motivations, culture, and gender [64,65].
As Roux [66] says, “human beings are the result of the structuring of habit, praxis and values largely influenced by culture—including the consumer subculture—from which they cannot escape.” In the same way, Rokeach [67] developed a scale of values and identified two categories: terminal and instrumental. The former applies to individuals’ long-term goals, while the latter relates to how they should behave over time to reach their long-term targets [68].
Straughan and Roberts [69] identified that green consumer behaviour is driven by the “...belief that people can play a significant role in the fight against environmental destruction...”, a statement consistent with the results of the research that explore the psychological benefits that emerge from the contribution of the person to the ecological common good [70,71]. The way to revive long-term behaviour that is intended to be stimulated in the short term could be addressed by introducing a process improvement mechanism and incentive tools that support psychological benefits in parallel to others in the form of external rewards [72]. In another sense, some authors speak of the “pro-environmental consciousness,” which is fixed to broader personal values and shaped by personality traits, as well as by other social and cultural factors [73]. From these premises, the following hypothesis is proposed:
Hypothesis 3.2.
The environmental values of the users are positively associated with their intention to use the gamified application.
3.4. Moderating Effect of Perceived Risk on the Relationship between Expected Benefits and the Intention to Use the Gamified Application
Several researchers have shown that the perceived risk exerts a substantial inhibiting influence on other variables, such as the utility. The users of the applications understand the risks as something relevant that can influence the intention of use through the expected functional benefits and, therefore, feel the need to control them. This perception of danger offers a moderating effect on the influence that the expected functional benefit exerts over the adoption of technology, inhibiting the intention to use it. It is a cost-benefit relationship; the users decide whether the benefits that they expect will compensate them for the possible risk they may incur when downloading the application [74].
In fact, the perceived risk moderates the impact of congruence on the user’s assessments when faced with the decision to adopt or not adopt the technology. Only on occasions when potential users do not expect any risk the moderating effect on adoption is positive [75]. From these premises, the following hypotheses are proposed:
Hypothesis 4.
Perceived risk has a moderating effect on the relationship between expected functional benefits and the intention to use the gamified application.
Hypothesis 5.
Perceived risk has a moderating effect on the relationship between expected hedonic benefits and the intention to use the gamified application.
Hypothesis 6.
Perceived risk has a moderating effect on the relationship between expected social benefits and the intention to use the gamified application.
3.5. Intention to Use Mobile Gamification Technology
In this study, the attitude towards the utilization of the application refers to an evaluation of whether the system, a priori, is accepted or not [35,36]. A strong relationship between attitude and intention to use has been demonstrated [76,77]. According to the theory of planned behaviour (TPB), individuals behave according to their intention of response [78]. This intention of behaviour, plan to use the application will depend on three factors:
- Attitude toward the intention to use the app, that is, the perception of the individual as good or bad behaviour.
- Subjective rules, that is, the social pressure perceived by the person to adopt that technology.
- Control of perceived act, or the perception of ease of use of the application.
4. Methodology
This section describes the methodological procedure used to empirically analyse the factors that affect the adoption of the gamified sustainability application.
4.1. Sample
This study has been based on the data obtained in the first survey conducted to 79 experts to evaluate the intention to use the gamified application. Data was collecting during November and December 2017, and January 2018, and a database was constructed on the same server that hosted the survey. Therefore, this is a convenience sample of the experts who collaborate in the WasteApp validation phase during the EU-funded project.
Regarding sample profile, data in Table 1 evidence that the percentages of male and female respondents are not similar, males (60.8%) have participated at a more significant rate than females (38.0%). Since the spirit of the project is consistent with the gender policy, a third gender has been considered that has been called “other.”
Related to the age, the most extensive group (32.9%) was around 25 to 34 years old. Moreover, considering that 45.6% of respondents are younger than 34 years old and 54.4% are older than 34 years old. Concerning the educational level, a high level of higher education is observed; in fact, most of the sample have a bachelor or a master’s degree (81.0%). Regarding occupation, a high proportion of respondents (48.1%) are professionals who require the high qualification to support their jobs.
4.2. Variables
All of the variables were measured using scales adapted from previous studies. The research model is composed of the following variables:
- Expected Benefits were measured from the model proposed by Wang and Fessenmaier [79] regarding the active participation of members of a travel community.
- ∘
- ∘
- ∘
- All items were measured on a seven-point Likert scale in which 1 = strongly disagree, and 7 = strongly agree.
To analyse the dimensionality of the scales previously mentioned an exploratory factor analysis with varimax rotation was conducted (see Table 2). Before the implementation of this method, the statistical suitability was analysed using Bartlett’s sphericity test and the Kaiser-Meyer-Olkin index. The results of the factor analysis confirm the one-dimensional character of the scales, except for the variable “personal environmental values,” in which two factors were identified. The first one denominated “recycling significance” and the other one “recycling awards.” As Table 2 shows, the levels of reliability for the different scales could be defined as acceptable because, in general, Cronbach’s alphas exceed the value of 0.7.
5. Results
To test the research hypotheses of this study regarding the intention of using a sustainability application based on gamification, a multiple regression analysis was carried out (see Table 3). The model included the nine factors that were extracted from the exploratory factor analysis and two control variables (gender and age).
5.1.Hypothesis Testing
In this study, a hierarchical regression analysis was used to contrast the hypotheses established previously. In the first step of the series of regressions the explanatory and control variables have been introduced; in the second step, the moderating effect of the perceived risk on the relationship between expected benefits and the intention to use the gamified application was added. The results achieved are shown in Table 3, differentiating the two estimated models. The model I analyses the effect of the explanatory and control variables on the intention to use the application. Model II is evaluated including the moderating influence of the risk expected by users.
The results of the model I indicate that expected functional benefits (β = 0.22, p < 0.1) and expected social benefits (β = 0.31, p < 0.05) are shown as significant aspects that positively influence the dependent variable. However, the perceived risk shows a positive and significant impact on the intention of using the gamified application (β = 0.21, p < 0.1).
The results of model II show that the expected social benefits (β = 0.42, p < 0.01) and the perceived risks (β = 0.26, p < 0.1) have a positive and significant effect on the intention to use the gamified application, while the expected functional benefits become insignificant. Therefore, the positive influences of the expected functional benefits on the intention to use the gamified app disappear because of the moderating effect of the perceived risk on the impact of the functional benefits on the intention of use.
From these results, Hypothesis 1 can be partially accepted, since functional and hedonic benefits are not significant. Concerning expected threats from using the app, contrary to expectations, the factor related to perceived risks has a positive effect, and the trust on suppliers is not significant. This aspect enables us to reject Hypothesis 2. Similarly, Hypothesis 3, user features, cannot be accepted since the results are not significant. Additionally, the control variables (gender and age) do not tend to influence significantly.
Moreover, the moderating influence of the perceived risk on the relationships between social and hedonic benefits and the intention to use the gamified application is not significant. Consequently, Hypothesis 4 can be accepted as the control variables of model I continue to maintain their insignificance, while Hypothesis 5 and 6 are rejected
What is remarkable is the critical explanatory power of the variables in this last model, as reflected by the values of R2 = 0.52 and R2A = 0.42; which indicates the relevant role of the moderating effect of the perceived risk on the expected benefits.
6. Discussion and Conclusions
The results of this work demonstrate the influence that different factors exert on the intention to use a sustainability application based on gamification. The purpose of this study was to determine the effect that several factors (expected functional benefits, expected hedonic benefits, expected social benefits, perceived risks, trust in supplier, technical knowledge, and personal environmental values) have on the intention to use WasteApp.
Regarding the aspects that may explain the intention of using the application, according to the scientific literature, the results of model I show that expected functional benefits seem to exercise a positive and significant influence on the intention to use WasteApp [59]. Nevertheless, this relationship becomes negative when the moderating effect of perceived risk is introduced (see model II). When this remarkable moderating effect of perceived risk is added, the functionality of the application no longer has significance, weighing more on the user the expected risk than the expected functional benefit. In this vein, the level of risk tolerance may be influenced by the user’s motivation. Therefore, its implications on the values of recycling can be relevant to the level of tolerance of the perceived risk [84]. Consequently, one of the practical implications of this study is that application designers must take into account the user’s security regarding the use of technology, to balance the expected risk with the functional benefits provided by the application. Designers should warn potential users of the low risk that comes from using the app.
In line with the literature about SDT [38], which suggests that external pressures, such as reputation among friends or colleagues, and influence on the intention to use the technology, this work confirms the significant effect that the expected social benefits have on the intention of using this gamified application. Therefore, it is logical to think that users are willing to use WasteApp to promote recycling as long as it is disseminated among their social contacts. Visibility in social networks is relevant for these individuals since they seem to want to present a specific image with which to be identified. As the theory of planned behavior affirms [35], there are situations where people are willing to transmit a favorable image of themselves through the communication of a positive attitude towards a specific topic, as could be recycling.
Another important feature is that the expected hedonic benefits have no significant influence on the intention of using WasteApp. This result indicates that the user does not expect high-level game attributes and, thoroughly, high levels of emotional stimuli are not required from an application whose ultimate goal is recycling promotion [23].
On the other hand, the connection between the trust in the supplier of the app and the intention of using the technology is not confirmed. In fact, the subject of the application and its purpose could explain this case. The importance of the trust in the supplier is lightened by giving higher weight to the recycling promotion as a common good without taking into account who supports the application.
Following the approach that the relation between perceived risks and the intention of using the application, results show that it is a determining factor. Potential users are cautious about the information that is demanded when downloading a mobile app. A presumed significant factor that affects the intention to use the application is the request for geolocation, which accentuates the user’s fear of losing their privacy. However, contrary to expectations, although a higher risk is perceived, the application will be used, which implies a higher weight to the ultimate purpose of the use, sustainability. Users accept the risk of using WasteApp in exchange for a greater good.
On the same line, results show that technical knowledge will not influence the intention of using the application. That relationship is aligned with the fact of the respondents of the survey have been selected into a high-level education sector. Therefore, the required knowledge to download an application could seem obvious to them. Additionally, because the questionnaires have been downloaded by QR code, we have been able to exclude those individuals who do not have the necessary technical skills to complete the process of responding to the form.
However, in the results obtained in this work, the two facets of the personal environmental values do not appear to explain the intention of using WasteApp. In effect, the recycling significance and the recycling awards do not play a significant role in the intention to use the technology. An explanation for this may be found in the users willing to recycle independently of using the application.
Despite the academic implications derived from the study, some practical suggestions can be inferred as well. Empirical results show that practitioners can work on many aspects to increase the intention of using a sustainability application based on gamification. The design of these applications should focus on functional elements useful for the user, emphasizing the social diffusion, making the user visible to their contacts and producing applications with low-level gaming tools.
Among the objectives of the European research initiatives under the H2020 program is to achieve a cleaner and environmentally aware Europe. To this objective, drives such as the WasteApp application, included in the Urban Waste [19] project, are promoted. This work aims to identify the factors on which the intention to use the gamified app depends, providing clues to adapt and improve this type of application. This study goes further, in a second phase, inquiring which ones have to be played so that Europeans have a behavior highly aware of the environment. Aspects, such as the dissemination on social networks of application activities, cover the social recognition factor (subjective rules) [35] that make recycling behavior a less private, and more public, action.
In conclusion, the importance of those variables in the design of an application with the described characteristics is critical to obtain the final aim, fostering sustainable behaviors. In that sense, this work constitutes an effort to identify those crucial aspects of designing a gamified sustainability application in a paramount context for regions where tourism is a significant economic activity.
Finally, some aspects may limit the results of this research. First, it is regrettable that the survey was not conducted among actual users because the application is still in the early stage of validation. Therefore, to increase the validity of the study, it is necessary to apply the same model to actual users through a follow-up study after a specified period. Second, it has been conducted with higher-education individuals, thinking that this would be the profile of the end users, but it can be extended to other profiles if it is considered appropriate. Third, the use of the questionnaire limits the approach to information gathering, although its application in studies of attitudes may be deemed suitable. Fourth, the research context only permits conclusions to be drawn about European tourist cities, and any generalization of the results to other regions should be made with caution. Additionally, results indicate that the external impulses, as the prizes, are the only thing that can increase intrinsic motivation of users, unless not creating it [25]. In this vein, the manipulation of behaviors through the game (gamipulation) seems not to be appropriate. However, future studies could investigate which game design elements are relevant to convert extrinsic to intrinsic motivation factors. Nevertheless, technology tools promoting behaviors that are assumed as benefits by the society can also be used as persuasive tools when it is intended to influence the ideas and reactions of the player-tourist. The boundary would be the above mentioned “gamipulation” consisting of the use of game-design elements that compel the users even towards undesired objectives manipulating their will without being aware of it. Although the goal of technology is fundamentally valuable, as in this case to provide experiences helping to create a personal commitment to sustainability, limits on the use of these tools can be established.
Author Contributions
C.L.A.C. and R.P.J. conceived and designed the experiments, J.R. collaborated in the app and database design, while P.D.S. and C.L.A. oversaw data analysis and hypothesis verification. Final redaction was performed by C.L.A.C. and R.P.J.
Acknowledgments
This work was funded in part by the European Commission, H2020 Research Program, Project URBAN-WASTE, Call: H2020-WASTE-2015-two-stage, Ref. 690452.
Conflicts of Interest
The authors declare no conflict of interest.
References
- Coakley, D.; Garvey, R. The Great and the Green: Sustainable Development in Serious Games. In European Conference on Games Based Learning; Academic Conferences International Limited: Reading, UK, 2015; p. 135. [Google Scholar]
- Fabricatore, C.; López, X. Sustainability Learning through Gaming: An Exploratory Study. Electron. J. e-Learn. 2012, 10, 209–222. [Google Scholar]
- Asquer, A.; Krachkovskaya, I. Can Gamification Assist the Implementation of Co-Production Tools? Some Experimental Evidence from the Monitoring of the Urban Environment. In Proceedings of the International Conference on Public Policy, Milan, Italy, 1–4 June 2015. [Google Scholar]
- Negruşa, A.L.; Toader, V.; Sofică, A.; Tutunea, M.F.; Rus, R.V. Exploring gamification techniques and applications for sustainable tourism. Sustainability 2015, 7, 11160–11189. [Google Scholar] [CrossRef]
- Kim, S. Interdisciplinary approaches and methods for sustainable transformation and innovation. Sustainability 2015, 7, 3977–3983. [Google Scholar] [CrossRef]
- Deterding, S.; Dixon, D.; Khaled, R.; Nacke, L. From game design elements to gamefulness: Defining gamification. In Proceedings of the 15th International Academic MindTrek Conference: Envisioning Future Media Environments, Tampere, Finland, 28–30 September 2011; ACM: New York, NY, USA, 2011; pp. 9–15. [Google Scholar]
- Hamari, J.; Huotari, K.; Tolvanen, J. Gamification and economics. In The Gameful World: Approaches, Issues, Applications; MIT Press: Cambridge, MA, USA, 2015; p. 139. [Google Scholar]
- Huotari, K.; Hamari, J. Defining gamification: A service marketing perspective. In Proceeding of the 16th International Academic MindTrek Conference, Tampere, Finland, 3–5 October 2012; pp. 17–22. [Google Scholar]
- Hamari, J.; Koivisto, J.; Sarsa, H. Does gamification work? —A literature review of empirical studies on gamification. In Proceeding of the IEEE 47th Hawaii International Conference on System Sciences (HICSS), Waikoloa, HI, USA, 6–9 January 2014; pp. 3025–3034. [Google Scholar]
- Walsh, G.; Golbeck, J. StepCity: A preliminary investigation of a personal informatics-based social game on behavior change. In Proceeding of the CHI‘14 Extended Abstracts on Human Factors in Computing Systems, Toronto, ON, Canada, 26 April–1 May 2014; pp. 2371–2376. [Google Scholar]
- Lee, C.; Lee, K.; Lee, D. Mobile Healthcare Applications and Gamification for Sustained Health Maintenance. Sustainability 2017, 9, 772. [Google Scholar] [CrossRef]
- Shih, L.H.; Jheng, Y.C. Selecting Persuasive Strategies and Game Design Elements for Encouraging Energy Saving Behavior. Sustainability 2017, 9, 1281. [Google Scholar] [CrossRef]
- Casas, A.F.; Casas, P.F.; Casanovas, J. Analysis of Applications to Improve the Energy Savings in Residential Buildings Based on Systemic Quality Model. Sustainability 2016, 8, 1051. [Google Scholar] [CrossRef] [Green Version]
- Berger, V.; Schrader, U. Fostering sustainable nutrition behavior through gamification. Sustainability 2016, 8, 67. [Google Scholar] [CrossRef]
- Cowley, B.; Moutinho, J.L.; Bateman, C.; Oliveira, A. Learning principles and interaction design for ‘Green My Place’: A massively multiplayer serious game. Entertain. Comput. 2011, 2, 103–113. [Google Scholar] [CrossRef]
- Kim, S. Team Organization Method Using Salary Auction Game for Sustainable Motivation. Sustainability 2015, 7, 14358–14370. [Google Scholar] [CrossRef]
- Berengueres, J.; Alsuwairi, F.; Zaki, N.; Ng, T. Gamification of a recycle bin with emoticons. In Proceedings of the 8th ACM/IEEE International Conference on Human-Robot Interaction, Tokyo, Japan, 3–6 March 2013; pp. 83–84. [Google Scholar]
- Comber, R.; Thieme, A.; Rafiev, A.; Taylor, N.; Krämer, N.; Olivier, P. BinCam: Designing for engagement with Facebook for behavior change. In Proceedings of the 14th International Conference on Human-Computer Interaction (INTERACT), Cape Town, South Africa, 2–6 September 2013; pp. 99–115. [Google Scholar]
- Urban Waste. Available online: www.urban-waste.eu (accessed on 18 February 2018).
- Hunicke, R.; LeBlanc, M.; Zubek, R. MDA: A formal approach to game design and game research. In Proceedings of the AAAI Workshop on Challenges in Game AI, Hingham, MA, USA, 25–26 July 2004; pp. 1–5. [Google Scholar]
- Davis, F.D. Perceived usefulness, perceived ease of use, and user acceptance of information technology. MIS Q. 1989, 13, 319–340. [Google Scholar] [CrossRef]
- Hsu, C.L.; Lu, H.P. Why do people play on-line games? An extended TAM with social influences and flow experience. Inf. Manag. 2004, 41, 853–868. [Google Scholar] [CrossRef]
- Yoo, C.; Kwon, S.; Na, H.; Chang, B. Factors Affecting the Adoption of Gamified Smart Tourism Applications: An Integrative Approach. Sustainability 2017, 9, 2162. [Google Scholar] [CrossRef]
- Ryan, R.M.; Deci, E.L. Self-determination theory and the facilitation of intrinsic motivation, social development, and well-being. Am. Psychol. 2000, 55, 68. [Google Scholar] [CrossRef] [PubMed]
- Ryan, R.M.; Deci, E.L. Intrinsic and extrinsic motivations: Classic definitions and new directions. Contemp. Educ. Psychol. 2000, 25, 54–67. [Google Scholar] [CrossRef] [PubMed]
- Paharia, R. Gamification means amplifying intrinsic value. Interactions 2012, 19, 17. [Google Scholar]
- Drozdenko, R.; Jensen, M.; Coelho, D. Pricing of green products: Premiums paid, consumer characteristics and incentives. Int. J. Bus. Mark. Decis. Sci. 2011, 4, 106–116. [Google Scholar]
- Mimouni, A.; Volle, P. Les Bénéfices Perçus des Programmes Relationnels: Une Approche de Segmentation Appliquée aux Enseignes de Distribution; Paris Dauphine University: Paris, France, 2006. [Google Scholar]
- Angeles, R. An empirical study of the anticipated consumer response to RFID product item tagging. Ind. Manag. Data Syst. 2007, 107, 461–483. [Google Scholar] [CrossRef]
- Rogers, E.M. Elements of diffusion. In Diffusion of Innovations, 5th ed.; Free Press: New York, NY, USA, 2003. [Google Scholar]
- Parra-López, E.; Bulchand-Gidumal, J.; Gutiérrez-Taño, D.; Díaz-Armas, R. Intentions to use social media in organizing and taking vacation trips. Comput. Hum. Behav. 2011, 27, 640–654. [Google Scholar] [CrossRef]
- Sigala, M. Measuring customer value in online collaborative trip planning processes. Mark. Intell. Plan. 2010, 28, 418–443. [Google Scholar] [CrossRef]
- Chung, J.Y.; Buhalis, D. A study of online travel community and Web 2.0: Factors affecting participation and attitude. In Proceedings of the ENTER2008, Innsbruck, Austria, 23–25 January 2008; Springer-Verlag, Wien: Innsbruck, Austria, 2008; pp. 267–278. [Google Scholar]
- van der Heijden, H. User acceptance of hedonic information systems. MIS Q. 2004, 28, 695–704. [Google Scholar] [CrossRef]
- Ajzen, I. The theory of planned behavior. Organ. Behav. Hum. Decis. Process. 1991, 50, 179–211. [Google Scholar] [CrossRef]
- Fishbein, M.; Ajzen, I. Belief, Attitude, Intention, and Behavior: An Introduction to the Theory and Research; Addison-Wesley: Reading, MA, USA, 1977. [Google Scholar]
- Hamari, J.; Sjöklint, M.; Ukkonen, A. The sharing economy: Why people participate in collaborative consumption. J. Assoc. Inf. Sci. Technol. 2015, 67, 2047–2059. [Google Scholar] [CrossRef]
- Deci, E.L.; Ryan, R.M. Intrinsic Motivation and Self-Determination in Human Behavior; Springer: New York, NY, USA, 1985. [Google Scholar]
- Metzger, M. Communication privacy management in electronic commerce. J. Comput.-Med. Commun. 2007, 12, 335–361. [Google Scholar] [CrossRef]
- Jarvenpaa, S.L.; Todd, P.A. Is there a future for retailing on the Internet? Electron. Mark. Consum. 1997, 1, 139–154. [Google Scholar]
- Purcell, K.; Brenner, J. Search Engine Use 2012. Pew Internet & American Life. Available online: http://pewinternet.org/Reports/2012/Search (accessed on 20 February 2018).
- PageFair. The 2015 Ad Blocking Report. Available online: https://blog.pagefair.com/2015/ad-blocking-report/ (accessed on 20 February 2018).
- Callius, P. Advertising Avoidance: The Quiet Consumer Revolt. Available online: http://www.wpp.com//media/SharedWPP/ReadingRoom/Advertising/advertising_advertisingavoidance.pdf (accessed on 20 February 2018).
- Davis, W. Lawmakers call for stronger do-not-track standards. Mediapost Policy Blog. 2015. Available online: http://www.mediapost.com/publications/article/259971/lawmakers-call-for-stronger-do-not-trackstandards.html (accessed on 20 February 2018).
- Curtin, J.; Kauffman, R.J.; Riggins, F.J. Making the ‘MOST’ out of RFID technology: A research agenda for the study of the adoption, usage and impact of RFID. Inf. Technol. Manag. 2008, 8, 87. [Google Scholar] [CrossRef]
- Slettemeås, D. RFID—The “Next Step” in Consumer-Product Relations or Orwellian Nightmare? Challenges for Research and Policy. J. Consum. Policy 2009, 32, 219. [Google Scholar] [CrossRef]
- Boeck, H.; Roy, J.; Durif, F.; Grégoire, M. The effect of perceived intrusion on consumers’ attitude towards using an RFID-based marketing program. Procedia Comput. Sci. 2011, 5, 841–848. [Google Scholar] [CrossRef]
- Hwang, Y.H. Iot security & privacy: Threats and challenges. In Proceedings of the 1st ACM Workshop on IoT Privacy, Trust, and Security, Singapore, 14 April 2015. [Google Scholar]
- Eckfeldt, B. What does RFID do for the consumer? Commun. ACM 2005, 48, 77–79. [Google Scholar] [CrossRef]
- Günther, O.; Spiekermann, S. RFID and the perception of control: The consumer’s view. Commun. ACM 2005, 48, 73–76. [Google Scholar] [CrossRef]
- Ohkubo, M.; Suzuki, K.; Kinoshita, S. RFID privacy issues and technical challenges. Commun. ACM 2005, 48, 66–71. [Google Scholar] [CrossRef]
- Karjaluoto, H.; Alatalo, T. Consumers’ attitudes towards and intention to participate in mobile marketing. Int. J. Serv. Technol. Manag. 2007, 8, 155–173. [Google Scholar] [CrossRef]
- Malhotra, N.; Kim, S.; Agarwal, J. Internet users’ information privacy concerns (IUIPC): The construct, the scale, and a causal model. Inf. Syst. Res. 2004, 15, 336–355. [Google Scholar] [CrossRef]
- Mir, I. Consumer attitude towards m-advertising acceptance: A cross-sectional study. J. Internet Bank. Commer. 2011, 16, 1–22. [Google Scholar]
- Eastin, M.S.; Brinson, N.H.; Doorey, A.; Wilcox, G. Living in a big data world: Predicting mobile commerce activity through privacy concerns. Comput. Hum. Behav. 2016, 58, 214–220. [Google Scholar] [CrossRef]
- Gefen, D.; Karahanna, E.; Straub, D. Trust and TAM in online shopping: An integrated model. MIS Q. 2003, 27, 51–90. [Google Scholar] [CrossRef]
- Golembiewski, R.T.; McConkie, M. The centrality of interpersonal trust in group processes. Theor. Group Process. 1975, 131, 185. [Google Scholar]
- Levesque, N.; Boeck, H. Proximity Marketing as an Enabler of Mass Customization and Personalization in a Customer Service Experience. In Managing Complexity; Springer: Berlin, Germany, 2017; pp. 405–420. [Google Scholar]
- Hamari, J.; Koivisto, J. Why do people use gamification services? Int. J. Inf. Manag. 2015, 35, 419–431. [Google Scholar] [CrossRef]
- Kim, K.; Ahn, S.J.G. The Role of Gamification in Enhancing Intrinsic Motivation to Use a Loyalty Program. J. Interact. Mark. 2017, 40, 41–51. [Google Scholar] [CrossRef]
- Juban, R.L.; Wyld, D.C. Would You Like Chips With That?: Consumer Perspectives of RFID. Manag. Res. News 2004, 27, 29–44. [Google Scholar] [CrossRef]
- McVeigh, J.E.; Reddin, R.; Cunningham, M.; Breslin, D.; Brady, M.; Armstrong, C. RFID at the customer interface: The issue of privacy. 2007. Available online: https://ssrn.com/abstract=969360 (accessed on 12 May 2018).
- Cazier, J.A.; Jensen, A.; Dinesh, S. The Impact of Consumer Perceptions of Information Privacy and Security Risks on the Adoption of Residual RFID Technologies. Commun. Assoc. Inf. Syst. 2008, 23, 235–256. [Google Scholar]
- Petronio, S. Communication boundary management: A theoretical model of managing disclosure of private information between married couples. Commun. Theory 1991, 1, 311–335. [Google Scholar] [CrossRef]
- Petronio, S. Boundaries of Privacy: Dialectics of Disclosure; Suny Press: New York, NY, USA, 2002. [Google Scholar]
- Roux, D. Consumer resistance: Proposal for an integrative framework. Recherche et Applications en Marketing 2007, 22, 59–79. [Google Scholar] [CrossRef]
- Rokeach, M. Beliefs, Attitudes and Values: A Theory of Organization and Change; Jossey-Bass: San Francisco, CA, USA, 1968. [Google Scholar]
- Rokeach, M.; Ball-Rokeach, S.J. Stability and Change in American Value Priorities, 1968–1981. Am. Psychol. 1989, 44, 775. [Google Scholar] [CrossRef]
- Straughan, R.D.; Roberts, J.A. Environmental segmentation alternatives: A look at green consumer behavior in the new millennium. J. Consum. Mark. 1999, 16, 558–575. [Google Scholar] [CrossRef]
- Wiser, R. Green power marketing: Increasing customer demand for renewable energy. Util. Policy 1998, 7, 107–119. [Google Scholar] [CrossRef]
- Hartmann, P.; Apaolaza-Ibáñez, V. Consumer attitude and purchase intention Howard green energy brands: The roles of psychological benefits and environmental concern. J. Bus. Res. 2012, 65, 1254–1263. [Google Scholar] [CrossRef]
- Lounis, S.; Neratzouli, X.; Pramatari, K. Can gamification increase consumer engagement? A qualitative approach on a green case. In Proceedings of the 12th IFIP WG 6.11 Conference on e-Business, e-Services and e-Society, Athens, Greece, 25–26 April 2013; pp. 200–212. [Google Scholar]
- Kollmuss, A.; Agyeman, J. Mind the gap: Why do people act environmentally and what are the barriers to pro-environmental behavior? Environ. Educ. Res. 2002, 8, 239–260. [Google Scholar] [CrossRef]
- Featherman, M.S.; Pavlou, P.A. Predicting e-services adoption: A perceived risk facets perspective. Int. J. Hum. Comput. Stud. 2003, 59, 451–474. [Google Scholar] [CrossRef]
- Campbell, M.C.; Goodstein, R.C. The moderating effect of perceived risk on consumers’ evaluations of product incongruity: Preference for the norm. J. Consum. Res. 2001, 28, 439–449. [Google Scholar] [CrossRef]
- Baker, R.K.; White, K.M. Predicting adolescents’ use of social networking sites from an extended theory of planned behaviour perspective. Comput. Hum. Behav. 2010, 26, 1591–1597. [Google Scholar] [CrossRef] [Green Version]
- Bock, G.-W.; Zmud, R.W.; Kim, Y.-G.; Lee, J.-N. Behavioral intention formation in knowledge sharing: Examining the roles of extrinsic motivators, social-psychological forces, and organizational climate. MIS Q. 2005, 29, 87–111. [Google Scholar] [CrossRef]
- Chen, M.F.; Tung, P.J. The moderating effect of perceived lack of facilities on consumers’ recycling intentions. Environ. Behav. 2010, 42, 824–844. [Google Scholar] [CrossRef]
- Wang, Y.; Fesenmaier, D.R. Towards understanding members’ general participation in and active contribution to an online travel community. Tour. Manag. 2004, 25, 709–722. [Google Scholar] [CrossRef]
- Goldsmith, R.E.; Horowitz, D. Measuring motivations for online opinion seeking. J. Interact. Advert. 2006, 6, 2–14. [Google Scholar] [CrossRef]
- Hagel, J. Net gain: Expanding markets through virtual communities. J. Interact. Mark. 1999, 13, 55–65. [Google Scholar] [CrossRef]
- Myles, G.; Friday, A.; Davies, N. Preserving privacy in environments with location-based applications. IEEE Perv. Comput. 2003, 2, 56–64. [Google Scholar] [CrossRef]
- White, K.M.; Hyde, M.K. The role of self-perceptions in the prediction of household recycling behavior in Australia. Environ. Behav. 2012, 44, 785–799. [Google Scholar] [CrossRef]
- Dholakia, U.M. A motivational process model of product involvement and consumer risk perception. Eur. J. Mark. 2001, 35, 1340–1362. [Google Scholar] [CrossRef]
Figure 1.
The project’s phases.

Figure 2.
WasteApp presentation screen and a map of an area of Ponta Delgada City where waste bins and sponsors are shown.
Figure 2.
WasteApp presentation screen and a map of an area of Ponta Delgada City where waste bins and sponsors are shown.

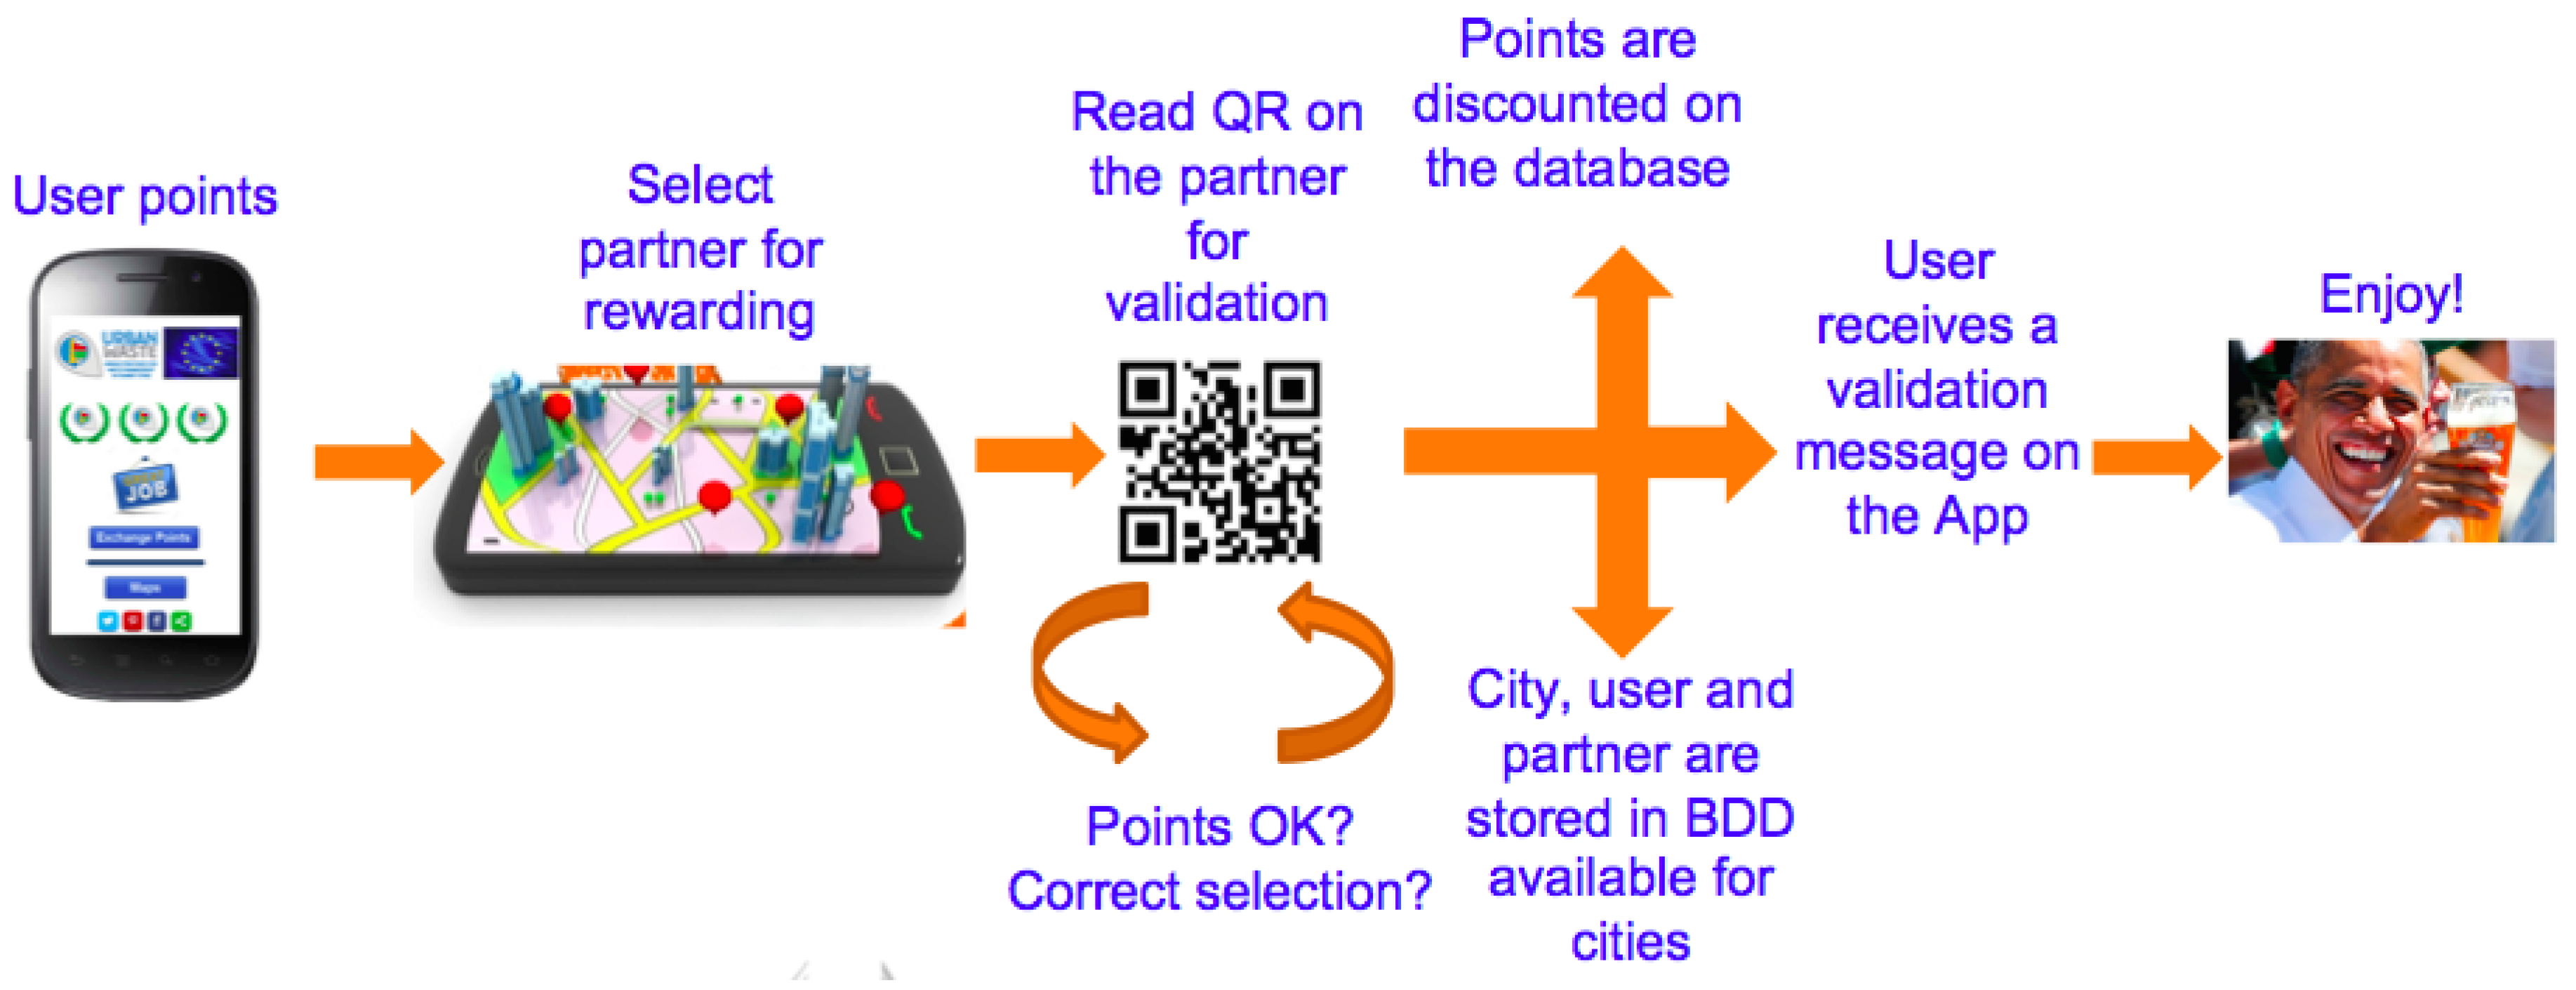
Figure 3.
The WasteApp process of redeemed points by prizes. BDD refers to a data base service

Figure 4.
QR code on a waste bin.

Figure 5.
Model of the study proposal.


Table 1.
Sample profile.
| Characteristics | Frequency | % | |
|---|---|---|---|
| Gender | Male | 48 | 60.8 |
| Female | 30 | 38.0 | |
| Other | 1 | 1.3 | |
| Age | 18–24 | 10 | 12.7 |
| 2–34 | 26 | 32.9 | |
| 3–44 | 21 | 26.6 | |
| 4–54 | 11 | 13.9 | |
| >54 | 11 | 13.9 | |
| Education | Primary school | 2 | 2.5 |
| High School | 13 | 16.5 | |
| Bachelor’s degree | 34 | 43.0 | |
| Master’s degree | 30 | 38.0 | |
| Occupation | Small farmer | 1 | 1.3 |
| Self-employed (<6 employees) | 2 | 2.5 | |
| Businessman (>5 employees) | 1 | 1.3 | |
| Professional (high qualification) | 38 | 48.1 | |
| Manager, executive | 9 | 11.4 | |
| Middle management | 10 | 12.7 | |
| Employ free of charge | 16 | 20.3 | |
| Unqualified worker | 2 | 2.5 | |
| Total | 79 | 100.0 | |
Table 2.
Results of the exploratory factor analysis.
| Expected Functional Benefits (EFB) | Factor | Cronbach’s Alpha | |
| EFB 1 | 0.857 | 0.862 | |
| EFB 2 | 0.927 | ||
| EFB 3 | 0.914 | ||
| Percentage of explained variance | 80.918 | ||
| Eigen value | 2.428 | ||
| KMO Index | 0.716 | ||
| Bartlett’s sphericity test | 132.438 | ||
| Significance | 0.000 | ||
| Expected hedonic benefits (EHB) | Factor | Cronbach’s Alpha | |
| EHB 1 | 0.854 | 0.810 | |
| EHB 2 | 0.733 | ||
| EHB 3 | 0.822 | ||
| EHB 4 | 0.797 | ||
| Percentage of explained variance | 64.439 | ||
| Eigen value | 2.578 | ||
| KMO Index | 0.773 | ||
| Bartlett’s sphericity test | 104.82 | ||
| Significance | 0.000 | ||
| Expected social benefits (ESB) | Factor | Cronbach’s Alpha | |
| ESB 1 | 0.888 | 0.892 | |
| ESB 2 | 0.931 | ||
| ESB 3 | 0.824 | ||
| ESB 4 | 0.835 | ||
| Percentage of explained variance | 75.790 | ||
| Eigen value | 3.032 | ||
| KMO Index | 0.806 | ||
| Bartlett’s sphericity test | 192.928 | ||
| Significance | 0.000 | ||
| Trust in supplier (TIS) | Factor | Cronbach’s Alpha | |
| TIS1 | 0.823 | 0.811 | |
| TIS2 | 0.881 | ||
| TIS3 | 0.856 | ||
| Percentage of explained variance | 72.849 | ||
| Eigen value | 2.185 | ||
| KMO Index | 0.704 | ||
| Bartlett’s sphericity test | 79.513 | ||
| Significance | 0.000 | ||
| Perceived risk (PR) | Factor | Cronbach’s Alpha | |
| PR1 | 0.862 | 0.828 | |
| PR2 | 0.869 | ||
| PR3 | 0.858 | ||
| Percentage of explained variance | 74.487 | ||
| Eigen value | 2.235 | ||
| KMO Index | 0.723 | ||
| Bartlett’s sphericity test | 85.170 | ||
| Significance | 0.000 | ||
| Technical knowledge (TK) | Factor | Cronbach’s Alpha | |
| TK1 | 0.852 | 0.900 | |
| TK2 | 0.874 | ||
| TK3 | 0.913 | ||
| TK4 | 0.873 | ||
| Percentage of explained variance | 77.745 | ||
| Eigen value | 3.086 | ||
| KMO Index | 0.789 | ||
| Bartlett’s sphericity test | 202.328 | ||
| Significance | 0.000 | ||
| Personal environmental values (PEV) | Factor1 Factor2 | Cronbach’s Alpha | |
| PEV1 | 0.918 0.001 | 0.571 | |
| PEV2 | 0.873 0.206 | ||
| PEV3 | −0.062 0.8981 | ||
| PEV4 | 0.382 0.624 | ||
| Percentage of explained variance | 74.815 | ||
| Eigen value of factor 1 | 1.942 | ||
| Eigen value of factor 2 | 1.050 | ||
| KMO Index | 0.564 | ||
| Bartlett’s sphericity test | 62.694 | ||
| Significance | 0.000 | ||
| Intention of use (IU) | Factor | Cronbach’s Alpha | |
| IU1 | 0.906 | 0.929 | |
| IU2 | 0.941 | ||
| IU3 | 0.948 | ||
| IU4 | 0.834 | ||
| Percentage of explained variance | 82.510 | ||
| Eigen value | 3.300 | ||
| KMO Index | 0.810 | ||
| Bartlett’s sphericity test | 281.033 | ||
| Significance | 0.000 |
Table 3.
Results of multiply regression analysis, intention to use a gamified app to support sustainability.
Table 3.
Results of multiply regression analysis, intention to use a gamified app to support sustainability.
| Model I | Model II | |||
|---|---|---|---|---|
| Variables | Beta Coefficient | t (p) | β Coefficient | t (p) |
| Constant | 0.000 | −0.451(0.653) | 0.000 | −0.076 (0.940) |
| Expected functional benefits | 0.220 | 1.724 (0.089) * | 0.118 | 0.866 (0.389) |
| Expected hedonic benefits | 0.119 | 0.995 (0.323) | 0.060 | 0.451 (0.654) |
| Expected social benefits | 0.311 | 2.302 (0.024) ** | 0.422 | 3.052 (0.003) *** |
| Trust in supplier | 0.045 | 0.450 (0.654) | −0.017 | −0.176 (0.861) |
| Perceived risk | 0.212 | 1.923 (0.059) * | 0.269 | 1.794 (0.077) * |
| Technical knowledge | −0.088 | −0.903 (0.370) | −0.110 | −1.131 (0.262) |
| Recycling significance | 0.001 | 0.007 (0.994) | −0.123 | −0.956 (0.343) |
| Recycling awards | 0.034 | 0.297 (0.767) | 0.013 | 0.110 (0.913) |
| Gender | 0.048 | 0.456 (0.650) | 0.014 | 0.130 (0.897) |
| Age | 0.009 | 0.089 (0.930) | 0.029 | 0.300 (0.765) |
| PRxEFB | −0.377 | −2.068 (0.043) ** | ||
| PRxEHB | −0.046 | −0.221 (0.826) | ||
| PRxESB | 0.229 | 1.353 (1.181) | ||
| R2 | 0.457 | 0.520 | ||
| Adjusted R2 | 0.377 | 0.424 | ||
| F | 5.724 (0.000) *** | 5.421 (0.000) *** | ||
* p < 0.10; ** p < 0.05; *** p < 0.01
© 2018 by the authors. Licensee MDPI, Basel, Switzerland. This article is an open access article distributed under the terms and conditions of the Creative Commons Attribution (CC BY) license (http://creativecommons.org/licenses/by/4.0/).
Share and Cite
MDPI and ACS Style
Lidia, A.-C.; Julio, R.-T.; Petra, D.S.-P.; Rafael, P.-J. How to Encourage Recycling Behaviour? The Case of WasteApp: A Gamified Mobile Application. Sustainability 2018, 10, 1544. https://doi.org/10.3390/su10051544
AMA Style
Lidia A-C, Julio R-T, Petra DS-P, Rafael P-J. How to Encourage Recycling Behaviour? The Case of WasteApp: A Gamified Mobile Application. Sustainability. 2018; 10(5):1544. https://doi.org/10.3390/su10051544
Chicago/Turabian StyleLidia, Aguiar-Castillo, Rufo-Torres Julio, De Saa-Pérez Petra, and Perez-Jimenez Rafael. 2018. "How to Encourage Recycling Behaviour? The Case of WasteApp: A Gamified Mobile Application" Sustainability 10, no. 5: 1544. https://doi.org/10.3390/su10051544
Note that from the first issue of 2016, this journal uses article numbers instead of page numbers. See further details here.