1. Introduction
With the development of industrialization and urbanization, the demand for water resources has been continuously expanding, and the shortage of water resources and low utilization of water resources have become prominent problems. To solve water resources problems and achieve sustainable development of water resources, a series of policies and regulations have been proposed. The 13th Five-Year Plan for the National Economic and Social Development of the People’s Republic of China (13th Five-Year Plan) clearly states that the most stringent water resources management system should be implemented to build a water-saving society [
1]. With the basic national conditions and the new normal of economic development, the most stringent water resources management system indicates the determination of Chinese government for the sustainable development of water resources [
2].
As the largest heavy industrial and commercial city in southwest China, Chongqing is an important modern manufacturing base in China. It is also a city with water shortages. The economic growth rate of Chongqing has led the country for ten consecutive quarters. The rapid economic development in Chongqing has had a tremendous impact on the environment and resources [
3]. Thus, the demand for water resources caused by economic development has become a prominent issue. To achieve the sustainable development of water resources, Chongqing municipal government has also introduced the most stringent water resources management system in Chongqing [
4]. The industrial and agricultural water consumption of Chongqing are used in an extensive way and water is used in low efficiency. The solid foundation for heavy industry in Chongqing leads to slower industrial upgrading and excess production capacity. The water consumption amount per unit output value is 71 m
3 per ten thousand Yuan. Due to the topography of Chongqing, the development of modern agriculture is limited, which led to a serious problem in agriculture: the waste of water resource. The effective utilization coefficient of farmland irrigation water is only 0.48. This is what the Chongqing government has been trying to solve. In Chongqing Water Resources Development according to “The 13th Five-Year” Plan, the water use efficiency of industry and agriculture is required to increase [
5].
Researchers have analyzed water consumption in various aspects to solve the problem of sustainable development of water resources. Bai et al. provide suggestions for water resources management by predicting water resources [
6]. Considering that there are many economic and social factors that affect water use, it is also meaningful to look at the impact of socio-economic indicators on water use. Okadera et al. focused on evaluating the structure of water demand with socio-economic activities [
7]. Zhong et al. found that the increase in water prices can increase water use efficiency [
8]. Ashoori et al. stated that population and price are the main driving forces for residential water demand. In the future, people must also rely on measures such as catching rainwater and recycling water to meet water demand [
9]. Balling et al. found that the sensitivity of different regions to climate is different [
10]. House-Peters et al. found that the most important determinants of water demand growth are population growth, climate and urban development [
11]. Xu paid considered the relationship between economy and water consumption, and proposed suggestions on sustainable development of water resources without affecting the economic development [
12]. Many methods that can be applied to analyze correlations in mathematical statistics, such as the grey relational analysis [
13], variance analysis [
14], principal component analysis [
15,
16], and regression analysis [
17]. The methods of variance analysis, principal component analysis and regression analysis need many data following a typical probability distribution, and the result of quantization and qualitative analysis may be inconsistent. However, the statistical resources in China are limited, especially local districts and counties. On the contrary, the grey relational model requires fewer data and requires undemanding data distribution [
18], which can be employed for this situation.
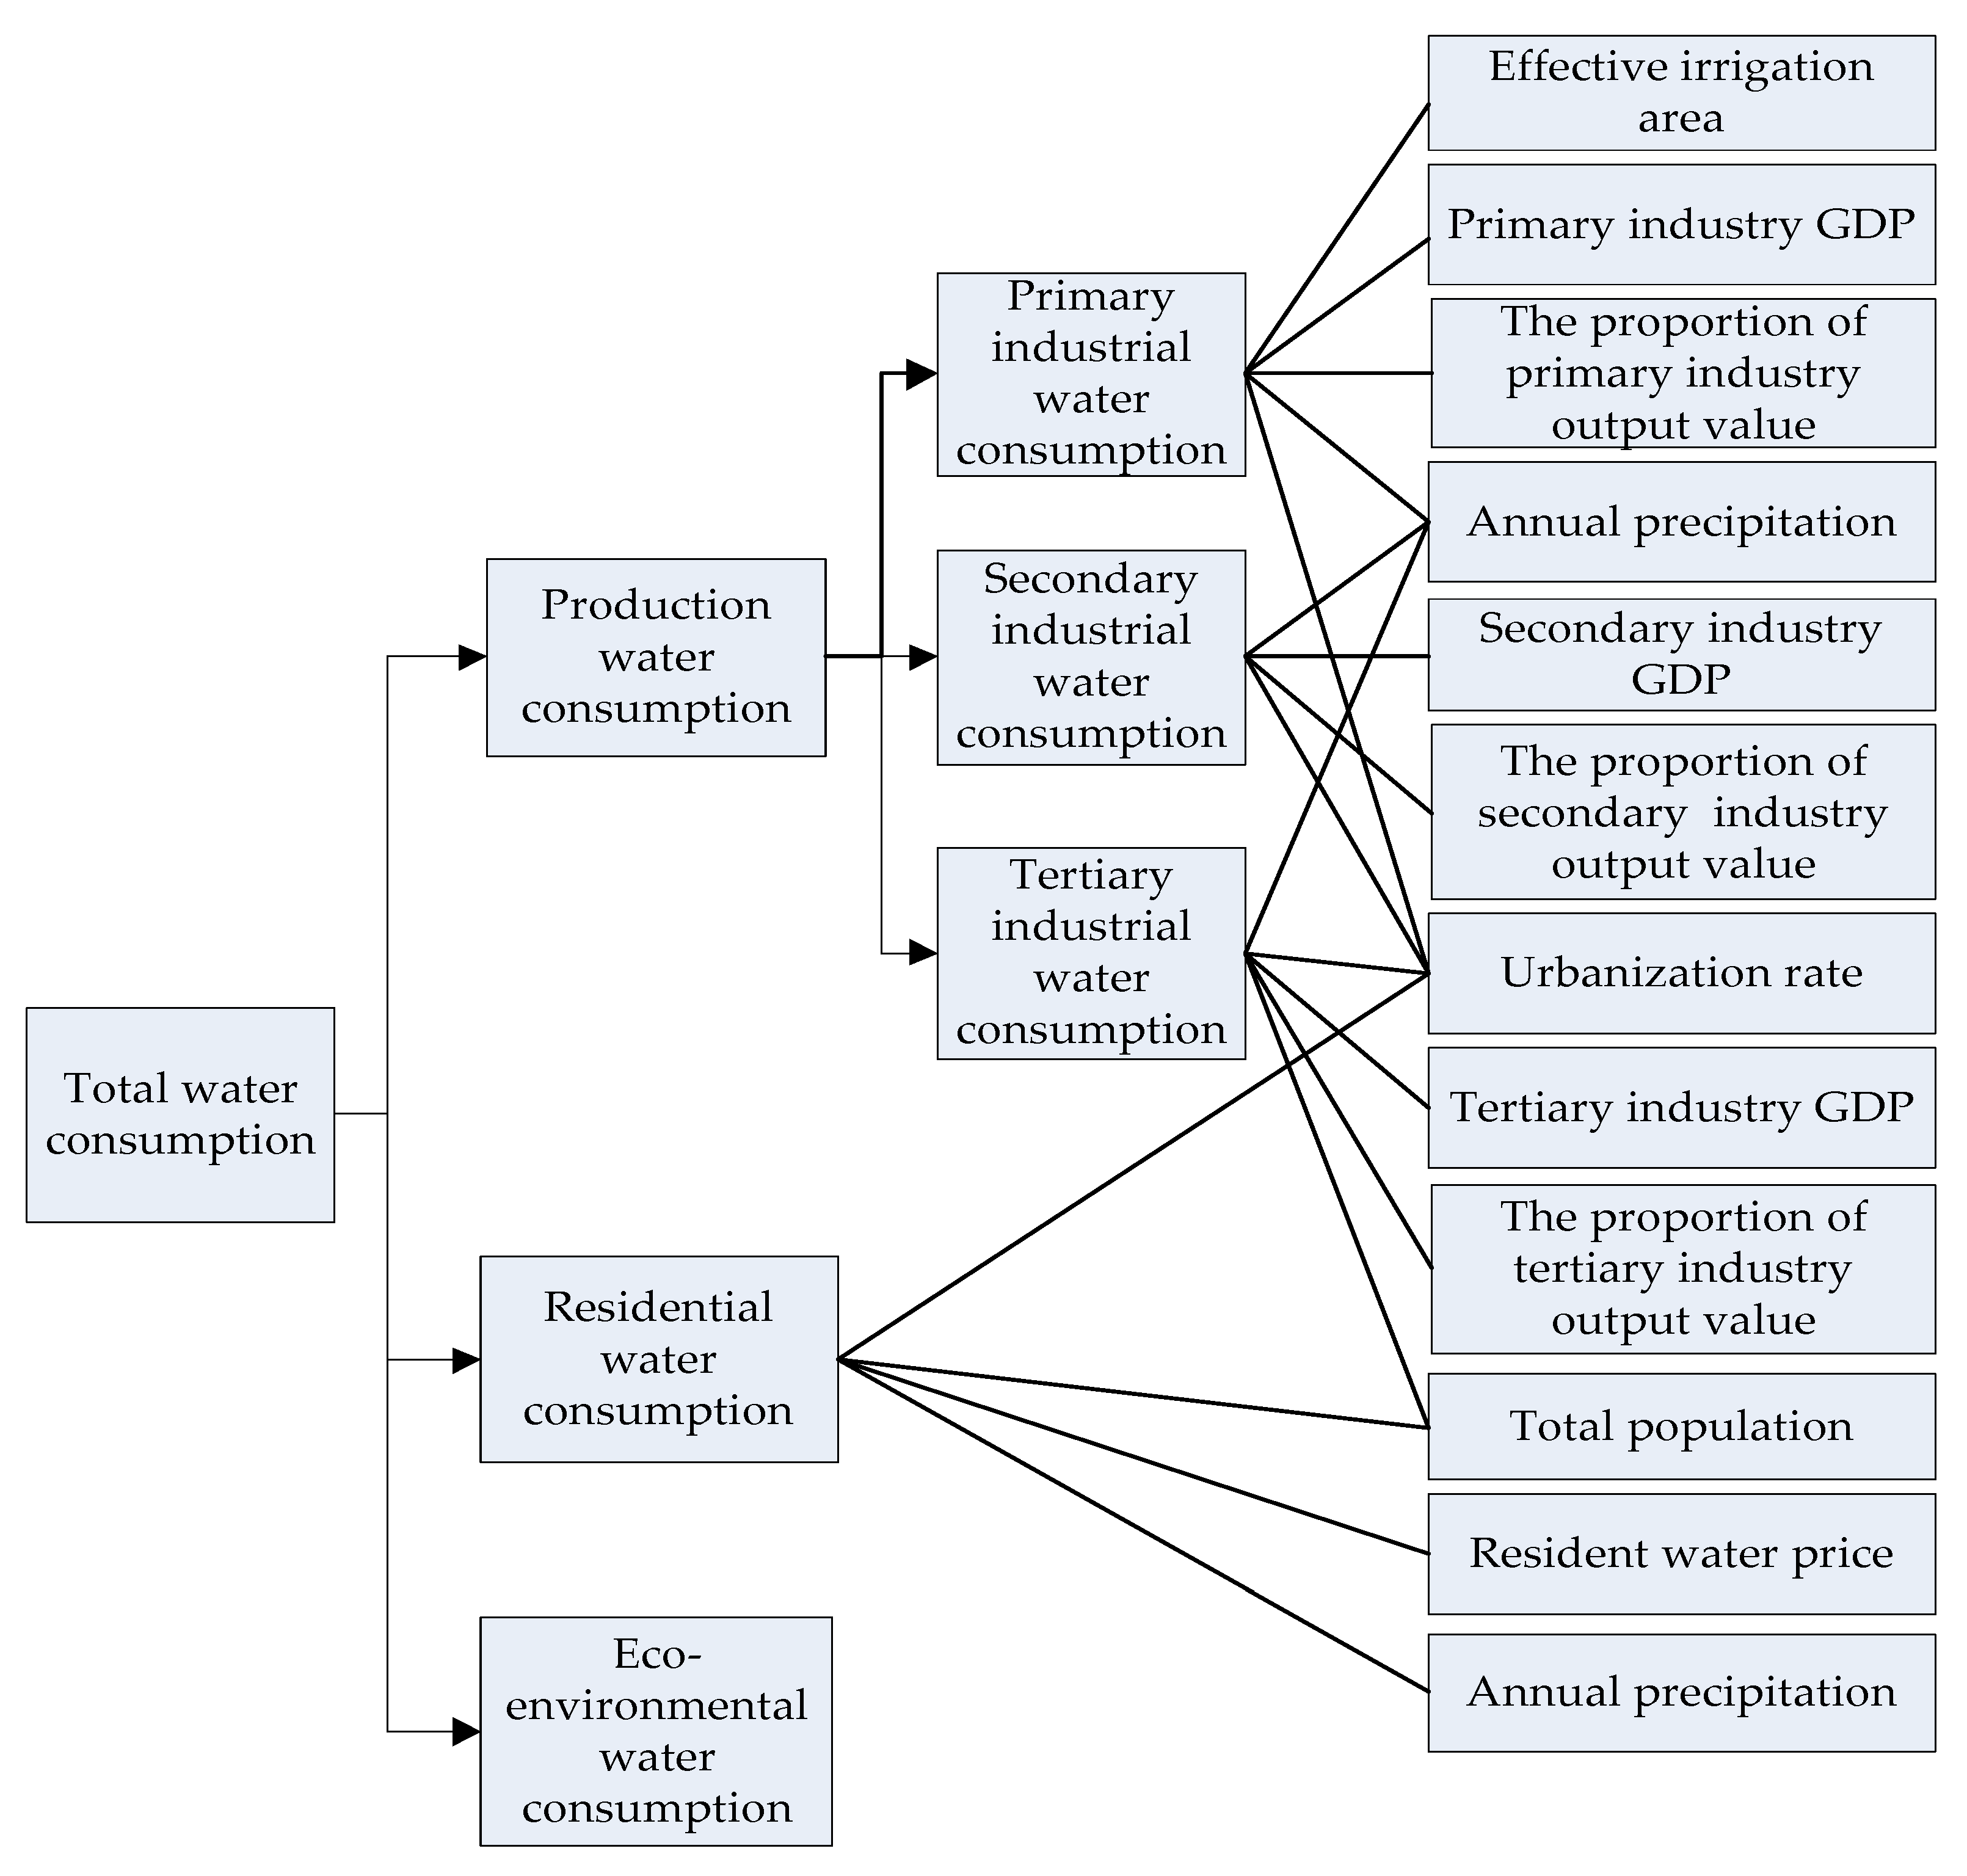
Based on the above analysis, the complicated water consumption system was analyzed by the analytic hierarchy process (AHP), and the hierarchy structure of water consumption was proposed. The grey relational model was used to calculate the grey relational degree between levels. The rest of the paper is organized as follows.
Section 2 proposes propose the hierarchy of water consumption structure.
Section 3 introduces the indicators and data.
Section 4 describes the grey relational method, and the results of grey relational degree are listed.
Section 5 analyzes water consumption and puts forward the corresponding recommendations.
Section 6 concludes the paper.
4. Correlation Analysis Using Grey Theory
Grey relational analysis has obvious advantages for dealing with grey data. Grey Correlation Analysis is an important branch of grey system theory, mainly based on the degree of similarity of the geometric shape of the sequence curve to judge the relationship between different sequences. Grey relational degree is the mean value of a series of grey relational coefficient, and it is a quantification of the relationship between sequences [
22]. The final display result of the grey relational model is the grey relational degree. The higher the grey relational degree is, the closer the relationship is [
23]. Of course, the grey relational method also has its disadvantages. The grey relational degree can show the degree of correlation between different sequences, but cannot show the systematic relationship between different sequences, and the causality. Therefore, after getting the grey relational degree, we should focus on the analysis of the causality between different sequences and the process of influence between different sequences.
Generally, the grey relational analysis method can be divided into four steps:
Step 1: Define the behavior time series
Let Xi be the system factor and k be the time sequence number. xi (k) is the observed data at time k (k = 1,2,3, ..., n), then the behavior of time sequence is Xi = (Xi (1), Xi (2), ..., Xi(n)). That is, the behavior of time series are X0, X1, X2, ..., Xm (m is the number of relevant factors), and X0 is the system behavior time series. The grey relational degree is calculated among X1, X2, ..., Xm with X0. Here, production water consumption is taken as an example to calculate the grey relational degree between the production water consumption and the total water consumption. Due to the large number of indicators, symbols are used instead of numbers. Set the original number of total water consumption as Xa.
Xa = (57.56, 60.35, 63.17, 67.45, 71.16, 73.20, 77.43, 82.77, 85.30, 86.39, 86.80, 82.94, 83.91, 80.67, 78.98),
Set the original sequence of production water consumption as Xb.
Xb = (20.32, 20.70, 23.62, 22.87, 24.11, 20.17, 20.78, 20.67, 20.69, 21.63, 25.45, 25.18, 24.55, 23.74, 25.87).
Step 2: Perform dimensionless processing
Dimensionless processing is to remove the unit limits of the data and convert it into a dimensionless pure value, which facilitates the comparison and weighting of different units or orders of magnitude. Using an averaging process,
Xi’ is divided by
Xi(
k), then
Yi(
k) is used to represent this result. The behavior of time series is obtained
Y0,
Y1,
Y2, ...,
Ym,
Yi = (
Yi (1),
Yi (2), ...,
Yi (
n)):
The following results are obtained:
Ya = (1.32, 1.26, 1.20, 1.12, 1.07, 1.04, 0.98, 0.92, 0.89, 0.88, 0.87, 0.91, 0.90, 0.94, 0.96); and
Yb = (1.40, 1.38, 1.19, 1.11, 1.04, 1.02, 0.96, 0.89, 0.87, 0.86, 0.86, 0.91, 0.90, 0.95, 0.99).
Step 3: Calculate time-related grey relational degree
The formula is used to calculate the degree of grey relational between
X0 (
k) and
Xi (
k), and the time-dependent correlation coefficient matrix is obtained.
p (
p∈(0,1)) is resolution ratio, which generally take 0.5. The time-related correlation coefficient sequence is
R0i = ((
R0i(1),
R0i(2), ...,
R0i(
n)).
The time-related correlation coefficient sequence of industrial water consumption was obtained, that is, the grey relational degree between industrial water consumption and total water consumption per year:
Rab = (0.81, 0.74, 0.99, 0.97, 0.96, 0.95, 0.96, 0.94, 0.95, 0.96, 0.96, 0.99, 0.99, 0.97, 0.94).
Step 4: Calculate the average value
r0i (0 <
r0i ≤ 1) of the time-dependent degree of relational is calculated, that is, the grey relational degree between the required
X0 and
Xi:
The grey relational degree between production water consumption and total water consumption can be obtained,
rab = 0.94. The grey relational degree of other related factors are calculated as above. Based on the structure of water use, the grey relational degree of the next level indicator to the upper level indicator is calculated. The results of the grey relational degree (GRD) are shown in
Table 5 and
Table 6.
6. Conclusions
In this paper, the method of AHP is used to propose a hierarchy of water consumption, and then selects the relevant economic and social indicators to correlate with water consumption. The grey relational model is used to calculate the grey relational degree hierarchically. Then from the three water departments, the water consumption is analyzed in different levels, and proposals for the sustainable development of water resources are put forward. Here they are summarized for three levels:
(1) In the first level of grey relational analysis, the correlation between production water consumption and total water consumption was the highest, while residential water consumption ranked second. Production water and domestic water are the main driving forces of total water consumption. The production water consumption accounts for 82% of the total water consumption. The scale of production water should be scientifically planned and the backward production capacity should be eliminated. Water resources are a necessity for residents’ lives. The government should first ensure the residents’ basic water use and reduce unnecessary water use. Eco-environmental water consumption is the basis for the conservation of the ecological environment. The government should appropriately increase the eco-environmental water consumption.
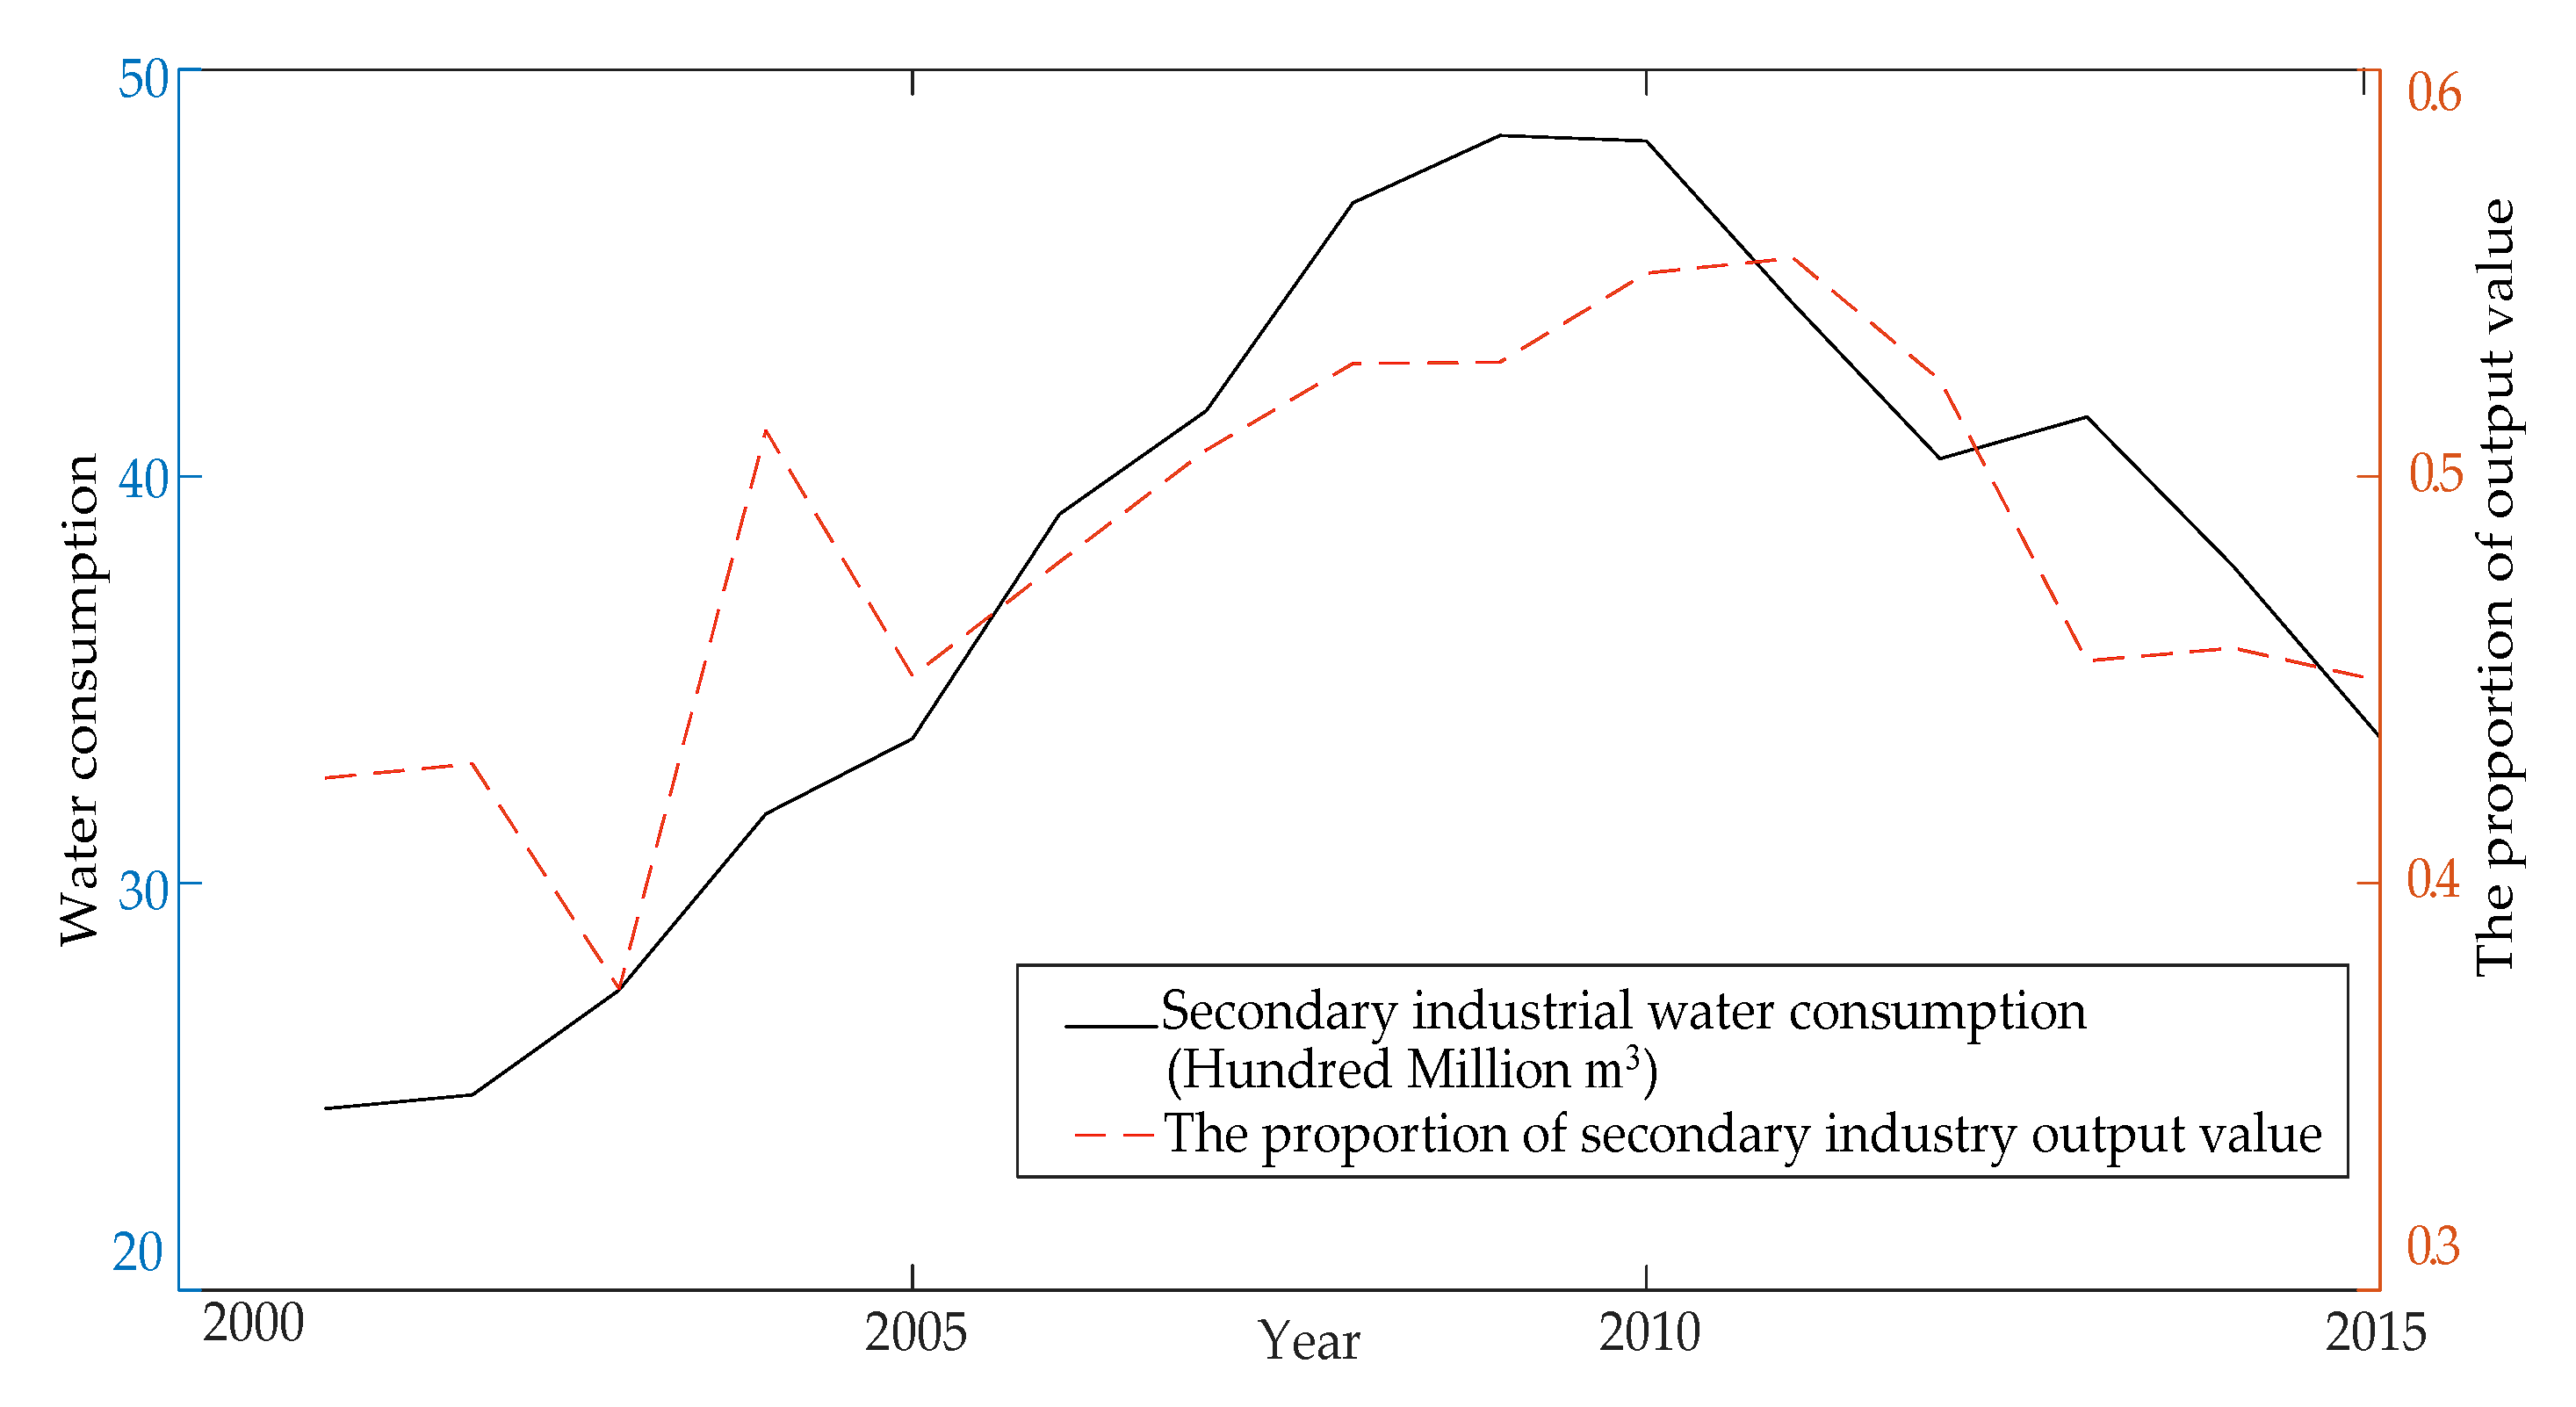
(2) In the second level of grey relational analysis, the grey relational degree of the secondary industrial water consumption is the highest. The primary industrial water consumption ranked second. The scale of the industry determines water consumption to a certain extent, and measures for the sustainable development of water resources can be considered from the perspective of industrial structure adjustment. The development among the three major industries restricts each other and promotes each other. The government should promote the comprehensive, coordinated and sustainable development of the three major industries. The topography of Chongqing has led to a slow pace of agricultural modernization. The government should encourage the development of characteristic agriculture and ensure the use of water in the primary industry. The secondary industry is an advantageous local industry in Chongqing. The government should vigorously develop and eliminate backward production capacity. The economic benefits brought by the tertiary industry are large, and the efficiency of water use is high. The government should encourage the development of the tertiary industry.
(3) In the third level of grey relational analysis, precipitation has a high grey relational degree with water consumption. Total population, water prices, urbanization rates, industrial GDP and output ratio of the three industries are all important factors affecting water consumption. The government should vigorously promote awareness of water conservation and the efficient water-saving technologies should be developed. The system of rainwater harvesting and utilization should be improved. At the same time, the ladder pricing system for water should be improved and the scope of implementation should be expanded.


