Failure Impact Assessment for Large-Scale Landslides Located Near Human Settlement: Case Study in Southern Taiwan

Abstract
1. Introduction
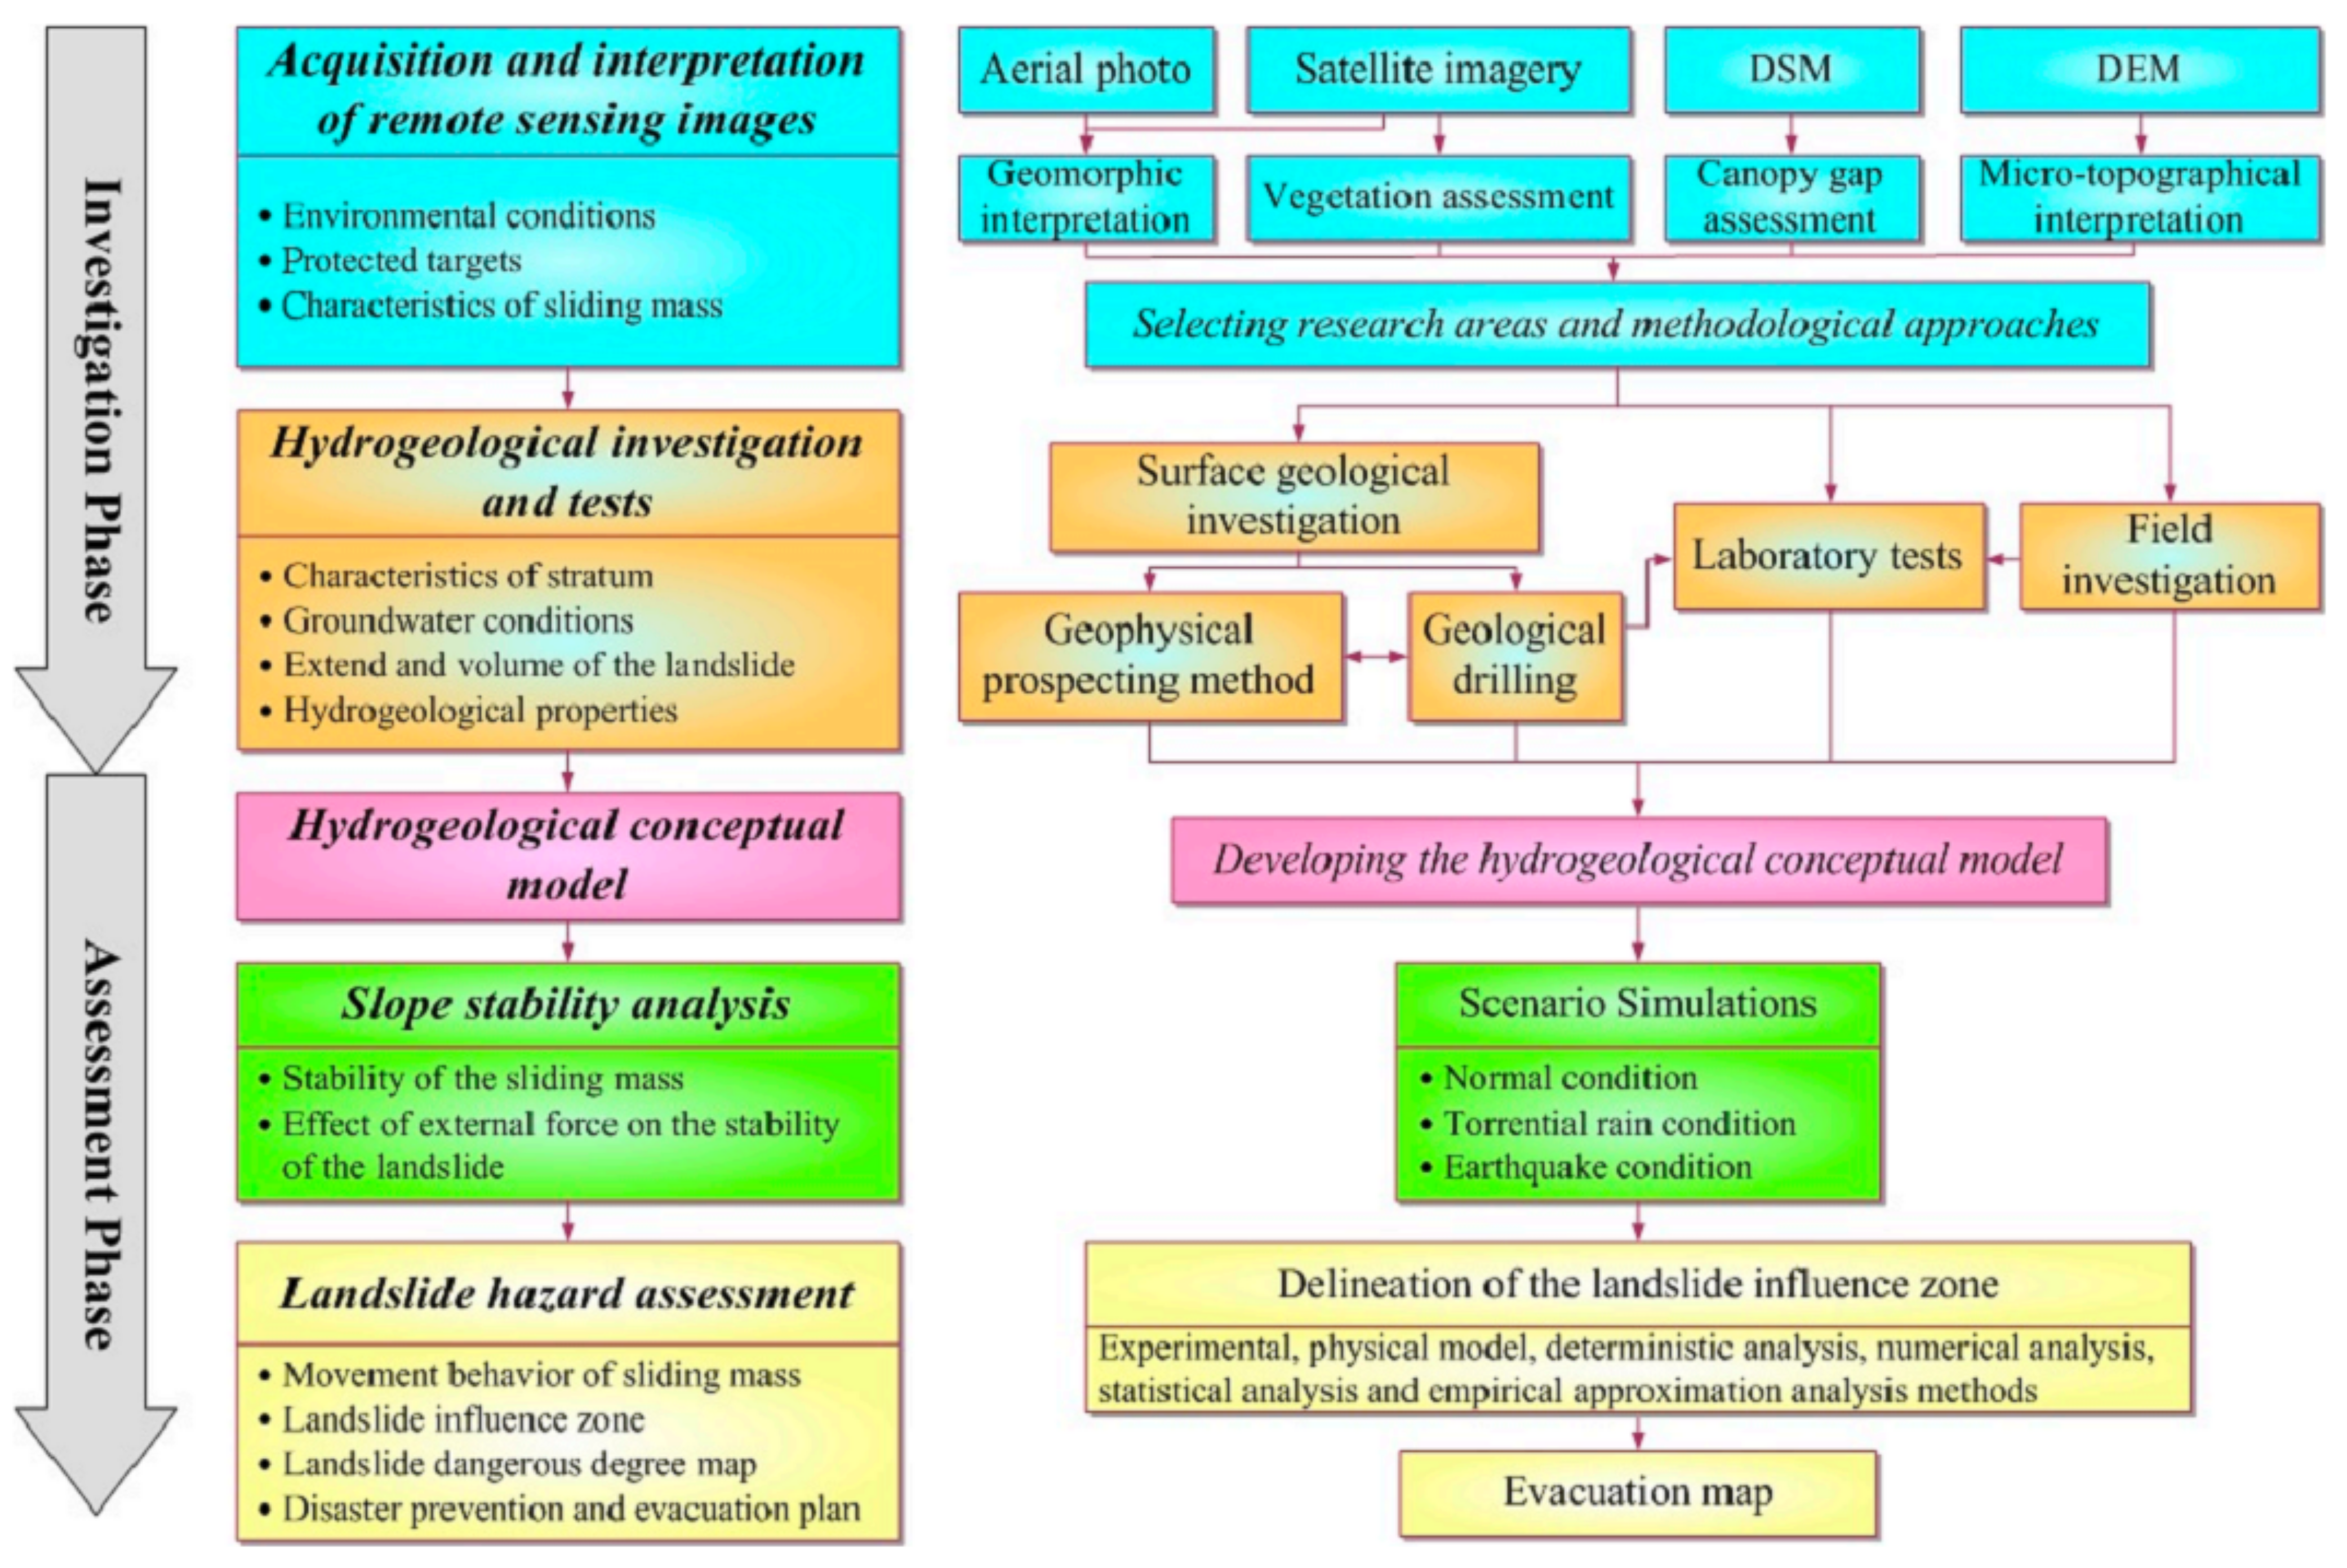
2. Methodology
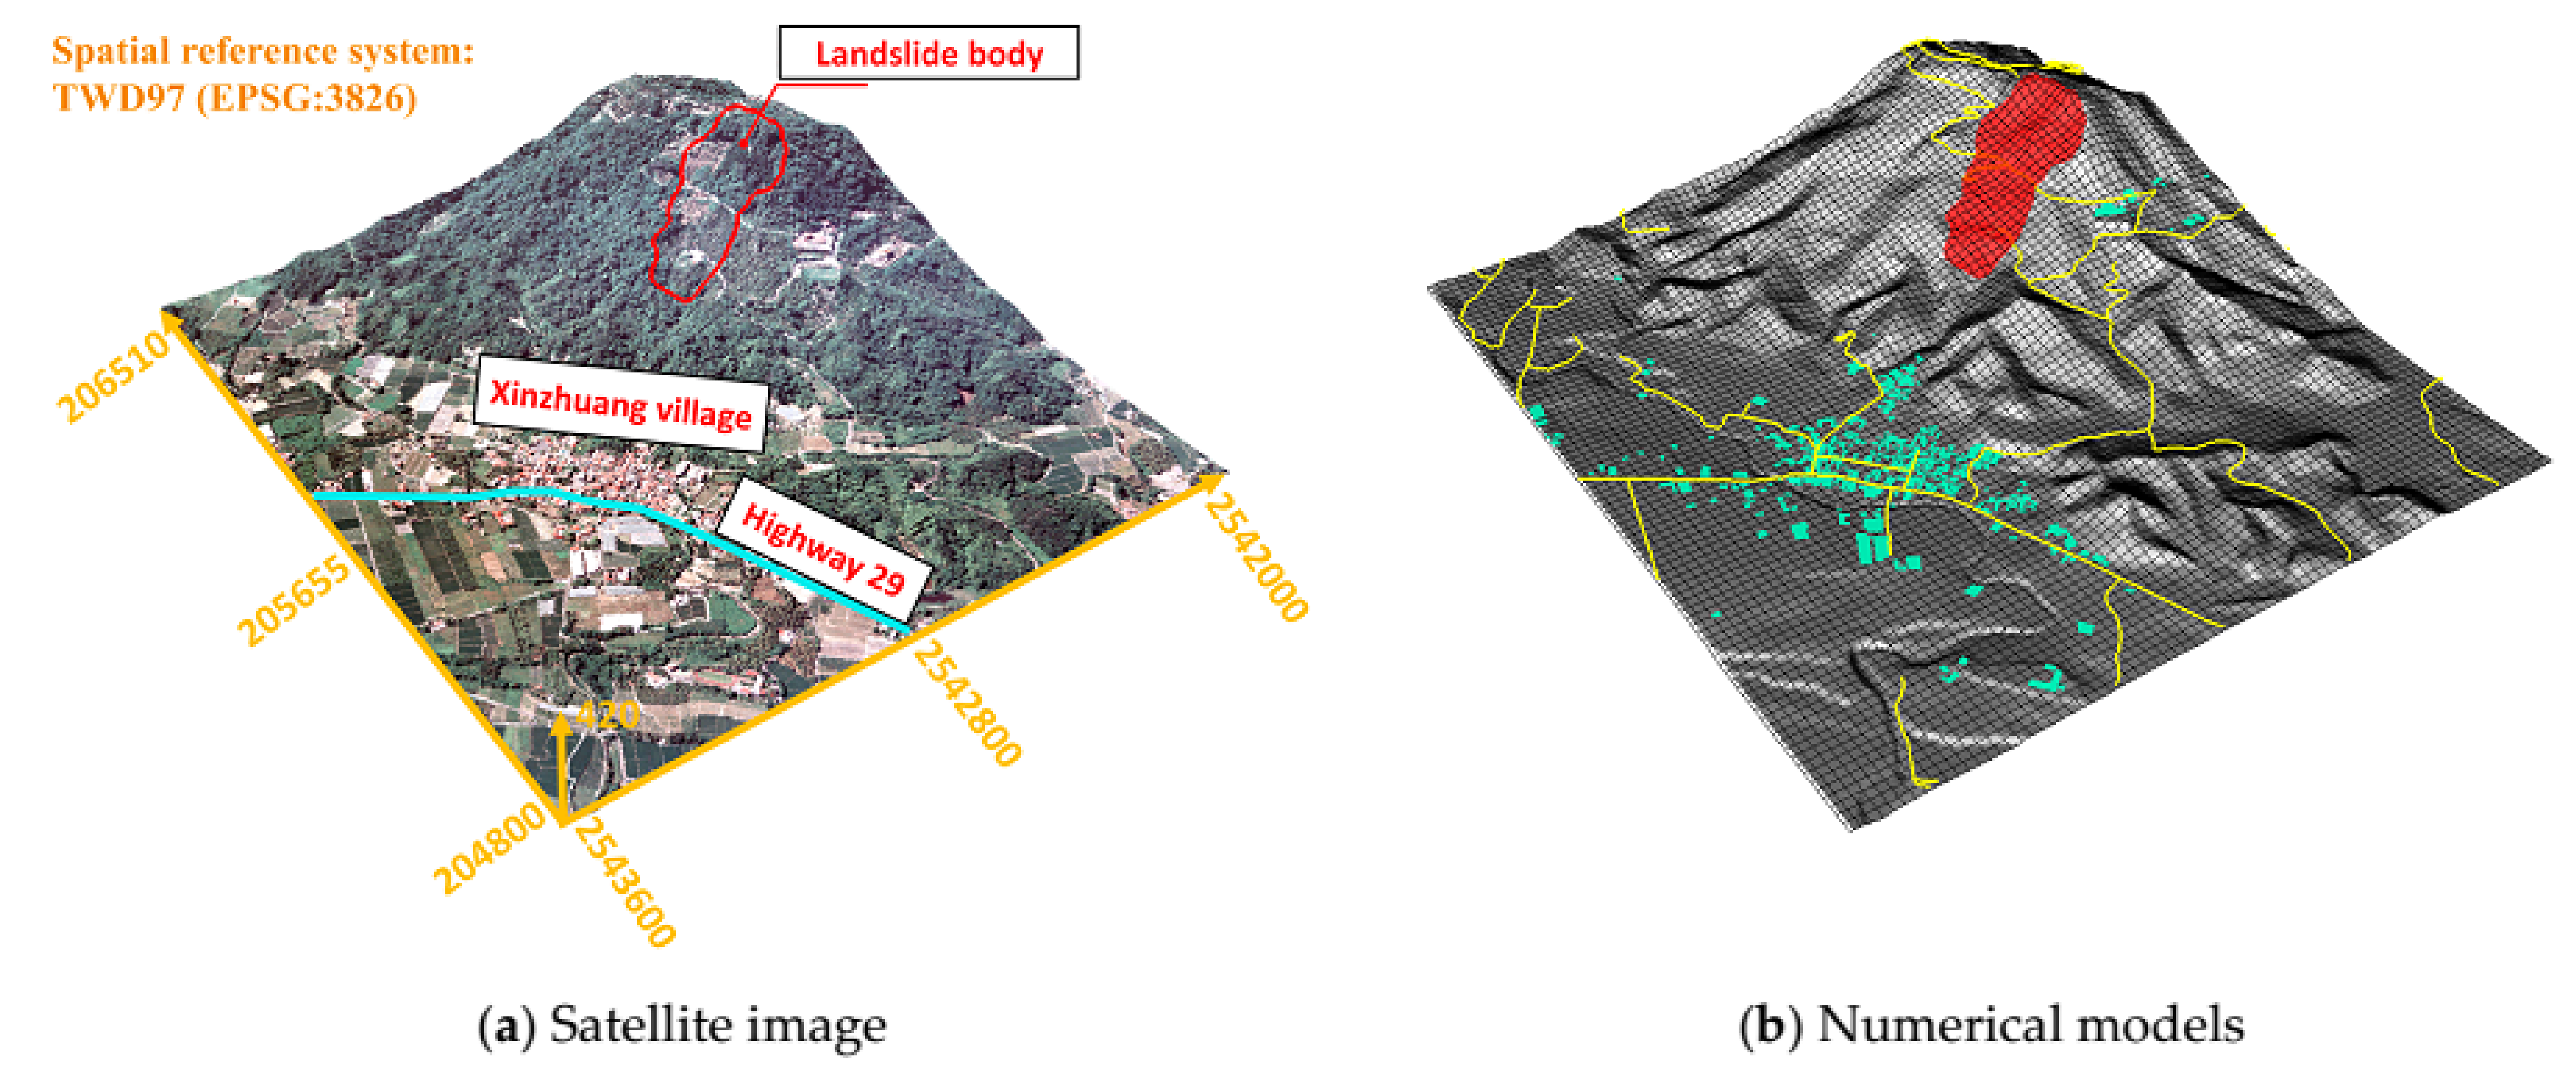
2.1. Acquisition and Interpretation of Remote Sensing Images
2.2. Hydrogeological Investigations and Tests
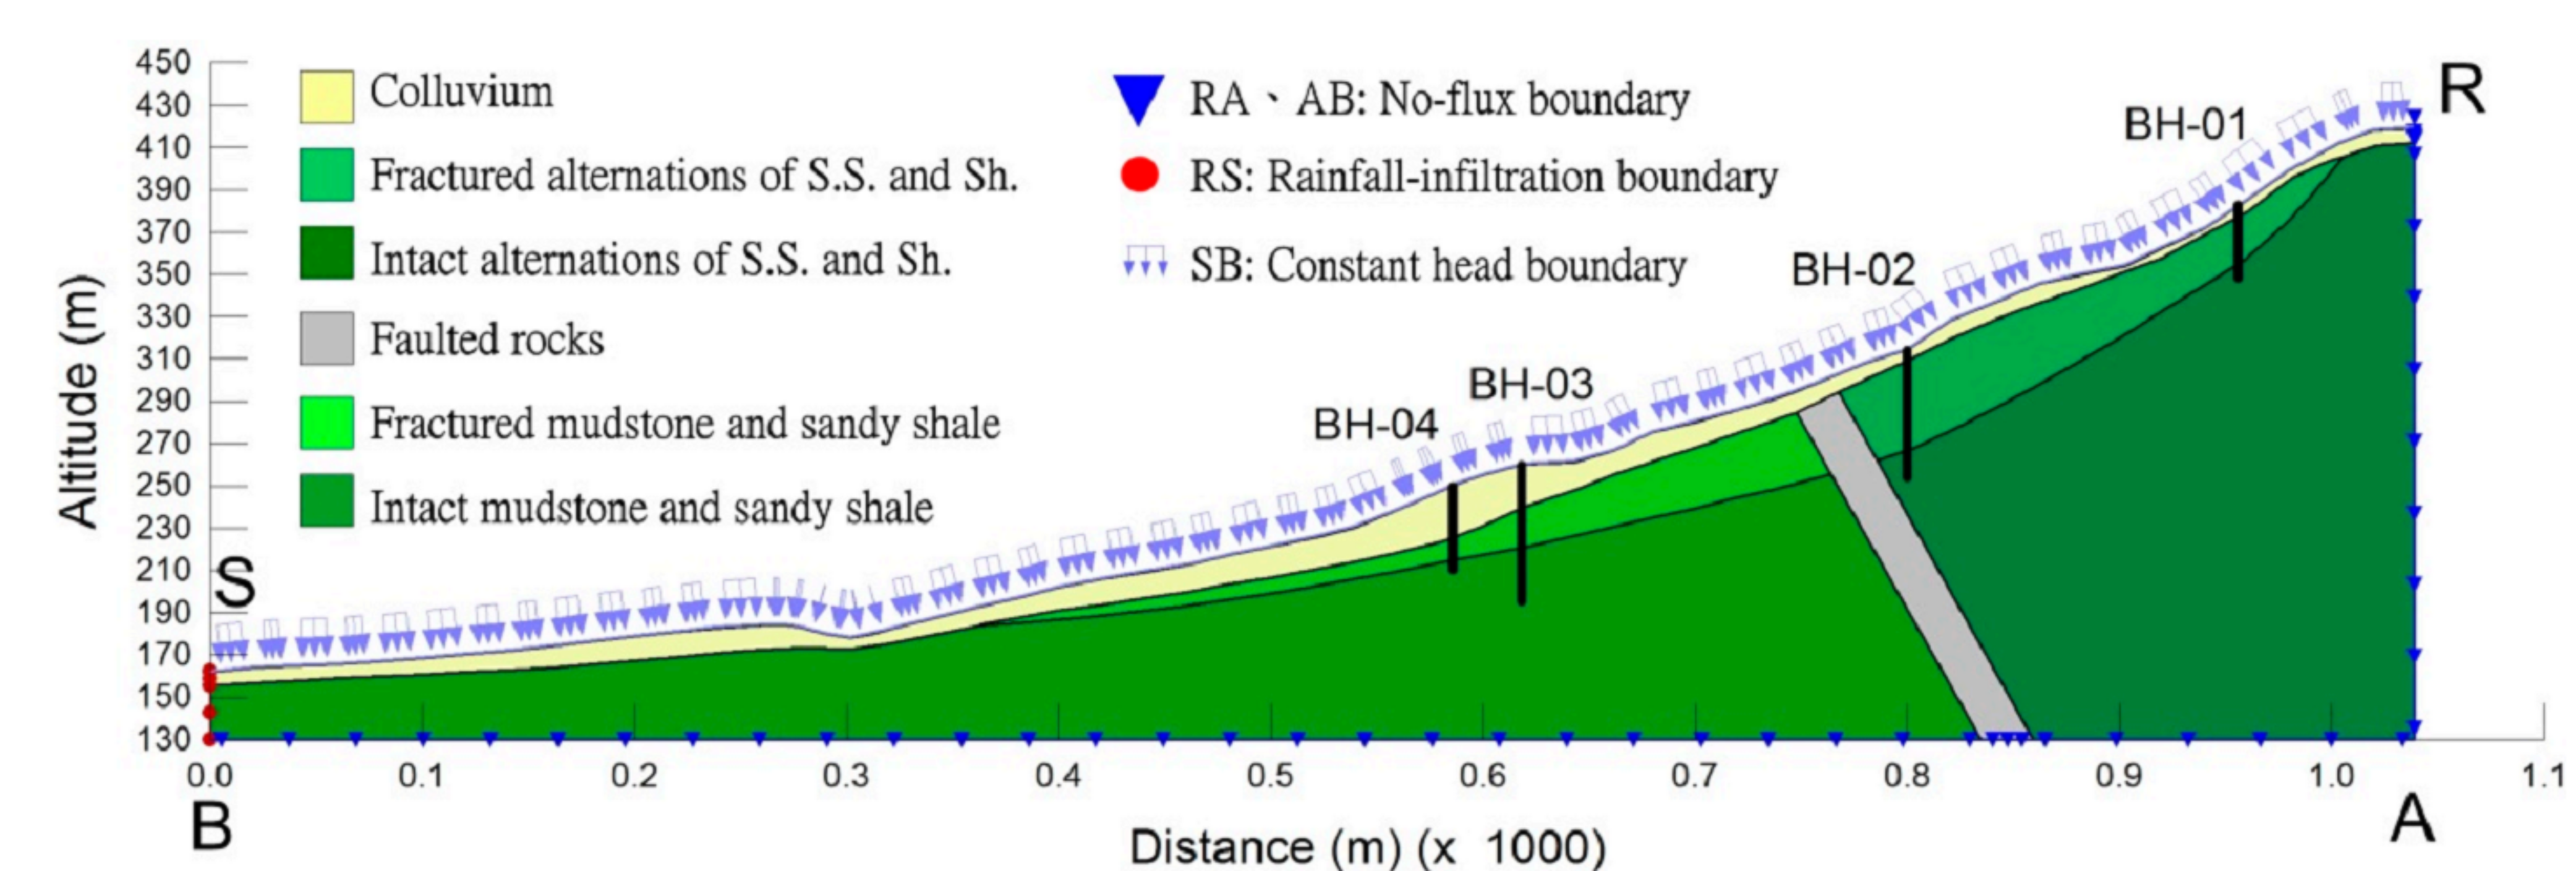
2.3. Developing the Hydrogeological Conceptual Model
2.4. Slope Stability Analysis
2.5. Delineation of the Landslide Impact Zone
3. Case Study
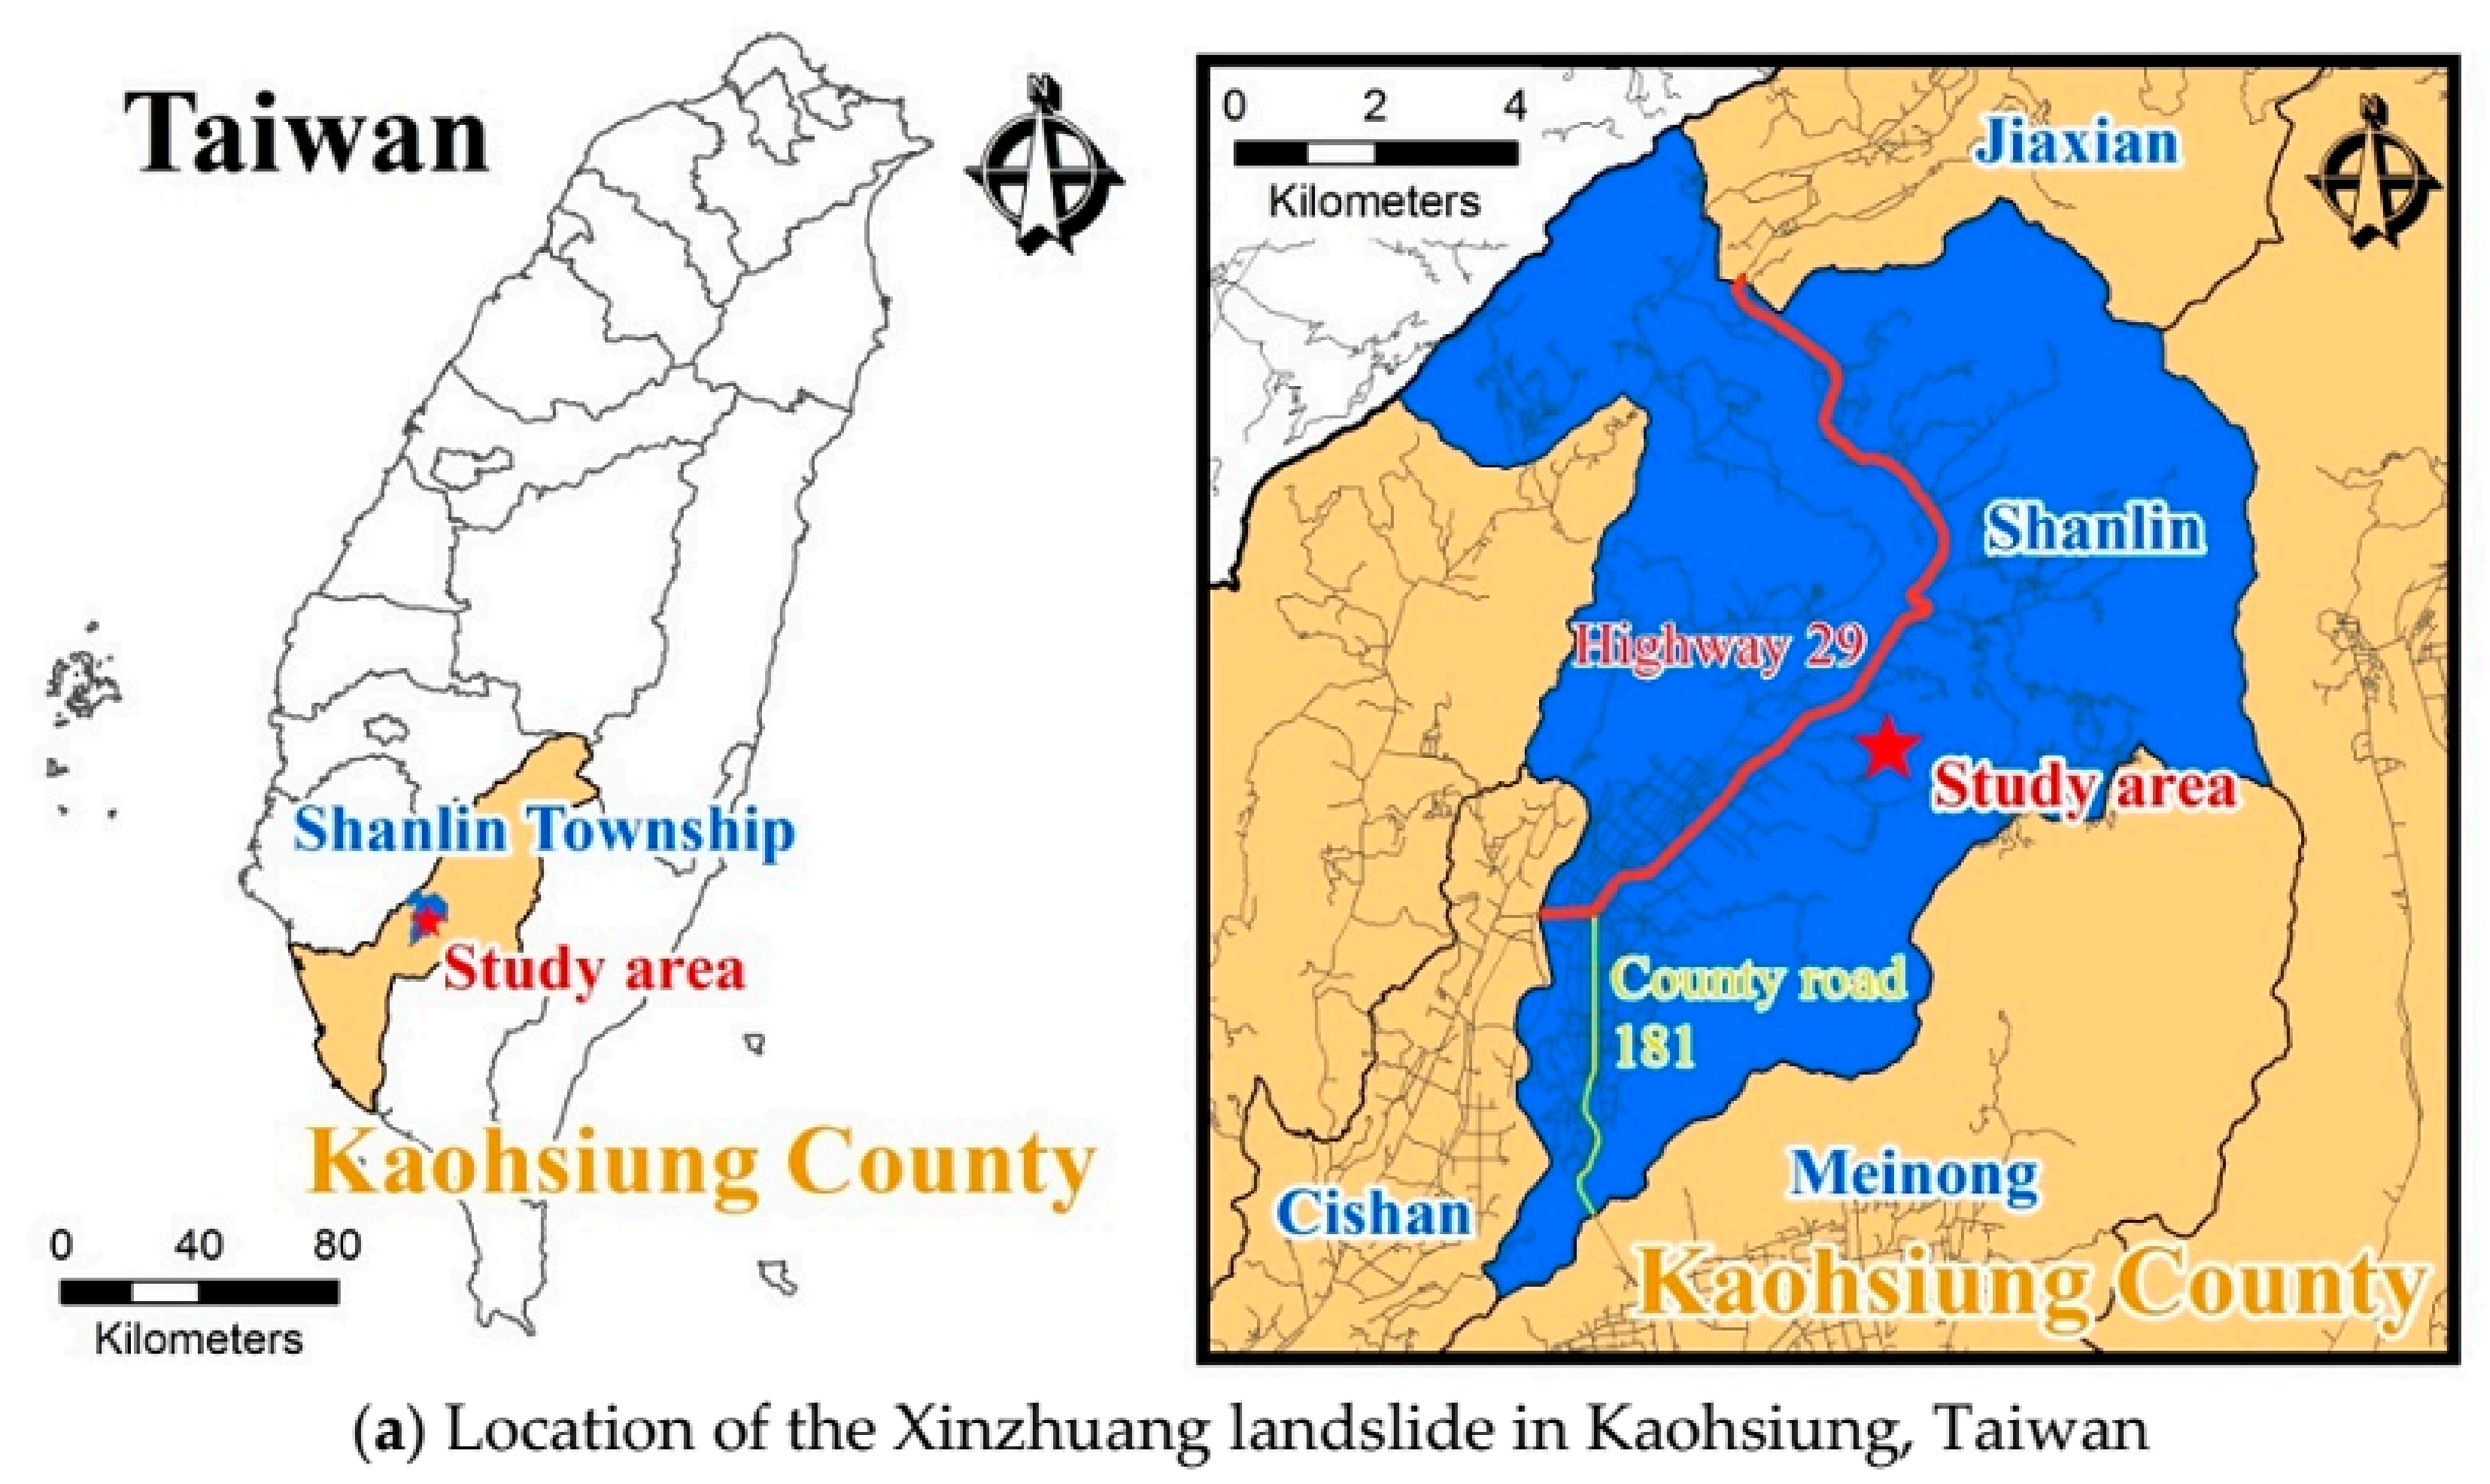
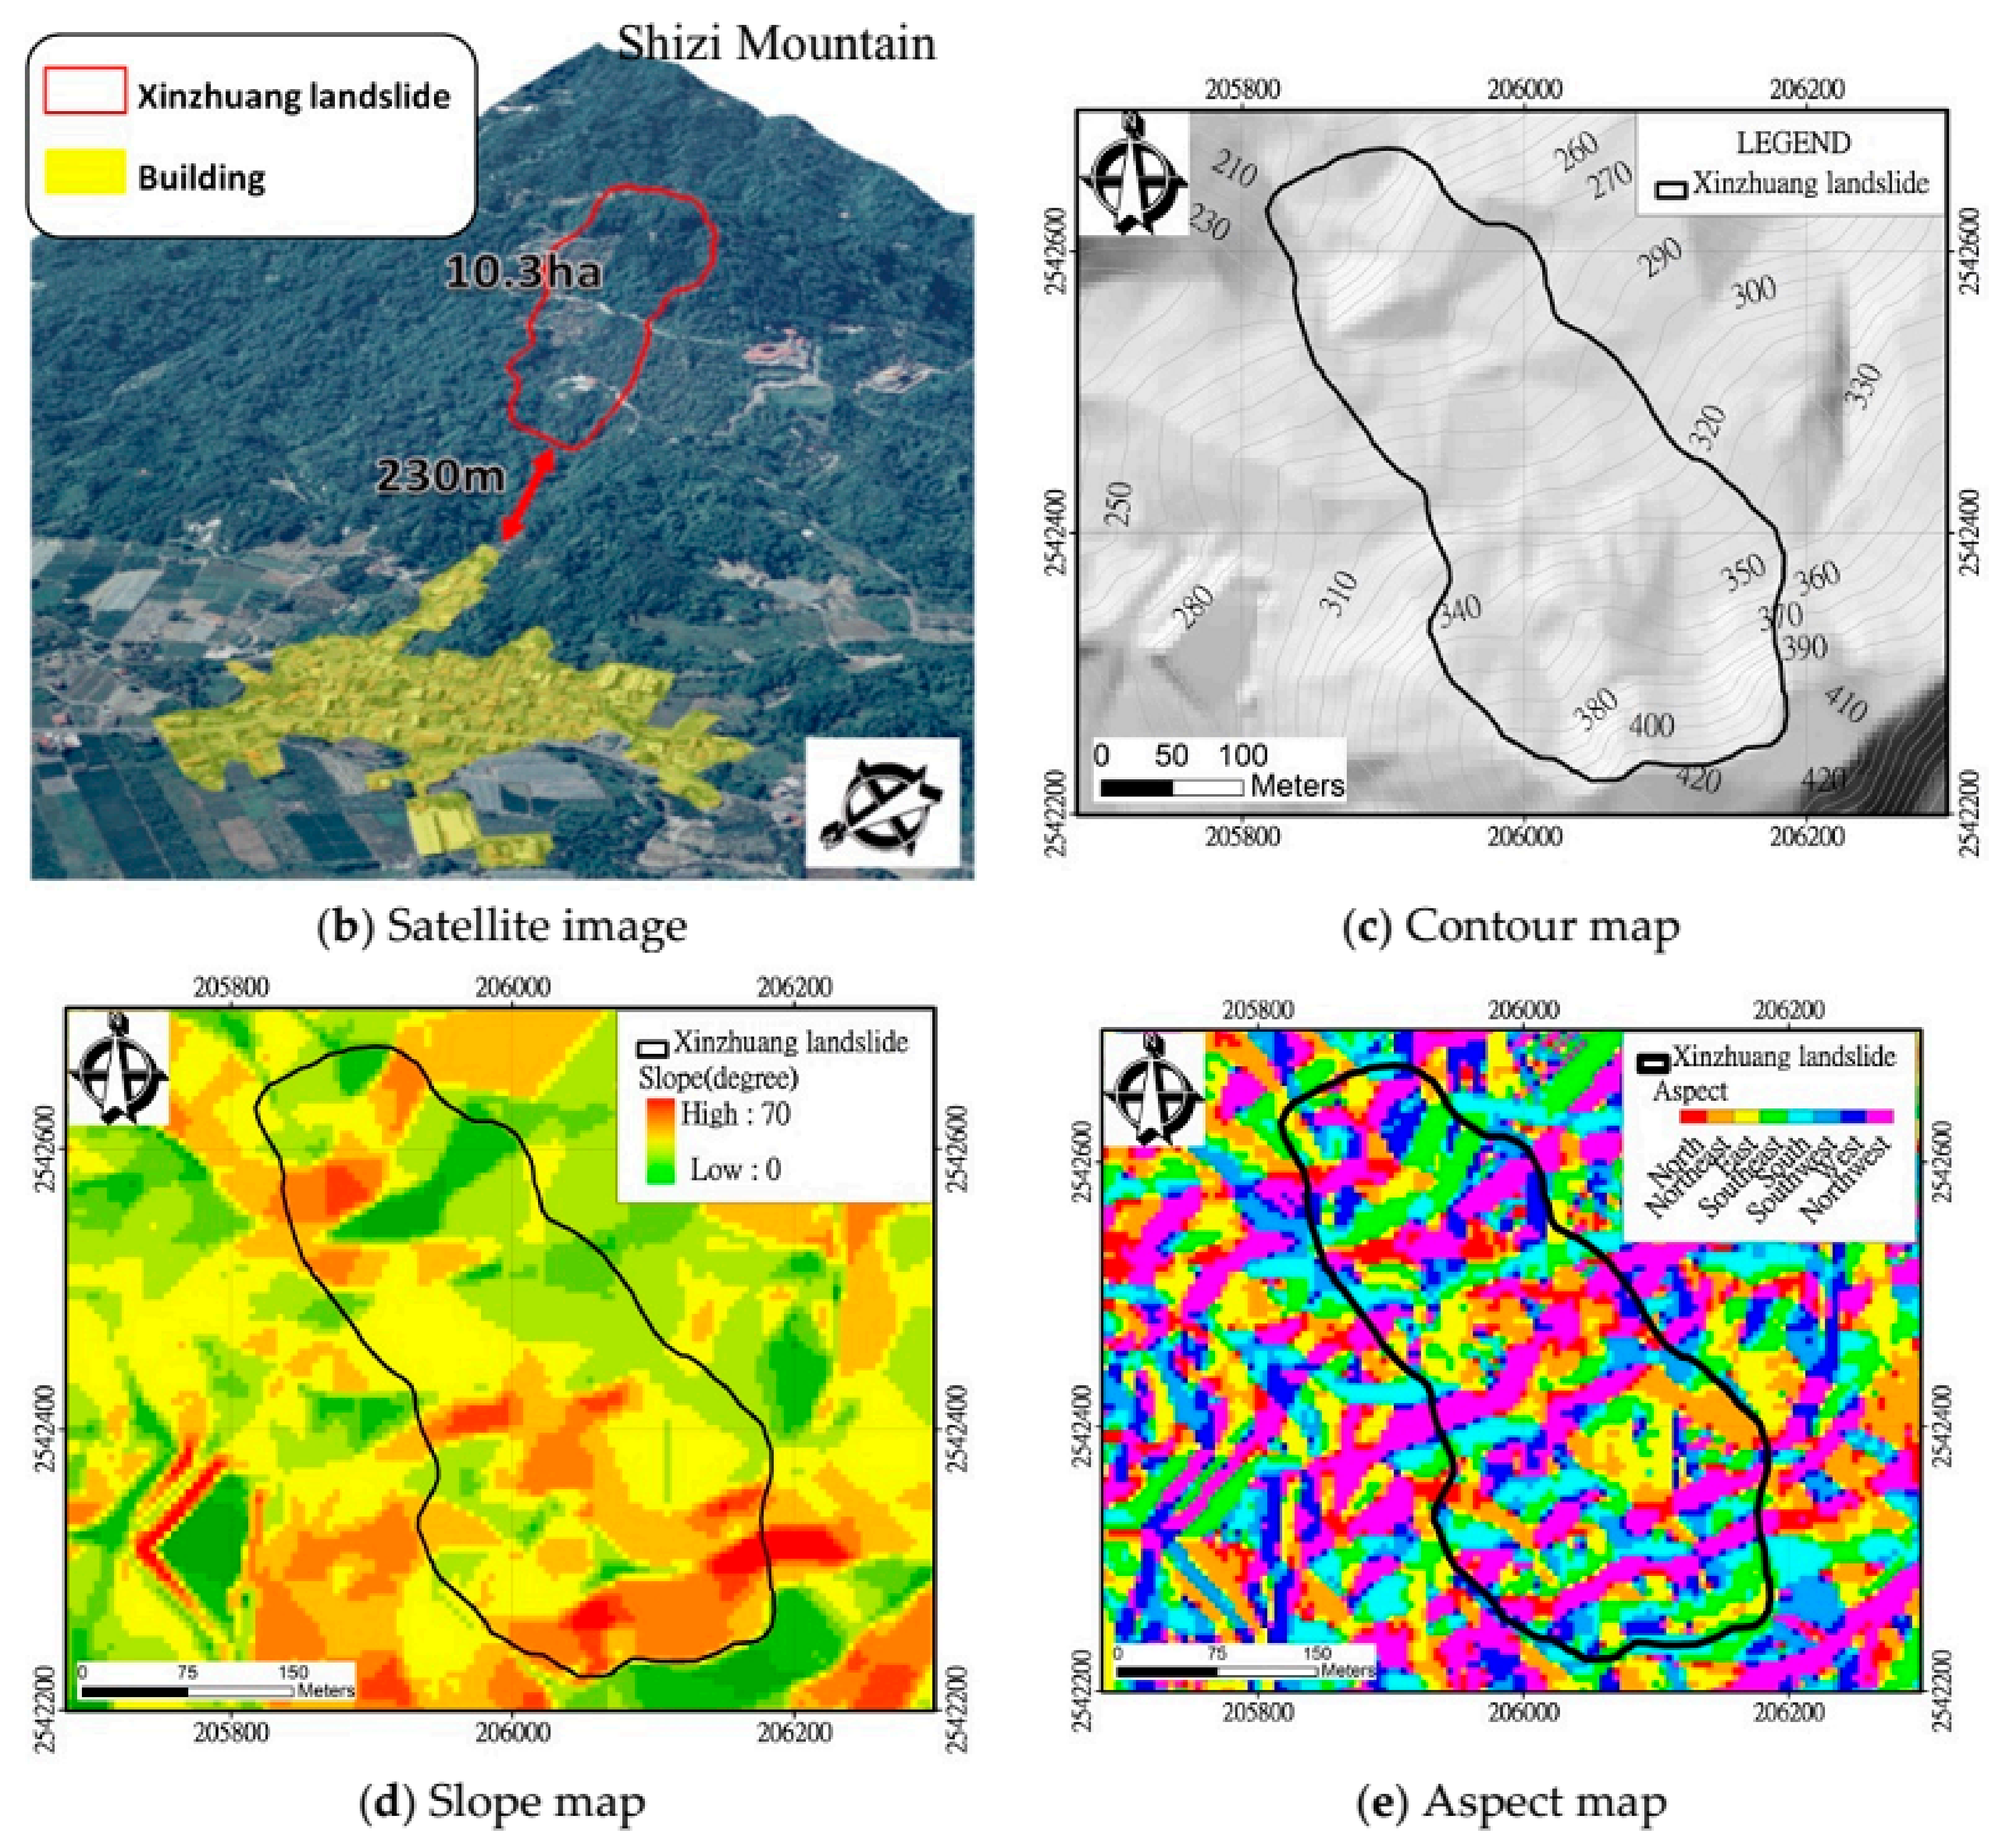
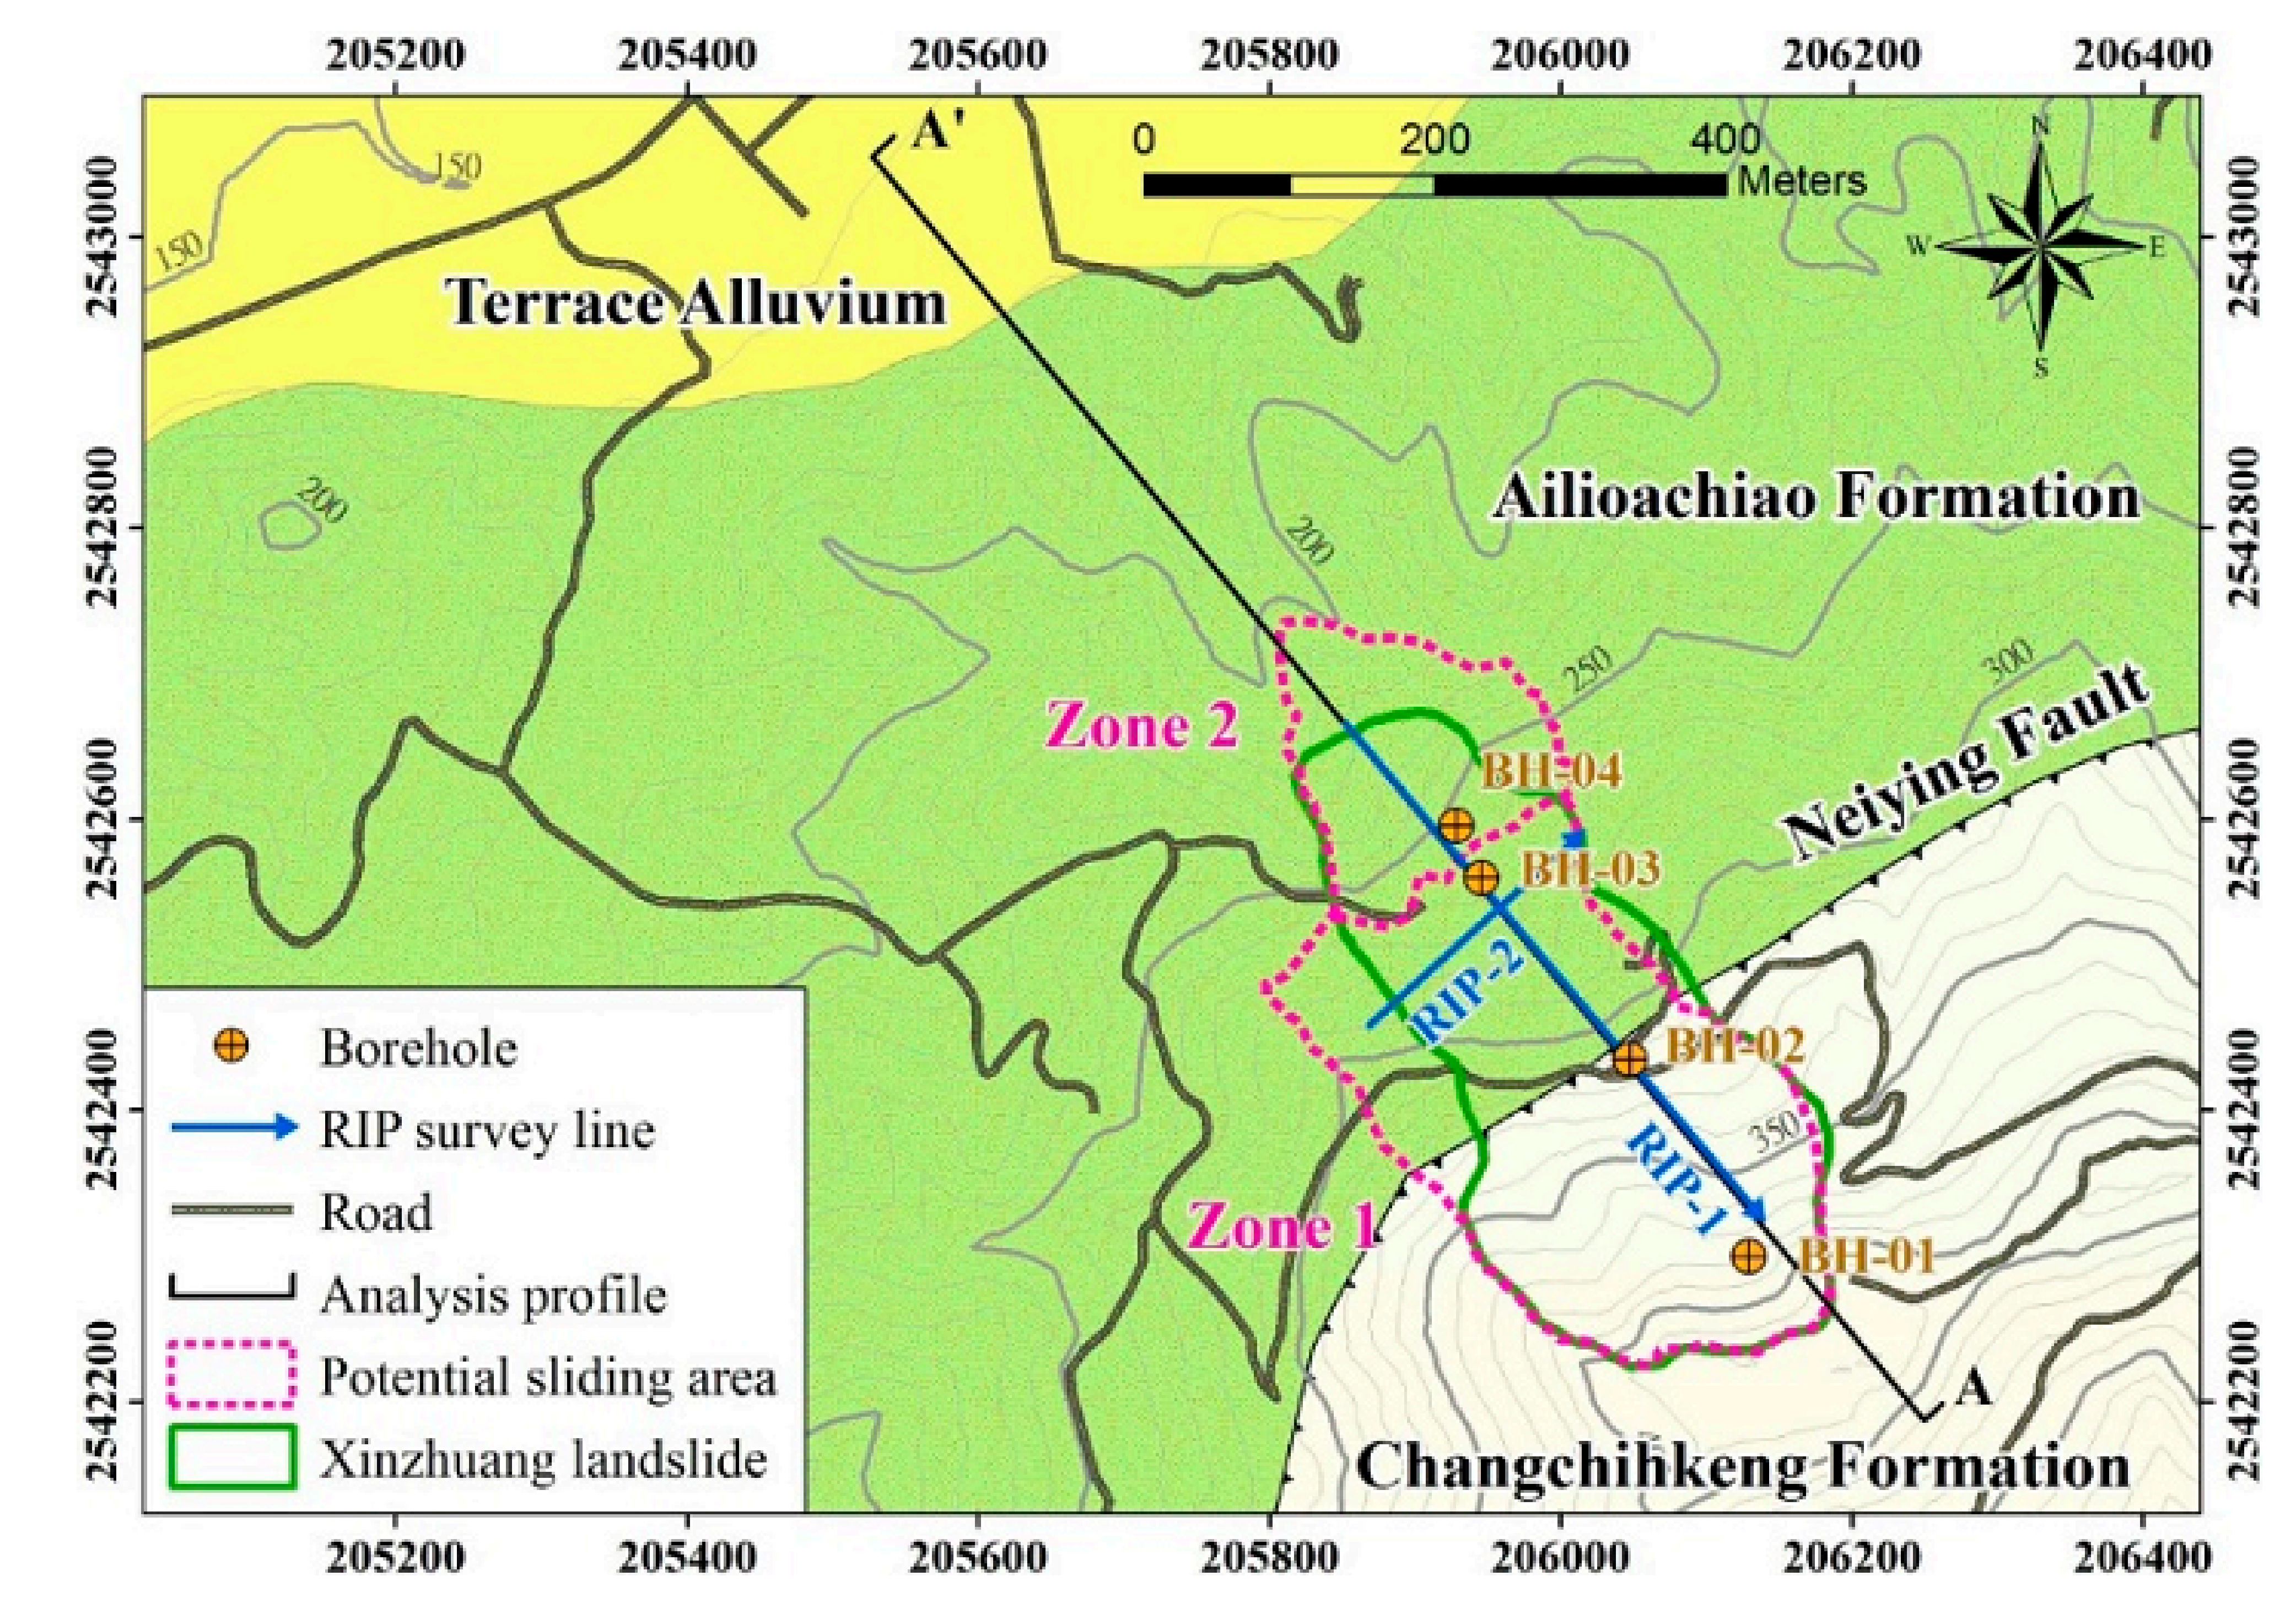
3.1. Study Area
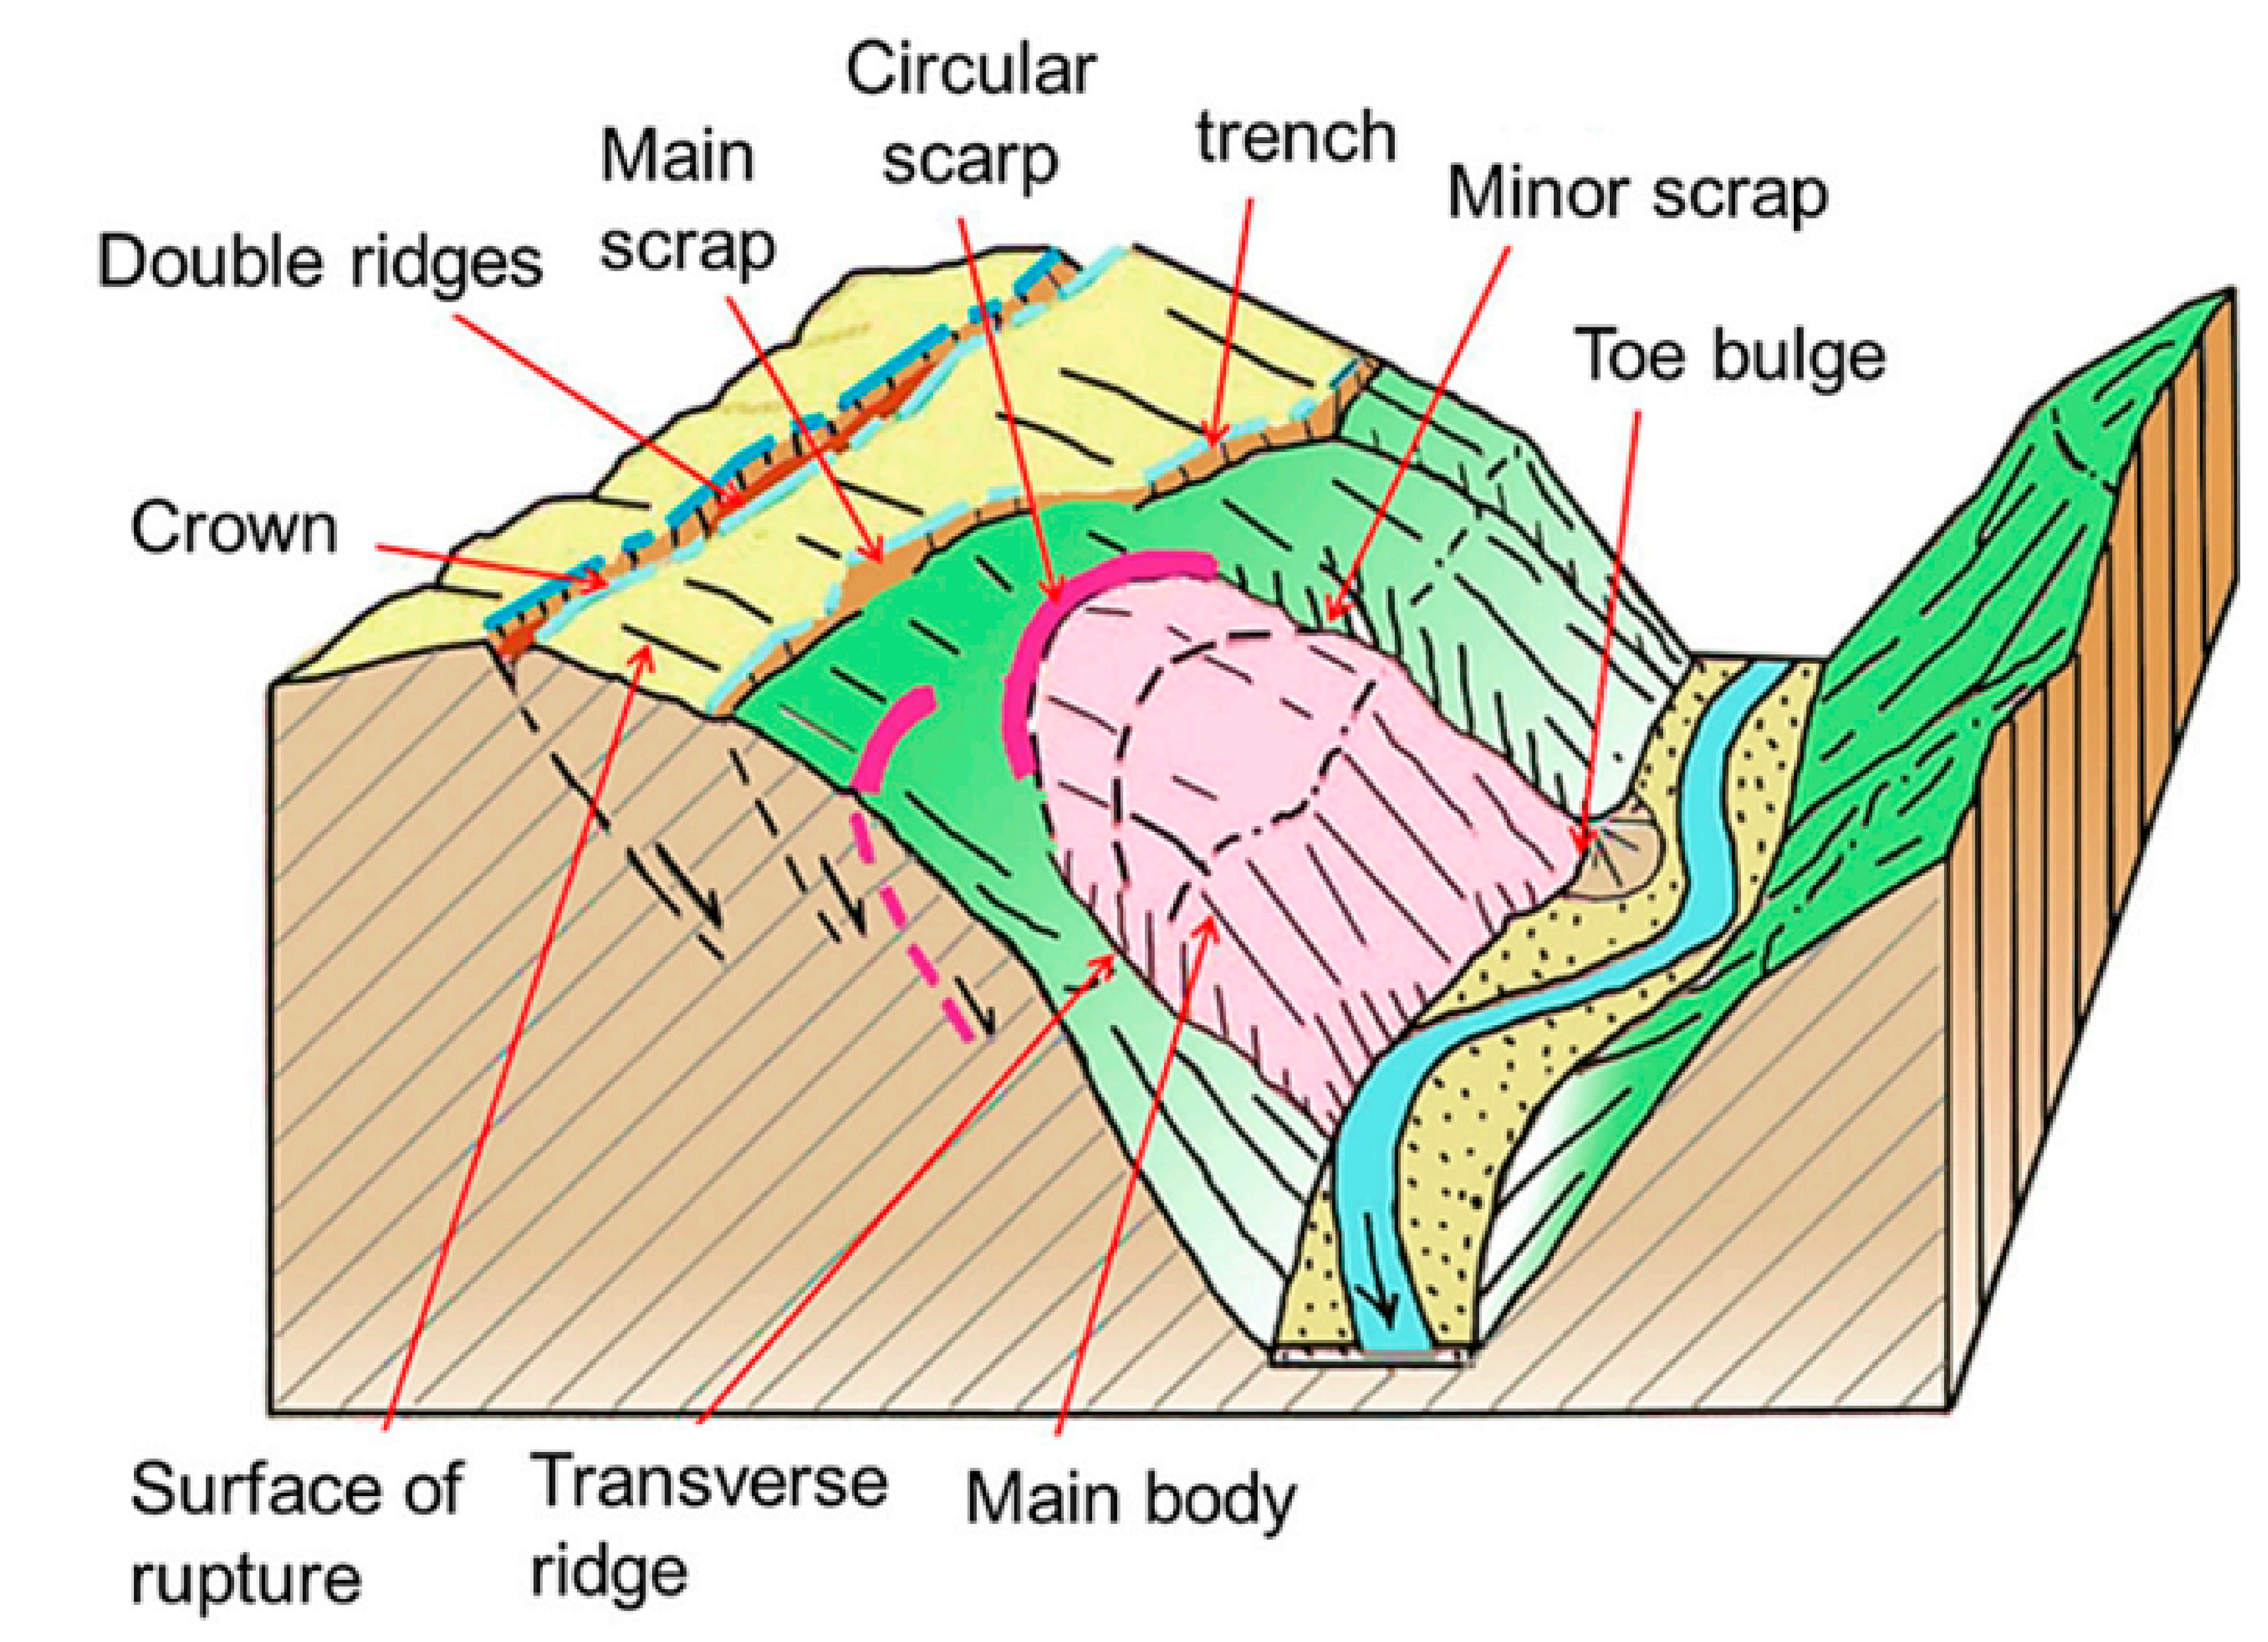
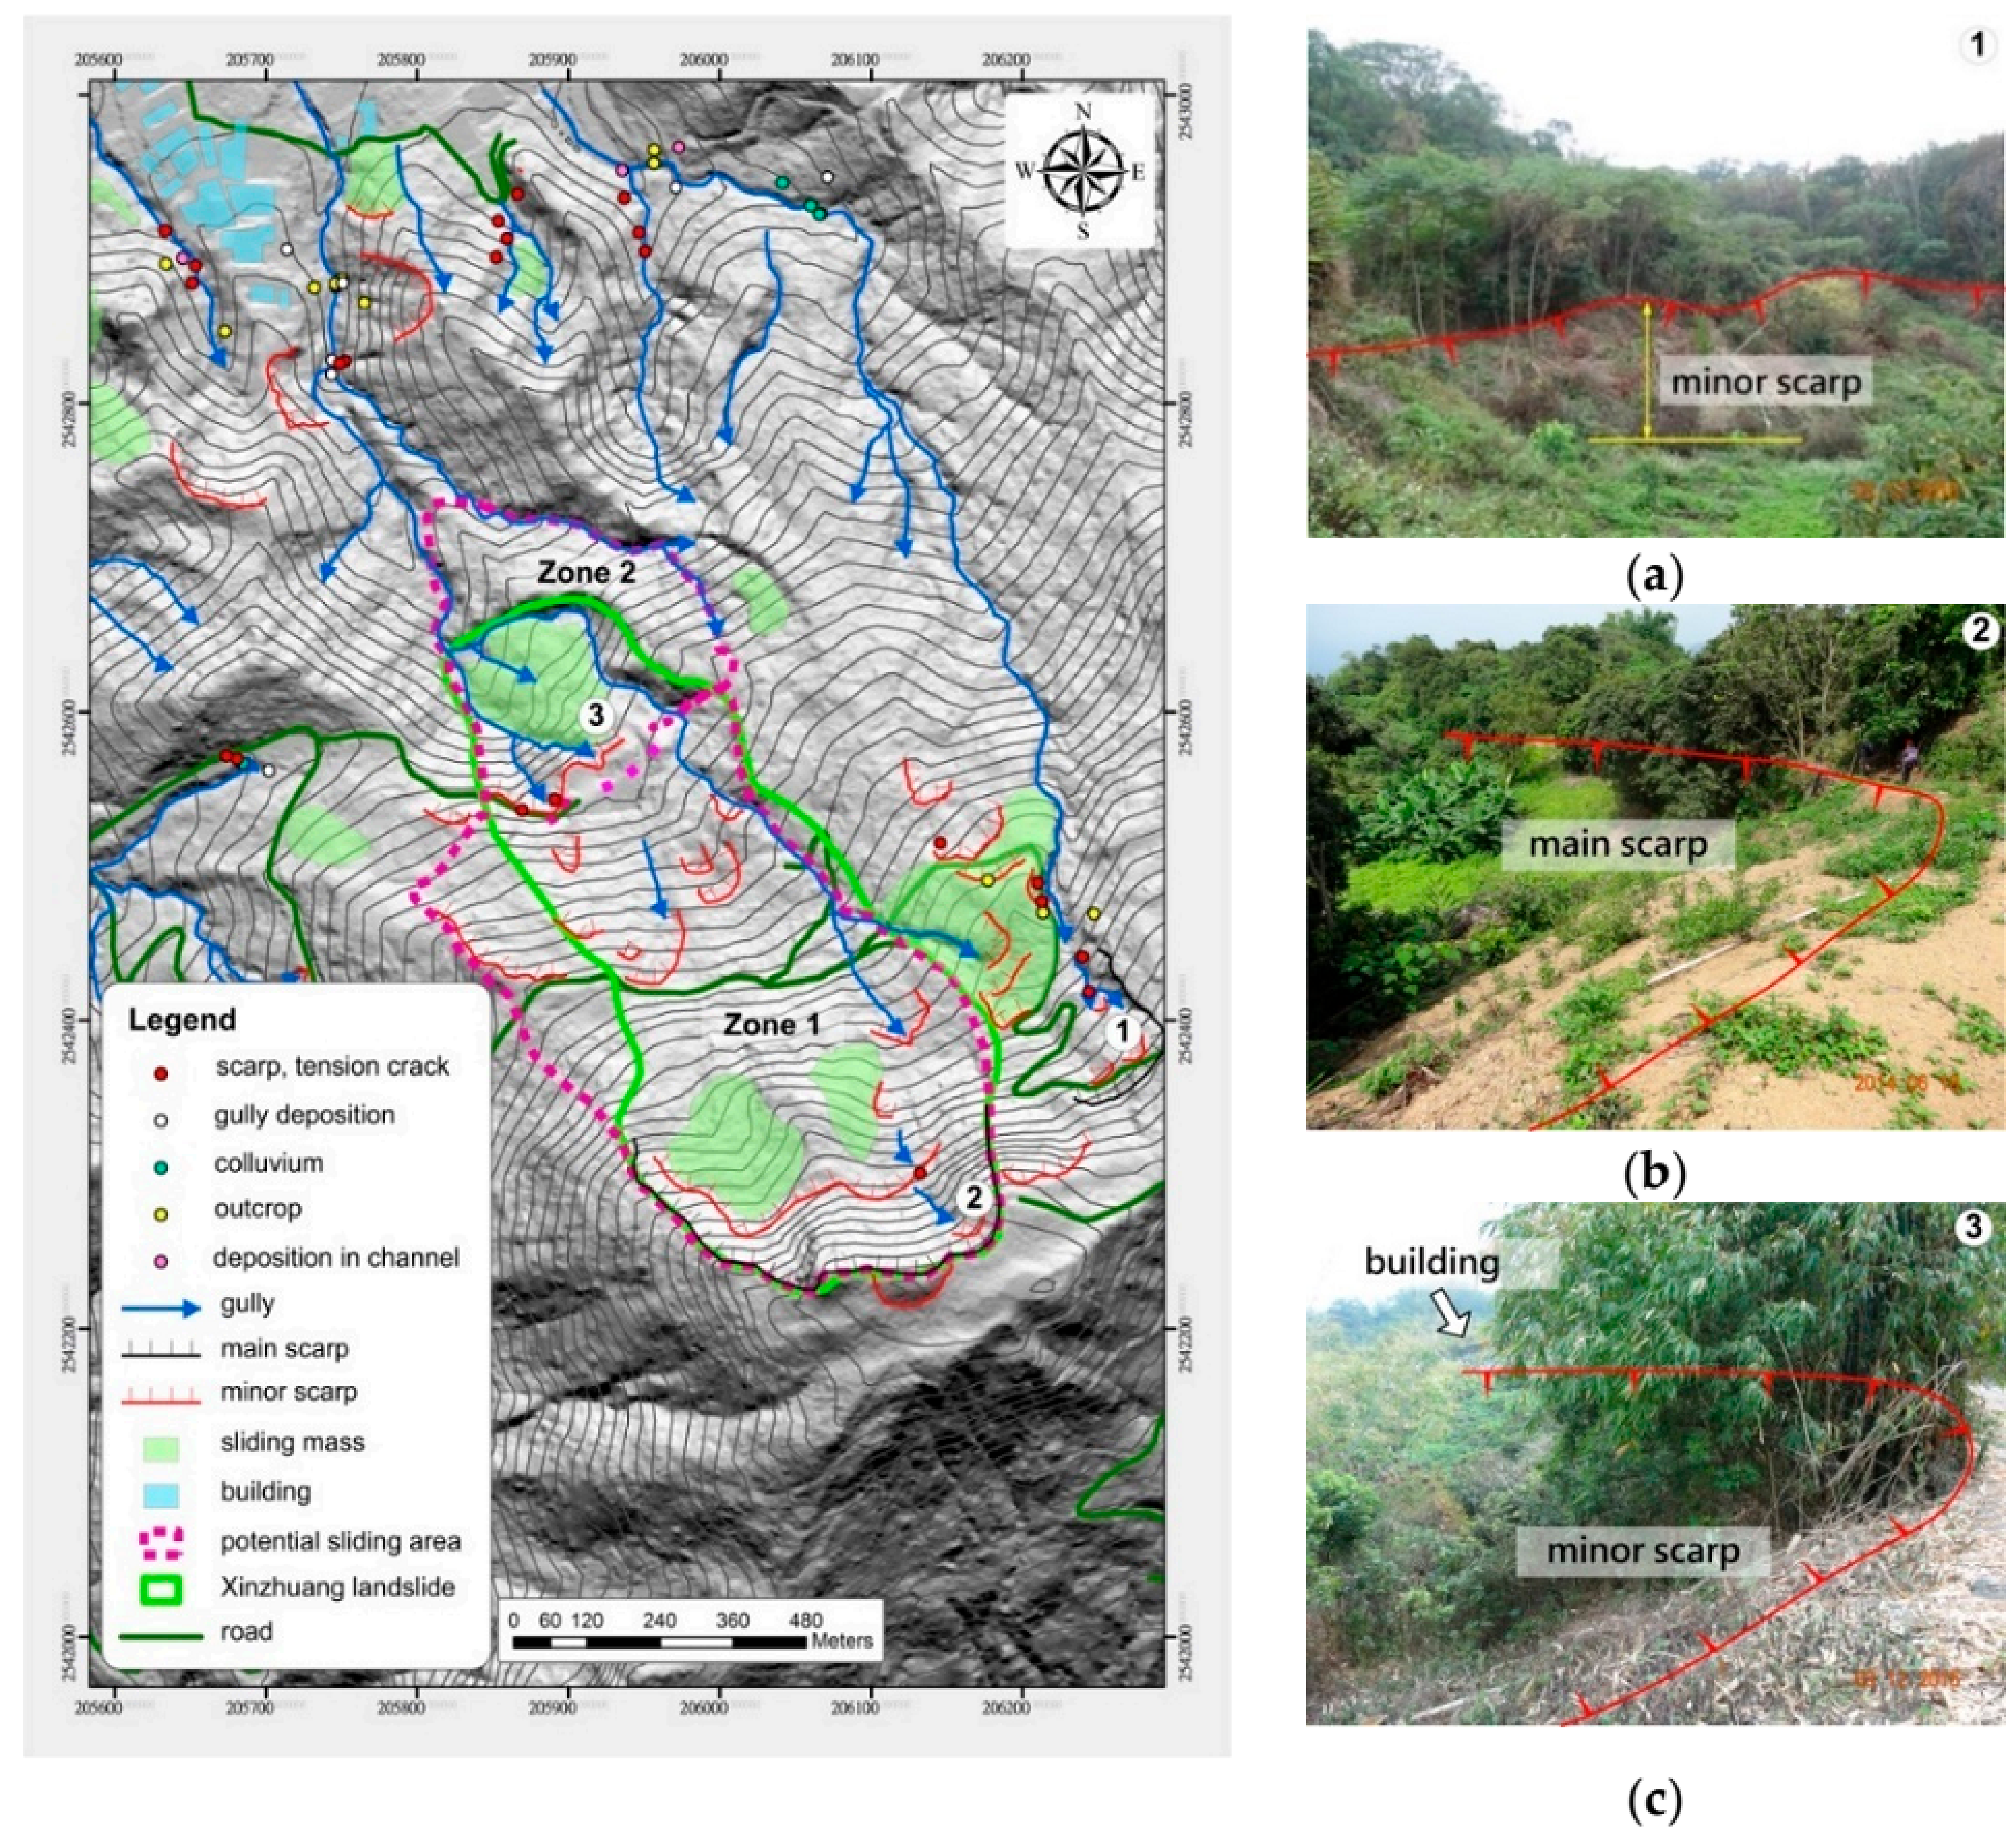
3.2. Geomorphological Interpretation
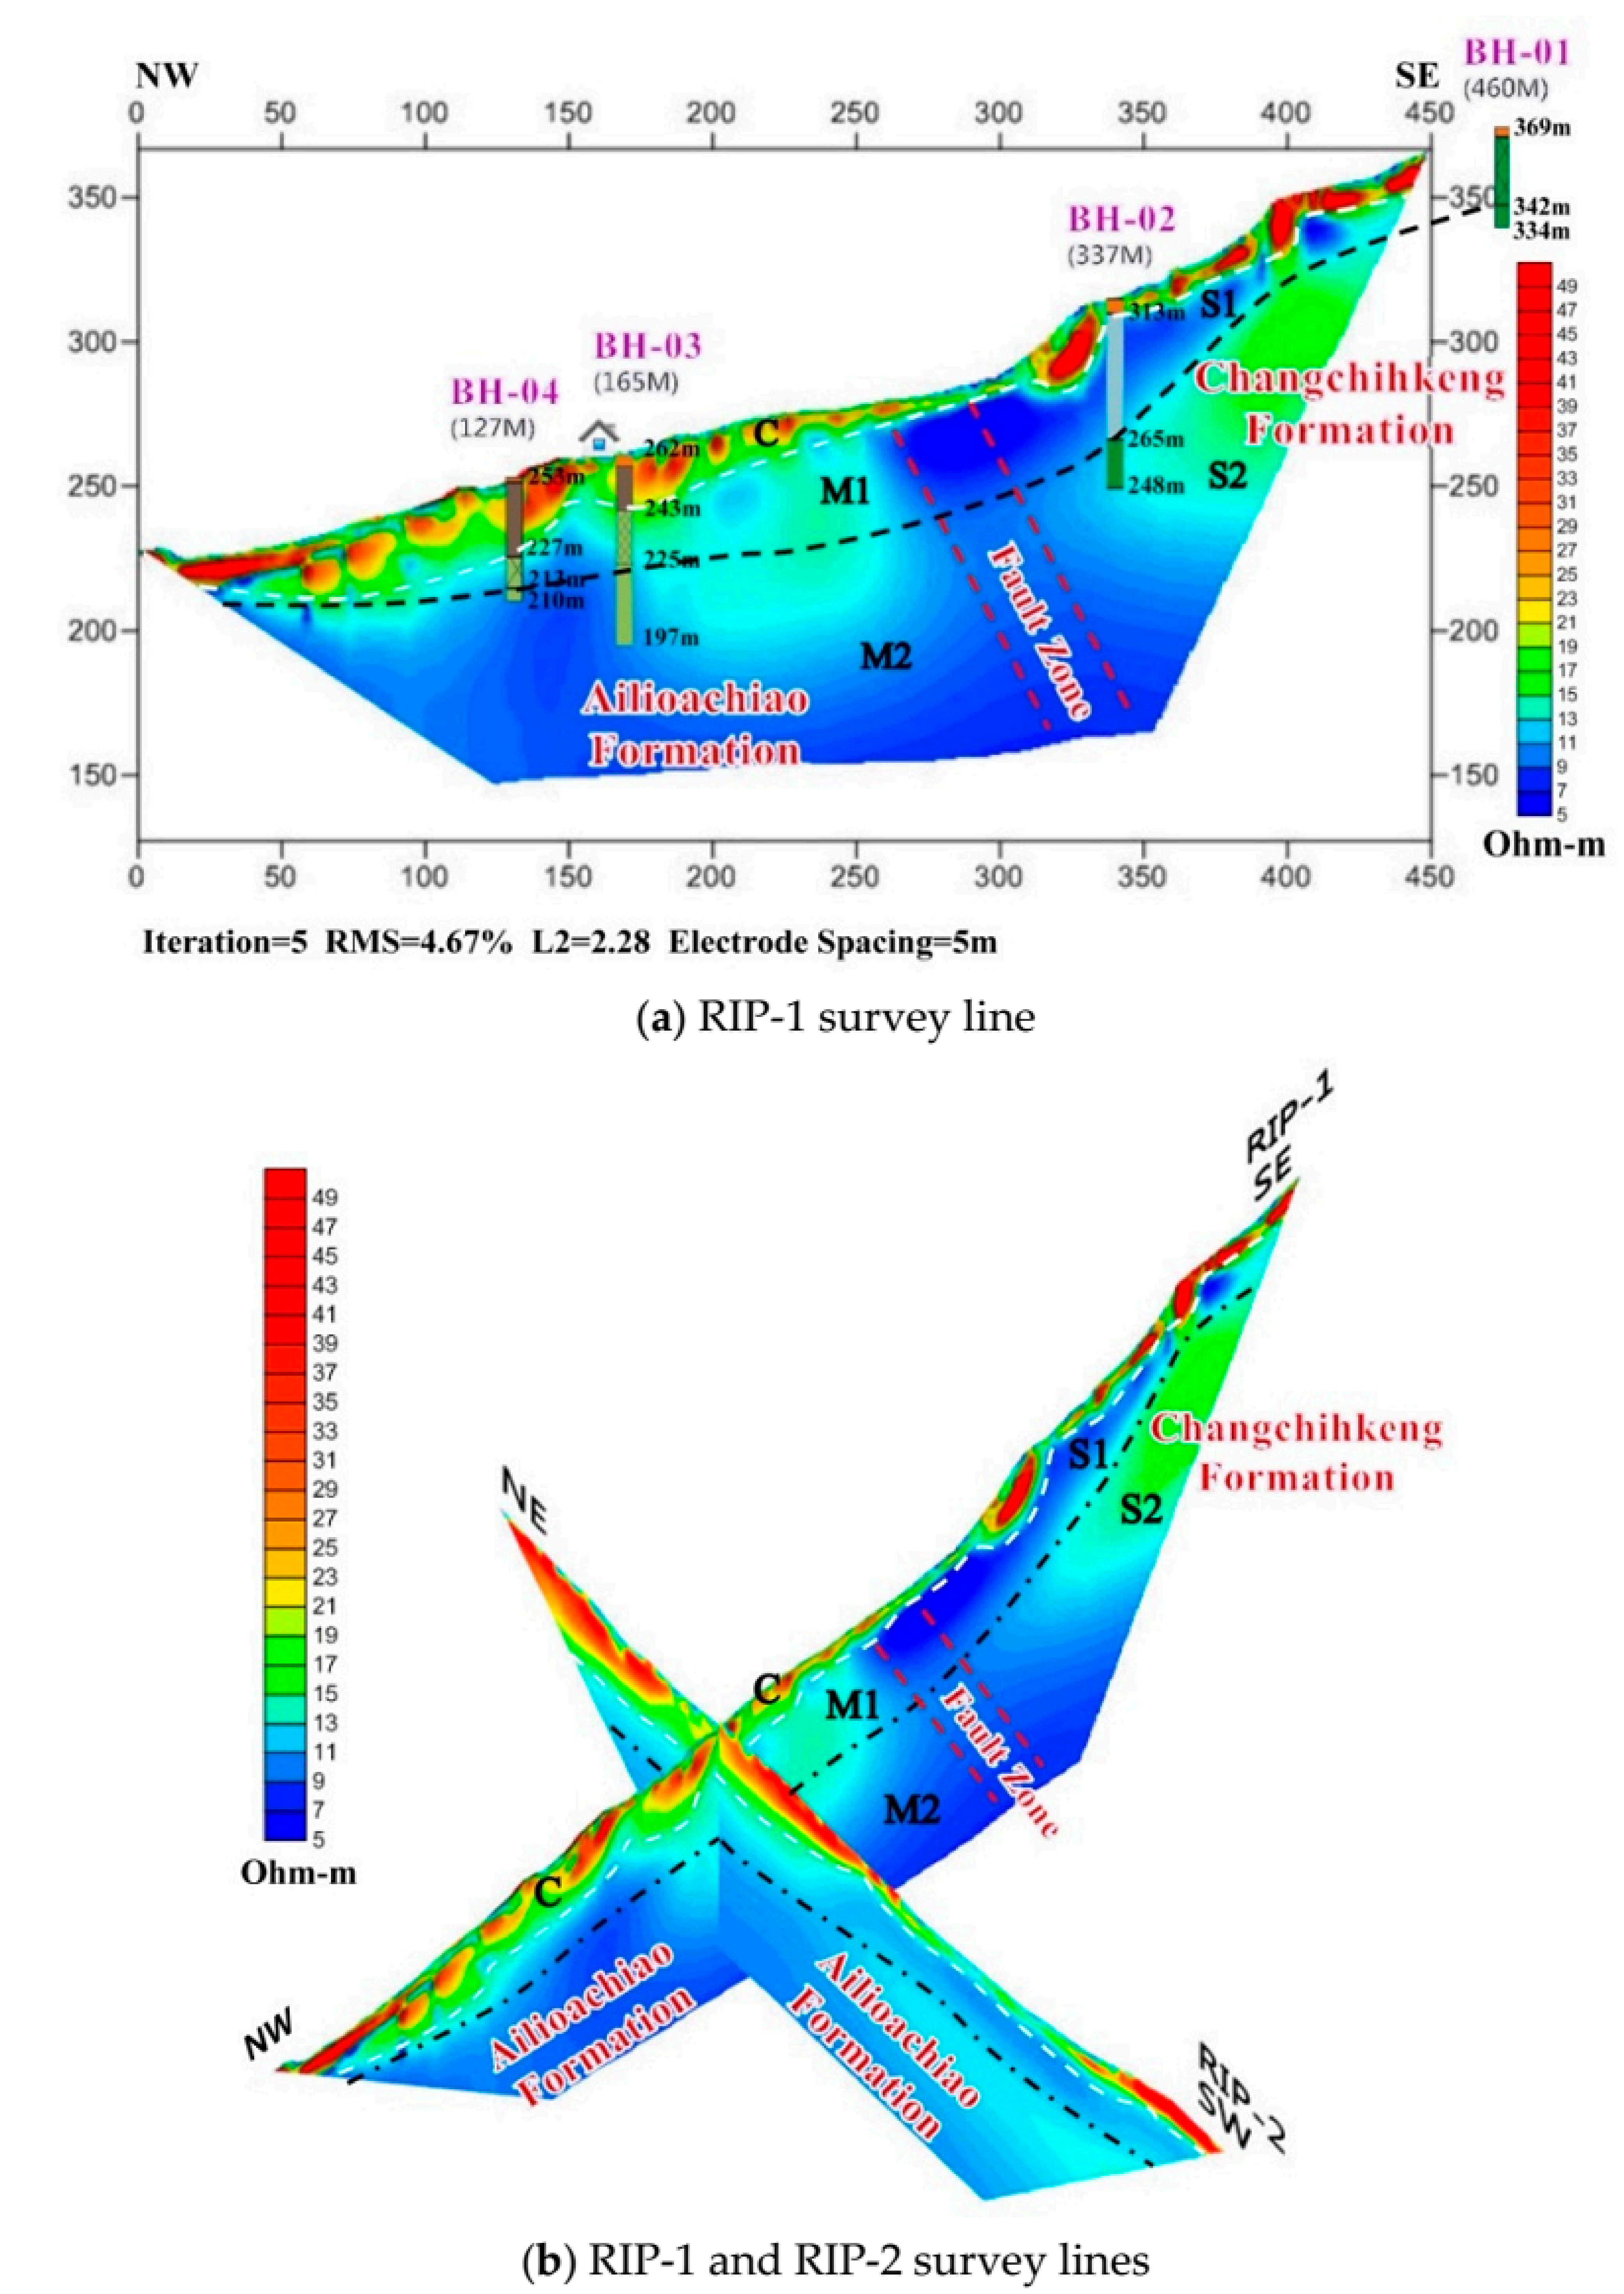
3.3. Hydrogeological Investigations and Tests
4. Results and Discussion
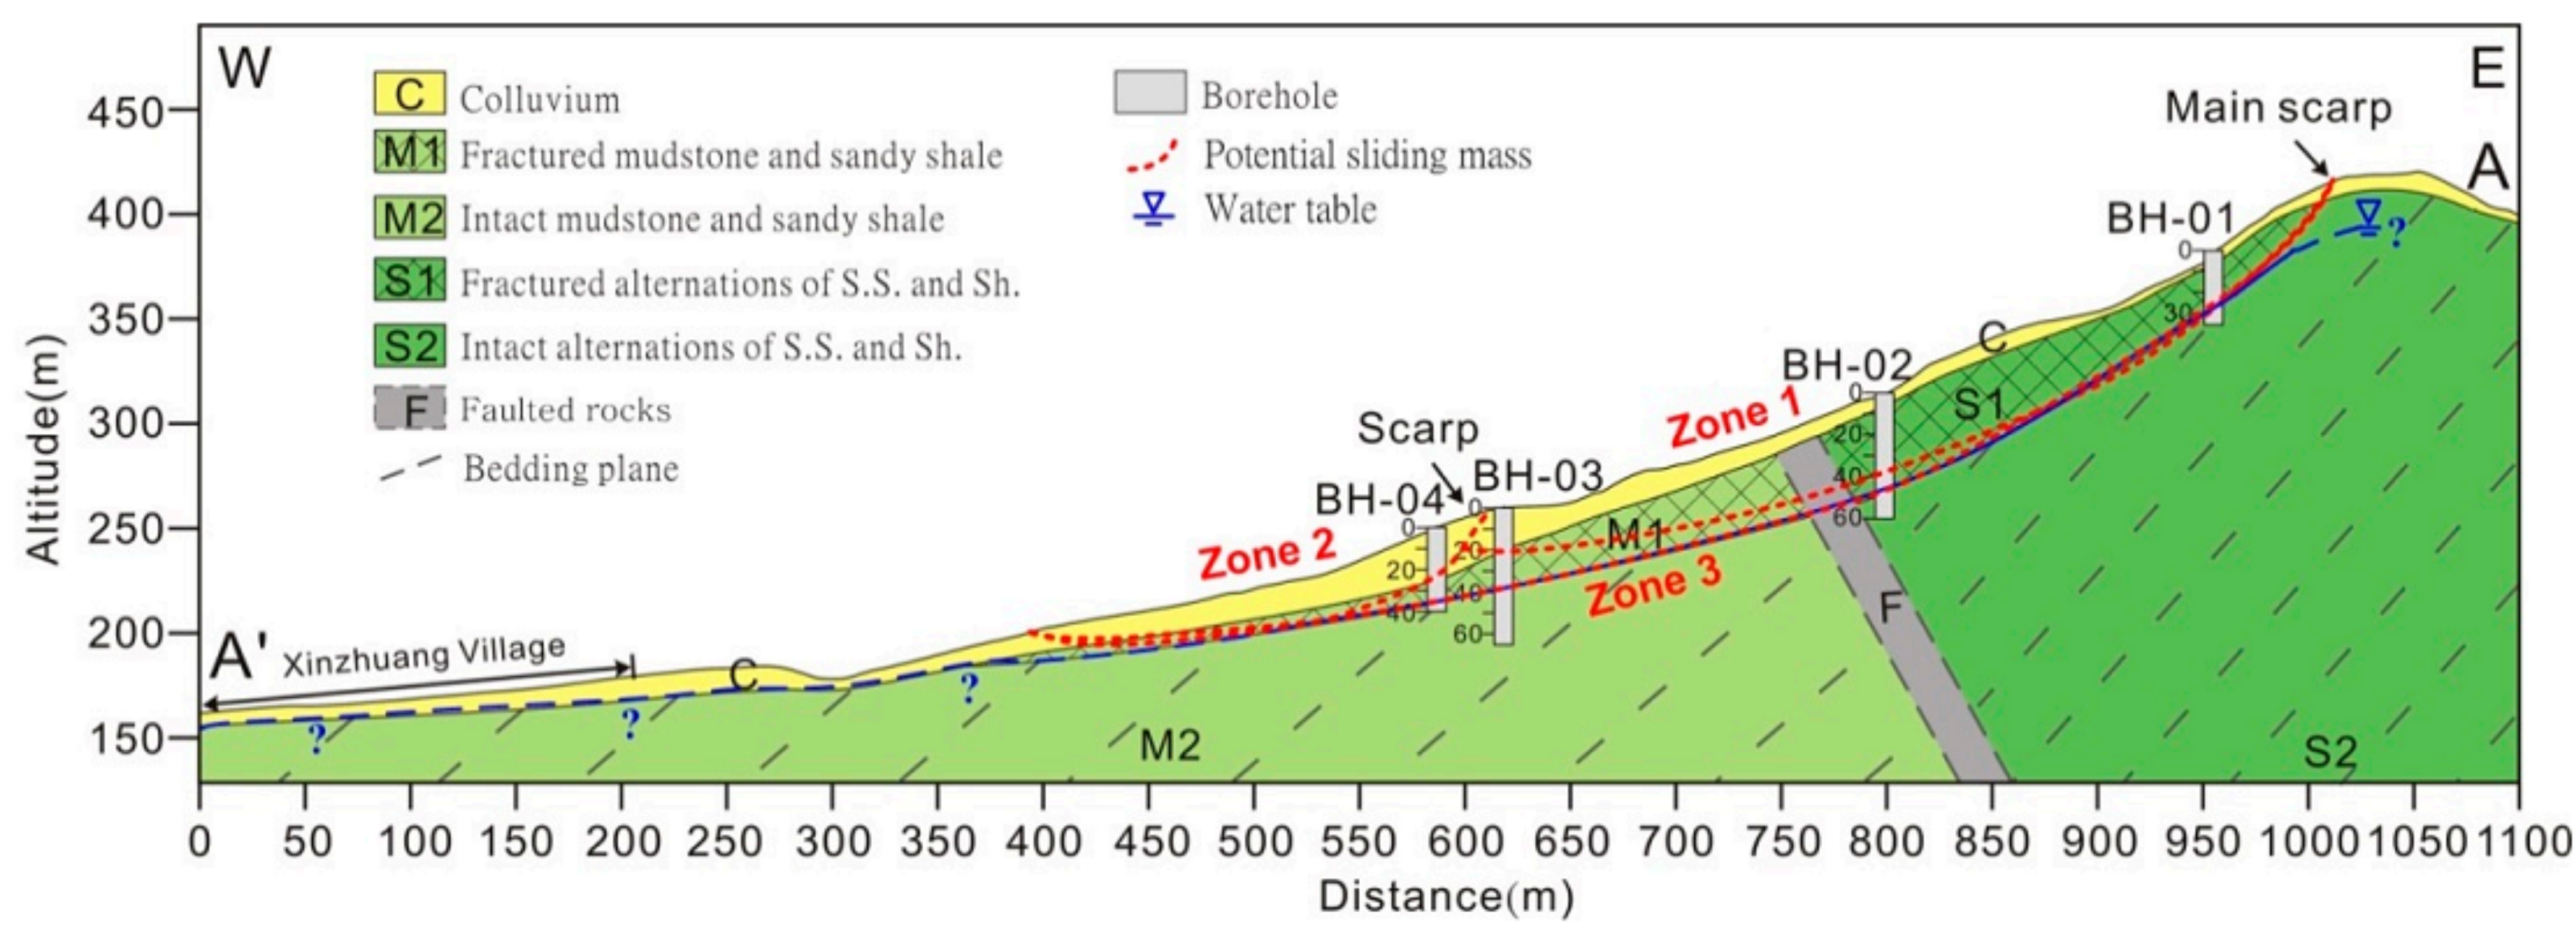
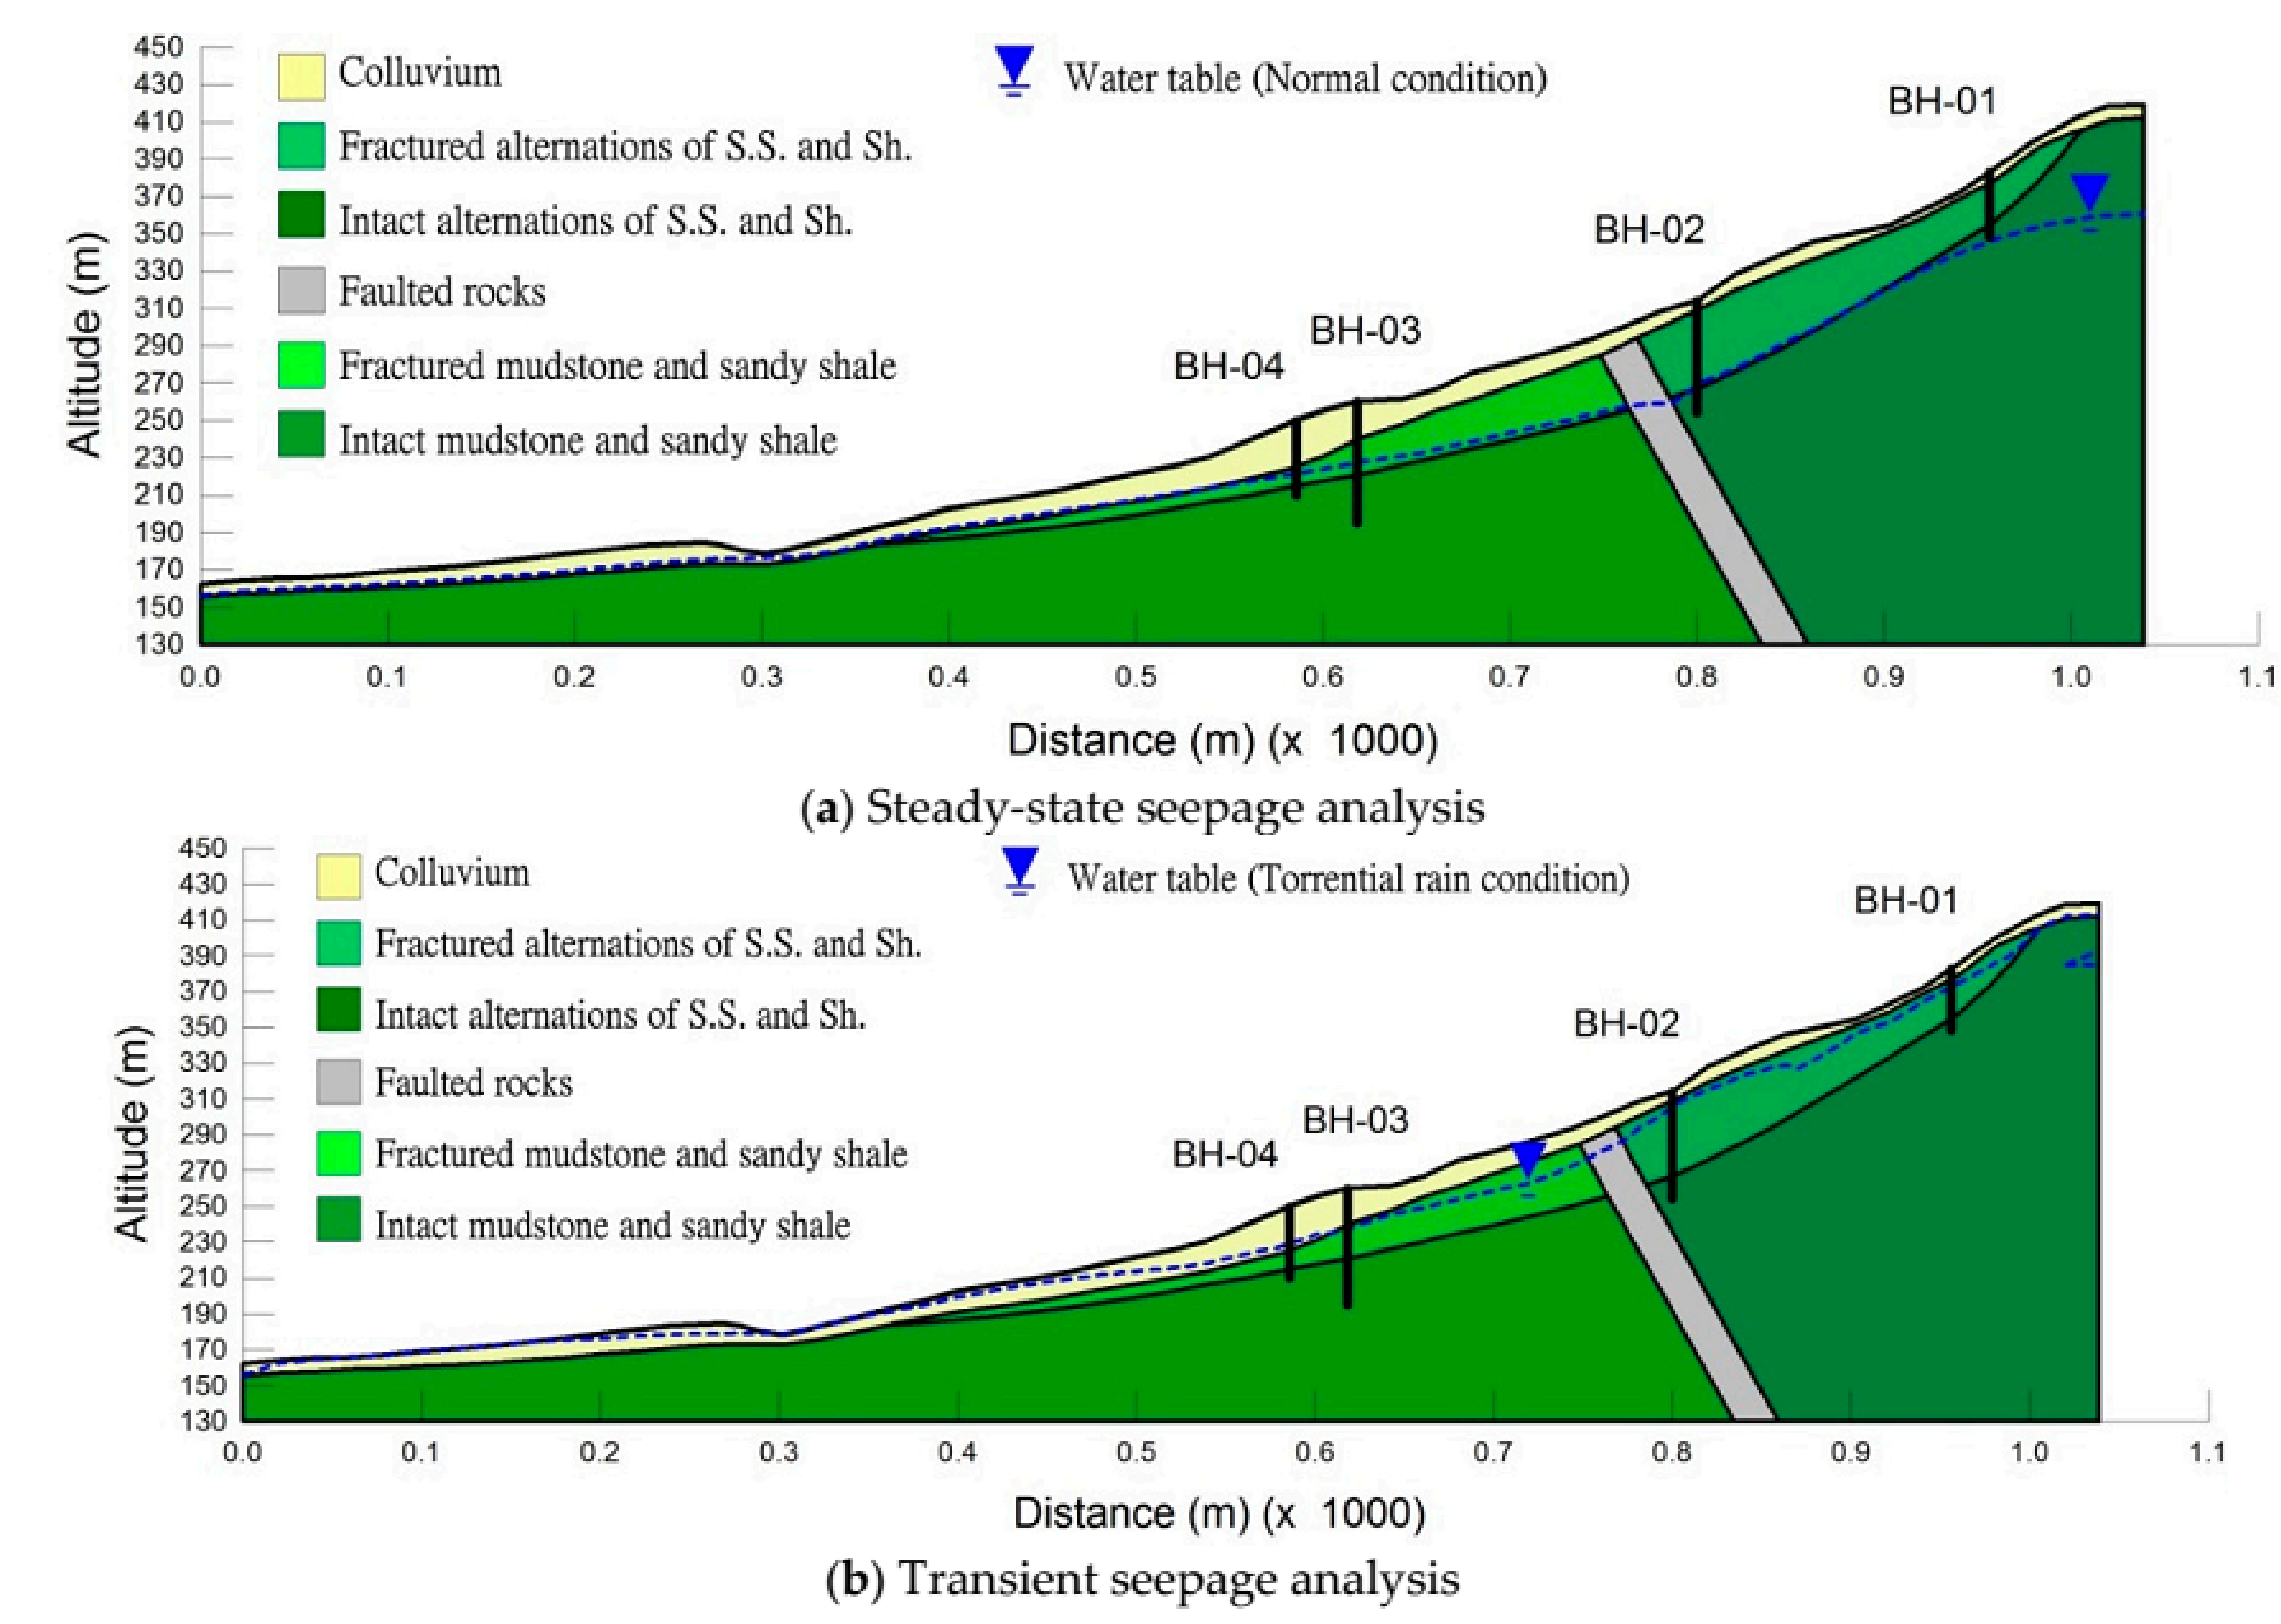
4.1. Hydrogeological Conceptual Models
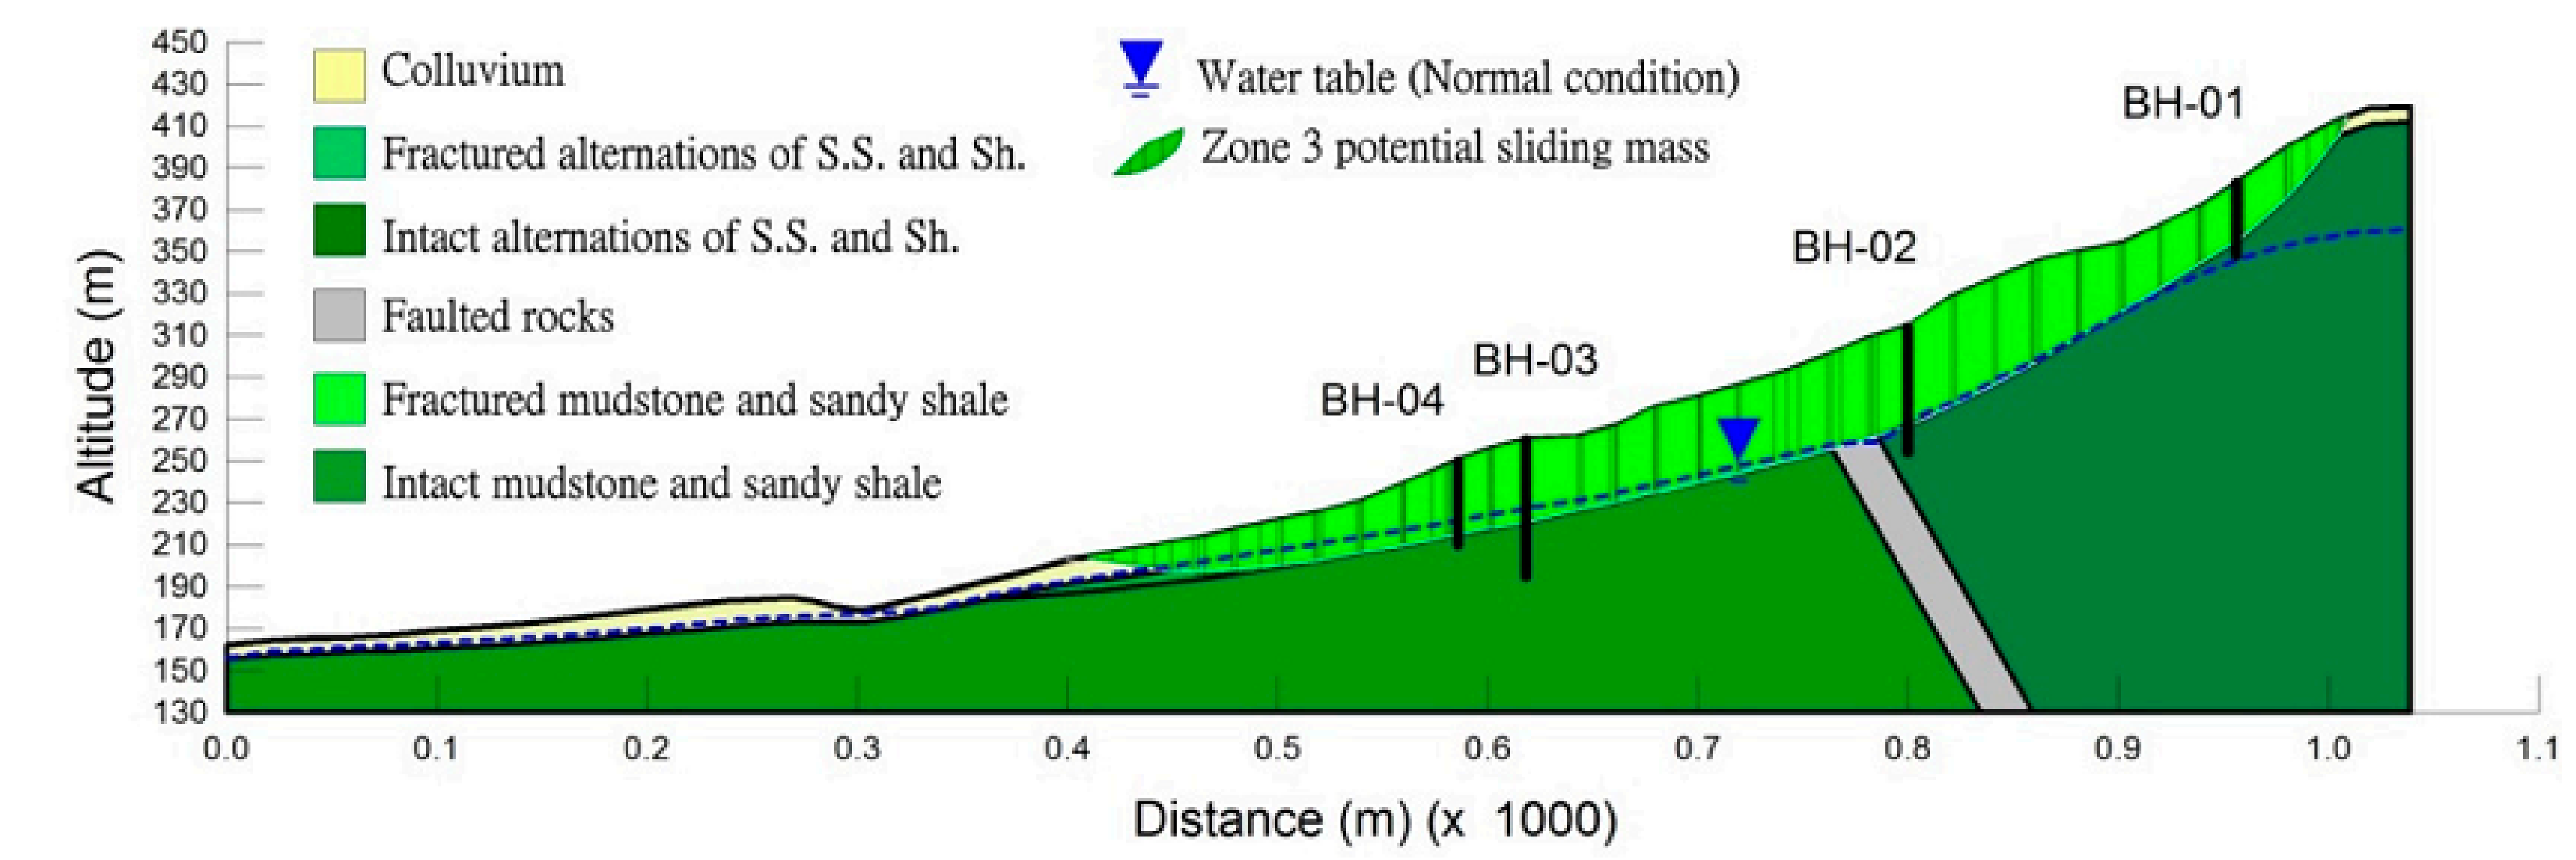
4.2. Slope Stability Analysis
4.3. Landslide Impact Zone
4.4. Disaster Prevention and Evacuation Plan
4.5. Discussion
5. Conclusions
- This paper integrates existing survey techniques and analysis models. The purpose of the field investigation is to understand the environmental conditions contributing to slope instability, the extent and volume of the landslide, and the people and infrastructure affected by the landslide hazard. The purpose of the assessment is to understand the stability of the landslide mass, its failure mode, the failure extent and the sensitivity of the landslide to earthquakes and torrential rain.
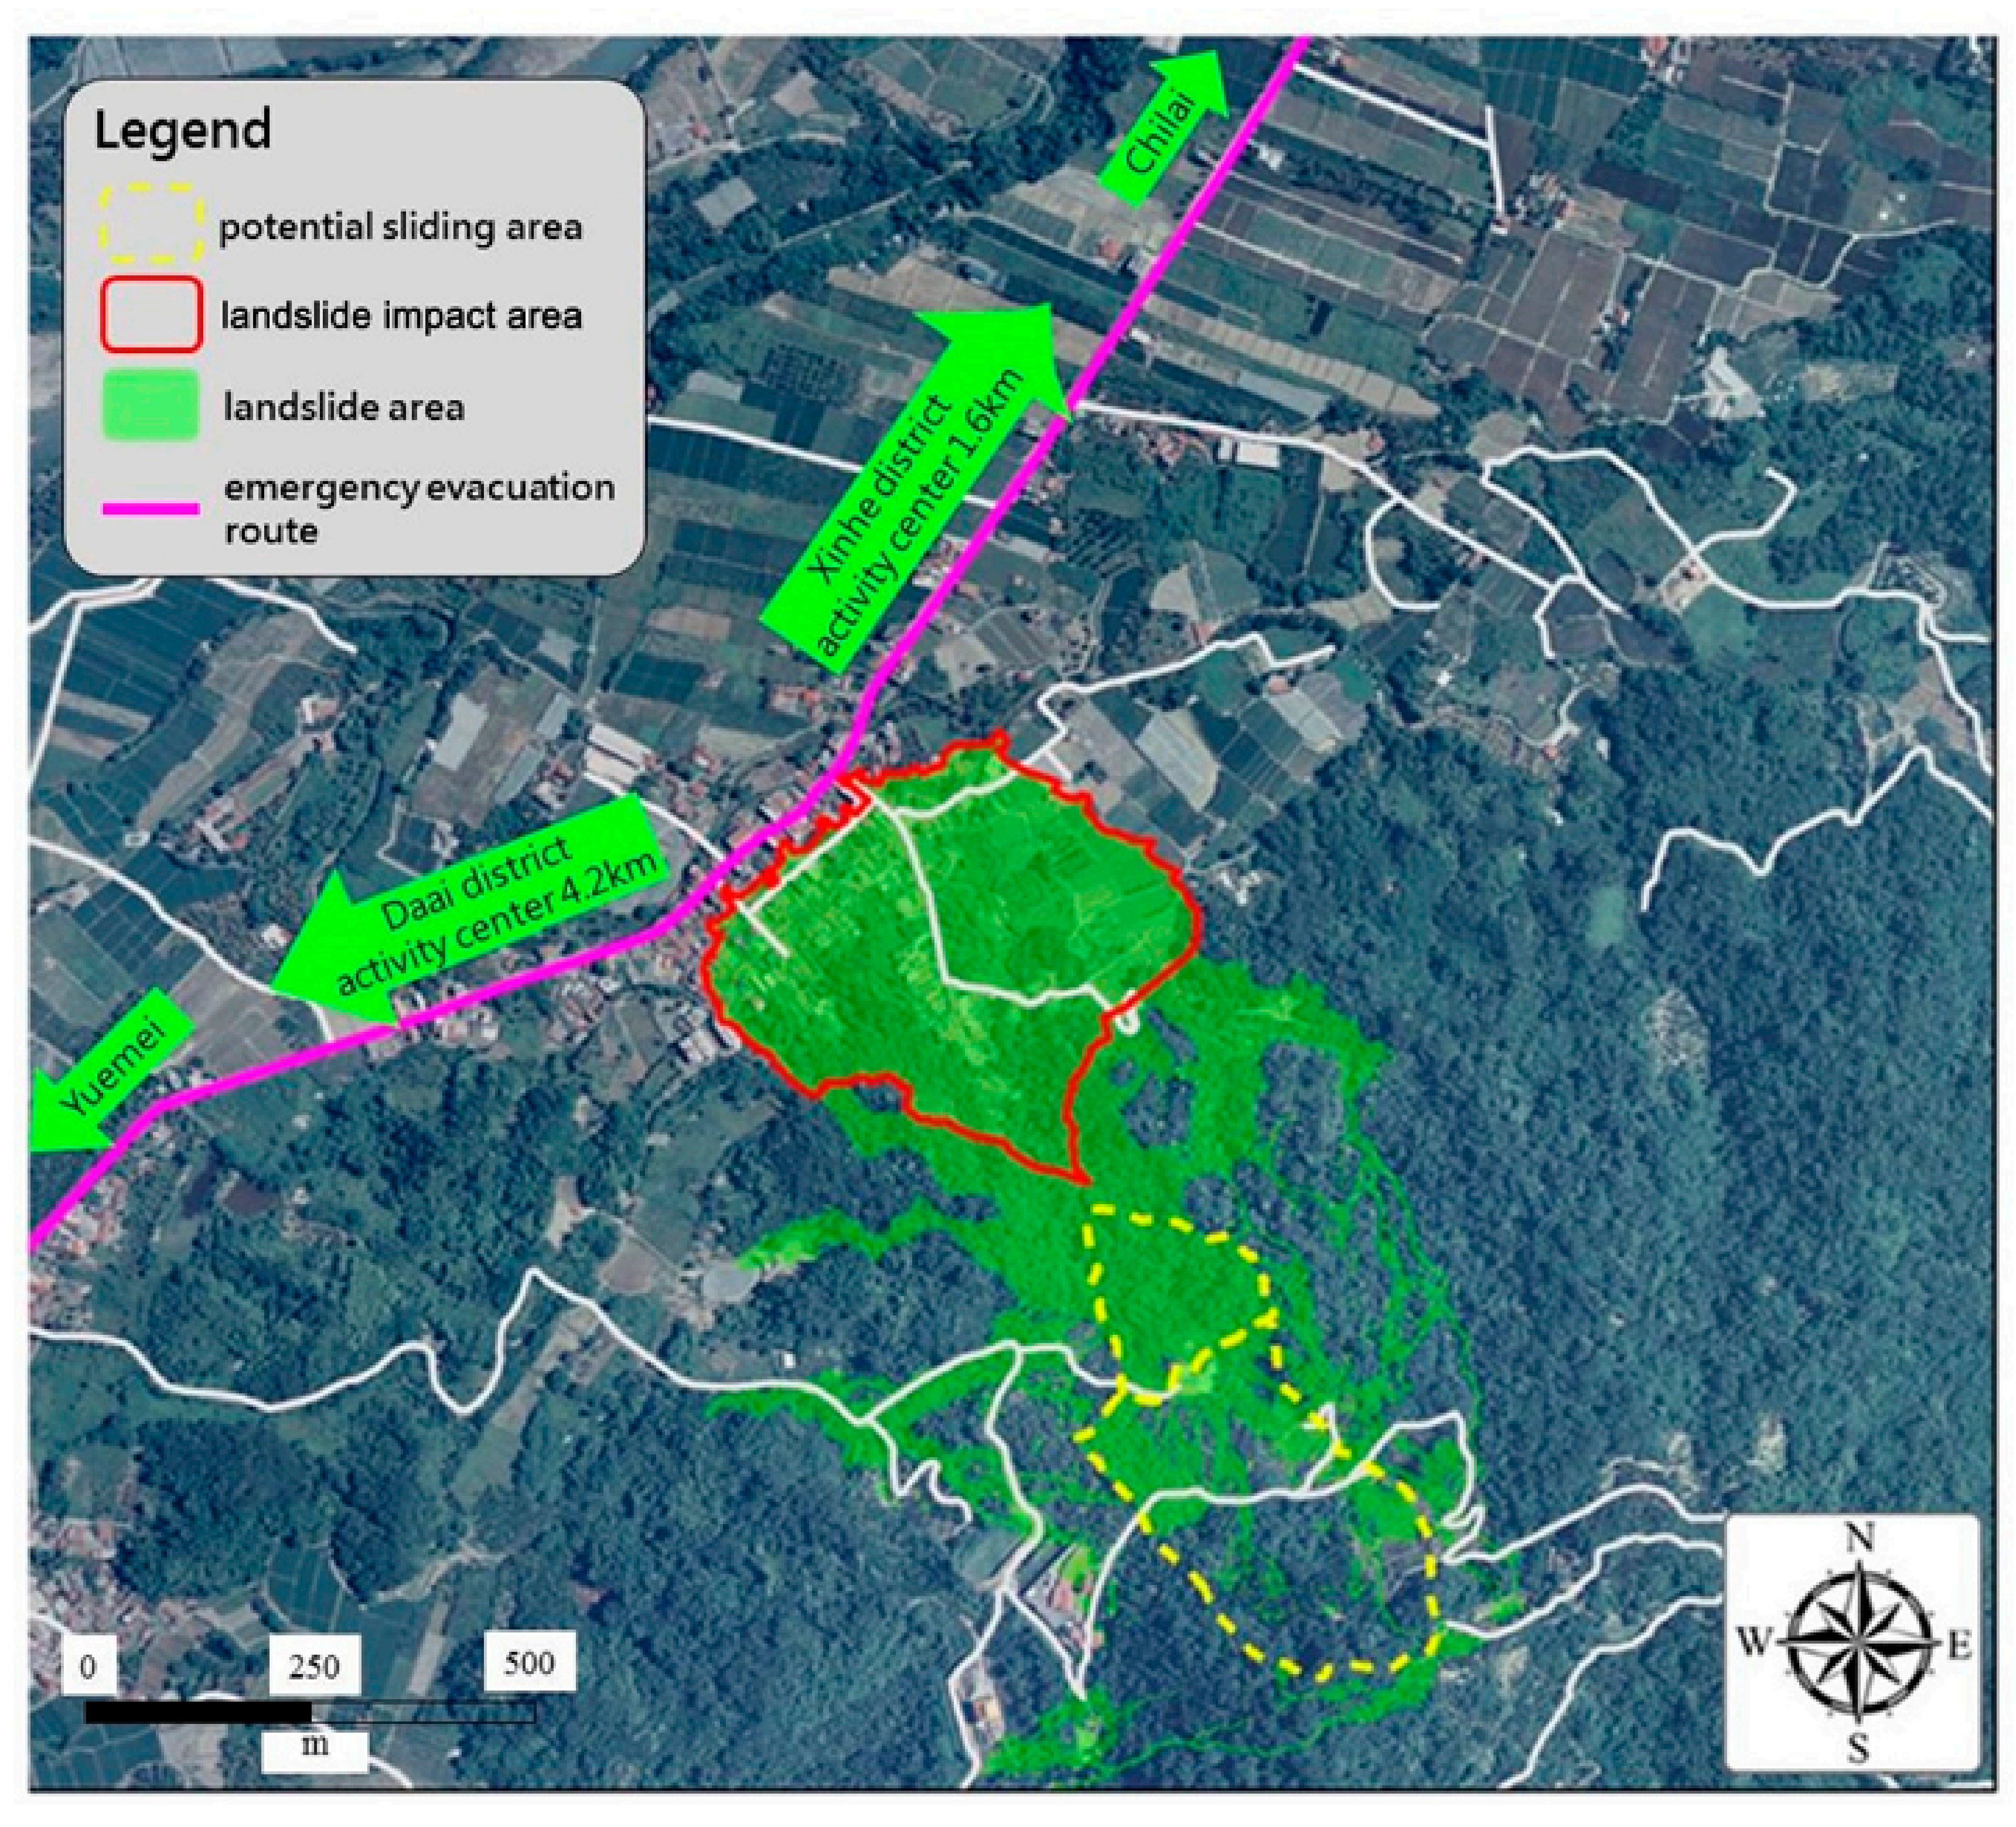
- Furthermore, the paper presents an analytical procedure that can be applied to assess the possible impact of the landslide collapse on nearby settlements. The GeoStudio and RAMMS analysis modes and the hazard classification can be used to estimate the following: (a) the failure mechanism and the influence zone of large-scale landslides; (b) the migration and accumulation of failure; (c) the landslide hazard map and evacuation map. The analytical procedure can be applied to other villages and used as a reference for the development of disaster prevention and evacuation plans.
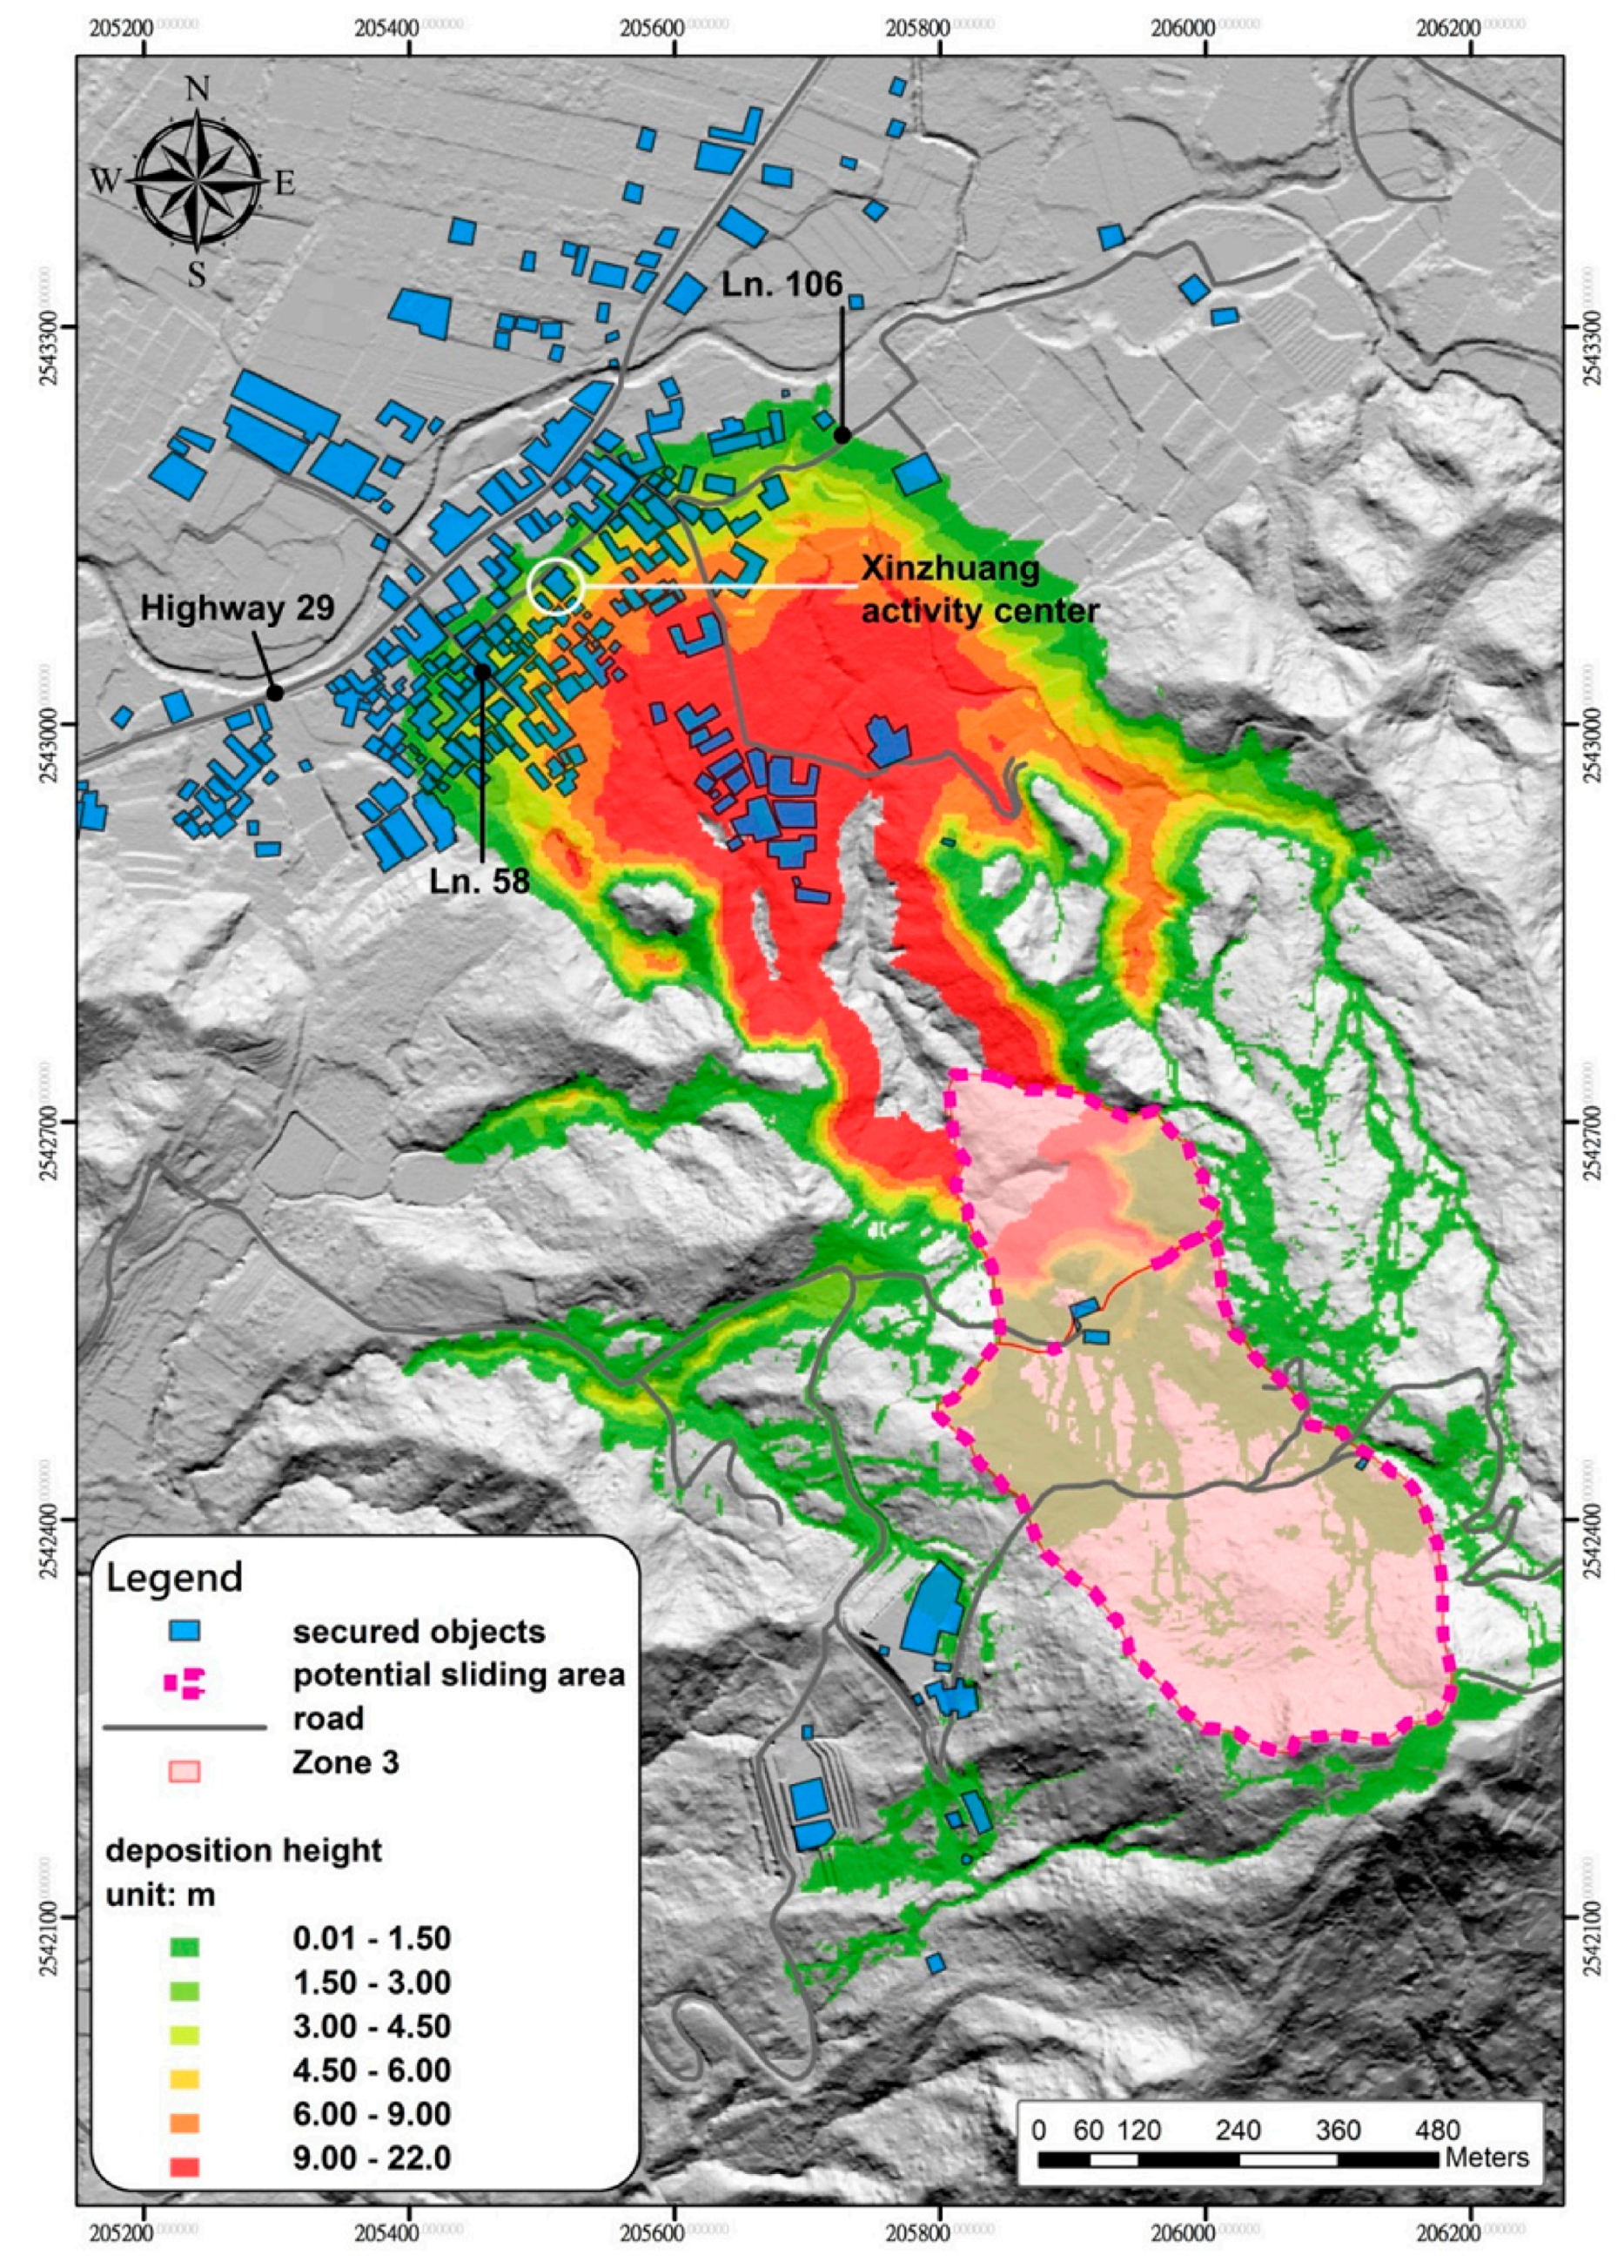
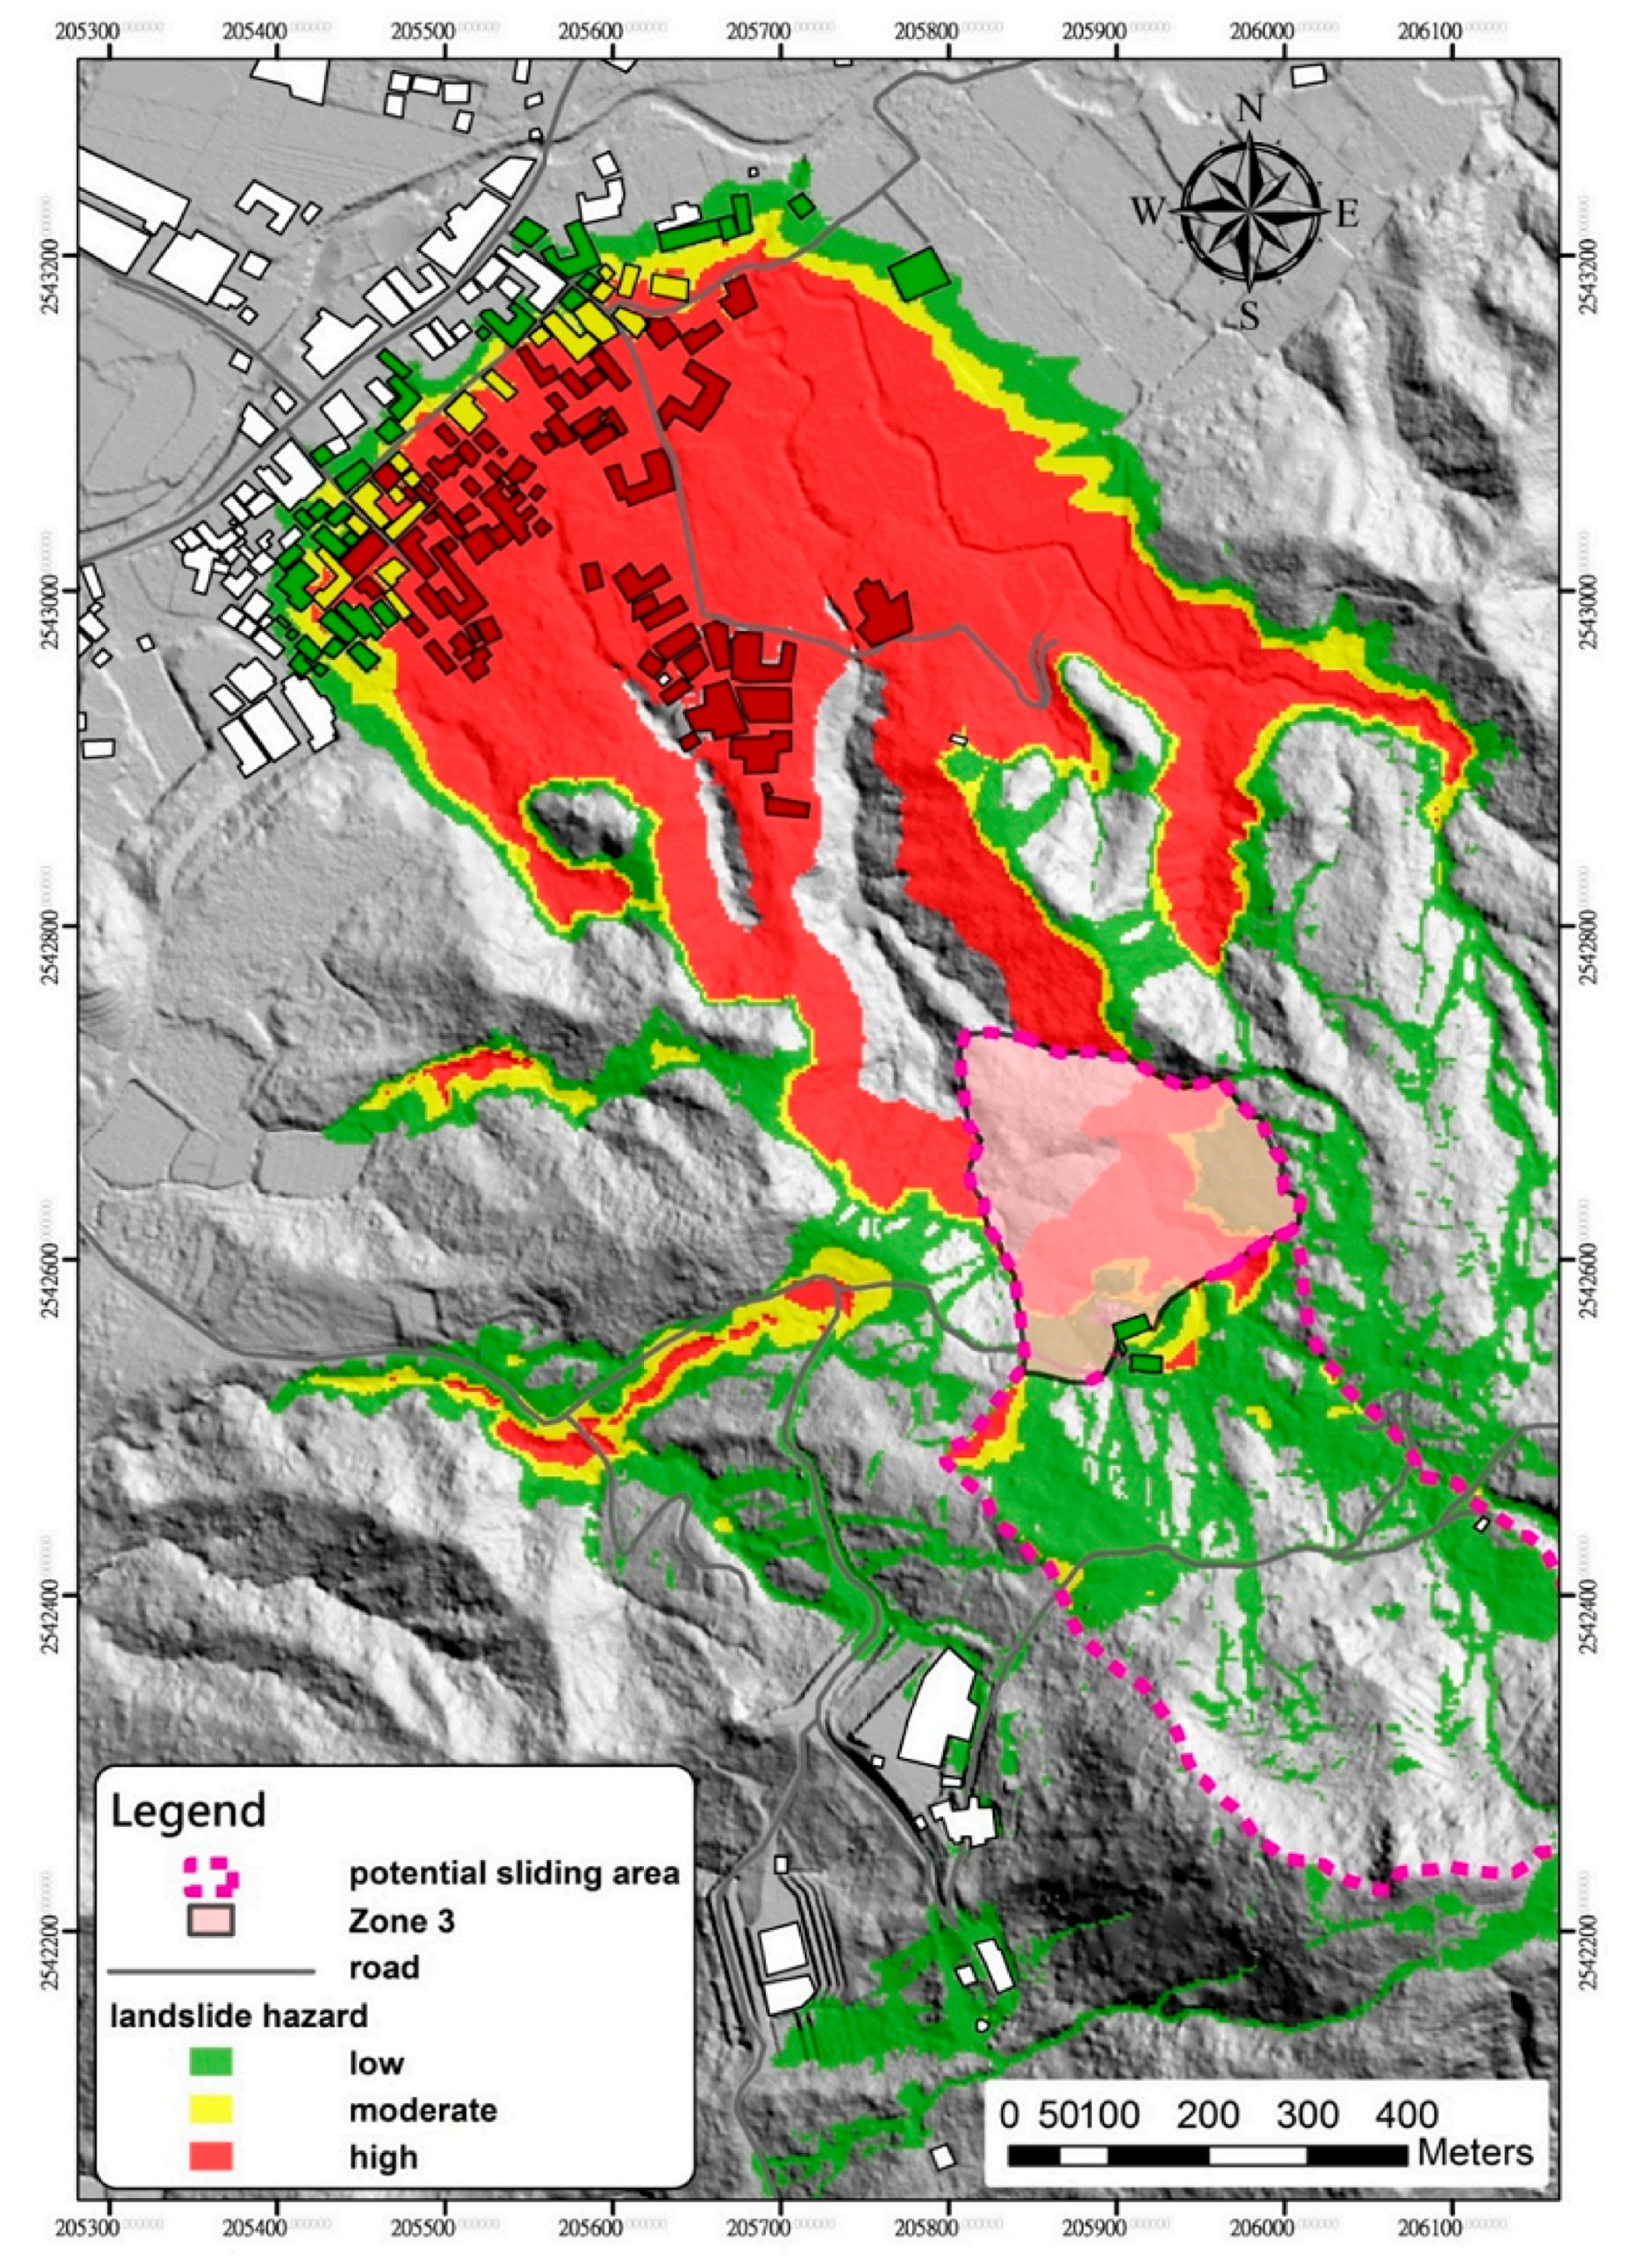
- The paper employs the Xinzhuang landslide as an example to illustrate how to perform this analytical procedure. After completing a comprehensive analysis of the Xinzhuang landslide, the landslide was divided into three potential failure masses (Zone 1, Zone 2 and Zone 3). Analytical results showed that the potential failure block (Zone 3) could become unstable under earthquake conditions. If the Zone 3 potential sliding mass does mobilize, the main area affected by the deposit is the area southeast of Highway 29, Ln. 106 and Ln. 58. People living in this area are at risk of being buried by 1 to 20 m of landslide debris (deeper than the adjacent deposit visible at the foot of Shizi Mountain).
- The methods used to evaluate the failure scenario and landslide scale are very important. The methods proposed in this paper, landslide micro-topography and slope stability analysis, should be relatively simple methods. Furthermore, RAMMS can estimate the impact area and accumulation depth after failure, with hazard classification, and this information can be included in the landslide hazard map. The analytical results can be used to assess the extent of the landslide threat and to check the suitability of the disaster prevention and evacuation plan.
Author Contributions
Acknowledgments
Conflicts of Interest
References
- Varnes, D.J. Slope movement types and processes. In Special Report 176: Landslides: Analysis and Control; Schuster, R.L., Krizek, R.J., Eds.; Transportation and Road research board; National Academy of Science: Washington, DC, USA, 1978; pp. 11–33. [Google Scholar]
- Cruden, D.M.; Varnes, D.J. Landslides: Investigation and Mitigation, Chapter 3: Landslide Types and Processes; Transportation Research Board Special Report; National Academy of Science: Washington, DC, USA, 1996. [Google Scholar]
- Soeters, R.; van Westen, C.J. Landslides: Investigation and mitigation. Trans. Res. Board Spec. Rep. 1996, 247, 129–177. [Google Scholar]
- Agliardi, F. Structural constraints on deep-seated slope deformation kinematics. Eng. Geol. 2001, 59, 83–102. [Google Scholar] [CrossRef]
- Chigira, M. Geological and geomorphological characteristics of deep-seated catastrophic landslides induced by rain and earthquakes. J. Chin. Soil Water Conserv. 2011, 42, 265–278. [Google Scholar]
- Lin, M.L.; Chen, T.W.; Lin, C.W.; Ho, D.J.; Cheng, K.P.; Yin, H.Y.; Chen, M.C. Detecting large-scale landslides using lidar data and aerial photos in the Namasha-Liuoguey area, Taiwan. Remote Sens. 2014, 6, 42–63. [Google Scholar] [CrossRef]
- Lo, C.M. Evolution of deep-seated landslide at Putanpunas stream, Taiwan. Geomat. Nat. Hazards Risk 2017, 8, 1204–1224. [Google Scholar] [CrossRef]
- National Science and Technology Center for Disaster Reduction (NCDR). Disaster Survey and Analysis of Morakot Typhoon; National Science Council: Taipei, Taiwan, 2010; pp. 12–25. (In Chinese) [Google Scholar]
- Central Geological Survey (CGS). Official Report: Project of Investigation and Analysis for Geologically Sensitive Areas under the Program of National Land Preservation—Geological Susceptability Analysis in Damage Area Struck by Morakot Typhoon; CGS: Taipei, Taiwan, 2010–2012. (In Chinese)
- Central Geological Survey (CGS). Official Report: Project of Investigation and Analysis for Geologically Sensitive Areas under the Program of National Land Preservation—Geological Susceptability Analysis in Areas Left Intact by Morakot Typhoon; CGS: New Taipei, Taiwan, 2013–2015. (In Chinese)
- GEO-SLOPE. Stability Modeling with SLOPE/W: An Engineering Methodology July 2012 Edition; GEO-SLOPE International Ltd.: Calgary, AB, Canada, 2012. [Google Scholar]
- SLF/WSL. RAMMS: User Manual v1.5. Avalanche, a Numerical Model for Snow Avalanches in Research and Practice; SLF/WSL: Davos, Switzerland, 2013; 97p. [Google Scholar]
- Bichler, A.; Bobrowsky, P.; Best, M.; Douma, M.; Hunter, J.; Calvert, T.; Burns, R. Three-dimensional mapping of a landslide using a multi-geophysical approach: The Quesnel Forks landslide. Landslides 2004, 1, 29–40. [Google Scholar] [CrossRef]
- Booth, A.M.; Roering, J.J.; Perron, J.T. Automated landslide mapping using spectral analysis and high-resolution topographic data: Puget Sound lowlands, Washington, and Portland Hills, Oregon. Geomorphology 2009, 109, 132–147. [Google Scholar] [CrossRef]
- Lahousse, T.; Chang, K.T.; Lin, Y.H. Landslide mapping with multi-scale object-based image analysis—A case study in the Baichi watershed, Taiwan. Nat. Hazards Earth Syst. Sci. 2011, 11, 2715–2726. [Google Scholar] [CrossRef]
- Hölbling, D.; Betts, H.; Spiekermann, R.; Phillips, C. Identifying spatio-temporal landslide hotspots on North Island, New Zealand, by analyzing historicaland recent aerial photography. Geosciences 2016, 6, 48. [Google Scholar] [CrossRef]
- Lee, C.F.; Lo, C.M.; Chou, H.T.; Chi, S.Y. Landscape evolution analysis of large scale landslides at Don-Ao Peak, Taiwan. Environ. Earth Sci. 2016, 75, 29. [Google Scholar] [CrossRef]
- Central Geological Survey (CGS). Official Report: Investigation and Analysis for Geologically Sensitive Area in National Preservation Domain Program; CGS: Taipei, Taiwan, 2012. (In Chinese) [Google Scholar]
- Chigira, M. September 2005 rain-induced catastrophic rockslides on slopes affected by deep-seated gravitational deformations, Kyushu, southern Japan. Eng. Geol. 2009, 108, 1–15. [Google Scholar] [CrossRef]
- Sekiguchi, T.; Sato, H.P. Mapping of micro topography using airborne laser scanning. Landslides 2004, 1, 195–202. [Google Scholar] [CrossRef]
- Yoshimatsu, H.; Abe, S. A review of landslide hazards in Japan and assessment of their susceptibility using an analytical hierarchic process (AHP) method. Landslides 2006, 3, 149–158. [Google Scholar] [CrossRef]
- Lee, C.F.; Huang, W.K.; Chang, Y.L.; Chi, S.Y.; Liao, W.C. Regional landslide susceptibility assessment using multi-stage remote sensing data along the coastal range highway in northeastern Taiwan. Geomorphology 2018, 300, 113–127. [Google Scholar] [CrossRef]
- Chung, M.C.; Tan, C.H.; Chen, C.H. Local rainfall thresholds for forecasting landslide occurrence: Taipingshan landslide triggered by Typhoon Saola. Landslides 2017, 14, 19–33. [Google Scholar] [CrossRef]
- Gregory, J.H.; Dukes, M.D.; Miller, G.L.; Jones, P.H. Analysis of double-ring infiltration techniques and development of a simple automatic water delivery system. Appl. Turfgrass Sci. 2005. [Google Scholar] [CrossRef]
- Jongmans, D.; Garambois, S. Geophysical investigation of landslides: A review. Bull. Soc. Géol. Fr. 2007, 178, 101–112. [Google Scholar] [CrossRef]
- Gelisli, K.; Ersoy, H. Landslide investigation with the use of geophysical methods: A case study in northeastern Turkey. Adv. Biol. Earth Sci. 2017, 2, 52–64. [Google Scholar]
- Lau, K.C. A Review of Downhole Geophysical Methods for Ground Investigation; Geotechnical Engineering Office: Hong Kong, China, 1998; 69p. [Google Scholar]
- Lo, H.C.; Chou, P.Y.; Hsu, S.M.; Chao, C.H.; Wang, C.T. Using borehole prospecting technologies to determine the correlation between fracture properties and hydraulic conductivity: A case study in Taiwan. J. Environ. Eng. Geophys. 2012, 17, 27–37. [Google Scholar] [CrossRef]
- Braester, C.; Thunvik, R. Determination of formation permeability by double-packer tests. J. Hydrol. 1984, 72, 375–389. [Google Scholar] [CrossRef]
- Lins, Y.; Schanz, T.; Fredlund, D.G. Modified Pressure Plate Apparatus and Column Testing Device for Measuring SWCC of Sand. Geotech. Test. J. 2009, 32, 1–15. [Google Scholar]
- Chen, Z.Y.; Shao, C.M. Evaluation of minimum factor of safety in slope stability analysis. Can. Geotech. J. 1988, 25, 735–748. [Google Scholar] [CrossRef]
- Pourkhosravani, A.; Kalantari, B. A review of current methods for slope stability evaluation. Electron. J. Geotech. Eng. 2011, 16, 1245–1254. [Google Scholar]
- Kainthola, A.; Verma, D.; Thareja, R.; Singh, T.N. A review on numerical slope stability analysis. Int. J. Sci. Eng. Technol. Res. 2013, 2, 1315–1320. [Google Scholar]
- Berisavljević, Z.; Berisavljević, D.; Čebašek, V.; Rakić, D. Slope stability analyses using limit equilibrium and strength reduction methods. Građevinar 2015, 67, 975–983. [Google Scholar]
- Jeong, S.; Lee, K.; Kim, J.; Kim, Y. Analysis of rainfall-induced landslide on unsaturated soil slopes. Sustainability 2017, 9, 1280. [Google Scholar] [CrossRef]
- Gol, M.D.; Keykha, H.A.; Rahnama-Rad, J. Assessment slope stability based on deformation of rock joints and soil with simulation method. Open J. Geol. 2016, 6, 983–995. [Google Scholar] [CrossRef]
- Länsivaara, T.; Poutanen, T. Slope stability with partial safety factor method. In Proceedings of the 18th International Conference on Soil Mechanics and Geotechnical Engineering, Challenges and Innovations in Geotechnics, Paris, France, 2–5 September 2013. [Google Scholar]
- Abramson, L.W.; Lee, T.S.; Sharma, S.S.; Boyce, G.M. Slope Stability and Stabilization Methods, 2nd ed.; John Wiley and Sons Ltd.: New York, NY, USA, 2001; ISBN 978-0-471-38493-9. [Google Scholar]
- Fredlund, D.G.; Morgenstern, N.R.; Widger, R.A. The shear strength of unsaturated soils. Can. Geotech. J. 1978, 12, 313–321. [Google Scholar] [CrossRef]
- Lateltin, O.; Haemmig, C.; Raetzo, H.; Bonnard, C. Landslide risk management in Switzerland. Landslides 2005, 2, 313–320. [Google Scholar] [CrossRef]
- Jaboyedoff, M.; Dudt, J.P.; Labiouse, V. An attempt to refine rockfall hazard zoning based on the kinetic energy, frequency and fragmentation degree. Nat. Hazards Earth Syst. Sci. 2005, 5, 621–632. [Google Scholar] [CrossRef]
- Lo, C.M.; Lee, C.F.; Chou, H.T.; Lin, M.L. Landslide at Su-Hua Highway 115.9k triggered by Typhoon Megi in Taiwan. Landslides 2013, 11, 293–304. [Google Scholar] [CrossRef]
- Llano-Serna, M.A.; Farias, M.M.; Pedroso, D.M. An assessment of the material point method for modelling large scale run-out processes in landslides. Landslides 2016, 13, 1057–1066. [Google Scholar] [CrossRef]
- Eberhardt, E. Rock Slope Stability Analysis: Utilization of Advanced Numerical Techniques; Earth and Ocean Sciences, University of British Columbia: Vancouver, BC, Canada, 2003; 41p. [Google Scholar]
- Voellmy, A. On the Destructive Force of Avalanches; SLF: Davos, Switzerland, 1955; pp. 159–162. [Google Scholar]
- Salm, B. Flow, flow transition and runout distances of flowing avalanches. Ann. Glaciol. 1993, 18, 221–226. [Google Scholar] [CrossRef]
- Wu, C.H.; Chen, S.C.; Chou, H.T. Geomorphologic characteristics of catastrophic landslides during typhoon Morakot in the Kaoping Watershed, Taiwan. Eng. Geol. 2011, 123, 13–21. [Google Scholar] [CrossRef]
- Tsou, C.Y.; Feng, Z.Y.; Chigira, M. Catastrophic landslide induced by typhoon Morakot, Shiaolin, Taiwan. Geomorphology 2011, 127, 25–42. [Google Scholar] [CrossRef]
- Lee, C.F.; Huang, W.K.; Huang, C.M.; Chi, C.C. Deep-seated landslide mapping and geomorphic characteristic using high resolution DTM in northern Taiwan. In Workshop on World Landslide Forum; Springer: Cham, Switzerland, 2017; pp. 767–777. [Google Scholar]
- Lo, C.M.; Lee, C.F.; Keck, J. Application of sky view factor technique to the interpretation and reactivation assessment of landslide activity. Environ. Earth Sci. 2017, 76, 375. [Google Scholar] [CrossRef]
- Construction and Planning Agency. Seismic Design Specifications and Commentary of Buildings; Construction and Planning Agency, Ministry of the Interior: Taipei, Taiwan, 2011. [Google Scholar]
- Soil and Water Conservation Bureau (SWCB). Technical Regulations for Soil and Water Conservation; SWCB, Council of Agriculture: Nantou, Taiwan, 2014. [Google Scholar]
- Hürlimann, M.; Rickenmann, D.; Medina, V.; Bateman, A. Evaluation of approaches to calculate debris-flow parameters for hazard assessment. Eng. Geol. 2008, 102, 152–163. [Google Scholar] [CrossRef]


| Method | Purpose and Application |
|---|---|
| Geological drilling | 1. Geological structure and mapping; |
| 2. Hydrogeological properties of numerical analysis; | |
| 3. The potential slip surface of the landslide. | |
| Surface geological investigation | 1. Topographic and geologic features. |
| Double-ring infiltration test | 1. Infiltration rate of colluvium; |
| 2. Hydrogeological properties of numerical analysis. | |
| Geophysical prospecting method | 1. The potential slip surface of the landslide; |
| 2. Aquifer characteristic and geological features. | |
| Borehole televiewer and logging | 1. Borehole image and geological features; |
| 2. Strikes and dips of geologic features; | |
| 3. Collection and interpretation of core samples. | |
| Double packer test | 1. Hydraulic conductivity of rock mass; |
| 2. Aquifer characteristic of landslide. | |
| Pressure plate test | 1. Soil-water characteristic curve of colluvium; |
| 2. Hydrogeological properties of numerical analysis. | |
| Laboratory tests | 1. Hydrogeological properties of numerical analysis. |
| Borehole ID | Potential Sliding Mass | ||
|---|---|---|---|
| Zone 1 | Zone 2 | Zone 3 | |
| BH-01 | 27.4–27.5 m | - | 27.4–27.5 m |
| BH-02 | 39.4–39.5 m | - | 47.8–48.0 m |
| BH-03 | 19.9 m | - | 37.3–37.7 m |
| BH-04 | - | 20.4–20.7 m | 36.2–36.8 m |
| Type | Property | BH-01 and BH-02 (Changchihkeng Formation) | BH-03 and BH-04 (Ailioachiao Formation) |
|---|---|---|---|
| Colluvium | Specific gravity | 2.71 | 2.70–2.71 |
| Unit weight (t/m3) | 1.69–1.81 | 1.57–1.66 | |
| Cohesion (kg/cm2) | 0.15 | 0.03 | |
| Friction angle (degree) | 27.4 | 31.0 | |
| Fractured Rock | Specific gravity | 2.67 | 2.66–2.68 |
| Unit weight (t/m3) | 2.60–2.61 | 2.57–2.60 | |
| Cohesion (kg/cm2) | 0.45 | 0.35 | |
| Friction angle (degree) | 32.5 | 23.0 |
| Parameters | Hydrogeologic Unit | Data Sources | |||||
|---|---|---|---|---|---|---|---|
| C | M1 | M2 | S1 | S2 | F | ||
| Unit weigh (kN/m3) | 18.1 | 25.8 | 25.8 | 26.0 | 26.0 | 26.0 | Soil classification test |
| Cohesion (kg/cm2) | 0.09 | 0.35 | 3.50 | 0.45 | 4.50 | 0.00 | Direct shear test |
| Friction angle (deg.) | 29.0 | 23.0 | 30.0 | 32.5 | 35.0 | 32.5 | Direct shear test, Unconfined compression test |
| Hydraulic conductivity (m/s) | 5.78 × 10⁻⁴ | 1.39 × 10⁻⁵ | 5.56 × 10⁻⁹ | 6.94 × 10⁻⁵ | 3.06 × 10⁻⁸ | 5.78 × 10⁻⁶ | Back analysis (compare with monitoring data) |
| Scenario | Minimum Requirement | No. of Sliding Mass | ||
|---|---|---|---|---|
| Zone 1 | Zone 2 | Zone 3 | ||
| Normal condition | 1.50 | 1.73 | 1.99 | 1.61 |
| Torrential rain condition | 1.10 | 1.48 | 1.75 | 1.31 |
| Earthquake condition | 1.20 | 1.24 | 1.31 | 1.12 |
| Parameters | Laboratory Test | Numerical Simulation |
|---|---|---|
| Unit weight (ρ, kg/cm2) | 2.14–2.60 | 2.40 |
| Friction angle (φ, deg.) | 23 | 23 |
| Friction coefficient (μ) | 0.42 | 0.42 |
| Turbulent friction coefficient (ξ, m/s2) | - | 2000 1 |
| Simulation stop criteria | Mmax < 3% 2 |
| Parameter | Deposition Height (h) | Landslide Hazard |
|---|---|---|
| Intensity | h < 1.0 m | Low |
| 1.0 m < h < 2.5 m | Moderate | |
| h > 2.5 m | High |
© 2018 by the authors. Licensee MDPI, Basel, Switzerland. This article is an open access article distributed under the terms and conditions of the Creative Commons Attribution (CC BY) license (http://creativecommons.org/licenses/by/4.0/).
Share and Cite
Chung, M.-C.; Chen, C.-H.; Lee, C.-F.; Huang, W.-K.; Tan, C.-H. Failure Impact Assessment for Large-Scale Landslides Located Near Human Settlement: Case Study in Southern Taiwan. Sustainability 2018, 10, 1491. https://doi.org/10.3390/su10051491
Chung M-C, Chen C-H, Lee C-F, Huang W-K, Tan C-H. Failure Impact Assessment for Large-Scale Landslides Located Near Human Settlement: Case Study in Southern Taiwan. Sustainability. 2018; 10(5):1491. https://doi.org/10.3390/su10051491
Chicago/Turabian StyleChung, Ming-Chien, Chien-Hsin Chen, Ching-Fang Lee, Wei-Kai Huang, and Chih-Hao Tan. 2018. "Failure Impact Assessment for Large-Scale Landslides Located Near Human Settlement: Case Study in Southern Taiwan" Sustainability 10, no. 5: 1491. https://doi.org/10.3390/su10051491
APA StyleChung, M.-C., Chen, C.-H., Lee, C.-F., Huang, W.-K., & Tan, C.-H. (2018). Failure Impact Assessment for Large-Scale Landslides Located Near Human Settlement: Case Study in Southern Taiwan. Sustainability, 10(5), 1491. https://doi.org/10.3390/su10051491