1. Introduction
Energy is an important material basis for economic development and social progress. The current energy, environment, climate and security issues are common problems hindering the sustainable development of the world economy [
1]. As traditional fossil energy resources gradually depleted and the ecological environment deteriorated, the economic crisis brought many countries heavy losses, making using clean and renewable new energy the necessary choice to boost the economy, expand employment and improve the quality of environment. The major countries and regions in the world have formulated and announced many policies and measures to support the development of new energy sources [
2,
3]. As China is in a crucial stage of energy transformation, how to achieve stable economic growth without destroying the fragile environment is a strategic issue for the sustainable development of China’s economy, energy and environment and a key to enhance China’s international competitiveness. As a developing country, China is trying to transform its economic development mode, change the energy consumption structure and reduce emissions [
4]. Thus, it is an inevitable choice for China to acquire new energy sources, which is low-carbon, environmentally friendly and renewable. Therefore, the new energy sources have been booming globally and China’s new energy enterprises have broad prospects.
In recent years, new energy enterprises have developed rapidly with a constantly increasing investment scale [
5]. According to China Energy and Carbon Report, 2050, the demand for investment in clean technologies such as new energy, energy conservation and environmental protection in China is about 7 trillion yuan [
6]. It is obvious that the government and energy enterprises cannot afford such a large-scale investment. At this time, it stresses the importance of market capital investment. Both the rapid development of the new energy industry and the huge demand for early capital investment will result in an increased demand for funds [
7]. However, relying solely on endogenous financing based on the accumulation of free funds can hardly meet the capital needs of the development of new energy enterprises. In other words, only by using external financing and relying on foreign aid financing can enterprises fill the huge gap in funding needs [
8].
What one has to be aware of is that the new energy enterprises in the initial stage face many constraints when financing. At present, the main financing methods are shareholder financing, bank loans, listing financing, etc., including bond issuance, venture capital, private equity, financial leasing and carbon finance [
9]. The most common financing channel for China’s new energy companies is bank credit [
10]. However, new energy enterprises are mostly small and medium-sized private-owned enterprises, which have high investment risks, low credit ratings and few effective assets, making it hard for them to meet the strict credit conditions of the banks, resulting in “difficult loans” [
11].
In recent years, as a more flexible financing method, bond financing has been more and more favored by new energy enterprises [
12,
13]. Compared with bank credit and equity financing, bond financing has lower costs and shorter financing chain, which can well meet the capital needs of small and medium-sized high-tech enterprises such as new energy enterprises in the early stage of development. However, the credit risk in the corporate bond market has been constantly highlighted [
14]. The continuous spread of default events has seriously hindered the financing channels of the new energy industry. Previous research on bond credit risk focused on investigating the impact of the bond characteristics on the default risks [
15,
16,
17]. China’s special bond financing system makes the rigid payment of corporate bonds, so the default of China’s new energy corporate bonds firstly occurred in 2014, resulting in there being few history dates of default bonds [
18,
19]. Thus, the previous studies on the credit risk of the bonds in China mostly focus on the credit spread risks [
20,
21] and the construction of the corporate bond market and system [
22,
23]. On the other hand, the methods adopted in order to examine the default risk of corporate bonds in recent years are mainly case analysis and theoretical research methods [
24,
25,
26,
27], and failure to give investors a clear probability of bond default.
In line with the above discussion, building a relatively perfect credit risk assessing system is essential to prevent default, avoid economic losses and clear the financing channels for new energy enterprises, which help to promote the healthy development of China’s new energy industry. In the traditional corporate bond risk assessment model, the factors affecting the corporate bond risk are mainly the company’s own factors, such as the company’s solvency and profitability. However, as a key strategic emerging industry in China, the new energy industry cannot develop without the country’s strong support. Therefore, the country’s policy support has a huge impact on the development of NEEs and thus affects the credit risk level of NEE bonds. Meanwhile, new energy companies are mainly small and medium-sized privately-owned enterprises, which are capital-intensive and technology-intensive, making changes in the macroeconomic environment have a great impact on their development. When the macro economy is good, NEEs can receive more financing support, and the probability of NEEs’ bond default is lower. When the overall macroeconomic environment is relatively poor, the high risks and uncertain prospects of NEEs will make investors discourage them, which is detrimental to the financing of enterprises and thus increase the probability of default on NEE bonds. Therefore, this article constructed a hybrid model for assessing the credit risks of bond financing based on factor analysis and logistic regression techniques, taking the financial indicators, credit rating, macroeconomic environment and energy policies into account, which can provide investors with more objective and effective investment advice for decision-making. On the whole, the contributions of this paper mainly include:
- (1)
This paper quantitatively assessed the credit risks of NEE bonds taking credit ratings, enterprises’ financial indicators, macroeconomic environment and energy policy into accounts, which highlights the special nature of the development of China’s NEEs. The empirical results are more in line with the characteristics of China’s NEEs in bond financing and can truly reflect the credit risk level of NEE bonds in China’s current social and economic environment, which can provide a reference for investors to make decisions and helps new energy enterprises discover their deficiencies, thereby promoting the healthy development of China’s new energy industry.
- (2)
This paper improved conventional logistic regression model with factor analysis techniques, which is a more direct and objective method to assess the credit risks of corporate bonds. The proposed hybrid model can not only reflect the full information of explanatory variables, but also eliminate the multicellular due to the correlation between variables and avoid the problem of declining degree of freedom due to the excessive explanatory variables, which improves the accuracy of parameter estimation.
The rest of this paper is organized as follows:
Section 2 analyzes the advantages and risks of new energy enterprise using bond financing channel.
Section 3 introduces the model for assessing the credit risks of new energy enterprises bonds and presents the empirical results.
Section 4 summarizes this paper and puts forward several recommendations.
3. Assessment Model and Empirical Results
3.1. The Principle of Credit Risk Assessment
Assessing the credit risk of new energy corporate bonds can help investors accurately identify investment risks. Meanwhile, it is beneficial for new energy companies to use corporate bonds to obtain the necessary funds, which can promote the development of new energy companies. However, there are many factors that affect the credit risk of corporate bonds, resulting in two problems in analyzing the credit risk of corporate bonds using traditional econometric methods. Firstly, there may be a correlation between the influencing factors, which do not meet the assumption that explanatory variables are independent in econometrics. This may lead to multicollinear problems and make the prediction result inaccurate. Secondly, if various explanatory variables are introduced into the equation, the degree of freedom of the equation will be reduced. In order to ensure the accuracy of the parameter estimation, the sample size needs to be increased. Therefore, the data requirements are high, resulting in the lack of operability of the model.
Based on this, this paper introduced the factor analysis technology into the traditional metrology analysis framework, and proposed a linear regression assessment model based on factor analysis. In addition, given that the model’s explained variable is corporate bond credit risk, whose possible values are default and non-default, referring to previous research results [
46,
47,
48], this paper employed logistic model to assess the credit risk of corporate bonds. Therefore, the basic principle of the credit risk assessment of corporate bonds in this paper is: first of all, determine the influencing factors of credit risk of corporate bonds, and then a adopt factor analysis method to reduce the dimensions of influencing factors. After that, an assessment model for corporate bond credit risk was constructed based on the logistics technique, making the principal components obtained after dimension reduction as the explanatory variables, and the corporate bond credit risk as the explained variable. The principle components gained by factor analysis are introduced as explanatory variables in the proposed model, which reflects all the information of the original influencing factors, eliminates the possible correlation between independent variables, and reduces the number of explanatory variables, helping to improve the accuracy of model prediction results.
3.2. Variables and Data Preprocessing
As mentioned before, when determining the factors influencing the credit risk of NEE bonds, we regard NEEs as general enterprises and incorporate their own financial characteristics into the model. In addition, to highlight the particularity of the development of China’s NEEs, this paper adds the type of the enterprise, the macroeconomic environment and government policy support into the model, and finally forms an evaluation index system that includes both the company’s own factors and external environmental factors, so that the constructed evaluation index system meets the characteristics of bond financing of China’s NEEs. Specifically, according to the research target and some previous research [
47,
49,
50,
51], this article selected 20 indicators from four dimensions to explain the company’s bond credit risks, named credit status, financial status, enterprise property and macro environment, as showed in
Table 1.
For credit status of enterprises, we choose the bond credit rating (X1) to reflect the short-term credit status of the bonds issued by enterprises. Normally, many factors like the bond issuance period, mortgage, priority, product category, region, and industry will affect the bond credit rating. In the selection of financial status, according to China’s accounting standard system, this paper selected 16 representative indicators including: Return on assets (ROA) (X2), earnings before interest and tax to total operation revenue (EBITTOR) (X3), current ratio (CR) (X4), quick ratio (X5), interest cover (X6), operating income 3-year compound growth rate (X7), total profit grow rate (X8), total assets grow rate (X9), inventory turning rate (X10), account receivable turning rate (X11), current rate (X12), total assets rate (X13), operation cash into asset (X14), debt to asset ratio (X15), equity multiplier (X16), and long asset fit asset (X17). China’s economic system has determined that state-owned enterprises have a strong ability to pay debts, as do new energy companies. In addition, new energy companies in China were in preliminary, so the government support and market environment were of significant importance for their future growth. Therefore, this paper selected the enterprise property including an indicator called type of enterprise (X18), and macro environment included two indicators called macroeconomic environment (X19) and energy policy support (X20) as the factors influencing bond risks.
To prevent the complete separation phenomenon in the logistic model, the number of companies that defaulted on bonds and those that did not default should be roughly equal. Therefore, this paper selected 46 new energy companies that issued corporate bonds in China from 2014 to 2017, of which 23 companies had defaulted on bonds and 23 companies had not. This article divided 46 companies into 23 pairs. Each pair contained one bond defaulting company and one bond non-defaulting company. Then, the 23 pairs of companies were divided into two groups. One group was called training group used to estimate the parameters in the evaluation model and the other group was called test group used to verify the validity of the model. According to statistical experience, in order to make the parameter estimation results effective, the sample capacity
n and the number of independent variables
k should have be:
and
. In this paper,
k = 8, then
n should be greater than 30. Moreover, the higher the accuracy of the parameter estimation is, the greater the required sample size should be. In this paper, under the premise of satisfying the minimum sample size condition, in order to make the accuracy as high as possible, and leave enough samples to verify the validity of the model, this paper divides the training group and the test group by a ratio of about 3:1, that is, 18 pairs of company data are selected as training samples, and five pairs of company data are used as test samples. The data sources of all variables are listed in
Table 1. It should be noted that the type of enterprise (
X18) is divided into four categories, represented by the corresponding figures: 1-Proprietary ownership, 2-private holding, 3-State holding and 4-State-owned. In addition, the values of
X19 and
X20 are determined via Delphi method [
52], making 1 the worst and 5 the best.
Before using factor analysis to reduce the dimensions of the above variables, the raw data needs to be preprocessed, including unification and non-dimensionalization. In this paper, we use the extreme value method to achieve the desired effect. For benefit-typed variables whose high value means the low credit risk of bonds, the formula is as follows [
53]:
where
represents the value of the
j-th enterprise on the
i-th variable,
and
respectively represent the maximum and minimum values of the
j-th enterprise on the
i-th variable, and
is the variable value after non-dimensionalization. For cost-typed variables whose high value means the high credit risk of bonds, the formula is as follows [
53]:
3.3. Dimension Reduction Using Factor Analysis Technique
The principal method of using factor analysis to reduce the dimension of variables is to construct the factor rotation matrix. Factor rotation refers to the transformation of original variables by replacing the original variables with their linear combinations without losing the original information as much as possible, which can transform the original variables with certain correlations into mutually independent principal component variables. In this way, the number of explanatory variables is reduced, the intrinsic relationships between them are reflected, and the correlations between variables are eliminated, which meets the classical assumption of econometrics. Additionally, there are potentially significant correlations among the 18 variables in the three categories of credit status, financial status and type of enterprise, while the two variables in the macro-environment dimension are weakly related to other variables because their values are determined using the Delphi method. Therefore, in this section, factor analysis technique was applied to decrease the dimensions of the 18 variables in the three categories of credit status, financial status and type of enterprise, before making logistic regression analysis.
3.3.1. KMO and Bartlett’s Test
Before factor analysis of above 18 variables, the applicability test is needed, whose basic idea is to test the correlations of the original variables. If the correlation between the variables is low, it is not suitable for factor analysis. Kaiser–Meyer–Olkin (KMO) test [
54] and Bartlett’s test of sphericity [
55] are commonly used to accomplish the examination. Normally, if the value of KMO is greater than 0.5 and the
p-value of Bartlett’s test is less than 0.05, factor analysis is suitable [
56].
The results of KMO test and Bartlett’s test are listed in
Table 2, from which it can be seen that the KMO value is 0.531, greater than 0.5, and the
p-value of Bartlett’s test is 0.000, indicating that there exits strong correlation between variables and it is suitable to use factor analysis to extract the principal components.
3.3.2. Main Component Extraction
Table 3 is the common factor variance table of the factor analysis, showing the degree of commonality of all variables, a common indicator to measure the effect of principal component analysis. The higher the degree of commonality is, the better the result of analysis will be [
56]. As shown in
Table 3, the degrees of commonality of most variables are more than 80%, revealing that the extracted principal components contained relatively complete original information of the variables, and therefore have better explanatory power.
The principal component analysis method is used to extract the common factors, taking the cumulative variance contribution rate as a reference value and the eigenvalue as an auxiliary criterion [
57]. In general, if the eigenvalue is greater than or equal to 1 and the cumulative variance contribution is greater than or equal to 75%, the extracted common factors are considered to reflect the information of the original variables well.
As shown in
Table 4, there are six principal components of which the eigenvalues are greater than 1, and the cumulative variance contribution rate of the first six principle components has reached over 76.434%, indicating that less than 25% of the original information is lost, so it can be considered that the extracted principal components can reflect the vast majority of the original variable information.
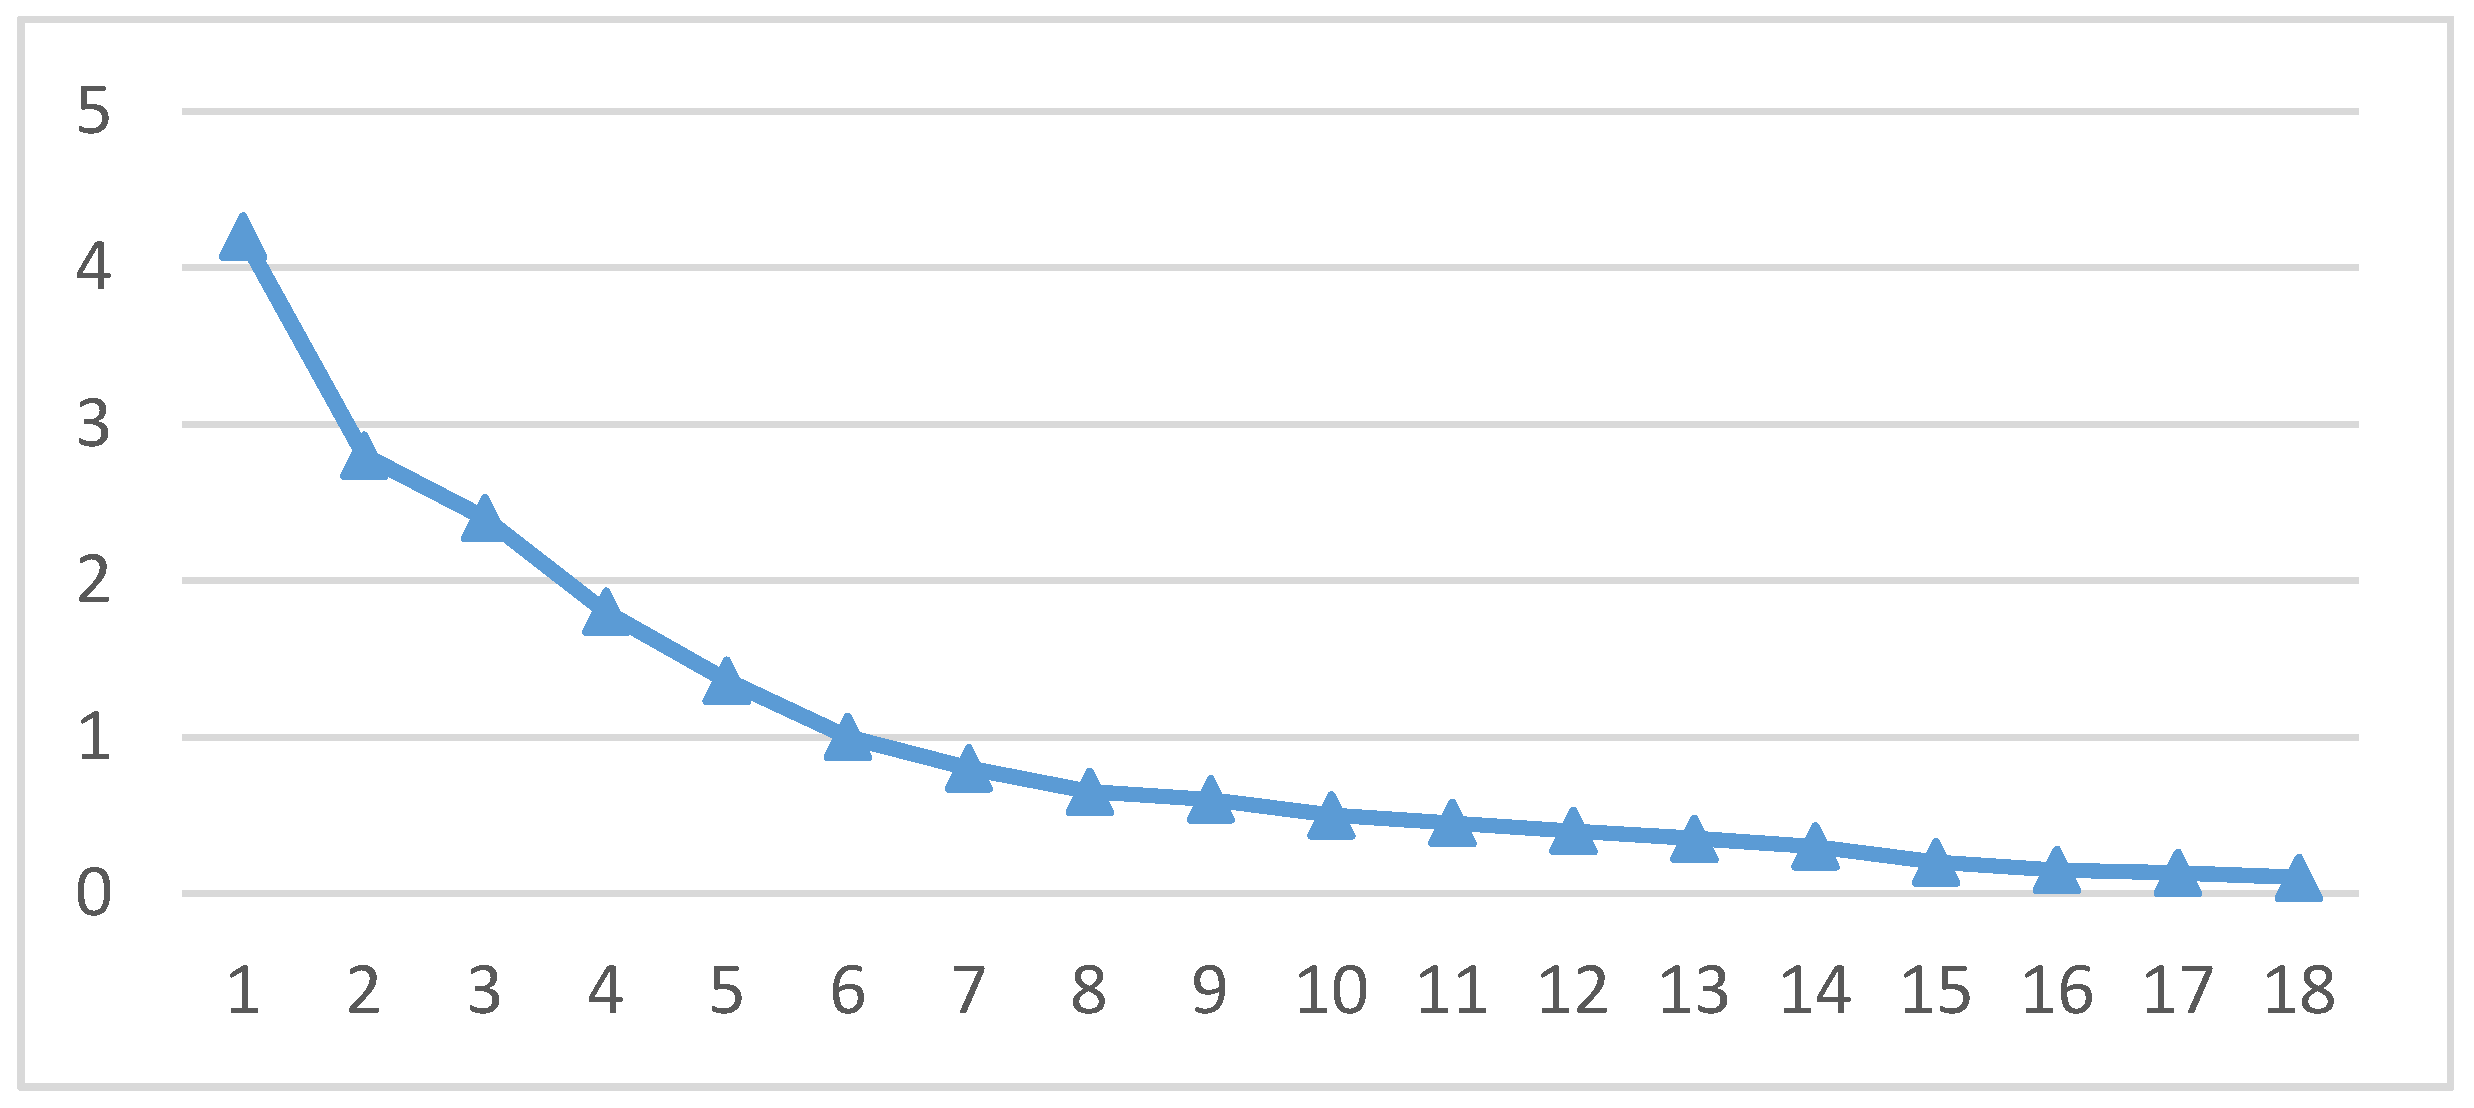
The screen plots can visually reflect the cumulative effect of the principal factors and the original variables, helping to determine the number of principal factors to be extracted. As shown in
Figure 1, the changes in eigenvalue start to slow from the seventh principal component, which shows that it is reasonable to select six principal factors. In summary, through the analysis of the cumulative variance contribution rate, degree of commonality of variables and gravel map, it can be verified that extracting six principal components is reasonable and scientific.
3.3.3. Principal Component Extraction and Interpretation
As mentioned before, extracting six principal components can take into account the vast majority of the original variable information and eliminate the correlation between original variables. However, it is difficult to name the foremost factors through the initial component matrix. Therefore, the maximum variance method was employed to perform orthogonal rotation of the initial component matrix to make the meaning of each principal factor clearer. The greater the factor loading value of variable on the principle component, the closer the relationship between the variable and the principal component [
57].
As can be seen from
Table 5, (1) principal component 1 is more ideal in reflecting the original information of the four variables, ROA, EBITTOR, bond credit rating and type of enterprise, with the degree of 88.4%, 65.7%, 74.2% and 46.1%. These indicators reflect the profitability of the enterprise, so the principal component 1 can be named as profitability factor (
F1). (2) Principal component 2 reflected 94.2% of the original information of the current ratio, 90% of the quick ratio and 82.2% of interest cover, which is high degrees. These variables reflect the solvency of the enterprise. Thus, the principal component 2 can be named as solvency factor (
F2). (3) Inventory turning ratio, current rate and total assets rate are well reflected by principal component 3, representing the operational ability of enterprises, indicating that the principal component 3 can be named as operational ability factor (
F3). (4) Total profit growth rate, total assets grow rate and operation cash into asset, which reports the growth potential of enterprise, have larger factor loading values on principal component 4, making principal component 4 to be the growth potential factor (
F4). (5) Debt to asset ratio, equity multiplier and long asset fit asset is significantly presented by principle component 5 due to their large factor loading values on principal component 5, and the three variables reveal the corporate asset structure. Therefore, the principle component 5 is asset structure factor (
F5). (6) Operating income 3-year compound growth rate and account receivable turning rate have larger factor loading values on principle component 6, reflecting the viability of the enterprise, making principle component 6 the viability factor (
F6).
According to the variable factor score coefficient matrix given in
Table 6, the expression of the six principal components can be written as:
3.4. Credit Risk Assessment Using Logistic Regression Model
3.4.1. Method Introduction
Logistic regression model was first applied in medicine [
58], and later it is gradually known by economics scholars and commonly used in analyzing the problems where the explained variable is categorical and discrete [
59,
60,
61]. The model overcomes the limitations of linear regression model requiring explained variables to be continuous and obey normal distribution. Specifically, for bond credit risk assessment, the possible results are default and non-default. According to previous research [
46,
47,
62,
63], the probability of bond default is considered as the explained variable, supposing that, if bond defaults, the probability value is 1, otherwise the probability value is 0. Hence, the explained variable only has two possible values: 0 and 1, which is categorical and discrete, indicating that the logistic regression model is suitable for analyzing the issue.
For the binary logistic model for assessing the bond credit risk, assuming that
p is the probability of bond default,
X is the factor influencing the probability of default, the relationship between
p and
X can be [
47]:
where
and
are the parameters to be estimated, and
is random error term. Formula (3) can be transformed as below:
In this way, the non-linear relationship between the probability of bond default and the influence factor is linearized, simplifying the process of parameter estimation. If there are multiple factors affecting the probability, the above model can also perform multiple regression parameter estimation, that is:
When adopting the proposed model to assess the bond credit risk, the explained variable is the probability of bond default whose value is 1 if bond defaults and 0 if the bond does not default. There are eight factors in the logistic model involving six principle components obtained via factor analysis and two macro factors named macroeconomic environment and energy policy support, that is:
where
p(
y = 1) is the probability of bond default, and
Fi represents the influencing factors.
3.4.2. Empirical Results and Interpretations
According to the proposed assessment model based on factor analysis and logistic regression techniques, the bond credit risks of 18 pairs of enterprises were assessed, as shown in
Table 7.
According to
Table 7, the probability of bond default can be calculated using the selected eight factors based on follow formula:
and the probability of bond non-default can be calculated by:
From the results of empirical analysis:
- (1)
F1 has a significantly negative influence on the probability of bond default, indicating that the higher the profitability of the enterprise, the lower the probability of bond default. Furthermore, from
Table 5,
F1 reflect four variables named bond credit rating (
X1), ROA (
X2), EBITTOR (
X3) and type of enterprise (
X18), whose coefficients to
F1 are 0.222, 0.292, 0.225 and 0.004, respectively. Therefore, these four variables have a negative influence on the probability of bond default. That is to say, during a certain period, more revenue can reduce the default probability because money is the assurance of debt repayment. In addition, the results show that higher credit ratings and nationalization levels result in a lower probability of default.
- (2)
F2 is negatively related to the probability of bond default at a 10% level of significance, revealing that the higher the solvency of the enterprise, the lower the default probability. Specifically, F2 reflects a current ratio (X4), quick ratio (X5) and interest cover (X6) with the coefficients of 0.381, 0.336 and 0.040, which are all positive. This means that these three variables are negatively correlated with the default probability, indicating that more current and quick assets and less debt can reduce the probability of bond default.
- (3)
F3 is negatively related to the probability of bond default at a 10% level of significance, showing that high operational ability can reduce the probability of default. Furthermore, F3 reflected the main information of three variables, inventory turning ratio (X10), current rate (X12) and total assets rate (X13) with the coefficients of 0.381, 0.363 and 0.362, revealing that the rapid capital turning rate reflects the company’s good operating ability, which can reduce the probability of bond default. As the name implies, the operation ability of an enterprise is its ability to administer and operate, that is, the ability to use various assets to earn profits. The faster a company uses its assets to achieve profits, the faster the turnover of assets, and the higher the assets’ liquidity, the stronger the solvency of the company and the lower the probability of default.
- (4)
F4 affects bond default probability negatively at the significant level of 5%. As mentioned before, F4 represents the company’s growth ability, so it is concluded that enterprises with high development potential have a low probability of defaulting on bonds. F4 reflects three variables called total profit grow rate (X8), total assets grow rate (X9) and operation cash into asset (X14), whose coefficients are 0.363, 0.294 and 0.133, resulting in the fact that the three variables are all negatively related to default possibility. If the development potential of the company is large, indicating that the company is in an ascending stage, the leaders of the company will be willing to repay on time and avoid the risk of moral credit so as to obtain a good reputation and promote the sustainable development. In addition, a large development potential means rapid income growth and enough funds to pay off debts, so the probability of default is low.
- (5)
F5 has a definite correlation with default probability at a significant level of 5%. F5 represents the corporate asset structure including three variables, debt to asset ratio (X15), equity multiplier (X16) and long asset fit asset (X17), whose coefficients are 0.461, 0.511 and −0.108. The high debt to asset ratio and the equity multiplier represent the high degree of corporate debt and the low protection of creditor’s rights, so the possibility of default is high. Meanwhile, a long asset fit asset reflects the stability of the financial structure and the level of financial risk of the company from the perspective of the balance and coordination of long-term assets and long-term capital. The long high asset fit asset shows that the financial structure of enterprise is stability and the assets are secure, therefore the probability of bond default is low.
- (6)
F6 has a negative effect on default probability at a significant level of 5%. Coefficients of operating income 3-year compound growth rate (X7) and account receivable turning rate (X11) in F6 are 0.624 and 0.395. F6 indicates the growth of the company’s main business revenue and the speed of capital recovery, reflecting the company’s viability. The results prove that the stronger the viability, the lower the probability of default.
- (7)
From
Table 7,
F7 and
F8 both have a significantly negative influence on the default possibility. The two main factors represent the macro conditions affecting the financing of new energy companies. The new energy industry is a newly emerging industry, and the government’s relevant policy support is an important guarantee for its healthy development. Moreover, macroeconomics directly affects the development prospects of new energy enterprises, and subsequently affects investors’ investment confidence and corporate financing efficiency. According to the findings in
Table 7, government support will restrain the increase of default possibility and a good external macroeconomic environment can improve the economy of enterprises, so as to effectively prevent the occurrence of default.
It is worth noting that the previous literature on the study of credit risk of corporate bonds mostly consider only the development of the company itself, mainly the financial status of the company, such as profitability and asset-liability ratio, and less consider the impact of the external environment on the credit risk of corporate bonds. However, for NEEs, which belong to the strategic emerging industry, a favorable macroeconomic environment and strong government policy support are important guarantees for their healthy and rapid development. Therefore, it is necessary to introduce the two external factors of macroeconomic environment and government policy support in the credit risk assessment model of NEE bonds. By this, the evaluation results obtained can objectively reflect the real risks of NEE bonds, which can help investors quickly identify bond risks, grasp investment opportunities in time and reasonably avoid investment risks. In addition, according to the obtained credit risk results, investors’ confidence in investment is enhanced to dispel investor’s doubts, which can help NEEs to raise funds quickly and help them achieve healthy and sustainable development.
The probabilities of bonds default of 18 pairs of training enterprises are predicted using the proposed model and the results are reported in
Table 8. As can be seen from
Table 8, the forecast accuracy rate for non-defaulting enterprises is 94.4% (of the 18 non-defaulting companies, 17 are forecasted correctly and one is forecasted incorrectly). The forecast accuracy rate for defaulting enterprises is 94.4% (of the 18 defaulting companies, 17 are forecasted correctly and one is forecasted incorrectly). Therefore, the comprehensive forecast accuracy is 94.4%.
In this paper, we classified the prediction error into two types. The first type of error is the one that actually the company is defaulted, but it is predicted to be a non-defaulting company. The second type actually refers to the company being non-defaulted, but it is predicted to be a defaulting company. In reality, investors are more concerned about the first type of forecast error because, once the primary type of error occurs, investors may not be able to receive interest or principal, resulting in loss. If the second type of error occurs, investors will only make less profits without losing their principal. It can be seen from
Table 8 that the probability of the former type of prediction error in the proposed model is only 5.6%, which is in line with the expectations and requirements of investors.
3.4.3. Model Robustness and Applicability
In order to test the robustness of the proposed model, the Hosmer–Lemeshow (H–L) test [
64] is applied in this paper and the results are listed in
Table 9. According to
Table 9, the
p-value of the H–L statistic is 0.9850, greater than 0.05, denoting the acceptance of the null hypothesis that the model is robust.
Furthermore, this section verified the applicability of the proposed model built on the relevant data of five pairs of new energy enterprises. Firstly, the principle component values of the five pairs of enterprises were calculated based on the enterprises’ original data. Secondly, the principle component values were substituted into the constructed logistic regression equation and the prediction value of each enterprise’s default probability was obtained. Finally, setting the classification threshold to be 0.5, the probability was converted to 0 or 1 according to the rounding principle, revealing that, if the probability is greater than 0.5, the enterprise is judged as a defaulting enterprise; otherwise, the enterprise is judged as a non-defaulting enterprise. The discrimination result is given in
Table 10, showing that the prediction accuracy of the model is as high as 100%. However, due to the small number of test samples and contingencies, this result does not mean that the proposed model can predict the default probability of corporate bonds without any errors. Overall, this model has a high accuracy in predicting the probability of bond default.
4. Conclusions and Recommendations
4.1. Conclusions
This paper takes the issue of financing of new energy companies as the starting point. Through the analysis of the main financing channels and difficulties faced by new energy companies, it is found that issuing bonds is an effective financing approach for new energy enterprises. However, the major problem faced by new energy companies in issuing bonds is that it is difficult to accurately assess the credit risk of bonds. Naturally, investors rarely purchase the bonds issued by new energy enterprises because of their suspicion of the proceeds of bonds, making it difficult for new energy enterprises to meet their financing needs. Therefore, this paper systematically analyzed the factors affecting the credit risks of new energy company bonds from the two aspects of the company’s own conditions and the external environmental conditions, and proposed a hybrid model for assessing the credit risk of new energy enterprise bonds based on factor analysis-logistic regression analysis techniques. By factor analysis, the correlation between variables can be eliminated, the multi-collinear of the model can be avoided, and the number of variables can be reduced, which helps to improve the estimation accuracy of the model. Furthermore, this paper applied the relevant data of China’s new energy companies to verify the practicability and effectiveness of the model.
When assessing the credit risk of new energy company bonds, it needs to consider the company’s main creditor status and credit rating, which are similar to the general corporate bonds from the perspective of the structure of the rating framework. However, given the fact that the new energy industry is a key strategic emerging industry in China, and NEEs are mainly small and medium-sized privately-owned enterprises, which are capital-intensive and technology-intensive, the country’s policy support and macroeconomic environment changes have a huge impact on the development of NEEs and thus affects the credit risk level of NEE bonds. Therefore, when assessing the credit risk of new energy company bonds, in addition to considering the corporate management and financial factors, it is necessary to examine the regional macroeconomic environment, the energy policy support of local government and the property of the company. Accordingly, this paper selected 20 internal and external factors affecting the credit risk of new energy corporate bonds, of which 18 factors are related to the company’s own conditions, including 16 representative management and financial indicators in the latest financial criteria, and two non-financial indicators: bond credit rating and type of enterprise. Moreover, there are two external environmental factors: macroeconomic environment and energy policy support, making the constructed evaluation index system meet the characteristics of bond financing of China’s NEEs and the evaluation results can truly reflect the credit risk level of China’s NEE bonds under the current social and economic environment of China
The factor analysis results showed that 18 internal factors can be divided into six categories, which reflect the company’s profitability, solvency, operational ability, growth potential, asset structure and viability. The logistic regression results reported that the profitability, solvency, operation ability, growth potential and viability of a company are inversely proportional to the probability of bond default, that is, the stronger the above-mentioned firm’s capabilities, the lower the probability of bond default. The asset structure is proportional to the probability of bond default. Specifically speaking, the greater the debt to asset ratio and equity multiplier, the greater the debt level of the company and the greater the probability of bond default. The higher the long asset fit asset, the higher the stability and security of corporate assets, and the lower the probability of bond default. In addition, for macroeconomic factors, the better the macroeconomic environment, the better the company’s development prospects, and the lower the probability of bond default. Energy policy support is crucial to the healthy development of new energy companies. The greater the support, the less difficulties the company faces and the lower the probability of bond default.
In general, the assessment model based on factor analysis-logistic regression analysis proposed in this paper can effectively assess the credit risk of bonds issued by new energy companies by expressing it in the form of default probability, which can help investors to make decisions. Meanwhile, the proposed model can help to improve the credit rating system for new energy bond market and promote the development of new energy companies. According to the model, this paper employed factor analysis to classify many influencing factors, which can eliminate the correlation between variables so as to meet the assumptions of econometric analysis, and can reduce the number of explanatory variables in the econometric model without losing the variables’ original information, so as to reduce the consumption of the freedom degree of the equation and improve the accuracy of the parameter estimation. Analogously, the proposed framework can be popularized in other fields to analyze comparable problems with multiple influencing factors.
4.2. Recommendations
According to the classification of the influencing factors of credit risk of corporate bonds, this article proposed some targeted recommendations from three aspects: the company’s own financial and financing management, credit rating market and macro environment, hoping to contribute to the development of China’s new energy companies.
From the perspective of corporate financial management, corporate bonds are a “double-edged sword” meaning that it cannot only provides enterprises with enough funds but also bring risks to the enterprises. Therefore, issuing corporate bonds must pay attention to financing strategy. Thoughtful financing strategy can improve the efficiency of financing, meet the financing needs, reduce financing obstacles, maximize the control of financing risk and optimize the financing effect. There are many financing strategies for new energy enterprises to issue corporate bonds, of which the most important one is the maturity portfolio strategy, referring to issuing bonds with different maturities, such as issuing short-term bonds and long-term bonds or issuing long-term bonds with different years. Issuing bonds with different maturities can disperse debt repayment pressure, which can meet the funding needs of enterprises with lower default risks.
To control the default risk of bond issued by new energy enterprises that can reduce the financing costs, this article puts forward two cut-in points. Firstly, sharing the default risk of new energy corporate bonds through innovative models such as structured credit enhancement. For example, credit private placement bonds can be used to balance the security and benefits of bonds through structured credit enhancements. The risks of credit private placement bonds are stratified first, and then different types of funds are attracted to participate in subscriptions. Secondly, introducing bond trustee managers to control business risks and debt repayment risks of bonds. Bond underwriters can act as bond trustee managers. By appointing experts with rich financial experience and outstanding social reputation, the bond underwriters continue to pay close attention to the creditworthiness and solvency of bond-issuing enterprises and supervise the operation and standardization of bond-issuing enterprises, which can achieve the risk control in the case that the SMEs’ conventional credit enhancement methods cannot effectively cover.
As for the corporate bond market, it is of great significance to improve the status quo of long bond supervision. After fully borrowing from the supervisory model in the developed country’s corporate bond market and considering the development stage of China’s corporate bond market, this paper supports that China should unify the regulatory body of corporate bond issuance, centralize the regulatory power in the hands of only one regulatory authority and clarify the scope of supervision of corporate bonds regulatory authority. To a certain extent, it can avoid the problems of extended supervision, regulatory duplication and regulatory vacuum existing in the corporate bond market in China, which is conducive to the development of China’s corporate bond market in a more effective direction.
Meanwhile, in the corporate bond market, optimizing credit rating system is essential. According to the assessment results of the model, credit rating is an important consideration the probability of bond default. Credit rating is an effective means to reveal credit risk and reduce information asymmetry. A good credit rating industry can both meet the financing needs of new energy enterprises and provide investors with credible and reliable information. In order to promote the rapid development of credit rating, China can proceed from the following three aspects. Firstly, in view of the unreasonable payment model that subjects to be assessed need to pay, Chinese government should formulate the corresponding laws and regulations, drawing lessons from the overseas mature mode, and gradually realize the transition from “issuers pay” to “investors pay”. Secondly, for the lack of credibility in credit rating agencies and the credit ratings, credit rating agencies should improve their rating techniques and methods so that their assessed credit ratings are fair and accurate. In addition, credit rating agencies should improve the tracked-rating mechanism. Agencies should regularly or irregularly rate bond-issuers and disclose the rating results timely so that the credit ratings can reflect the recent credit status of bond-issuers.
For an external macro environment, the government will provide policy-based financial support for the purpose of promoting the development of strategic emerging industries. This is called policy-based financing, which is a financing tool that is often overlooked by enterprises because they do not understand it. As a strategic for emerging industry, new energy companies must seriously study related national policies and strive for policy-based financing, so as to gain competitive advantages in capital costs.
In addition to policy-based financing, sound new energy policies and regulations are the important external factors for the healthy development of new energy enterprises. Specifically, government departments should support and stimulate the development of the new energy industry through sound tax policies, financial subsidies and other policies as well as various laws, regulations and measures. For many links in the new energy industry chain such as research and development, production, exchange and consumption, the government should adopt various measures like special budgets, government bond investment, discount interest loans, tax relief, government procurement, financial subsidies and award-winning purchasing to actively build a new energy technology demonstration and promotion mechanism that combines production, education and research. Finally, the government should guide new energy companies in innovating industrial technologies, accelerating technological upgrading and eliminating backward production capacity. The government can use measures such as environmental taxes and energy taxes to increase the costs of using fossil energy, which can encourage enterprises and consumers to actively participate in the development and consumption of new energy sources.

