Target Air Change Rate and Natural Ventilation Potential Maps for Assisting with Natural Ventilation Design During Early Design Stage in China


1
School of Civil Engineering, Guangzhou University, Guangzhou 510006, China
2
Department of Architecture, Meiji University, Kanagawa 214-8571, Japan
*
Author to whom correspondence should be addressed.
Sustainability 2018, 10(5), 1448; https://doi.org/10.3390/su10051448
Submission received: 13 April 2018
/
Revised: 1 May 2018
/
Accepted: 2 May 2018
/
Published: 7 May 2018
Abstract
:To achieve the desired free-cooling effect, the preliminary design of natural ventilation should be combined with discussions of building shape during the early design stages. In an earlier study a method for supporting strategic design of natural ventilation was developed that relied on the target air change rate and natural ventilation potential. The authors defined target air change rate as a point where the gradient of the increase in the cooling effect from natural ventilation reached a maximum. To verify the viability of the proposed method, the robustness of the target air change rate is examined in this paper using a typical Chinese office building model with representative operation conditions in five climate zones of China. The impacts of insulation level, thermal capacity, and window-to-wall ratio (WWR) on the target air change rate are investigated. In addition, the target air change rate and natural ventilation potential maps in China are created to inform rough natural ventilation strategies in the early design stages. According to the evaluation results, simple natural ventilation strategies are sufficient for buildings with relatively low internal gains to realize the required small target air change rate, regardless of climate conditions. Under moderate internal gains condition, well-organized and examined natural ventilation strategies are required in the Hot Summer and Warm Winter zone and the Temperate zone. However, these strategies are particularly suggested for cities in the Temperate zone with a warm climate due to the higher cooling potential. Moreover, elaborate natural ventilation design is recommended for buildings in cold climates when the internal gains are increased to a high level.
1. Introduction
To improve the indoor air quality and the user satisfaction of nonresidential buildings, fresh outdoor air is needed to dilute the contaminated indoor air. The exploitation of natural ventilation can reduce the energy consumption associated with auxiliary ventilation devices. Considerable free-cooling effects can be obtained for various climate conditions through successful natural ventilation design [1,2,3]. Moreover, it is indicated that natural ventilation design increases the thermal comfort and work efficiency of occupants [4,5]. Thus, natural ventilation design attracts a lot of attention related to the energy efficiency of the building sector and the requirements of indoor environments [6]. Etheridge [7] reviewed relevant research on natural ventilation in nine areas during the past fifty years. In his study, the importance of design process improvement and natural ventilation strategies selection was emphasized to minimize the risk of design failure. Design decisions, such as building shape and opening configuration, that are made in the early design stages significantly influence the final building performance and costs [8,9]. This influence is very important for natural ventilation design. To achieve the desired effect, the design strategies for natural ventilation should be combined with discussions of building shape and sketch during the early design stages because the configurations of atrium and ventilation shafts affect the performance of natural ventilation [10,11].
The results of building performance simulations can provide useful information for making design decisions and for guiding the design toward high performance [12,13]. However, architects encounter many difficulties when performing these simulations in the initial design stages, including lacking information, uncertainty, vast design space, increasing levels of model resolution, large amounts of time required for the simulations, and rapid design changes [14]. It is therefore essential to provide architects with adaptable methods and tools for supporting the preliminary design of natural ventilation during these initial stages.
In the most recent twenty years, extensive climate analysis research, which largely impacts the applicability of passive heating and cooling strategies, has been conducted to promote passive design [15]. In the field of natural ventilation, Ghiaus proposed a method for assessing the energy-saving potential of natural ventilation using the free-running temperature [16]. Artmann attempted to evaluate the suitability of climate for night-time ventilation based on the degree-hours approach [17]. The concept of natural ventilation hours, which considers both outdoor climate conditions and ambient air quality, was proposed by Tong to examine the regional feasibility of natural ventilation [18]. These rapid evaluation methods are very useful for addressing the most fundamental question of whether climate conditions are suitable for using natural ventilation. However, it is difficult to obtain additional information regarding appropriate natural ventilation strategies that effectively utilize the available natural ventilation potential when performing these climate analysis. For natural ventilation design, remarkable cooling effects cannot be obtained from insufficient natural ventilation strategies. Conversely, an excessive natural ventilation strategy, that is, mixed-mode, would result in unnecessary initial costs and labor associated with the complex design [16,19].
In this context, the authors developed a preliminary design method for natural ventilation using the criteria of target air change rate and natural ventilation potential in an earlier study [20]. The authors defined the target air change rate as the maximum gradient of the cooling effect increase from natural ventilation. Only the climate data and internal gains data are needed to evaluate the proposed design criteria. Therefore, these design criteria are helpful for determining a rough natural ventilation strategy during the early design stages, which are characterized by uncertainty and lacking information. The ultimate purpose of our study is to verify the viability of the proposed design method that uses the criteria of target air change rate and natural ventilation potential. Additionally, world target air change rate and natural ventilation potential maps are created. In this paper, a more convincing sensitivity investigation is conducted to examine the robustness of the target air change rate by using a typical Chinese office building model with representative operation conditions in five climate zones of China. The impacts of insulation level, thermal capacity, and window-to-wall ratio (WWR) on the target air change rate are examined. In addition, the target air change rate and natural ventilation potential maps from China are shown to provide architects with information for determining appropriate natural ventilation strategies in the early design stages. Notably, the cooling effects that occur related to night-time ventilation and mixed-mode (hybrid) systems are beyond the scope of this study.
China is selected as the object of this study due to its significantly increasing energy consumption and CO2 emissions corresponding with rapid economic and industrial development. The building sector in China accounts for approximately 46% of the total energy consumption according to the perspective of life cycle evaluations [21]. This ratio has continued to increase at a stable rate in recent years. On the other hand, a large number of newly constructed commercial buildings in China have resulted in an energy-saving opportunity due to the adoption of passive natural ventilation design.
2. Theory
2.1. The Definition of the Target Air Change Rate
Target air change rate is defined as the maximum point of the gradient of the cooling effect increase due to the intake of outdoor air through natural ventilation. The rise in cooling effect diminishes after the air change rate exceeds the target value. Thus, the extra increase in the amount of air change achieved by the complex design and additional costs does not contribute to the increase in additional free-cooling effect. As mentioned above, natural ventilation design should be accomplished to achieve significant effects through some simple operations. The risk of energy waste and overcooling exists in a mixed-mode ventilation design. Thus, the cooling effect for target air change rate evaluation does not consider the effect originated from mixed-mode ventilation. Only the climate factors of building location and the internal gains level of the designed building influence the proposed target air change rate. Thus, target air change rate can be used as a design benchmark for determining appropriate natural ventilation strategies during the early design stages, through which the maximum energy-saving effect can be obtained and the requirement of cost effectiveness can also be satisfied. The increase of additional cooling effect becomes small when the amount of air change rate reaches the design target value. According to a case study in a previous study [20], no obvious increase in cooling effect is observed when the air change rate attains 10 ac/h. Thus, the calculated free-cooling effect at an infinite air change rate is regarded as the natural ventilation potential.
2.2. A Simple Method for Estimating the Target Air Change Rate and Natural Ventilation Potential
The target air change rate is decided when the cooling effect from natural ventilation reaches saturation. However, the portion of the cooling effect combined with the mechanical system (mixed-mode) is excluded from the evaluation. In this study, the climate conditions and indoor usage conditions are used to determine the suitability of natural ventilation at a particular time step. The suitability of the climate for natural ventilation is decided by two parameters: outdoor dry-bulb temperature and dew point temperature. The upper threshold of the outdoor dry-bulb temperature is the 90% acceptability of the optimal comfort temperature in naturally ventilated buildings and is defined by the adaptive comfort model in ASHRAE-55 (Equations (1) and (2)) [22]. In addition, the dew point temperature is confined within 17 °C for the sake of humidity control [23].
where tcomf (°C) is the optimum comfort temperature in a naturally ventilated building, ta,out (°C) is the monthly average outdoor dry-bulb temperature, and tup (°C) is the upper threshold of the outdoor dry-bulb temperature for natural ventilation.
The indoor usage conditions refer to whether the internal gains of the building can be fully offset by the cooling effect obtained solely from natural ventilation (see Equation (3)). Qin in Equation (3) represents the specific internal gains and is defined as the combination of gains from solar and indoor activities. The negative value of mi,j indicates that the cooling effect induced by natural ventilation can fully offset the specific heat gains Qin and indicates that the indoor conditions are suitable for natural ventilation. Natural ventilation mode (operable windows are open and the air-conditioning system is off) begins once the predefined climate conditions and indoor usage conditions are both satisfied. Otherwise, the air-conditioning mode (operable windows are closed and the air-conditioning system is on) is used.
where Qin (Wh/m2) is the specific internal gains, i (ac/h) is the air change rate, H (m) is the ceiling height, ρ (kg/m3) is the density of air, Cp (J/kg K) is the specific heat of dry air, and tout,j (°C) is the outdoor temperature at the time step j.
The hourly and annual cooling loads required to be processed by air-conditioning systems are calculated using Equations (4) and (5), respectively. The cooling effect of air change at the rate of 1 ac/h is not considered in the evaluation because this amount of air change is approximately equal to the required minimum amount of fresh air in office buildings. The cooling effect used to determine the target air change rate is evaluated from the decrease in cooling load from the baseline, as shown in Equation (6). The baseline is the cooling load at the minimum required amount of air change (1 ac/h). As the air change rate i increases, the target air change rate can be determined when Enat,i reaches the maximum value. Finally, the natural ventilation potential is defined as the available cooling effect when the air change rate is infinite, as shown in Equation (7).
where Li,j (Wh/m2) is the cooling load when the air change rate is i ac/h at time step j, M is the required minimum air change rate (1 ac/h), T is the time interval (1 h), Li (Wh/m2) is the annual cooling load at i ac/h, Enat,i (Wh/m2) is the cooling effect obtained when only using natural ventilation at i ac/h, Lmin (Wh/m2) is the baseline cooling load at 1 ac/h, and Ep (Wh/m2) is the cooling potential from natural ventilation.
2.3. Application of the Target Air Change Rate in Preliminary Design of Natural Ventilation
The strategic design of natural ventilation in the early design stages can be roughly divided into three categories in Table 1 based on the magnitude of the target air change rate: (i) Simple natural ventilation strategies (i.e., single-sided ventilation) are suggested to obtain the combined effects of remarkable free-cooling with reasonable initial costs when the target air change rate is relatively small (≤3 ac/h); (ii) Well-organized and well-examined natural ventilation strategies (i.e., cross ventilation or stack ventilation [24]) are necessary to achieve the desired target air change rate, and 10 ac/h is defined as the boundary for this category. It is because that the air change rate of 10 ac/h is considered as a realizable level through available natural ventilation strategies [6]; (iii) Complex mixed-mode natural ventilation strategies must be considered to attain the target air change rate of more than 10 ac/h. However, the cost effectiveness and design risks should be considered carefully in this category.
3. Validating the Robustness of the Target Air Change Rate Using a Case Study of China
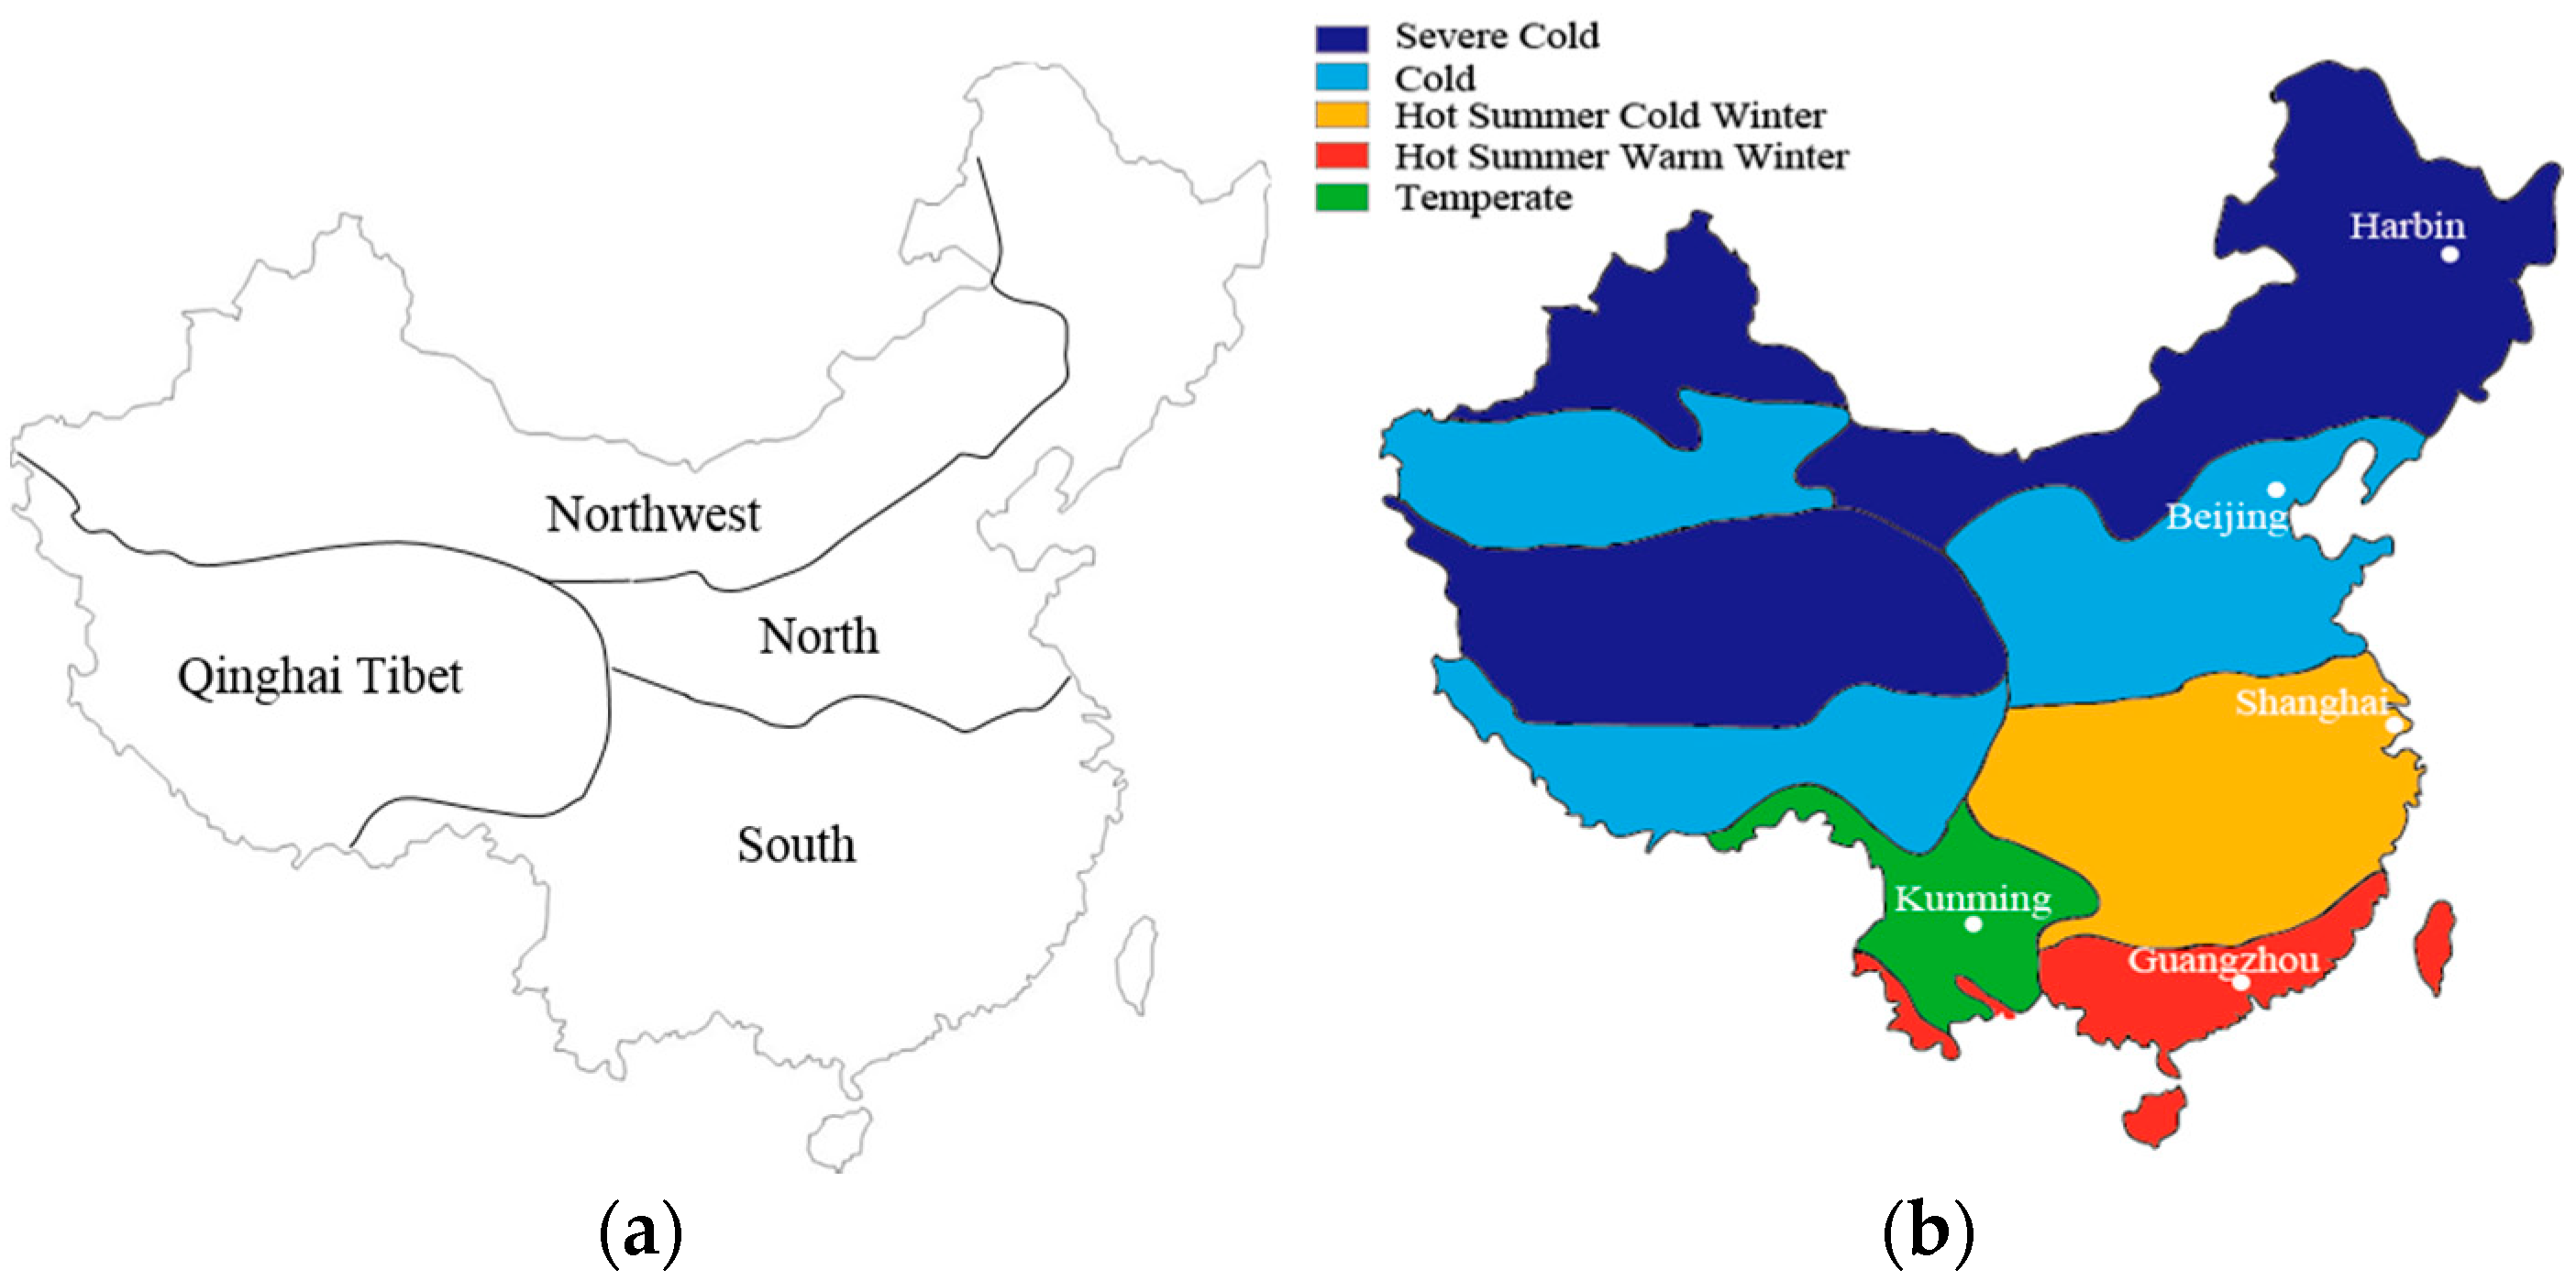
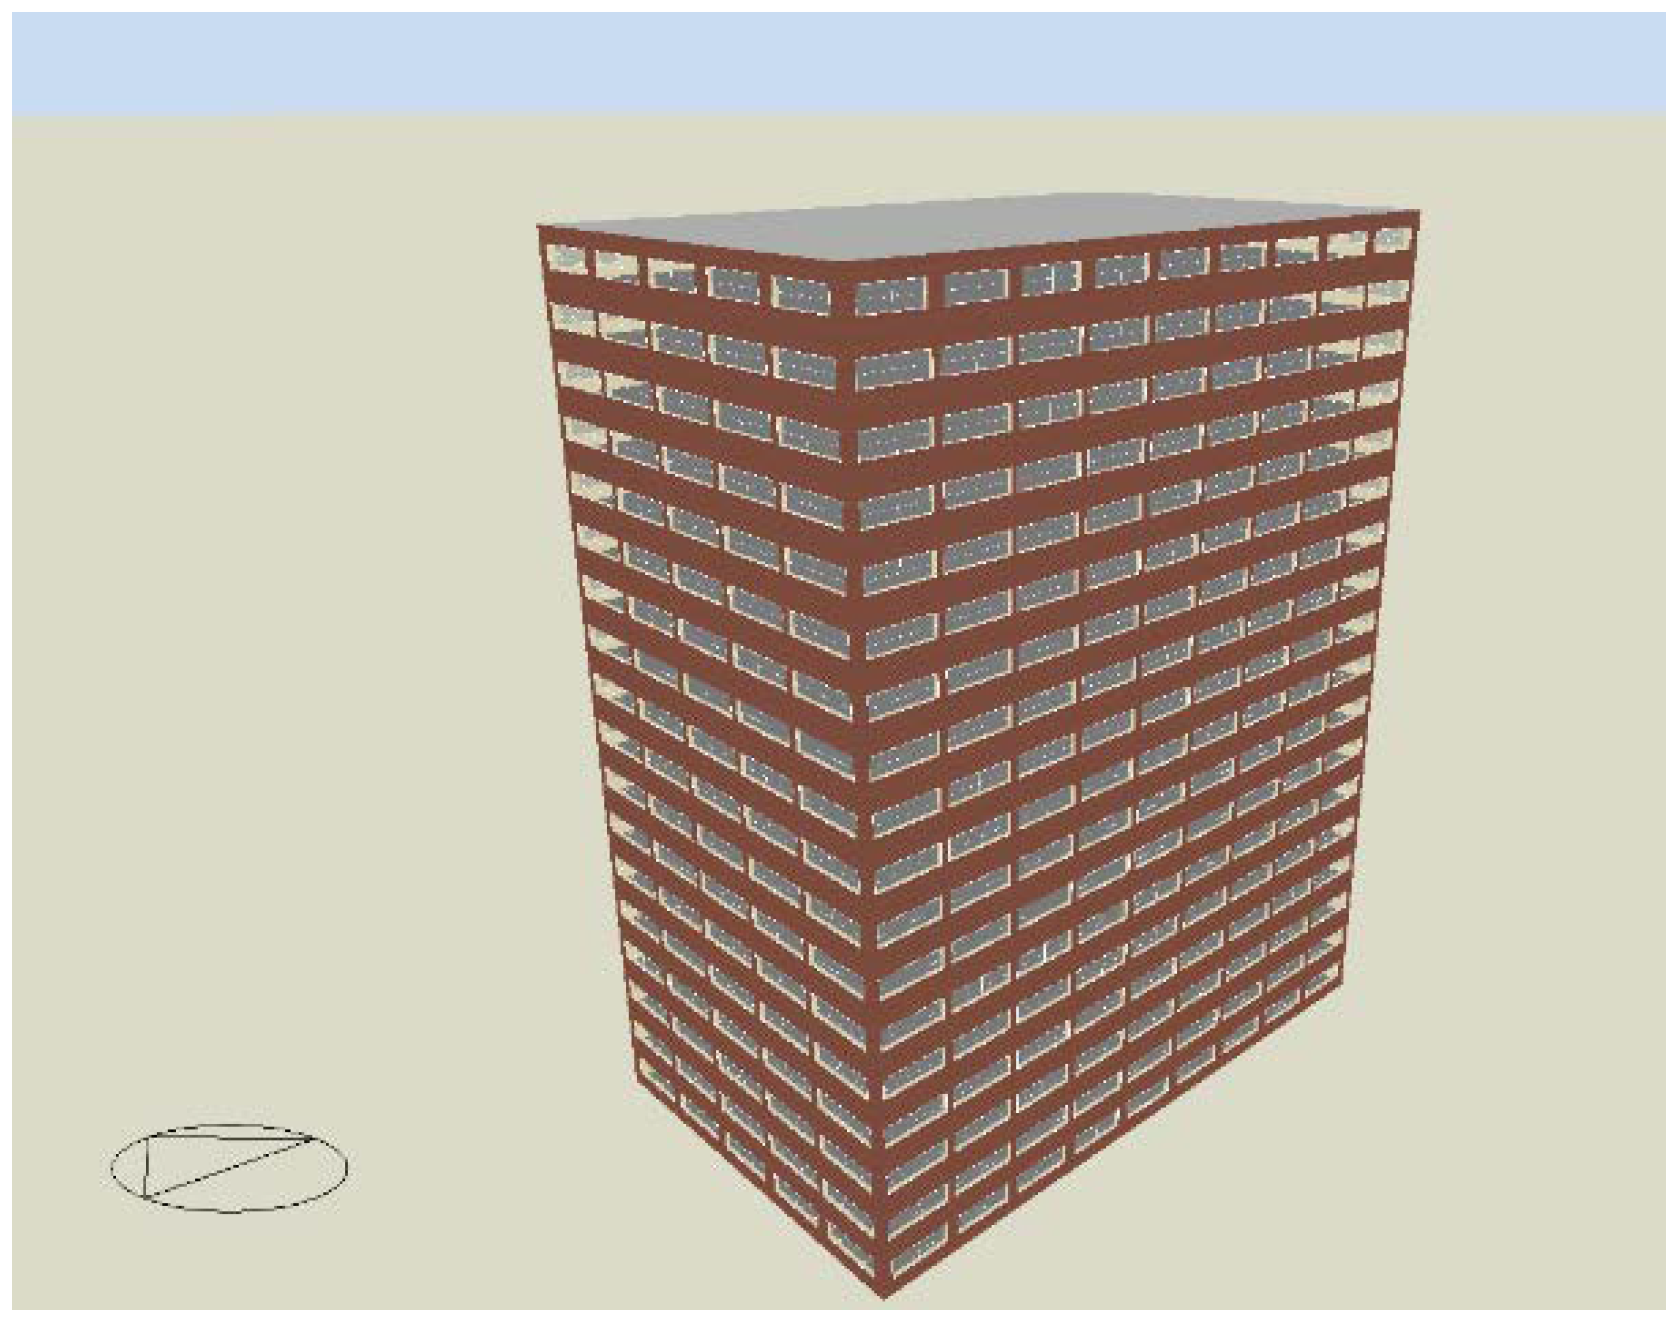
Only climate and internal gains data are necessary to evaluate the target air change rate and natural ventilation potential described in Section 2. To further verify the feasibility of using the target air change rate as a design criterion, sensitivity analysis is performed and described in this section. The influences of construction thermal capacity, envelope insulation level, and window-to-wall ratios (WWR) on the target air change rate are examined using the simulation results from a typical Chinese office building model designed with representative operation conditions. However, the target air change rate for assisting with natural ventilation design is calculated using the method described in Section 2.2. Due to the obvious differences in the terrain and topography and the locations of land and sea, various types of climate exist in China, including temperate monsoon climate in the north, temperate continental climate in the northwest, plateau-mountain climate in the southwest, and subtropical monsoon climate in the south, as shown in Figure 1a [25]. Therefore, sensitivity analysis must be conducted for different climate conditions. China is divided into five major climate zones according to the design standards for commercial buildings [26]. Figure 1b shows the five climate zones of Severe Cold, Cold, Hot Summer and Cold Winter, Hot Summer and Warm Winter, and Temperate zones. Harbin, Beijing, Shanghai, Guangzhou, and Kunming are chosen as the representative cities in these five major climate zones (see Figure 1b). For these five cities, the hourly Chinese standard weather data (CSWD) provided by Tsinghua University and the China Meteorological Bureau are used in the sensitivity analysis [27]. The climate characteristics and the upper limit of the envelope U value in each city are summarized in Table 2. Figure 2 shows a typical Chinese office building modeled in the simulation program of EnergyPlus [28]. It is an eighteen-story open office building with a floor area of 1500 m2, and the geometry data of the building were originally collected by Chinese design institutes [29]. Table 3 shows the simulation conditions that refer to the design guidelines of GB50189. The variable design conditions and their corresponding modifications are given below.
- Heavyweight and lightweight structures are used to examine the impacts of construction thermal capacity. The thermal capacities of heavyweight and lightweight structures are 213.7 kJ/m2 K and 65.2 kJ/m2 K, respectively. The compositions of heavyweight structures from the outer side to the inner side are brick tile, mortar, expanded polystyrene (EPS), concrete block (heavyweight), and gypsum plastering. The compositions of lightweight structures from the outer side to the inner side are brick tile, mortar, EPS, concrete block (lightweight), and gypsum plastering.
- Three different WWR values of 20%, 40%, and 60% are used in the simulation to consider the influences of the opening area.
- In addition to the typical internal gains shown in Table 3, high-level internal gains with twice the typical density of occupants, lighting, and plug load values are also available in the simulation.
- Moreover, an additional case with an adiabatic envelope and no glazing is simulated for the five representative cities.
In total, 130 cases are simulated by combining the modifications of the three variable design conditions. For each case, the design variable is the air change rate. To obtain the target air change rate, the objective function of simulation is the hourly cooling load. The tenth floor in the middle of the model is selected as the analysis object.
Table 5 and Table 6 show the evaluated target air change rates for cases with typical and high-level internal gains, respectively. For both typical and high-level internal gains, no distinctive variations in the target air change rate (at the level of ±1 ac/h) are observed as the thermal capacity, insulation level, and WWR varied in the same city. Therefore, the reasonability of the target air change rate estimated based on a completely adiabatic condition without considering the impacts of heat conduction and window area is confirmed through the sensitivity analysis. Meanwhile, the robustness of the target air change rate as a criterion in early design stages characterized by rapid design changes is verified. From the simulation results presented by Tong, the energy-saving effect of natural ventilation did not obviously vary (within 8%) with variations in plug load. In his analysis, the plug load varied from 10 W/m2 to 20 W/m2 at an increment of 5 W/m2 (15 W/m2 was the baseline load) [18]. However, besides the plug load, the occupant and lighting which served as internal gains components are very different among office buildings [30]. Therefore, this study focuses on the impacts of the overall internal gains originating from the occupant, lighting, and plug load on the target air change rate. The significant impacts of internal gains on the target air change rate can be distinctively observed from the simulation results of Kunming listed in Table 5 and Table 6. The target air change rates of Kunming under the typical internal gains condition are 3–4 ac/h. The design strategies suggested for naturally ventilated buildings in this case can be approximatively classified as category (i). However, the target change rates in Kunming increase to 6–7 ac/h when the internal gains are increased to the high level. For such cases, simple natural ventilation strategies are not sufficient for achieving the desired target air change rate. A well-designed and examined natural ventilation strategy is necessary to realize a measurable cooling effect. This impact of internal gains on natural ventilation performance was also indicated by Yao, who developed a simple evaluation tool for assessing preliminary natural ventilation strategies [31]. In addition, the impacts of climate on the target air change rate tend to become more intense with increasing internal gains.
4. Target Air Change Rate and Natural Ventilation Potential Maps of China
The creation of maps is a visual and feasible approach for showing architects information regarding design parameters that depend on climate conditions. Therefore, the target air change rate and natural ventilation potential maps in China are created using the proposed method, whose viability in China was verified in Section 3. These created maps will inform architects of rough natural ventilation strategies in the early design stages when building shape and sketch are discussed. In this study, 36 major cities, including the provincial capitals and subprovincial cities shown in Table 7, are selected to generate these maps. Additionally, the specific internal gains (Qin) adopted to evaluate the target air change rate and natural ventilation potential are 10 W/m2, 20 W/m2, 40 W/m2, and 80 W/m2 [30]. These maps are created considering various specific internal gains to provide design options for different projects. The other necessary parameters for evaluating the criteria of target air change rate and natural ventilation potential are listed in Table 8.
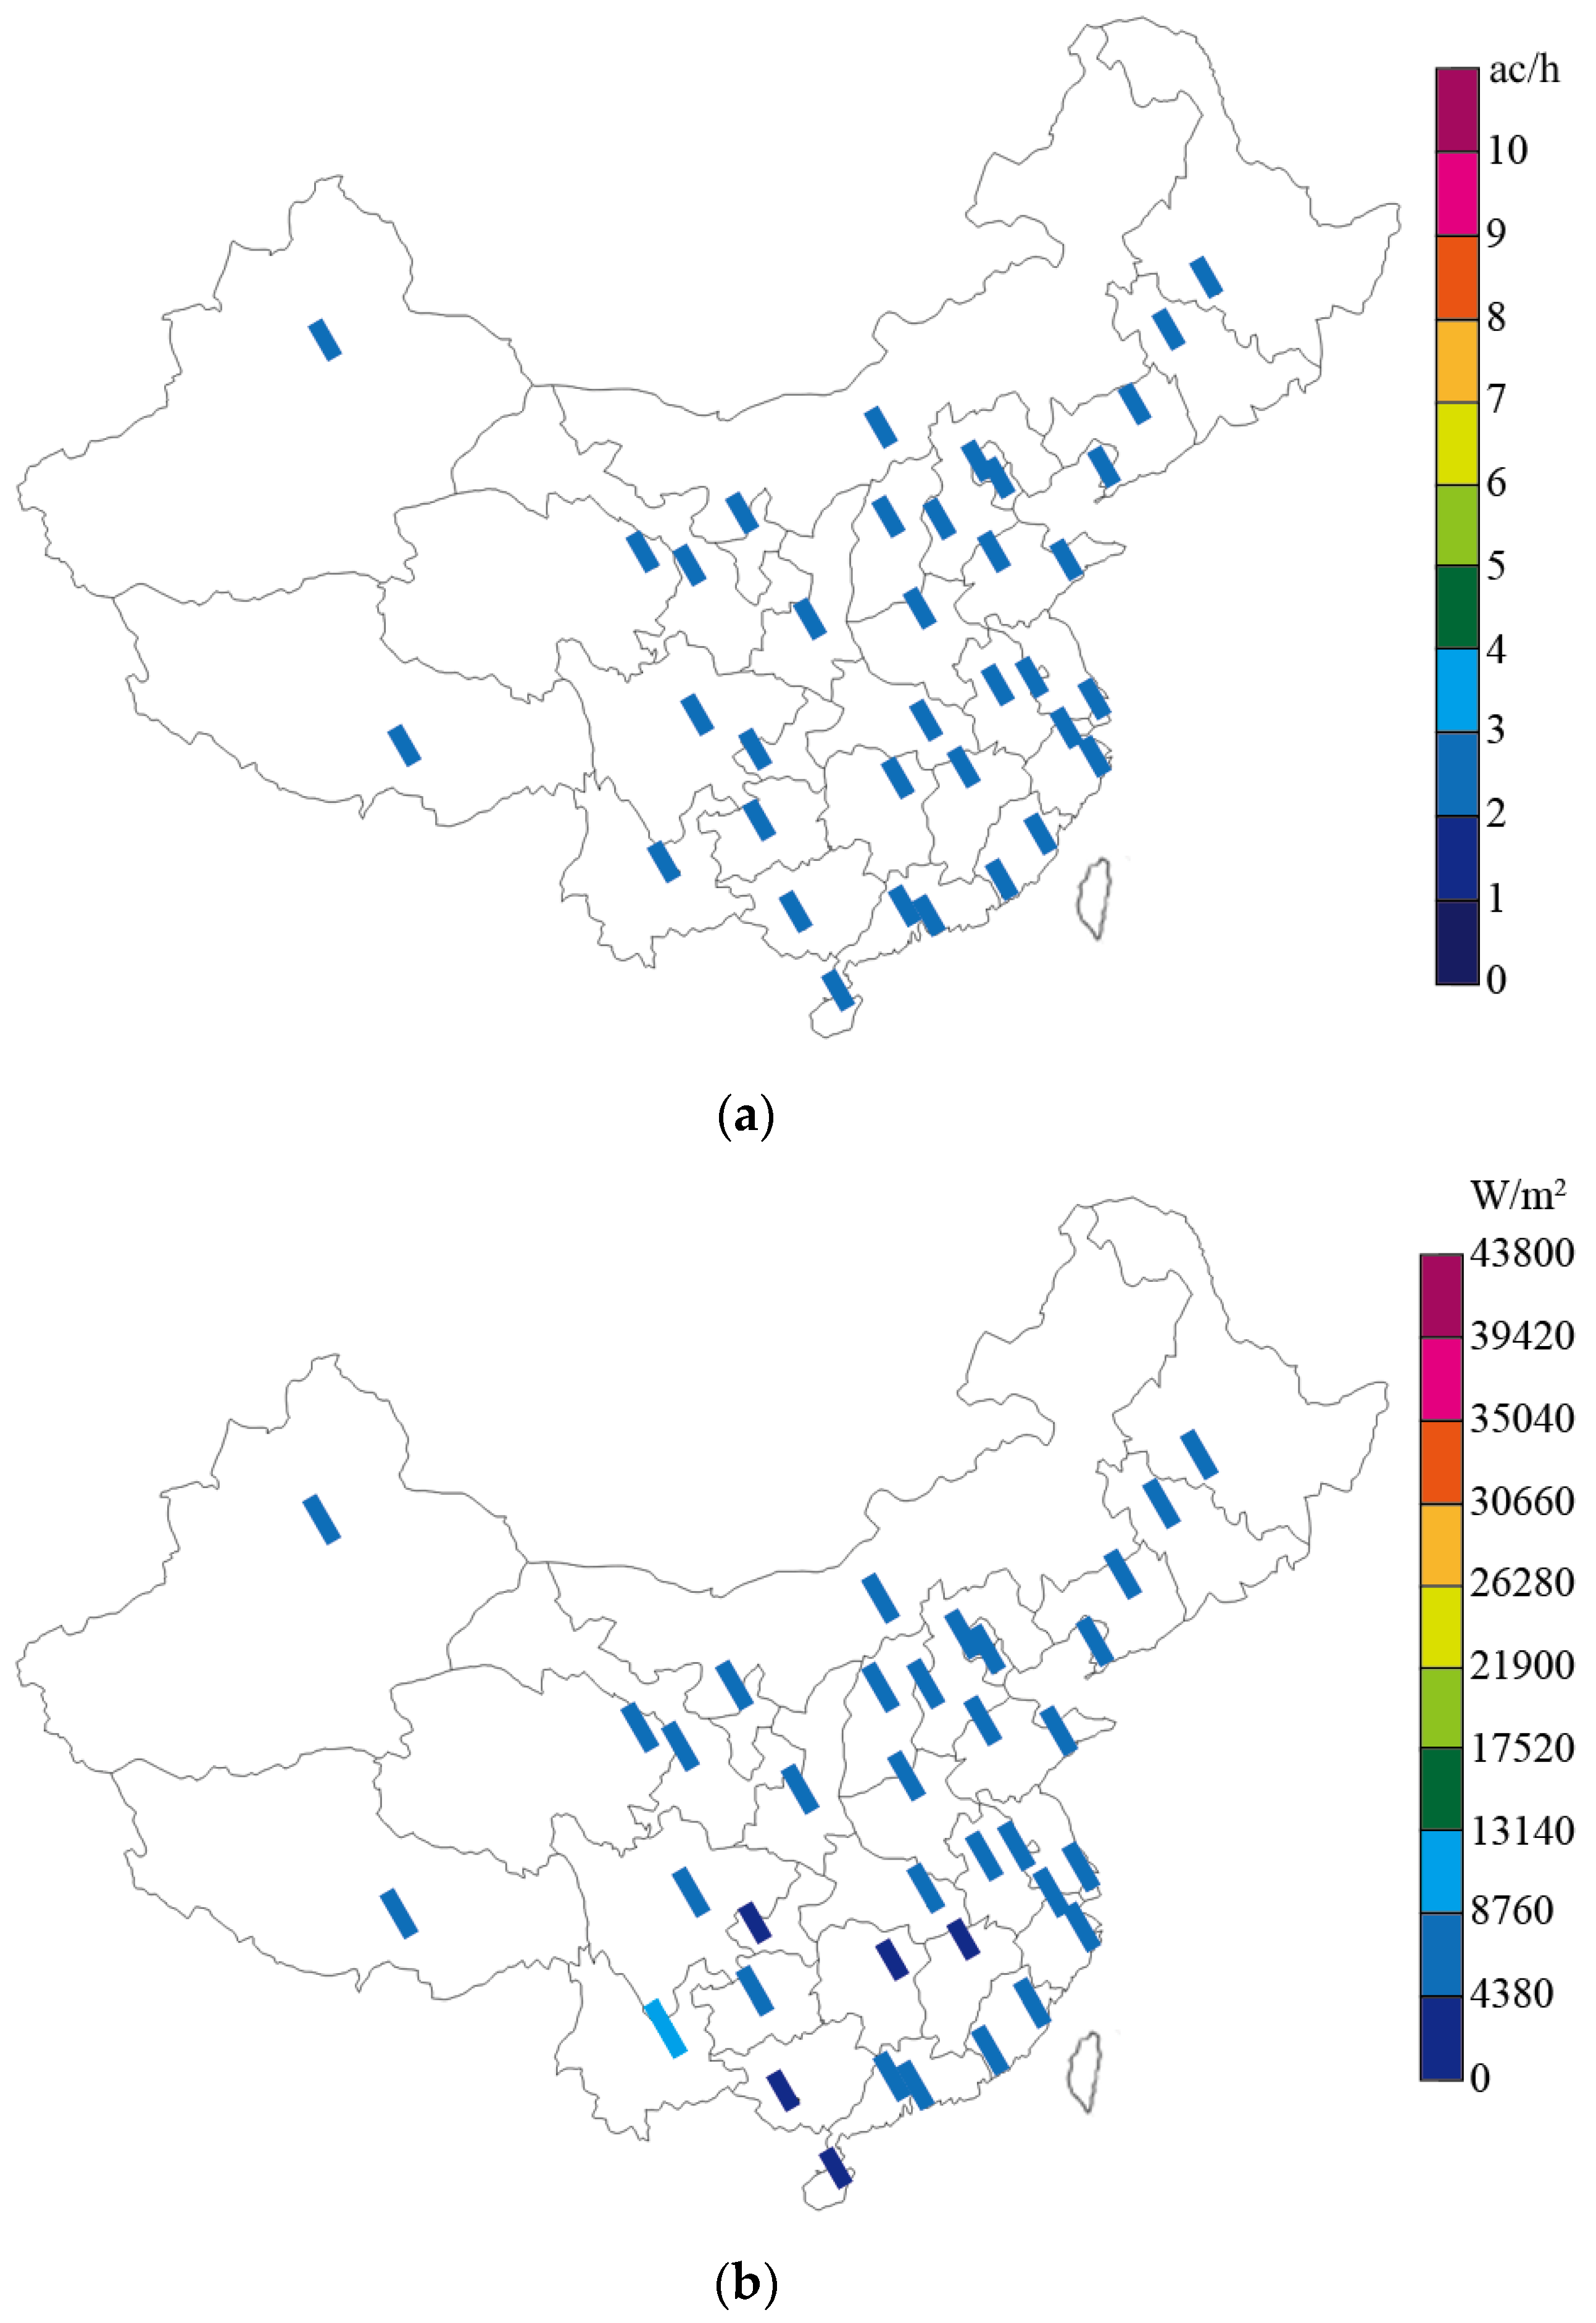
Figure 3 shows the target air change rate and natural ventilation potential maps created for buildings with minimum specific internal gains of 10 W/m2. The characteristics of such buildings are designed with high-efficiency lighting systems, minimum plug load, and low occupant density. A uniform target air change rate of 2 ac/h can be seen in all the selected locations regardless of climate conditions, as shown in Figure 3a. According to the classification of design strategies for naturally ventilated buildings described in Section 2.3, simple natural ventilation strategies are sufficiently capable of realizing the relatively small target air change rate for buildings with minimum internal gains. Figure 3b demonstrates the natural ventilation potential map under the specific internal gains of 10 W/m2. The maximum value of the color label represents the annual summation of the specific internal gains during the occupied period of between 7:00 and 19:00. For most selected locations, the cooling effect potential from natural ventilation stays between 4380 and 8760 W/m2. The cooling effect potential of natural ventilation in the selected cities only accounts for 7–28% of the annual specific internal gains (43,800 W/m2). The cooling effect induced by the required minimum amount of fresh outdoor air (1 ac/h), which is excluded from the evaluation of natural ventilation potential, compensates for most of the specific internal gains. Thus, the cooling potential experiences no obvious increase, even when the amount of air change is large enough. Accordingly, the simplest natural ventilation strategies, such as single-sided natural ventilation with operable windows, are recommended for buildings with minimum internal gains to achieve high energy performance and cost-effectiveness.
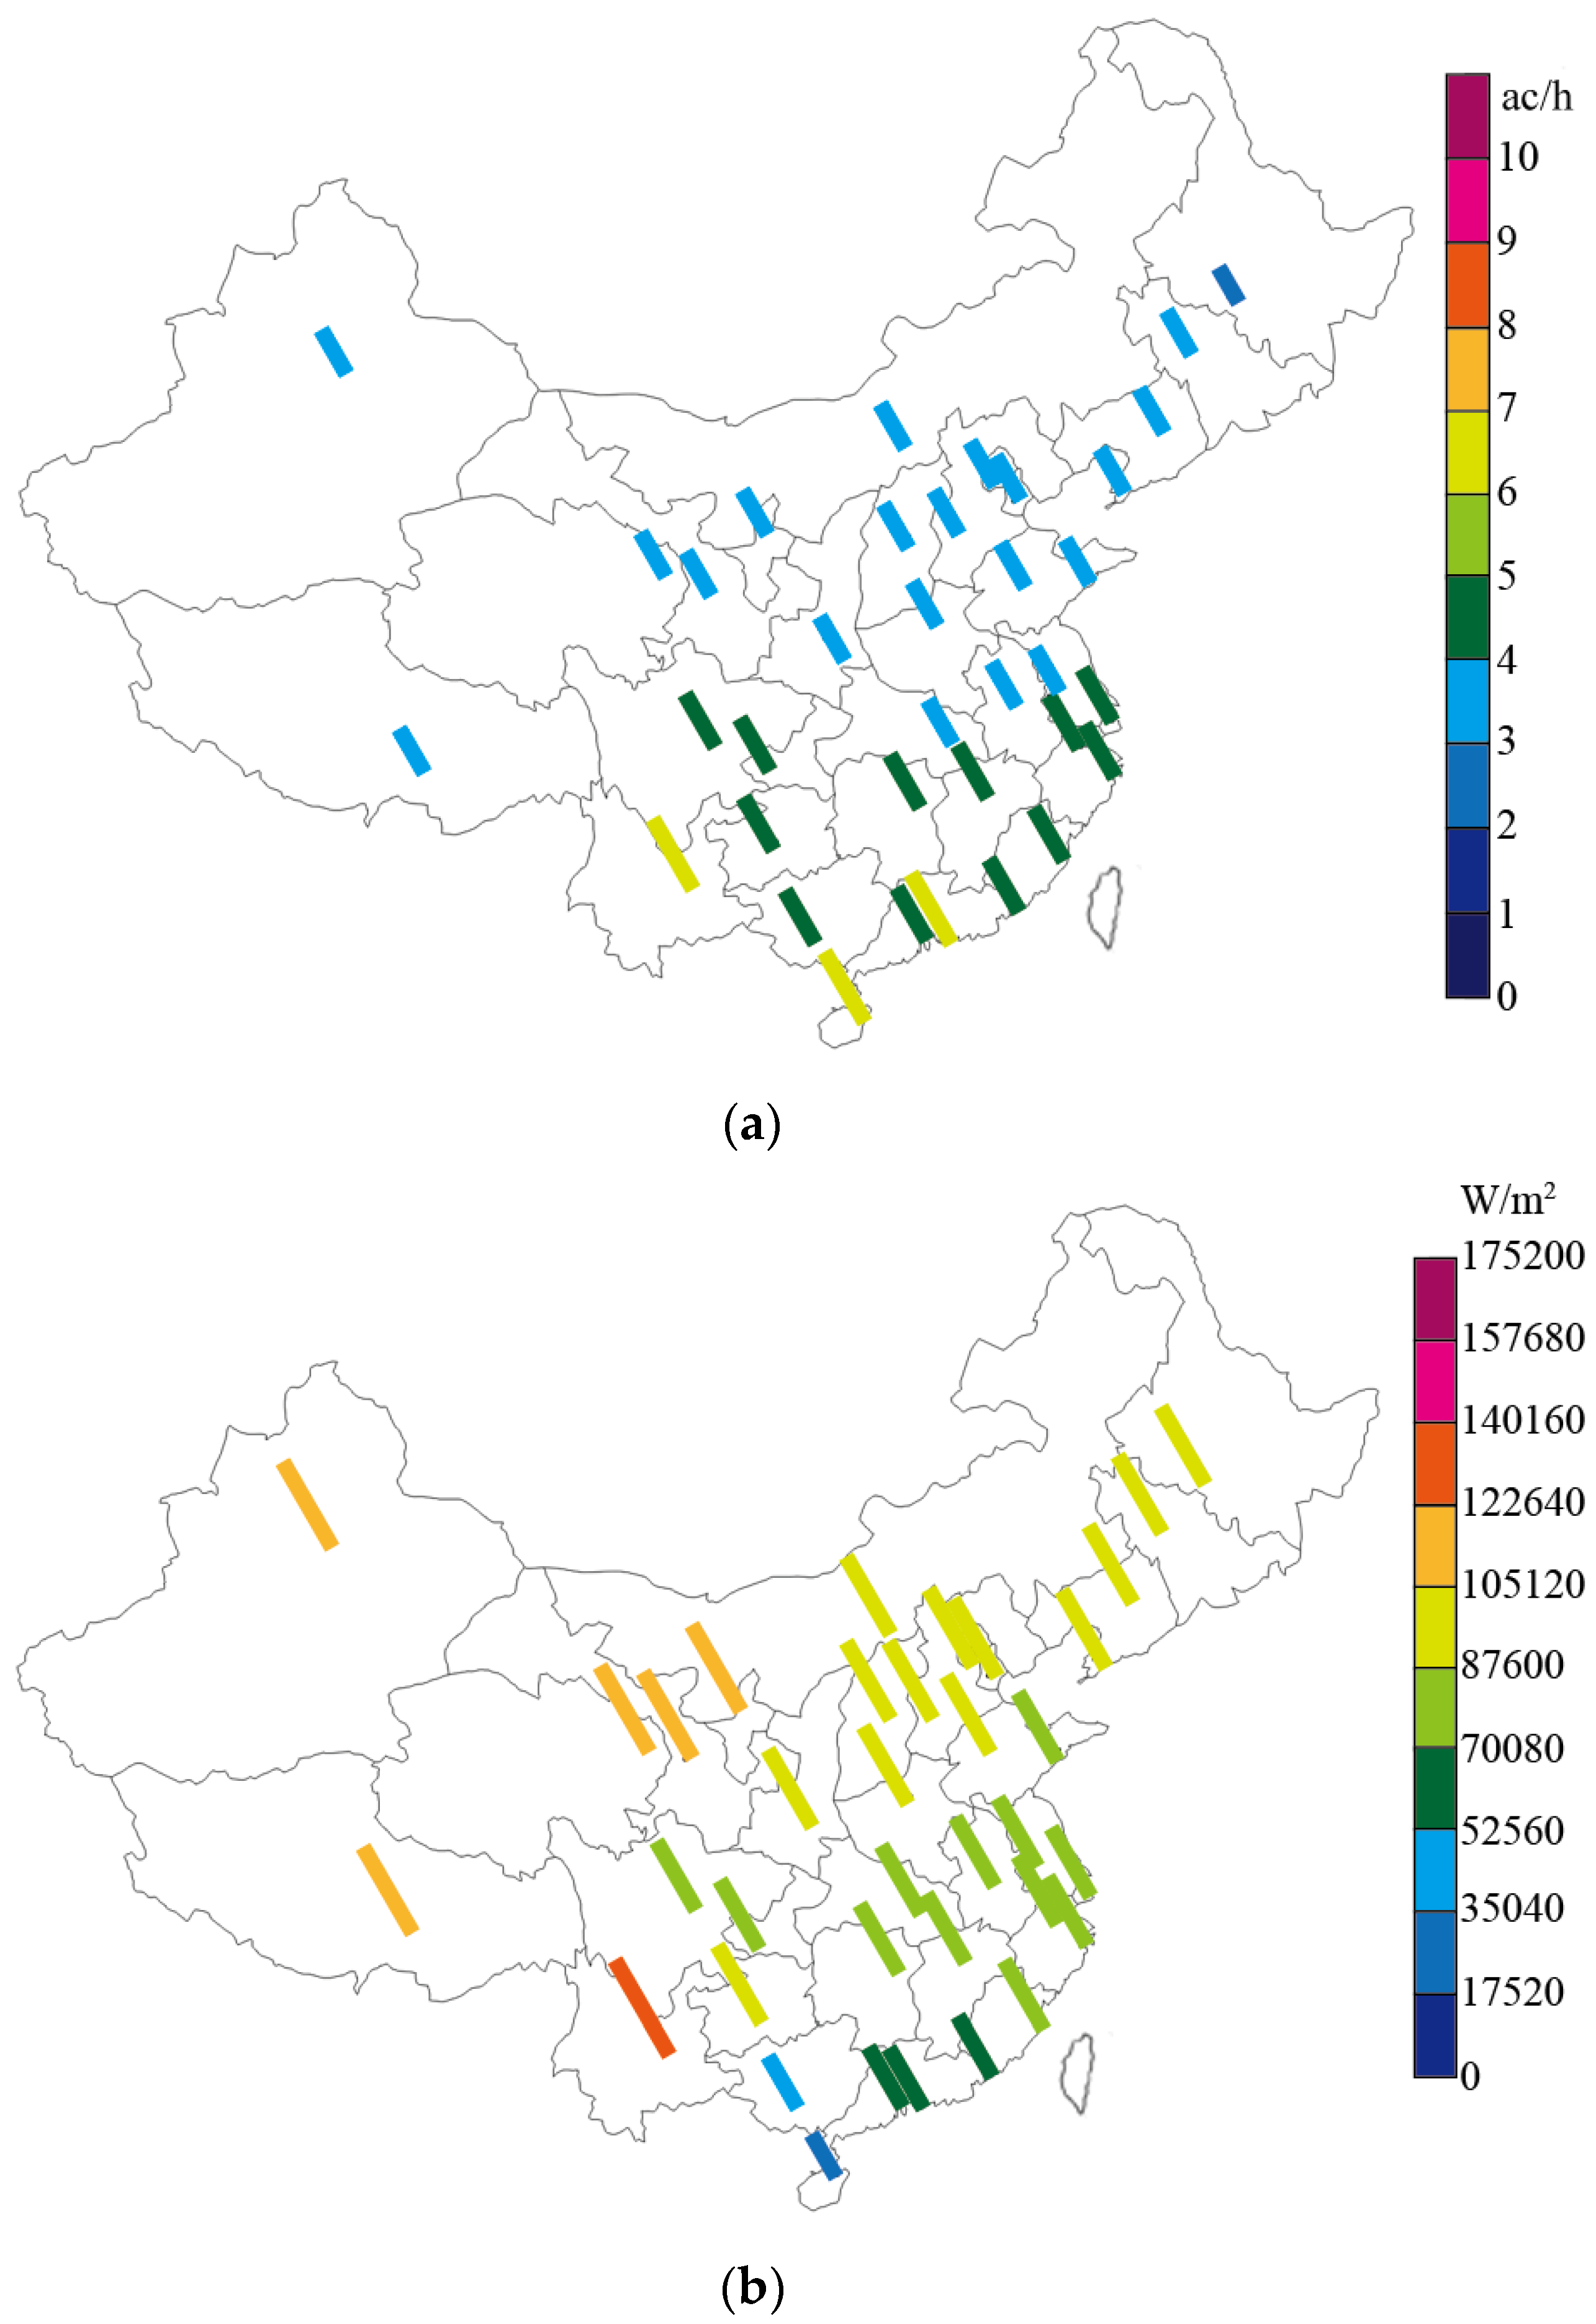
Figure 4 shows the target air change rate and natural ventilation potential maps when the specific internal gains of buildings are at the relatively low level of 20 W/m2. Compared with the maps acquired for the specific internal gains of 10 W/m2, the target air change rates of cities located in the Hot Summer and Warm Winter zone and the Temperate zone vary slightly from 2 ac/h to 3 ac/h. The target air change rates in the other cities are maintained at 2 ac/h, as shown in Figure 4a. All the selected locations still belong to the first category, in which simple natural ventilation strategies are recommended to realize the relatively small amount of air change. In the natural ventilation potential map shown in Figure 4b, the cooling effect potential of natural ventilation tends to slightly increase relative to the cooling effect potential when the specific internal gains are 10 W/m2. The percentage of the available cooling effect potential of natural ventilation divided by the total specific internal gains increased to 13% and 55%. Due to the smaller difference between indoor and outdoor temperatures in Kunming, further increasing the amount of air change based on the required minimum amount of air change (1 ac/h) is an effective approach for offsetting the internal gains. Therefore, Kunming in the Temperate zone exhibits the highest cooling effect potential when the air change rate is large enough. In comparison with the Temperate zone, the lower cooling effect potential of natural ventilation in the Severe Cold and Cold zones likely occurred because the obvious temperature difference allows the required minimum amount of air change to completely compensate for internal gains during a long period. Consequently, increases in the cooling effect are terminated as the air change rate increases. In addition, the cities near the Yangtze River Basin in the Hot Summer and Cold Winter zone (e.g., Chongqing, Wuhan, Changsha, Nanchang) and the cities selected from the Hot Summer and Warm Winter zone display relatively lower cooling effect potential due to the unfavorable hot–humid climate for the utilization of natural ventilation.
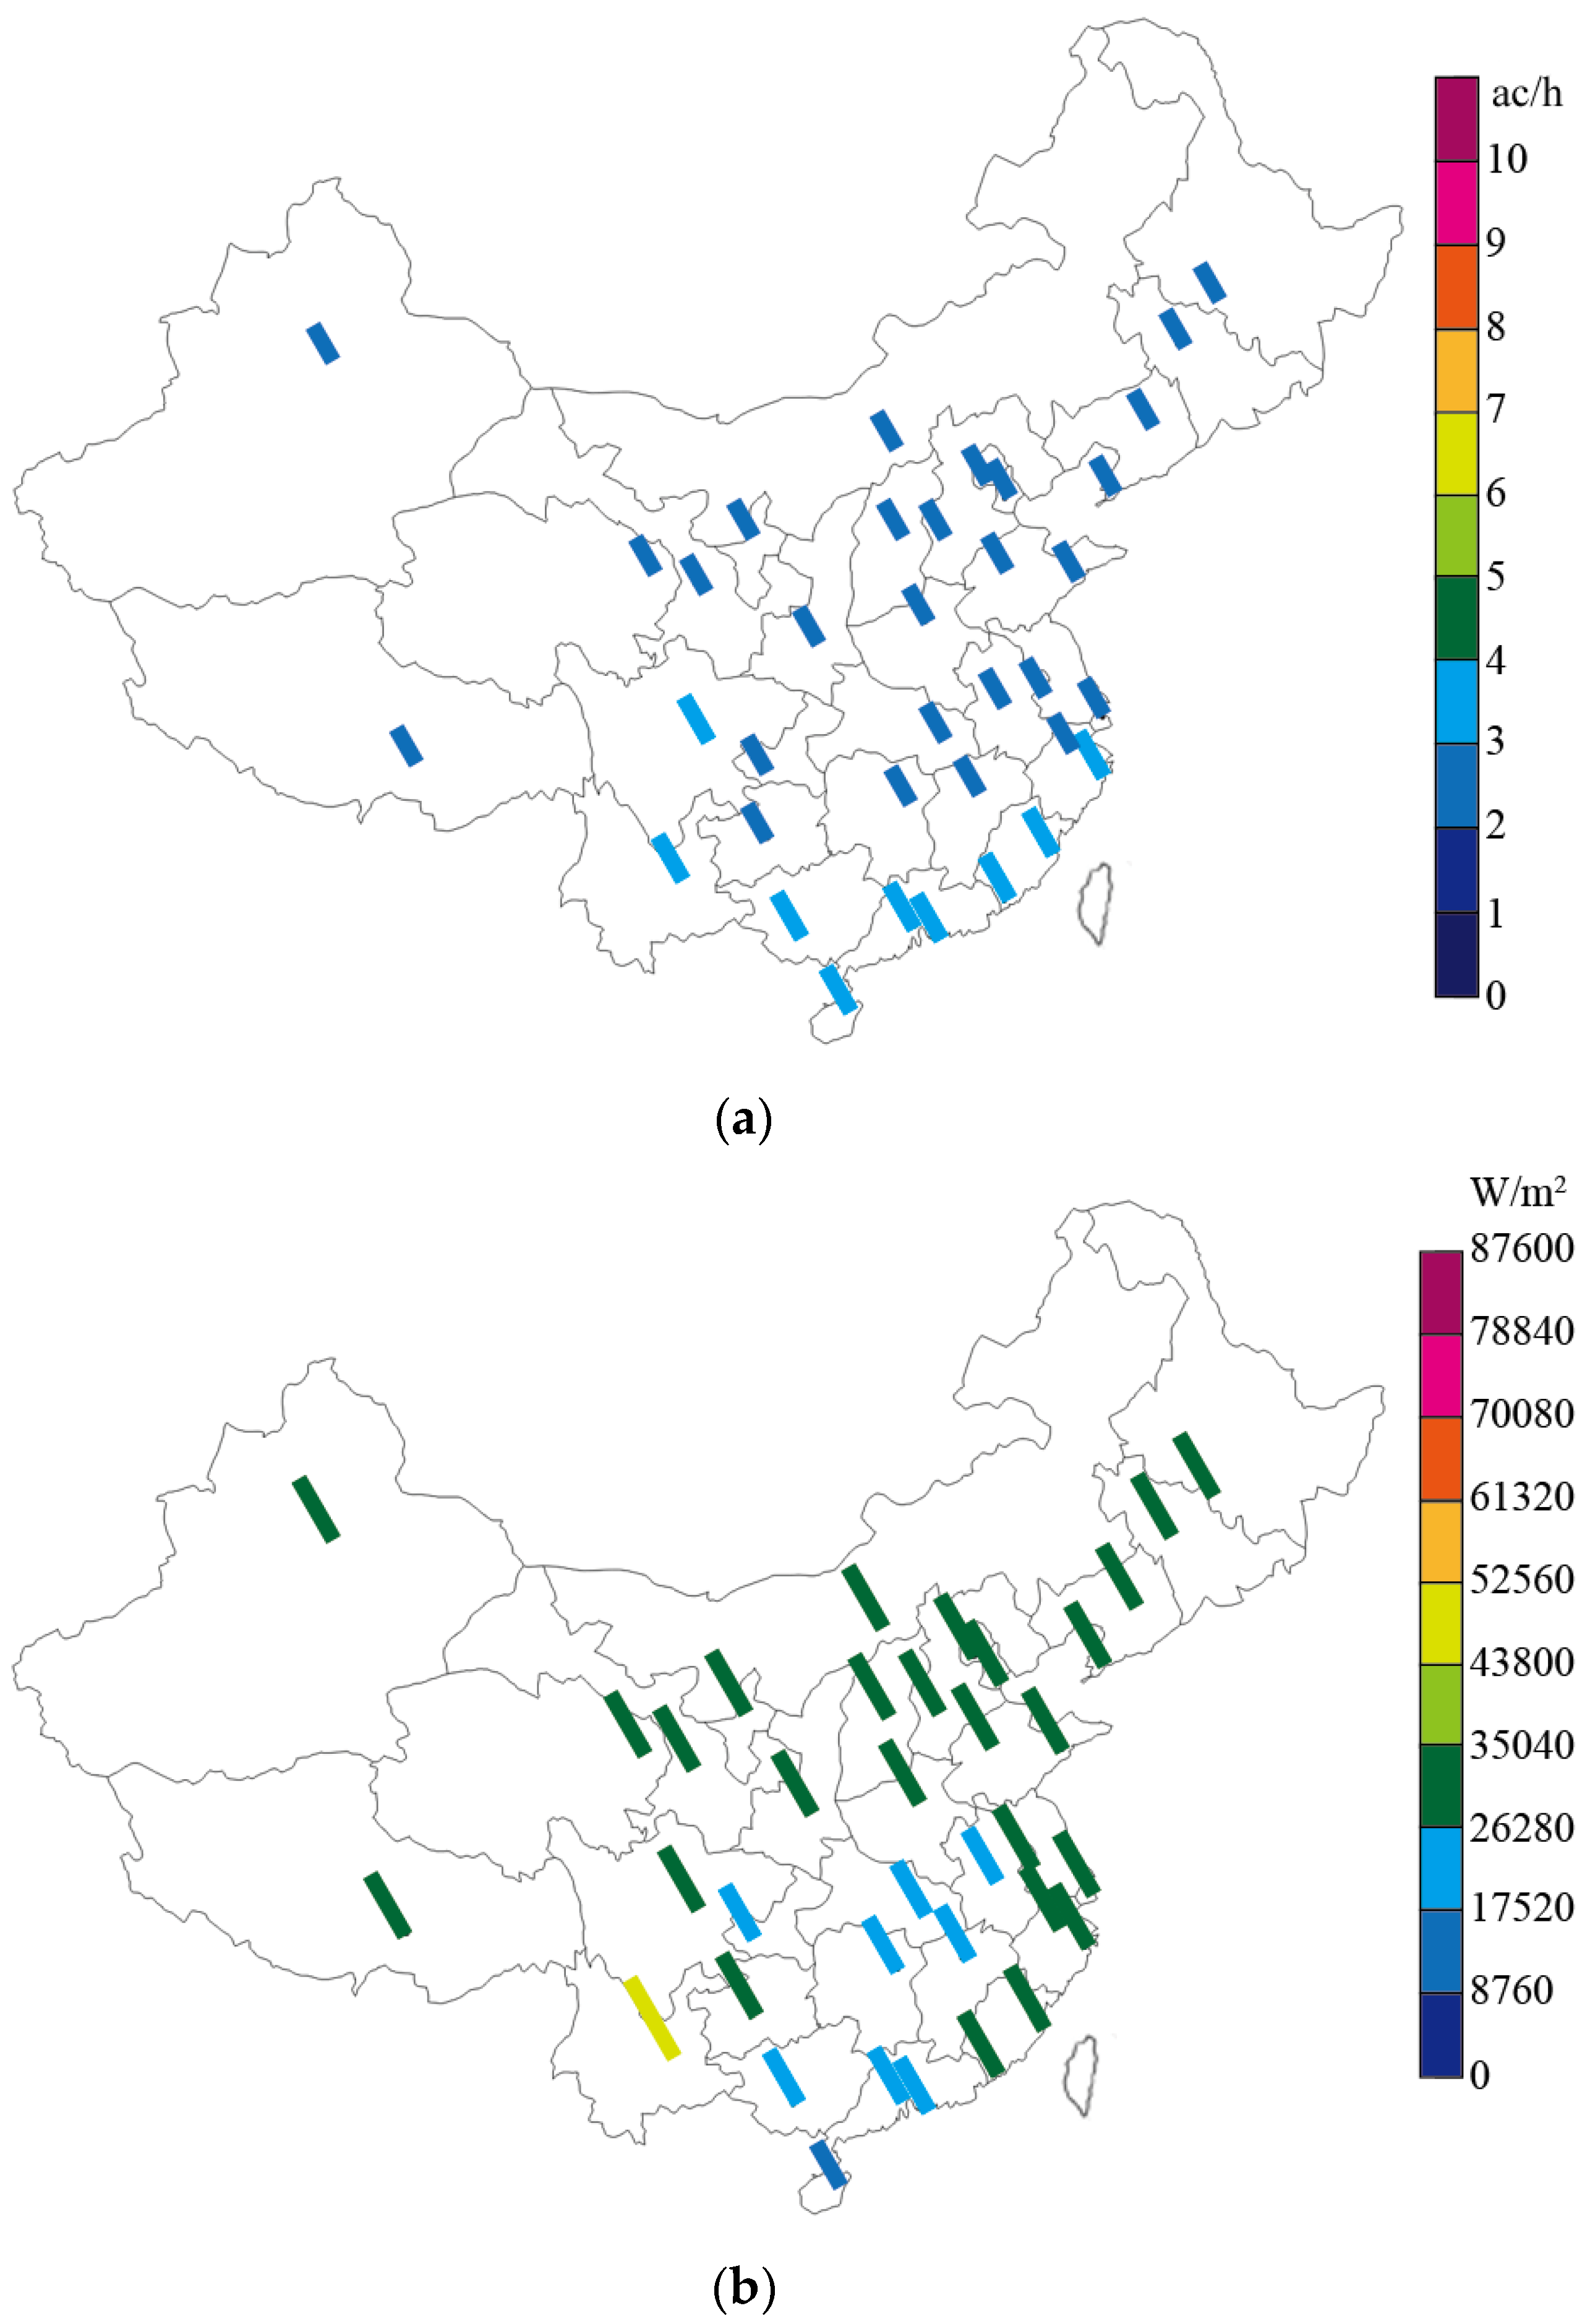
Figure 5 shows the target air change rate and natural ventilation potential maps for naturally ventilated buildings with specific internal gains of 40 W/m2, which is similar to the standard level of internal gains in office buildings in China. According to the target air change rate map in Figure 5a, the categories of natural ventilation strategies are distinguished by the Yangtze River. The cities located south of the Yangtze River are characterized by a hot–humid climate and are classified into category (ii), in which the target air change rate is moderate (4–10 ac/h). This tendency is especially remarkable for the cities in the Hot Summer and Warm Winter zone and the Temperature zone. To realize the required larger target air change rates at these locations, careful considerations and examinations on the natural ventilation strategies are necessary during the initial design stages. The cities located north of the Yangtze River belong to category (i), with a target air change rate of less than 3 ac/h. In the natural ventilation potential map shown in Figure 5b, significant growth in the cooling effect potential of natural ventilation can be observed when the combined specific internal gains are increased to the standard level of 40 W/m2. In the Severe Cold and Cold climate zones, higher potential is observed due to the favorable climate conditions for natural ventilation. This observation is especially true for the locations in the northwest and southwest due to the dry climate throughout the year. On the other hand, the cooling effect potential of Kunming and Haikou should be highlighted, although the strategic design of natural ventilation in these two cities are all classified as category (ii). The cooling effect potential in Kunming reaches 74% of the total annual internal gains. Due to this high potential, it is important to carefully organize the natural ventilation strategies for the projects located in the Temperate zone. Conversely, the cooling effect potential available from natural ventilation only covers 16% of the combined total annual internal gains in Haikou. Thus, it may be difficult to realize a measurable cooling effect through natural ventilation design due to the lower potential under such hot and humid climate conditions. In this case, architects should cautiously determine whether a complex natural ventilation strategy should be used due to the high cost, complex technology, and ineffectiveness of complex natural ventilation strategies for improving the indoor environment and realizing a larger target air change rate.
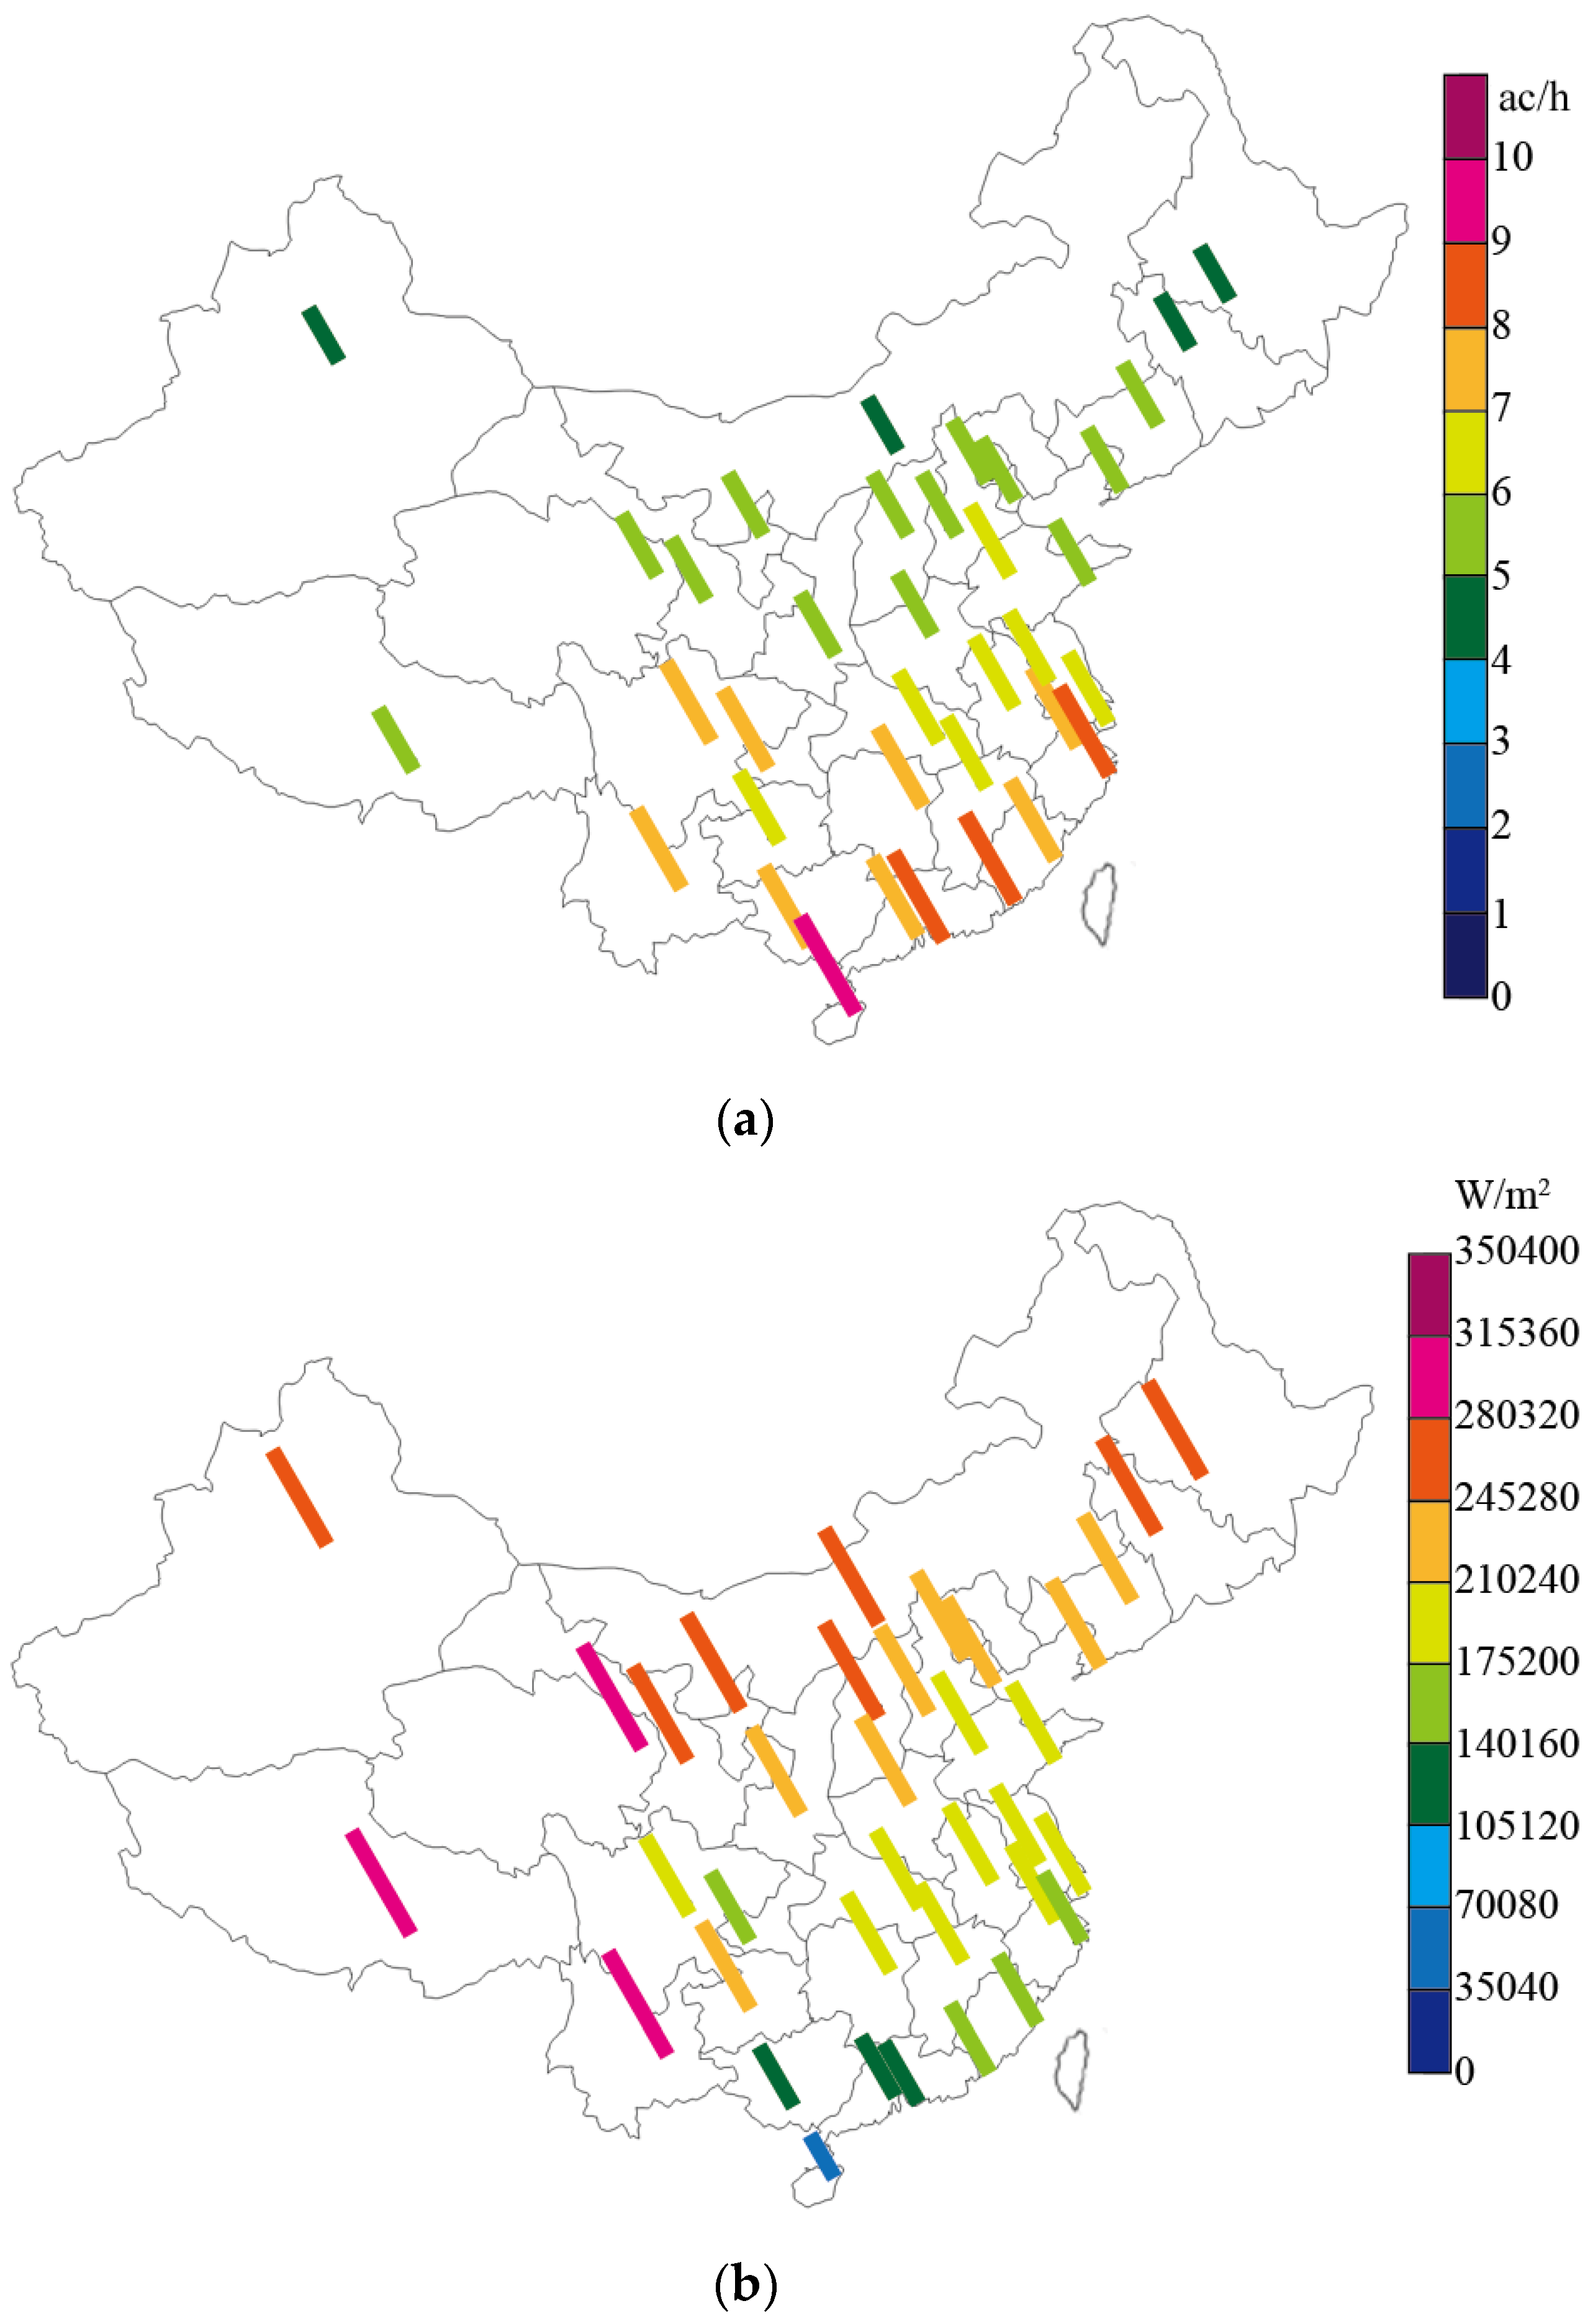
Figure 6 shows the target air change rate and natural ventilation potential maps for naturally ventilated buildings, with internal gains originated from high densities of lighting and plug load and a large number of occupants when the combined specific internal gains are 80 W/m2. The natural ventilation design strategies for all of the selected locations are included into category (ii), which is described in Section 2.3. Particularly, the cities located south of the Qinling Mountain–Huaihe River have a relatively larger target air change rate. The maximum target air change rate of 8–9 ac/h is observed in the Hot Summer and Warm Winter zone. Serious consideration of the natural ventilation strategies is necessary to achieve large target air change rates. Moreover, no areas are categorized into the third category, whose target air change rate exceeds 10 ac/h based on the evaluation results presented in this study. For various climate conditions in China, the measurable cooling effect can be realized using available natural ventilation strategies. Under these conditions, the desired target air change rate is relatively larger, which is possible to achieve through the available natural ventilation strategies [6], even under a high internal gains condition. Figure 6b shows a map marked with the cooling effect potential from natural ventilation when the combined internal gains are 80 W/m2. The cooling effect potential in the Severe Cold and Cold zones distinctively increase in comparison with the results obtained at the general internal gains level of 40 W/m2. It is demonstrated that the additional amount of air change is still required to compensate for higher internal gains, even in the cold climate conditions, where the difference between the indoor and outdoor temperatures is large. According to the target air change rate and natural ventilation potential maps, an elaborate natural ventilation design is particularly recommended for the buildings located in the Cold climate zone when the internal gains of the buildings are increased to a high level.
5. Conclusions
To facilitate the strategic design of natural ventilation in the early design stages, a preliminary design method using the target air change rate and natural ventilation potential was proposed in a previous study. The authors defined the target air change rate as the maximum point of the increasing gradient of the cooling effect from natural ventilation. To adopt the target air change rate during the early design stages, the climate conditions and indoor usage conditions are used to determine the proposed design target of natural ventilation. In addition, the suitability of the climate conditions is only dependent on two reasonable parameters—outdoor dry-bulb temperature and dew point temperature—without considering any other complex parameters which are significantly difficult to be determined in the early design stages. The ultimate purpose of our study is to verify the viability of the proposed design method and to create world maps of the target air change rate and natural ventilation potential. In this paper, a more convincing sensitivity investigation is performed to further verify the robustness of the target air change rate as a design criterion in the early stages using a typical Chinese office building model with representative operation conditions in five climate zones of China. No distinctive variations in the target air change rate (at level of ±1 ac/h) are observed as the thermal capacity, insulation level, and WWR varied in the same city. In addition, some specific findings based on the created target air change rate and natural ventilation potential maps in China are summarized as follows:
(1) Simple natural ventilation strategies (category (i)), that is, single-sided natural ventilation, are recommended for buildings with relatively low internal gains (such as 10 W/m2 and 20 W/m2) to realize the required small target air change rate (≤3 ac/h), regardless of the climate conditions. These simple options can simultaneously satisfy the requirements of high energy performance and the cost-effectiveness.
(2) For buildings with moderate internal gains of 40 W/m2, the categories of design strategies for natural ventilation are distinguished by the Yangtze River. Well-organized and well-examined natural ventilation strategies (category (ii)) are suggested for cities located south of the Yangtze River. This result is especially obvious for locations in the Hot Summer and Warm Winter zone and the Temperate zone. However, in comparison with the hot–humid climate in the Hot Summer and Warm Winter zone, careful consideration of the natural ventilation design is strongly recommended for the cities located in the Temperate zone with a warm climate due to the higher cooling effect potential.
(3) Careful natural ventilation design (category (ii)) in the early design stages is required in all the selected cities to achieve a moderate and realizable target air change rate of 4–10 ac/h when the internal gains are increased to the relatively high level of 80 W/m2. In addition, the increase in cooling effect potential of natural ventilation in the Severe Cold and Cold zones is very obvious. Therefore, it is more effective to elaborately organize the natural ventilation strategies for buildings in cold climates when the internal gains are increased.
(4) According to the results of this study, no location is classified as category (iii), which corresponds to a target air change rate of more than 10 ac/h. A measurable cooling effect can be realized by using the available natural ventilation strategies under various climate conditions in China, even with high internal gains.
Author Contributions
design of the research: K.H.; simulation and data analysis: L.W.W. and K.H.; final manuscript preparation: L.W.W.; All authors have read and approved the final manuscript.
Acknowledgments
This work was supported by JSPS KAKENHI Grant Number 25709051 and the starting-up grant of Guangzhou University No. 69-18ZX1017501.
Conflicts of Interest
The authors declare no conflict of interest.
References
- Ji, Y.; Lomas, K.J.; Cook, M.J. Hybrid ventilation for low energy building design in south China. Build. Environ. 2009, 44, 2245–2255. [Google Scholar] [CrossRef] [Green Version]
- Oropeza-Perez, I.; Østergaard, P.A. Energy saving potential of utilizing natural ventilation under warm conditions—A case study of Mexico. Appl. Energy 2014, 130, 20–32. [Google Scholar] [CrossRef]
- Taleb, H.M. Natural ventilation as energy efficient solution for achieving low-energy houses in Dubai. Energy Build. 2015, 99, 284–291. [Google Scholar] [CrossRef]
- Zhou, C.; Wang, Z.; Chen, Q.; Jiang, Y.; Pei, J. Design optimization and field demonstration of natural ventilation for high-rise residential buildings. Energy Build. 2014, 82, 457–465. [Google Scholar] [CrossRef]
- Chen, X.; Yang, H.; Sun, K. A holistic passive design approach to optimize indoor environmental quality of a typical residential building in Hong Kong. Energy 2016, 113, 267–281. [Google Scholar] [CrossRef]
- Axley, J.W. Application of Natural Ventilation for U. S. Commercial Buildings; Climate Suitability, Design Strategies, & Methods Modeling Studies; Prepared for U.S. Department of Energy Office of Building Systems, National Institute of Standards and Technology: Gaithersburg, MD, USA, 2001; pp. 1–161.
- Etheridge, D. A perspective on fifty years of natural ventilation research. Build. Environ. 2014, 91, 51–60. [Google Scholar] [CrossRef]
- Wen, L.W.; Hiyama, K.; Koganei, M. A method for creating maps of recommended window-to-wall ratios to assign appropriate default values in design performance modeling: A case study of a typical office building in Japan. Energy Build. 2017, 145, 304–317. [Google Scholar] [CrossRef]
- Hiyama, K.; Wen, L. Rapid response surface creation method to optimize window geometry using dynamic daylighting simulation and energy simulation. Energy Build. 2015, 107, 417–423. [Google Scholar] [CrossRef]
- Holford, J.M.; Hunt, G.R. Fundamental atrium design for natural ventilation. Build. Environ. 2003, 38, 409–426. [Google Scholar] [CrossRef]
- Khan, N.; Su, Y.; Riffat, S.B. A review on wind driven ventilation techniques. Energy Build. 2008, 40, 1586–1604. [Google Scholar] [CrossRef]
- Oh, W.; Kato, S. Study on The effects of evaporation and condensation on the underfloor space of Japanese detached houses using CFD analysis. Energies 2017, 10, 798. [Google Scholar] [CrossRef]
- Benni, S.; Tassinari, P.; Bonora, F.; Barbaresi, A.; Torreggiani, D. Efficacy of greenhouse natural ventilation: Environmental monitoring and CFD simulations of a study case. Energy Build. 2016, 125, 276–286. [Google Scholar] [CrossRef]
- Østergård, T.; Jensen, R.L.; Maagaard, S.E. Building simulations supporting decision making in early design—A review. Renew. Sustain. Energy Rev. 2016, 61, 187–201. [Google Scholar] [CrossRef]
- Tejero-González, A.; Andrés-Chicote, M.; García-Ibáñez, P.; Velasco-Gómez, E.; Rey-Martínez, F.J. Assessing the applicability of passive cooling and heating techniques through climate factors: An overview. Renew. Sustain. Energy Rev. 2016, 65, 727–742. [Google Scholar] [CrossRef]
- Ghiaus, C.; Allard, F. Potential for free-cooling by ventilation. Sol. Energy 2006, 80, 402–413. [Google Scholar] [CrossRef]
- Artmann, N.; Manz, H.; Heiselberg, P. Climatic potential for passive cooling of buildings by night-time ventilation in Europe. Appl. Energy 2007, 84, 187–201. [Google Scholar] [CrossRef]
- Tong, Z.; Chen, Y.; Malkawi, A.; Liu, Z.; Freeman, R.B. Energy saving potential of natural ventilation in China: The impact of ambient air pollution. Appl. Energy 2016, 179, 660–668. [Google Scholar] [CrossRef]
- Salcido, J.C.; Raheem, A.A.; Issa, R.R.A. From simulation to monitoring: Evaluating the potential of mixed-mode ventilation (MMV) systems for integrating natural ventilation in office buildings through a comprehensive literature review. Energy Build. 2016, 127, 1008–1018. [Google Scholar] [CrossRef]
- Hiyama, K.; Glicksman, L. Preliminary design method for naturally ventilated buildings using target air change rate and natural ventilation potential maps in the United States. Energy 2015, 89, 655–666. [Google Scholar] [CrossRef]
- Zhang, Y.; He, C.-Q.; Tang, B.-J.; Wei, Y.-M. China’s energy consumption in the building sector: A life cycle approach. Energy Build. 2015, 94, 240–251. [Google Scholar] [CrossRef]
- De Dear, R.J.; Brager, G.S. Thermal comfort in naturally ventilated buildings: Revisions to ASHRAE Standard 55. Energy Build. 2002, 34, 549–561. [Google Scholar] [CrossRef]
- American Society of Heating, Refrigerating and Air-Conditioning Engineers (ASHRAE). ASHRAE Handbook—Fundamentals; ASHRAE: Atlanta, GA, USA, 2009. [Google Scholar]
- Nomura, M.; Hiyama, K. A review: Natural ventilation performance of office buildings in Japan. Renew. Sustain. Energy Rev. 2017, 74, 746–754. [Google Scholar] [CrossRef]
- People’s Education Press. Eighth Grade Geography; People’s Education Press: Beijing, China, 2015. (In Chinese) [Google Scholar]
- Ministry of Housing and Urban-Rural Development. GB50189—2015, Design Standard for Energy Efficiency of Public Building; Ministry of Housing and Urban-Rural Development: Beijing, China, 2015. (In Chinese)
- China Meteorological Bureau, Climate Information Center, Climate Data Office and Tsinghua University, Department of Building Science and Technology. China Standard Weather Data for Analyzing Building Thermal Conditions; China Building Industry Publishing House: Beijing, China, 2005. [Google Scholar]
- Crawley, D.B.; Lawrie, L.K.; Winkelmann, F.C.; Buhl, W.F.; Huang, Y.J.; Pedersen, C.O.; Strand, R.K.; Liesen, R.J.; Fisher, D.E.; Witte, M.J.; et al. EnergyPlus: Creating a new-generation building energy simulation program. Energy Build. 2001, 33, 319–331. [Google Scholar] [CrossRef]
- Feng, W.; Huang, K.; Levine, M.; Zhou, N.; Berkeley, L. Evaluation of Energy Savings of the New Chinese Commercial Building Energy Standard. In Proceedings of the 2014 Summer Study Energy Efficiency in Buildings, Pacific Grove, CA, USA, 17–22 August 2014; pp. 121–132. [Google Scholar]
- Emmerich, S.J.; Polidoro, B.; Axley, J.W. Impact of adaptive thermal comfort on climatic suitability of natural ventilation in office buildings. Energy Build. 2011, 43, 2101–2107. [Google Scholar] [CrossRef]
- Yao, R.; Li, B.; Steemers, K.; Short, A. Assessing the natural ventilation cooling potential of office buildings in different climate zones in China. Renew. Energy 2009, 34, 2697–2705. [Google Scholar] [CrossRef]
Figure 1.
Geographic and climate divisions in China. (a) Geographical regions in China; (b) Climate zones in China.
Figure 1.
Geographic and climate divisions in China. (a) Geographical regions in China; (b) Climate zones in China.

Figure 2.
Typical office building model used in this study.

Figure 3.
Maps of cities in China where buildings have specific internal gains of 10 W/m2. (a) Target air change rates of the 36 selected cities. (b) Natural ventilation potential of the 36 selected cities (the highest value in the label represents the annual sum of the internal gains).
Figure 3.
Maps of cities in China where buildings have specific internal gains of 10 W/m2. (a) Target air change rates of the 36 selected cities. (b) Natural ventilation potential of the 36 selected cities (the highest value in the label represents the annual sum of the internal gains).

Figure 4.
Maps of cities in China where buildings have specific internal gains of 20 W/m2. (a) Target air change rates of the 36 selected cities. (b) Natural ventilation potentials of the 36 selected cities (the highest values in the label represents the annual sum of the internal gains).
Figure 4.
Maps of cities in China where buildings have specific internal gains of 20 W/m2. (a) Target air change rates of the 36 selected cities. (b) Natural ventilation potentials of the 36 selected cities (the highest values in the label represents the annual sum of the internal gains).

Figure 5.
Maps of cities in China where buildings have specific internal gains of 40 W/m2. (a) Target air change rates of the 36 selected cities. (b) Natural ventilation potentials of the 36 selected cities (the highest value in the label represents the annual sum of the internal gains).
Figure 5.
Maps of cities in China where buildings have specific internal gains of 40 W/m2. (a) Target air change rates of the 36 selected cities. (b) Natural ventilation potentials of the 36 selected cities (the highest value in the label represents the annual sum of the internal gains).

Figure 6.
Maps of cities in China where buildings have specific internal gains of 80 W/m2. (a) Target air change rates of the 36 selected cities. (b) Natural ventilation potentials of the 36 selected cities (the highest value in the label represents the annual sum of the internal gains).
Figure 6.
Maps of cities in China where buildings have specific internal gains of 80 W/m2. (a) Target air change rates of the 36 selected cities. (b) Natural ventilation potentials of the 36 selected cities (the highest value in the label represents the annual sum of the internal gains).


Table 1.
Design strategies of natural ventilation according to the level of target air change rate.
| Target Air Change Rate | Design Strategies of Natural Ventilation |
|---|---|
| ≤3 ac/h | Simple natural ventilation strategies |
| ≤10 ac/h | Well-examined natural ventilation strategies |
| >10 ac/h | Mixed-mode ventilation |
Table 2.
Climate characteristics and the required U values of envelopes in five representative cities.
Table 2.
Climate characteristics and the required U values of envelopes in five representative cities.
| City | Climate Zone | Latitude | Climate Characteristics | Upper Limit of U Value (W/m2 K) | ||
|---|---|---|---|---|---|---|
| ATCM | ATHM | External Wall | Roof | |||
| Harbin | Severe Cold | 45.75 | −18.7 | 22.8 | 0.38 | 0.28 |
| Beijing | Cold | 39.93 | −3.8 | 26.4 | 0.5 | 0.45 |
| Shanghai | Hot Summer Cold Winter | 31.40 | 4.5 | 27.5 | 0.6 | 0.4 |
| Guangzhou | Hot Summer Warm Winter | 23.22 | 13.9 | 28.8 | 0.8 | 0.5 |
| Kunming | Temperate | 25.02 | 8.4 | 20 | - | - |
Note: ATCM = average temperature in the coldest month, and ATHM = average temperature in the hottest month. The U value of the climate zone of Kunming is not required.
Table 3.
Simulation conditions.
| Building geometry | Floor area: 1500 m2 (30 m × 50 m); Floor height: 3.5 m; Ceiling height: 2.5 m |
| Occupant | Density: 0.1 person/m2 |
| 0%-7:00-10%-8:00-50%-9:00-95%-12:00-80%-14:00-95%-18:00-30%-20:00 | |
| Plug load | Density: 15 W/m2 |
| 0%-7:00-10%-8:00-50%-9:00-95%-12:00-50%-14:00-95%-18:00-30%-20:00 | |
| Lighting | Density: 2.25 W/m2 100 lx; Target illuminance: 400 lx |
| 0%-7:00-10%-8:00-50%-9:00-95%-12:00-80%-14:00-95%-18:00-30%-20:00 | |
| Natural Ventilation | Tindoor > 22 °C and Toutdoor < Tindoor; Occupied period: 7:00–19:00 |
| Cooling | Set-point temperature: 26 °C; Schedule: OFF-7:00-ON-19:00-OFF |
| Window shading | Blind with high reflectivity slats (inside); solar set point: 120 W/m2 |
Table 4.
U value of the external wall in each selected city (W/m2 K).
| Severe Cold (Harbin) | Cold (Beijing) | Hot Summer, Cold Winter (Shanghai) | Hot Summer, Warm Winter (Guangzhou) | Temperate (Kunming) | |
|---|---|---|---|---|---|
| High insulation | 0.27 | 0.37 | 0.47 | 0.55 | 0.55 |
| Low insulation | 0.37 | 0.47 | 0.58 | 0.70 | 0.70 |
Note: glazing used for high insulation is double low E glazing (U value = 1.8 W/m2 K, SHGC value = 0.6); glazing used for low insulation is double glazing (U value = 2.7 W/m2 K, SHGC value= 0.7).
Table 5.
Target air change rates under the typical internal gains condition of 36 W/m2.
| Structure | Insulation Level | Window-to-Wall Ratio | Target Air Change Rate (ac/h) | ||||
|---|---|---|---|---|---|---|---|
| Harbin | Beijing | Shanghai | Guangzhou | Kunming | |||
| Heavyweight | High | 20% | 2 | 3 | 2 | 2 | 3 |
| 40% | 3 | 3 | 2 | 3 | 3 | ||
| 60% | 3 | 3 | 2 | 3 | 4 | ||
| Low | 20% | 2 | 3 | 2 | 2 | 3 | |
| 40% | 2 | 3 | 2 | 3 | 3 | ||
| 60% | 3 | 3 | 3 | 3 | 4 | ||
| Lightweight | High | 20% | 2 | 3 | 2 | 3 | 3 |
| 40% | 3 | 3 | 2 | 3 | 3 | ||
| 60% | 3 | 3 | 2 | 3 | 4 | ||
| Low | 20% | 2 | 3 | 2 | 2 | 3 | |
| 40% | 3 | 3 | 2 | 3 | 4 | ||
| 60% | 3 | 3 | 3 | 3 | 4 | ||
| Adiabatic | 0 | 2 | 2 | 2 | 3 | 4 | |
Table 6.
Target air change rates under the high level internal gains condition of 72 W/m2.
| Structure | Insulation Level | Window-to-Wall Ratio | Target Air Change Rate (ac/h) | ||||
|---|---|---|---|---|---|---|---|
| Harbin | Beijing | Shanghai | Guangzhou | Kunming | |||
| Heavyweight | High | 20% | 3 | 3 | 3 | 4 | 6 |
| 40% | 3 | 3 | 3 | 4 | 7 | ||
| 60% | 3 | 2 | 3 | 4 | 6 | ||
| Low | 20% | 3 | 3 | 3 | 4 | 6 | |
| 40% | 3 | 3 | 3 | 4 | 7 | ||
| 60% | 3 | 3 | 3 | 4 | 6 | ||
| Lightweight | High | 20% | 3 | 3 | 3 | 4 | 6 |
| 40% | 3 | 3 | 3 | 4 | 7 | ||
| 60% | 3 | 3 | 3 | 4 | 6 | ||
| Low | 20% | 3 | 3 | 3 | 4 | 6 | |
| 40% | 3 | 3 | 3 | 4 | 7 | ||
| 60% | 3 | 3 | 3 | 4 | 7 | ||
| Adiabatic | 0 | 2 | 3 | 3 | 5 | 7 | |
Table 7.
The 36 cities selected for the creation of maps.
| No. | City | Longitude | Latitude | No. | City | Longitude | Latitude |
|---|---|---|---|---|---|---|---|
| 1 | Beijing | 116.47 | 39.80 | 19 | Nanchang | 115.92 | 28.60 |
| 2 | Changchun | 125.22 | 43.90 | 20 | Nanjing | 118.80 | 32.83 |
| 3 | Changsha | 112.92 | 28.22 | 21 | Nanning | 108.22 | 22.63 |
| 4 | Chengdu | 104.02 | 30.67 | 22 | Ningbo | 120.65 | 28.03 |
| 5 | Chongqing | 106.47 | 29.58 | 23 | Qingdao | 119.18 | 36.75 |
| 6 | Dalian | 121.63 | 38.90 | 24 | Shanghai | 121.45 | 31.40 |
| 7 | Fuzhou | 119.28 | 26.08 | 25 | Shenyang | 123.45 | 41.73 |
| 8 | Guangzhou | 113.33 | 23.17 | 26 | Shenzhen | 114.10 | 22.55 |
| 9 | Guiyang | 106.73 | 26.58 | 27 | Shijiazhuang | 114.42 | 38.03 |
| 10 | Haikou | 110.35 | 20.03 | 28 | Taiyuan | 112.55 | 37.78 |
| 11 | Hangzhou | 120.17 | 30.23 | 29 | Tianjin | 117.07 | 39.08 |
| 12 | Harbin | 126.77 | 45.75 | 30 | Urumqi | 87.530 | 43.83 |
| 13 | Hefei | 117.23 | 31.87 | 31 | Wuhan | 114.13 | 30.62 |
| 14 | Hohhot | 111.68 | 40.82 | 32 | Xiamen | 118.07 | 24.48 |
| 15 | Jinan | 117.05 | 36.60 | 33 | Xian | 108.93 | 34.30 |
| 16 | Kunming | 102.68 | 25.02 | 34 | Xining | 101.75 | 36.72 |
| 17 | Lanzhou | 103.88 | 36.05 | 35 | Yinchuan | 106.22 | 38.48 |
| 18 | Lhasa | 91.130 | 29.67 | 36 | Zhengzhou | 113.65 | 34.72 |
Table 8.
Parameters for evaluating the target air change rate and natural ventilation potential.
| ρ | 1.205 kg/m3 |
| Cp | 1006 J/kg K |
| Ceiling height | 2.5 m |
| Occupied hours | 7:00–19:00 |
| Air change rate | 1–10 ac/h |
© 2018 by the authors. Licensee MDPI, Basel, Switzerland. This article is an open access article distributed under the terms and conditions of the Creative Commons Attribution (CC BY) license (http://creativecommons.org/licenses/by/4.0/).
Share and Cite
MDPI and ACS Style
Wen, L.; Hiyama, K. Target Air Change Rate and Natural Ventilation Potential Maps for Assisting with Natural Ventilation Design During Early Design Stage in China. Sustainability 2018, 10, 1448. https://doi.org/10.3390/su10051448
AMA Style
Wen L, Hiyama K. Target Air Change Rate and Natural Ventilation Potential Maps for Assisting with Natural Ventilation Design During Early Design Stage in China. Sustainability. 2018; 10(5):1448. https://doi.org/10.3390/su10051448
Chicago/Turabian StyleWen, Liwei, and Kyosuke Hiyama. 2018. "Target Air Change Rate and Natural Ventilation Potential Maps for Assisting with Natural Ventilation Design During Early Design Stage in China" Sustainability 10, no. 5: 1448. https://doi.org/10.3390/su10051448
Note that from the first issue of 2016, this journal uses article numbers instead of page numbers. See further details here.