Article

Change of Real and Simulated Energy Production of Certain Photovoltaic Technologies in Relation to Orientation, Tilt Angle and Dual-Axis Sun-Tracking. A Case Study in Hungary

Department of Economic Methodology, University of Pannonia, Georgikon Faculty, 8360 Keszthely, Hungary
*
Author to whom correspondence should be addressed.
Sustainability 2018, 10(5), 1394; https://doi.org/10.3390/su10051394
Submission received: 6 March 2018 / Revised: 27 March 2018 / Accepted: 9 April 2018 / Published: 2 May 2018
(This article belongs to the Section Energy Sustainability)

Abstract

:
The aim of the study is to compare the tilt angle-orientation and dual-axis tracking characteristics of mono- (m-Si), polycrystalline (p-Si), and amorphous silicon (a-Si) modules in the summer of 2017, under real meteorological conditions with simulated data. The most important new element of our study is that, besides a comparison of the three most significant photovoltaic types, the technologies are differentiated by examining specific energy generation using dual-axis tracking and four different orientations at 5-degree intervals compared to simulated values, near to the summer solstice. For these types of measurements, as far as we are aware, there is no previous reliable, well-supported, comparative data. The simulated data show less accurate results, proving the importance of real data. Based on simulated data, the tilt angle and orientation showed about 10% favorable values compared to reality. Knowing our results can make it easier to plan investment, and estimate the investment and operational costs and their return on crystalline and amorphous silicon solar modules, for both sun-tracking and fixed systems with various orientations and tilt angles.

1. Introduction

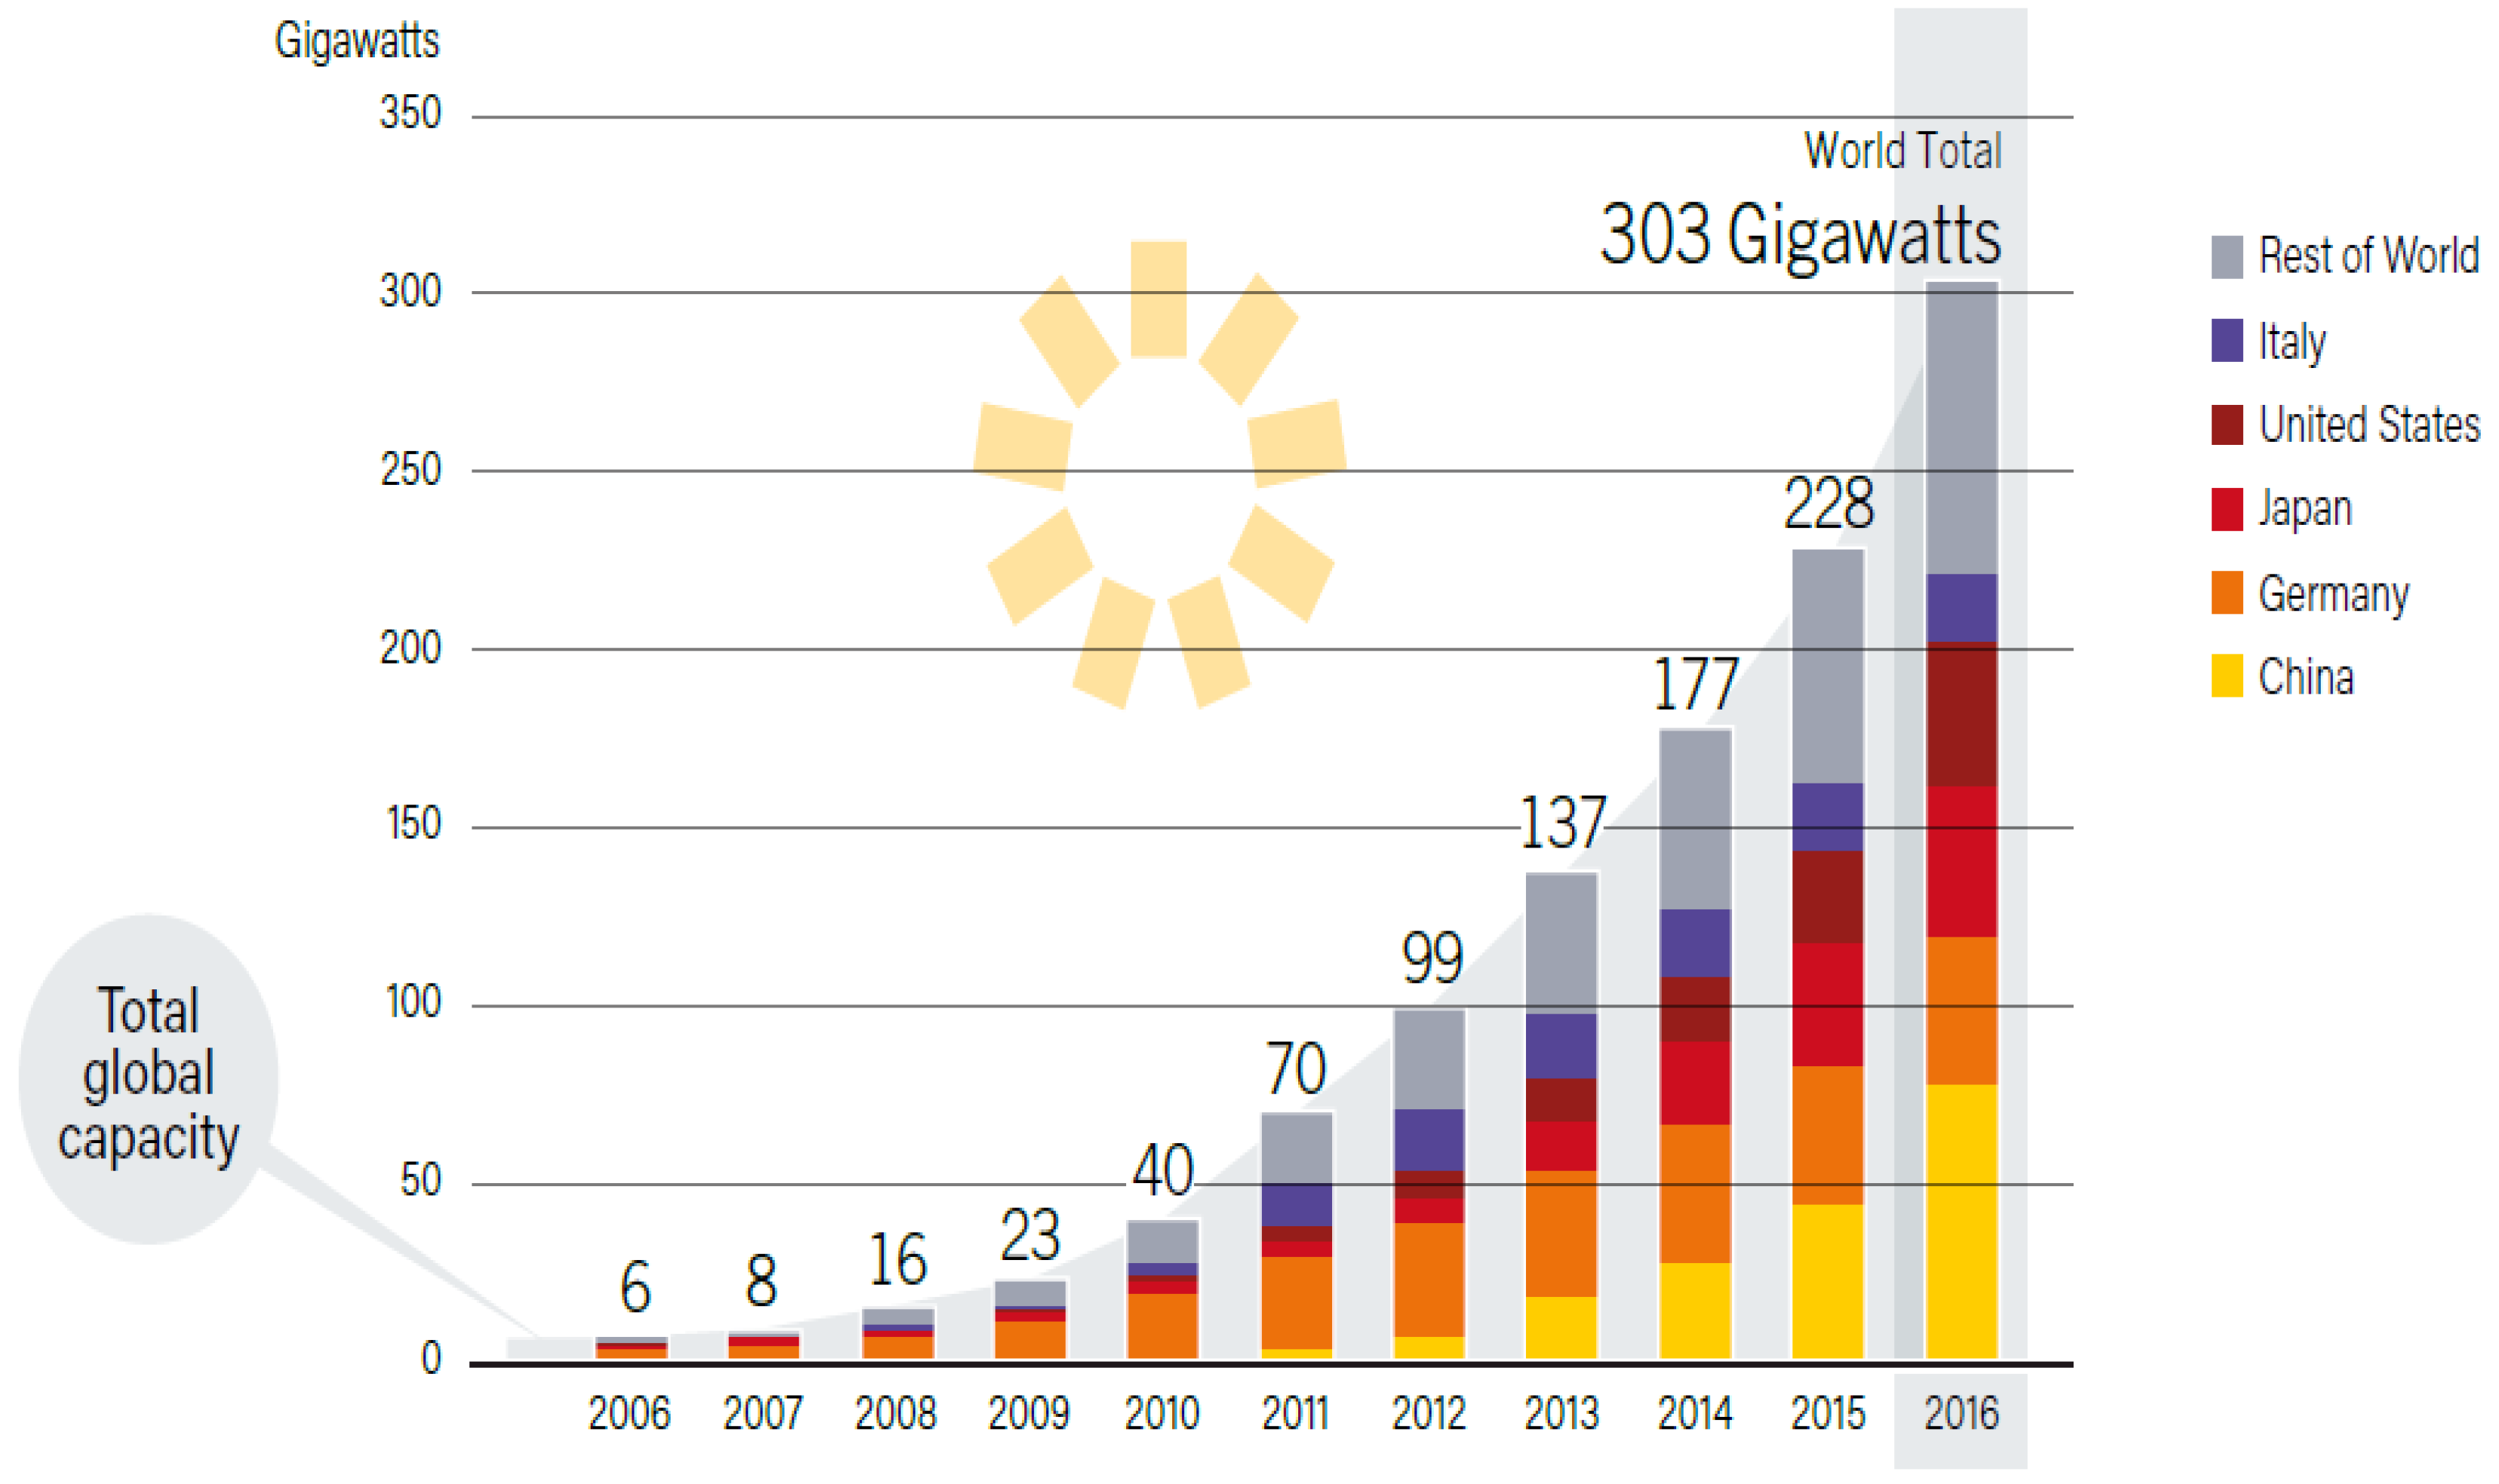
1.1. Features and Markets of Solar Modules

Solar energy is the most potent and abundant resource available for the whole of humanity, and is a clean and sustainable resource, since the annual energy potential arriving at the Earth’s surface from the Sun is approximately 8000 times greater than the current energy demand of the world.
The proliferation and widespread use of solar-energy generation is increasingly justified by humanity’s increasing energy demands, and it can make a significant contribution to the promotion of sustainable energy management, in addition to offering many other advantages [1,2,3]. There are many solutions for solar-energy utilization, ranging from passive heat production to complex, concentrated energy generation [4].
Photovoltaic technologies use solar modules that transform solar energy into electricity. A dramatic growth in solar-energy production has been observed in recent years, mainly due to rapid technological development, falling investment costs and the state subsidies introduced in many countries. This is supported by the following data: according to International Energy Agency [5] and Renewable Energy Policy Network [6,7] records, in 2009, the total installed power of solar photovoltaic (PV) systems was 23 GW, and by 2013 the capacity had grown more than five times (137 GW), so in 2014 this figure stood at 177 GW, and in 2016 at 303 GW. The world’s built-in photovoltaic capacity (2016) is 303 GW, with the largest proportions of 106 GW in the European Union (Germany 41.3 GW), 77.4 GW in China, 42.8 GW in Japan, and 40.9 GW in the USA [8,9] (Figure 1). In 2016, the share of renewable electricity production represented 24.5% of all electricity produced at a global level, of which solar systems accounted for approximately 1.5% [9].
Considering the potential of solar energy, many forms of utilization have been—and are still being—developed today, from solar-powered aircraft [10,11] through hydrogen production [12] and sewage sludge treatment [13] to desalination technology [14,15]. Khan and Arsalan (2016) [16] provide a detailed description of the development directions and methods of utilization for solar technology. When developing various applications, the type of solar modules used deserves special attention because it has a decisive influence on the amount of energy that can be extracted. Nowadays, due to the efficiency and development of the technology, the cost of manufacturing systems and the consumer price of solar modules will continue to fall, resulting in a reduction in the timeframe for a return on investment.
It can be said that the cost of investment has now approached the lowest cost level, which is only expected to be significantly reduced by significant developments in manufacturing technology or by exploring new and cheaper raw materials [17].
The amount of energy produced by solar modules depends primarily on the type and composition of the particular module and the combined effect of the installation and the current natural factors. Table 1 shows the efficiency rates and market share of crystalline and amorphous silicon solar modules.
The great advantage of a-Si technology is the competitive price, and it can be bought for as low as 0.06–0.09 €/WP [23]. We conducted the research which will be discussed in the sections below on silicon-based, crystalline and thin-film solar modules based on a favorable world market share and price.
In addition to the classic, most commonly used silicon-based solar modules, research and development activities for different materials, manufacturing processes and innovative technology are ongoing. These include, for example, organic, dye-sensitive or perovskite solar modules [17,24].
One of the most modern technologies is the concentrated solar module (also called the CPV), which can reach a level of effectiveness of up to 44.7% in laboratory conditions [25]. In this approach, the lens system is precisely aligned to the location of the sun, concentrating the sunlight on a few, multiple borderline solar cells of a few millimeters in diameter, so that the light reaches the special semiconductor material with a greater intensity [26,27,28]. Solar cells here are not the silicon wafers used in crystalline solution, but three-junction solar cells. This results in higher efficiency, as each layer specifically utilizes different ranges of solar radiation. The efficiency of the CPV module we use is 27.2% [27,29,30,31,32,33,34].
We believe that in addition to the base material and the development of manufacturing technology, the sun-tracking system is one of the most important resources for increasing efficiency.

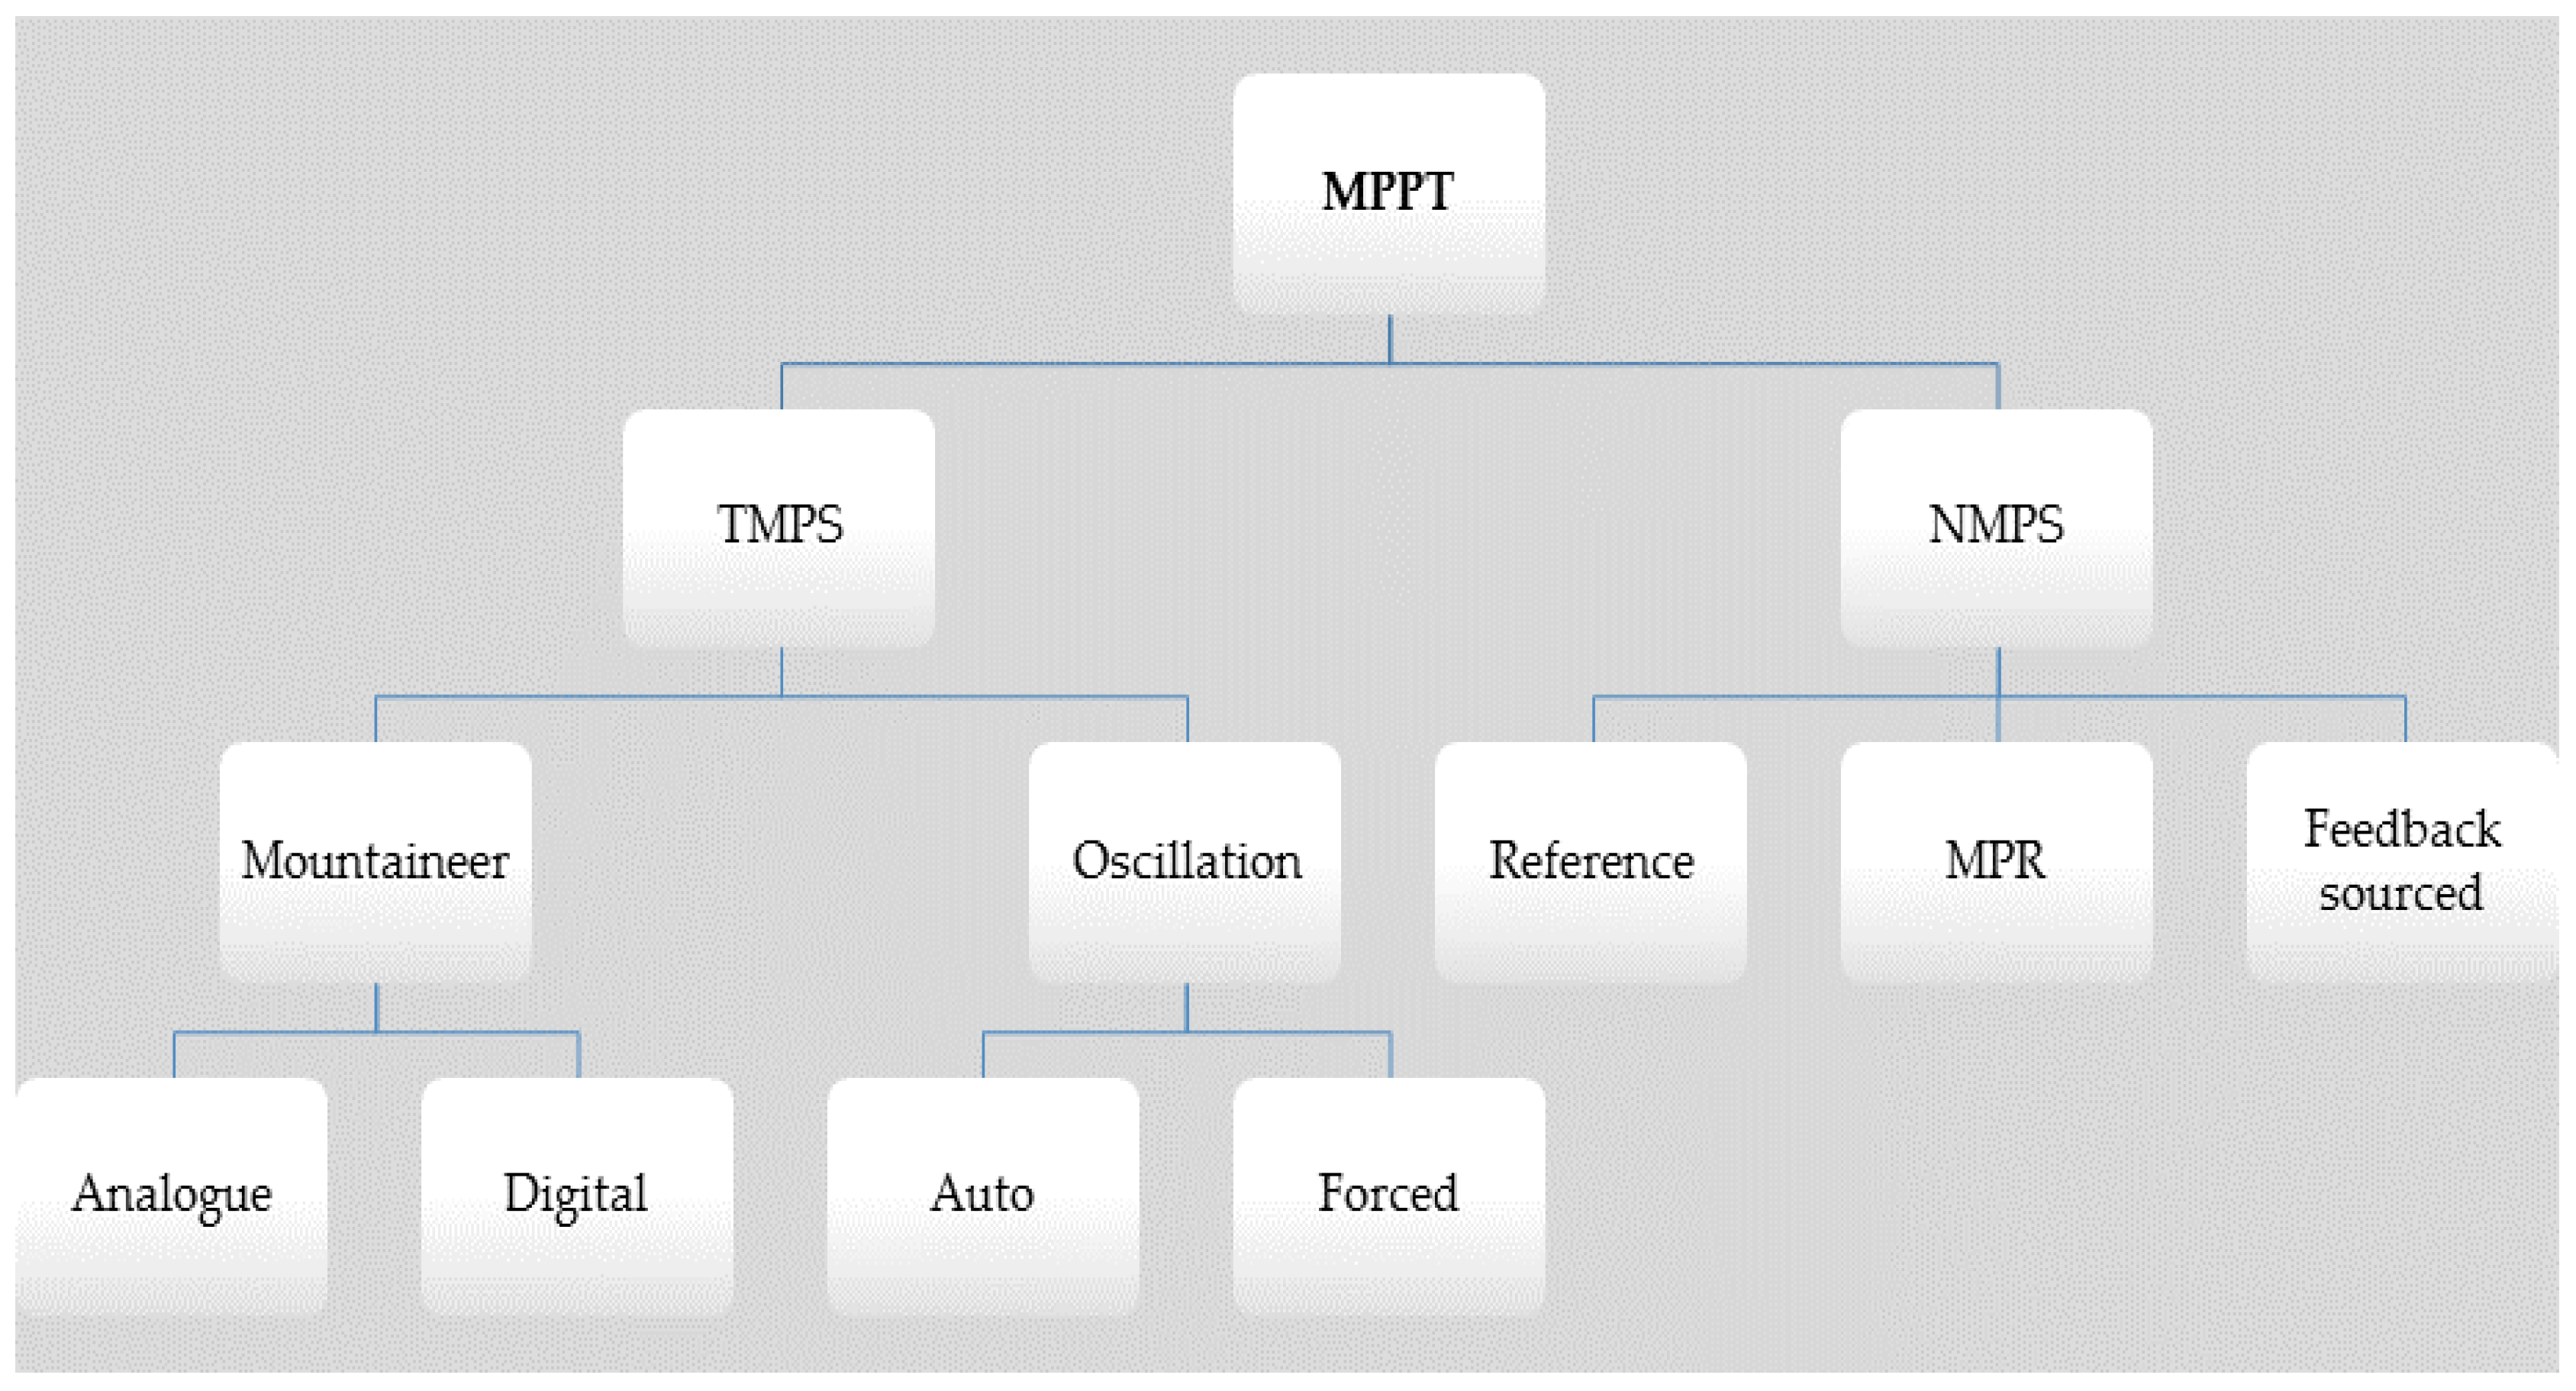
1.2. Maximum Power-Point Tracking (MPPT) Methods

Several power-point tracking methods (Figure 2) have been developed which seek to maximize the efficiency of solar modules. The energy or power gained will depend on the cell’s material characteristics, the intensity and incidence of solar radiation, and the setting of the working position of the cell voltage–current. Maximum power-point tracking (MPPT) methods aim to optimize voltage and current. These methods differ in their detail, resulting in different results for the same case studied [35,36,37].
Two essentially different methods can be distinguished in power-point tracking:
  • True maximum point seeking—TMPS;
  • Non-true maximum point seeking—NMPS [38,39,40].
The TMPS method uses elemental methods to search for the maximum power point of the current characteristics:
  • In the case of the mountaineering method, the power of the solar module is determined by measurement and indirect calculation. After modifying the charge factor or input voltage of the converter achieving the maximum power point, after a single step change the change in the solar energy performance is monitored. If the change is positive, it changes the fill factor (or voltage) in a single step in the same direction; if negative, then it moves it in the opposite direction.
  • In the oscillation solution, a sinusoidal, or other periodic time function signal is added to the control parameter and its effect is investigated in the solar performance. Auto-oscillation solutions are typically simpler in circuitry [38,39,40,41].
  • In the literature, several analog-based MPPT techniques are analyzed. One of the most popular MPPT techniques is the analog-based fractional open circuit voltage method that utilizes an almost linear relationship between the open circuit voltage (Voc) of the PV panel and its voltage at the MPP (Vmp). Vmp = k1 × Voc (k1: proportional constant) shows us the relationship between Vmp and Voc. This simple method has a major drawback: periodic breaking of the PV module from the load side for VOC measurement causes a remarkable power loss. The incremental conductance technique (ICT) and various analog-based perturb and observe (P&O) methods can be found in the literature. These are more accurate, faster, more complex and more reliable than the open-circuit voltage and the fractional short-circuit current techniques. They are able to find the real MPP but a current sensing circuit and an analog multiplier are necessary for the power calculation to achieve a better analog version of the ICT and P&O. Because of the aforementioned handicaps, these analog-based MPPT systems are complex and uneconomical for low power applications [38,39,42,43,44].
For NMPS solutions, the input working point of the converter is determined by the statistically known “a priori” properties of the solar module characteristics. There are methods in which the data of the solar module characteristics are stored in memory and a clear control parameter is assigned to a particular converter workstation. Other solutions work so that the voltage at the maximum power point in a given environment is 0.75–0.86 times the open circuit voltage of the solar module [40,45,46,47].

1.3. The Effect of Orientation and Sun-Tracking on the Energy Yield of the Solar Modules

Appropriate orientation of the solar modules and the ideal choice of the applied tilt angle are among the most important tasks for the efficient operation of photovoltaic systems. As a result of incorrectly chosen orientation and tilt angle, PV systems produce less electricity than a more optimal setting and, as a result, the time for a return on investment may increase, and to a considerable degree. Knowledge of local climatic conditions is also essential to maximize the amount of annual energy that can be produced. As a result, the ideal setting in different locations may be different.
In Europe, in the case of southern-oriented PV systems, the ideal tilt angle varies between 20° and 50° annually [48], so we also carried out investigations using this range.
In order to increase the annual yield of photovoltaic systems, in addition to the right orientation and tilt angle, the role of sun-tracking is also becoming more important. In this area, there are a number of software programs available to simulate solar energy production, which, depending on the technology and the circumstances, assume a 5% to 30% energy increase per year. For real production data, these values vary between 20% and 40% [49,50,51].
Kacira et al. (2004) [52] shows the evolution of the optimal southern orientation by the monthly change in Turkey in the city of Sanliurfa. It can be stated that during the summer period this value varies between 13° and 23°, and during the winter season between 51° and 61°. During their summer season, the average daily development of the daily energy production of a 14° southern-oriented photovoltaic system was compared to a dual-axis tracking system. With the help of sun-tracking, the system generated an average of 34.6% more electricity per day during the summer.
Eke and Senturk’s (2012) [53] surveys in the south-west of Turkey (Muğla) showed that a dual-axis sun-tracking monocrystalline system produced 30.8% more energy annually than a non-tracking system inclined at 28° using identical modules and inverters. In the summer season, in June, the monthly value added was 42.5%, while in July and August it was 37.5%.
Similarly, models developed by Ismail et al. (2013) [54] and experimental work conducted by Abdallah (2004) [55] estimated the gain in yearly energy production to be 20.4% and 43.9%, respectively, by using a double-axis tracker compared to an optimally-inclined fixture [56].
According to the US Energy Information Administration’s (EIA) simulated data, on an ideal sunny summer day in the USA, in the city of Los Angeles, compared to a 20° south-facing PV system rated at 1 kW, a 20° western orientation reduces daily energy production by 10% and an eastern orientation by 5%. By contrast, a horizontal setting increases it by 5% and a dual-axis tracking system by 33% [57].
In Vickery and Baron’s [58] measurements (Vermilion, Canada), compared to a 68° south-facing crystalline PV system, an eastern and a western 17.5° oriented tilt angle PV system produced on average 39% less electricity annually. The annual figures are compared monthly with the PW–Watts modelling program. In the case of southern orientation, a 4.4% difference can be observed annually. In eastern and western orientations, these values were 9% and 11.5%, respectively. The results of the tests on a dual-axis tracking system showed that, compared to the dual-axis solution, a 53° south-facing crystalline solar system produced 31% less electricity annually.
Vokas et al. (2015) [51] investigated the energy differences of the measured annual data of simulated and dual-axis tracking systems, based on meteorological data in 8 cities in Greece (Kilkis, Ilia, Serres, Trikala, Evros, Karditsa, Magnisisa and Rodope). The annual energy production in the case of the real and simulated data showed a 29.5% difference in the dual-axis tracking system. In real PV systems, an average 34.5% more energy was generated annually compared to non-tracking systems. The tilt angle of the non-tracking systems was between 20° and 30°. The inaccuracies in the simulated and real cases illustrate the importance of real data.
De Simón-Martín et al. (2014) [59], however, in their work in the northern part of Spain near the city of Palencia, compared a non-tracking system, and a monocrystalline dual-axis photovoltaic system under operating conditions. Their results showed that the dual-axis tracking system produced 30.5% more energy over the year, compared to the non-tracking system. In summer, the monthly values added in June, July and August were, on average, 31.3%, 35.5% and 29.8%.
All of these tests were conducted in much more southerly locations than our measurements (apart from those in Vermilion, Canada), so we believe that our studies conducted on higher latitudes are scientifically useful. For example, in this geographical latitude, there are the cities of Wolfsberg and Linz in Austria, Merano in Italy, Meiringen and Friborg in Switzerland, Chalon-sur-Saône and La Roche-sur-Yon in France, and Cluj-Napoca in Romania. In the United States, near this latitude, we find, for example, Bismarck (North Dakota), Helena (Montana) and Olympia (Washington).
In the azimuth and tilt angle analysis, it can be stated that a few tilt angle-orientation settings have been investigated at the same time (simultaneously) by researchers on the basis of a single technology [60]. Heslop-MacGill (2014) [61] investigated 21 photovoltaic systems in Alice Springs (Australia), 16 fixed-tilt systems including amorphous, hybrid, thin-film, polycrystalline and monocrystalline panels, 1 single-axis tracking system, 3 dual-axis tracking systems and 1 concentrating system. However, information on the inclination of the photovoltaic systems, the system losses or the type of inverters used has not been provided. This study analyzed the fixed tilt and the dual-axis tracking systems and generalized and summarized the results without distinguishing the technology, and so did not provide an answer for the choice of appropriate photovoltaic technology for investment decisions. A similar analysis was carried out by Maatallah et al. (2011) [62], who also analyzed the fixed-tilt and the dual-axis tracking system and generalized and summarized the results, but without differentiating technology. In the case of modeling and energy-forecasting systems (e.g., the Photovoltaic Geographical Information System, PW–Watts modeling program), or studies on the ideal annual tilt angle, no distinction has been made between technology and only general conclusions have been drawn [63,64,65,66,67,68].

2. Materials and Methods

In this study, we investigated the tilt angle-orientation of the crystalline and amorphous silicon solar modules and their dual-axis tracking characteristics and energy production in summer, in real and ideal weather conditions near to the summer solstice, compared to simulated data.
These photovoltaic technologies have been under development and research for decades. As can be seen from the review of scientific publications (‘The effect of orientation and sun-tracking on the energy yield of the solar modules’ section), in research conducted so far, up to 3–4 tilt angle-orientation settings have been considered simultaneously, typically highlighting one technology; it is also characteristic of these studies that azimuth and tilt angle analyses and models take into account given geographic conditions and do not group data according to photovoltaic technologies. We could not find analyses where at least the three most common PV technologies were examined at the same time at the same site in terms of their energy production, with the variables being dual-axis tracking and 4 orientations (east, west, south, horizontal) and at each 5 degree interval. For economical or energy computations and modeling, it is useful to carry out such measurements at many geographic latitudes, as current modeling/forecasting systems are still inaccurate. It follows that the role of data measured in real weather conditions is indispensable. An equally important issue—especially from the point of view of investment decisions—is to what extent energy production per 1 m2 differs in the same operating conditions in the case of PV technologies, tilt angle and direction, and dual-axis tracking. We have not been able to find reliable comparative data, which is well-supported by measurements, which takes these considerations into account, so our current examinations can be considered to fill a gap in the research field.

2.1. Study Site

Based on this, we have formulated the objectives of our research, and we consider the specific energy production calculations necessary for economic planning of PV investments to be a particular priority. The novelty of the research lies in the fact that, in addition to a comparison of the three most important photovoltaic types, the specific energy production is examined for dual-axis tracking and the four different orientations at intervals of five degrees. The data collection of the research work was done in Hungary, in Keszthely (latitude: 46.76750°, longitude: 17.26609°).

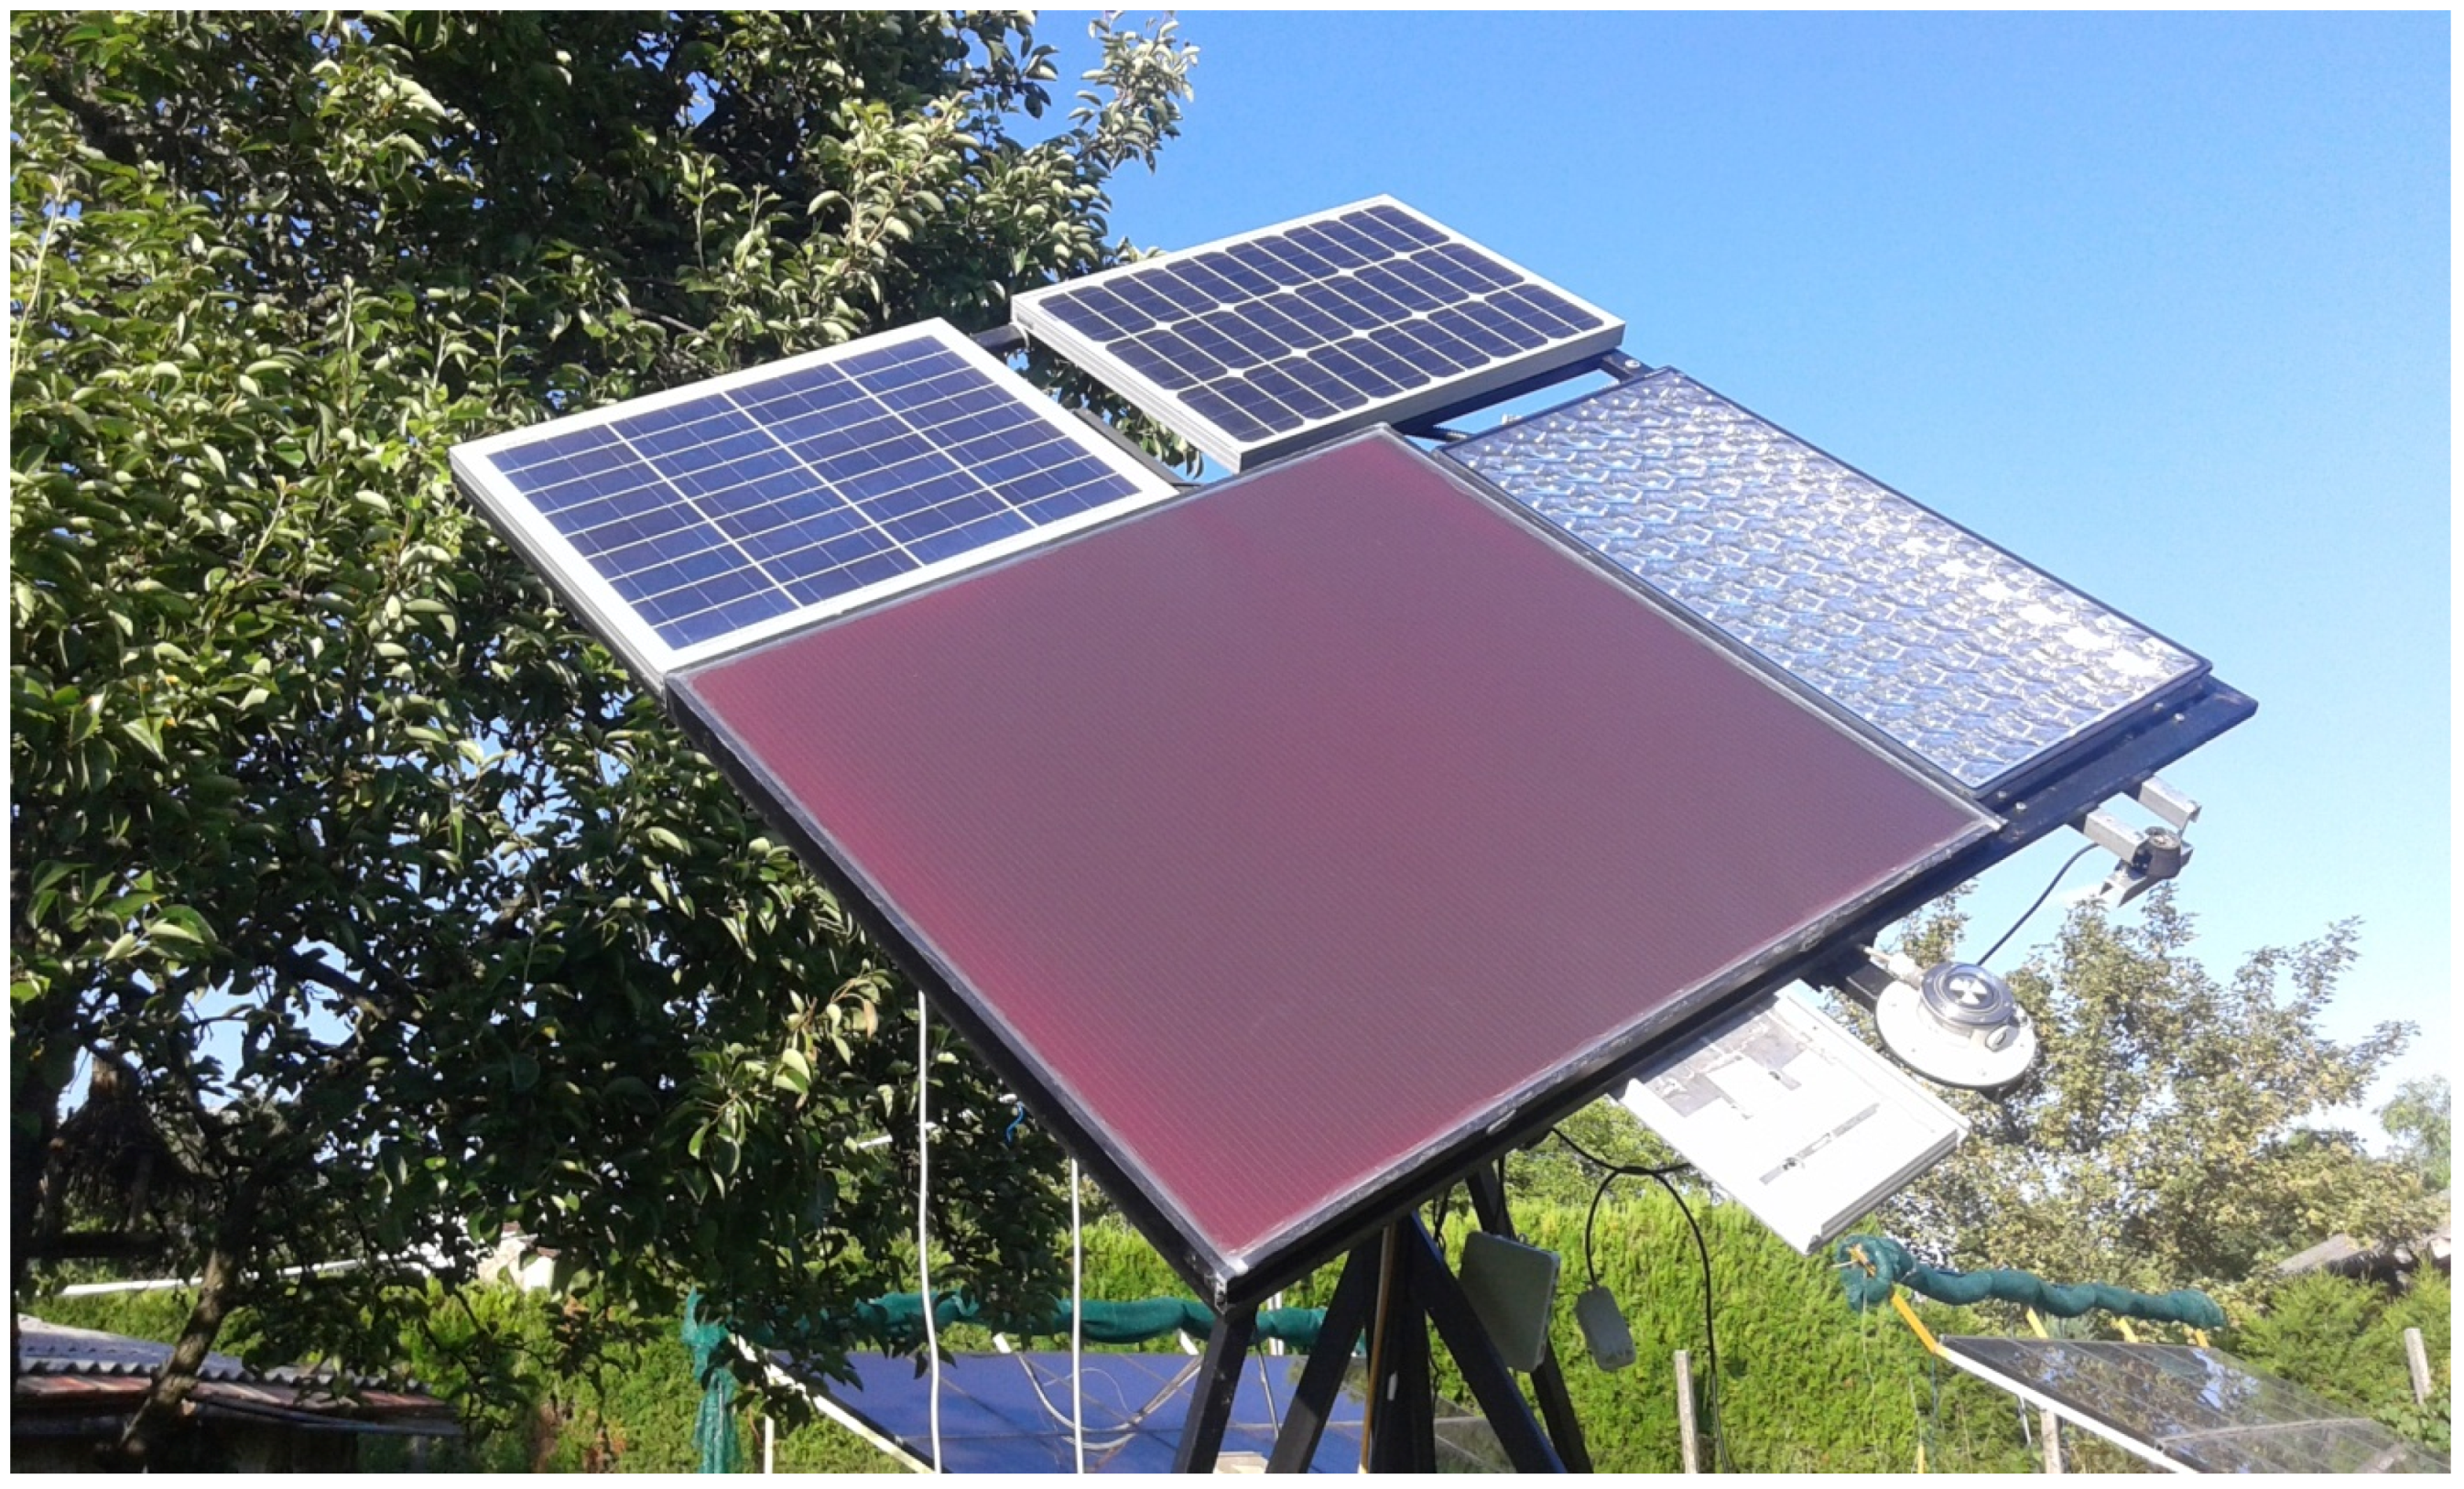
2.2. Types of Investigated Photovoltaic (PV) Panels

The study was performed using a dual-axis tracking system using monocrystalline, polycrystalline and amorphous silicon photovoltaic technology under outdoor, true, bright weather conditions at the same measurement point on 7 June 2016, close to the time of the summer solstice. From the weather point of view, this day was the most appropriate day in June to carry out undisturbed measurements. The CPV solar module (Soitec, CX-75-III) on the monitoring system (with higher performance than the previously rated [75 W]) in the present experiments assisted only in the accurate adjustment of the sun (Table 2, Figure 3).

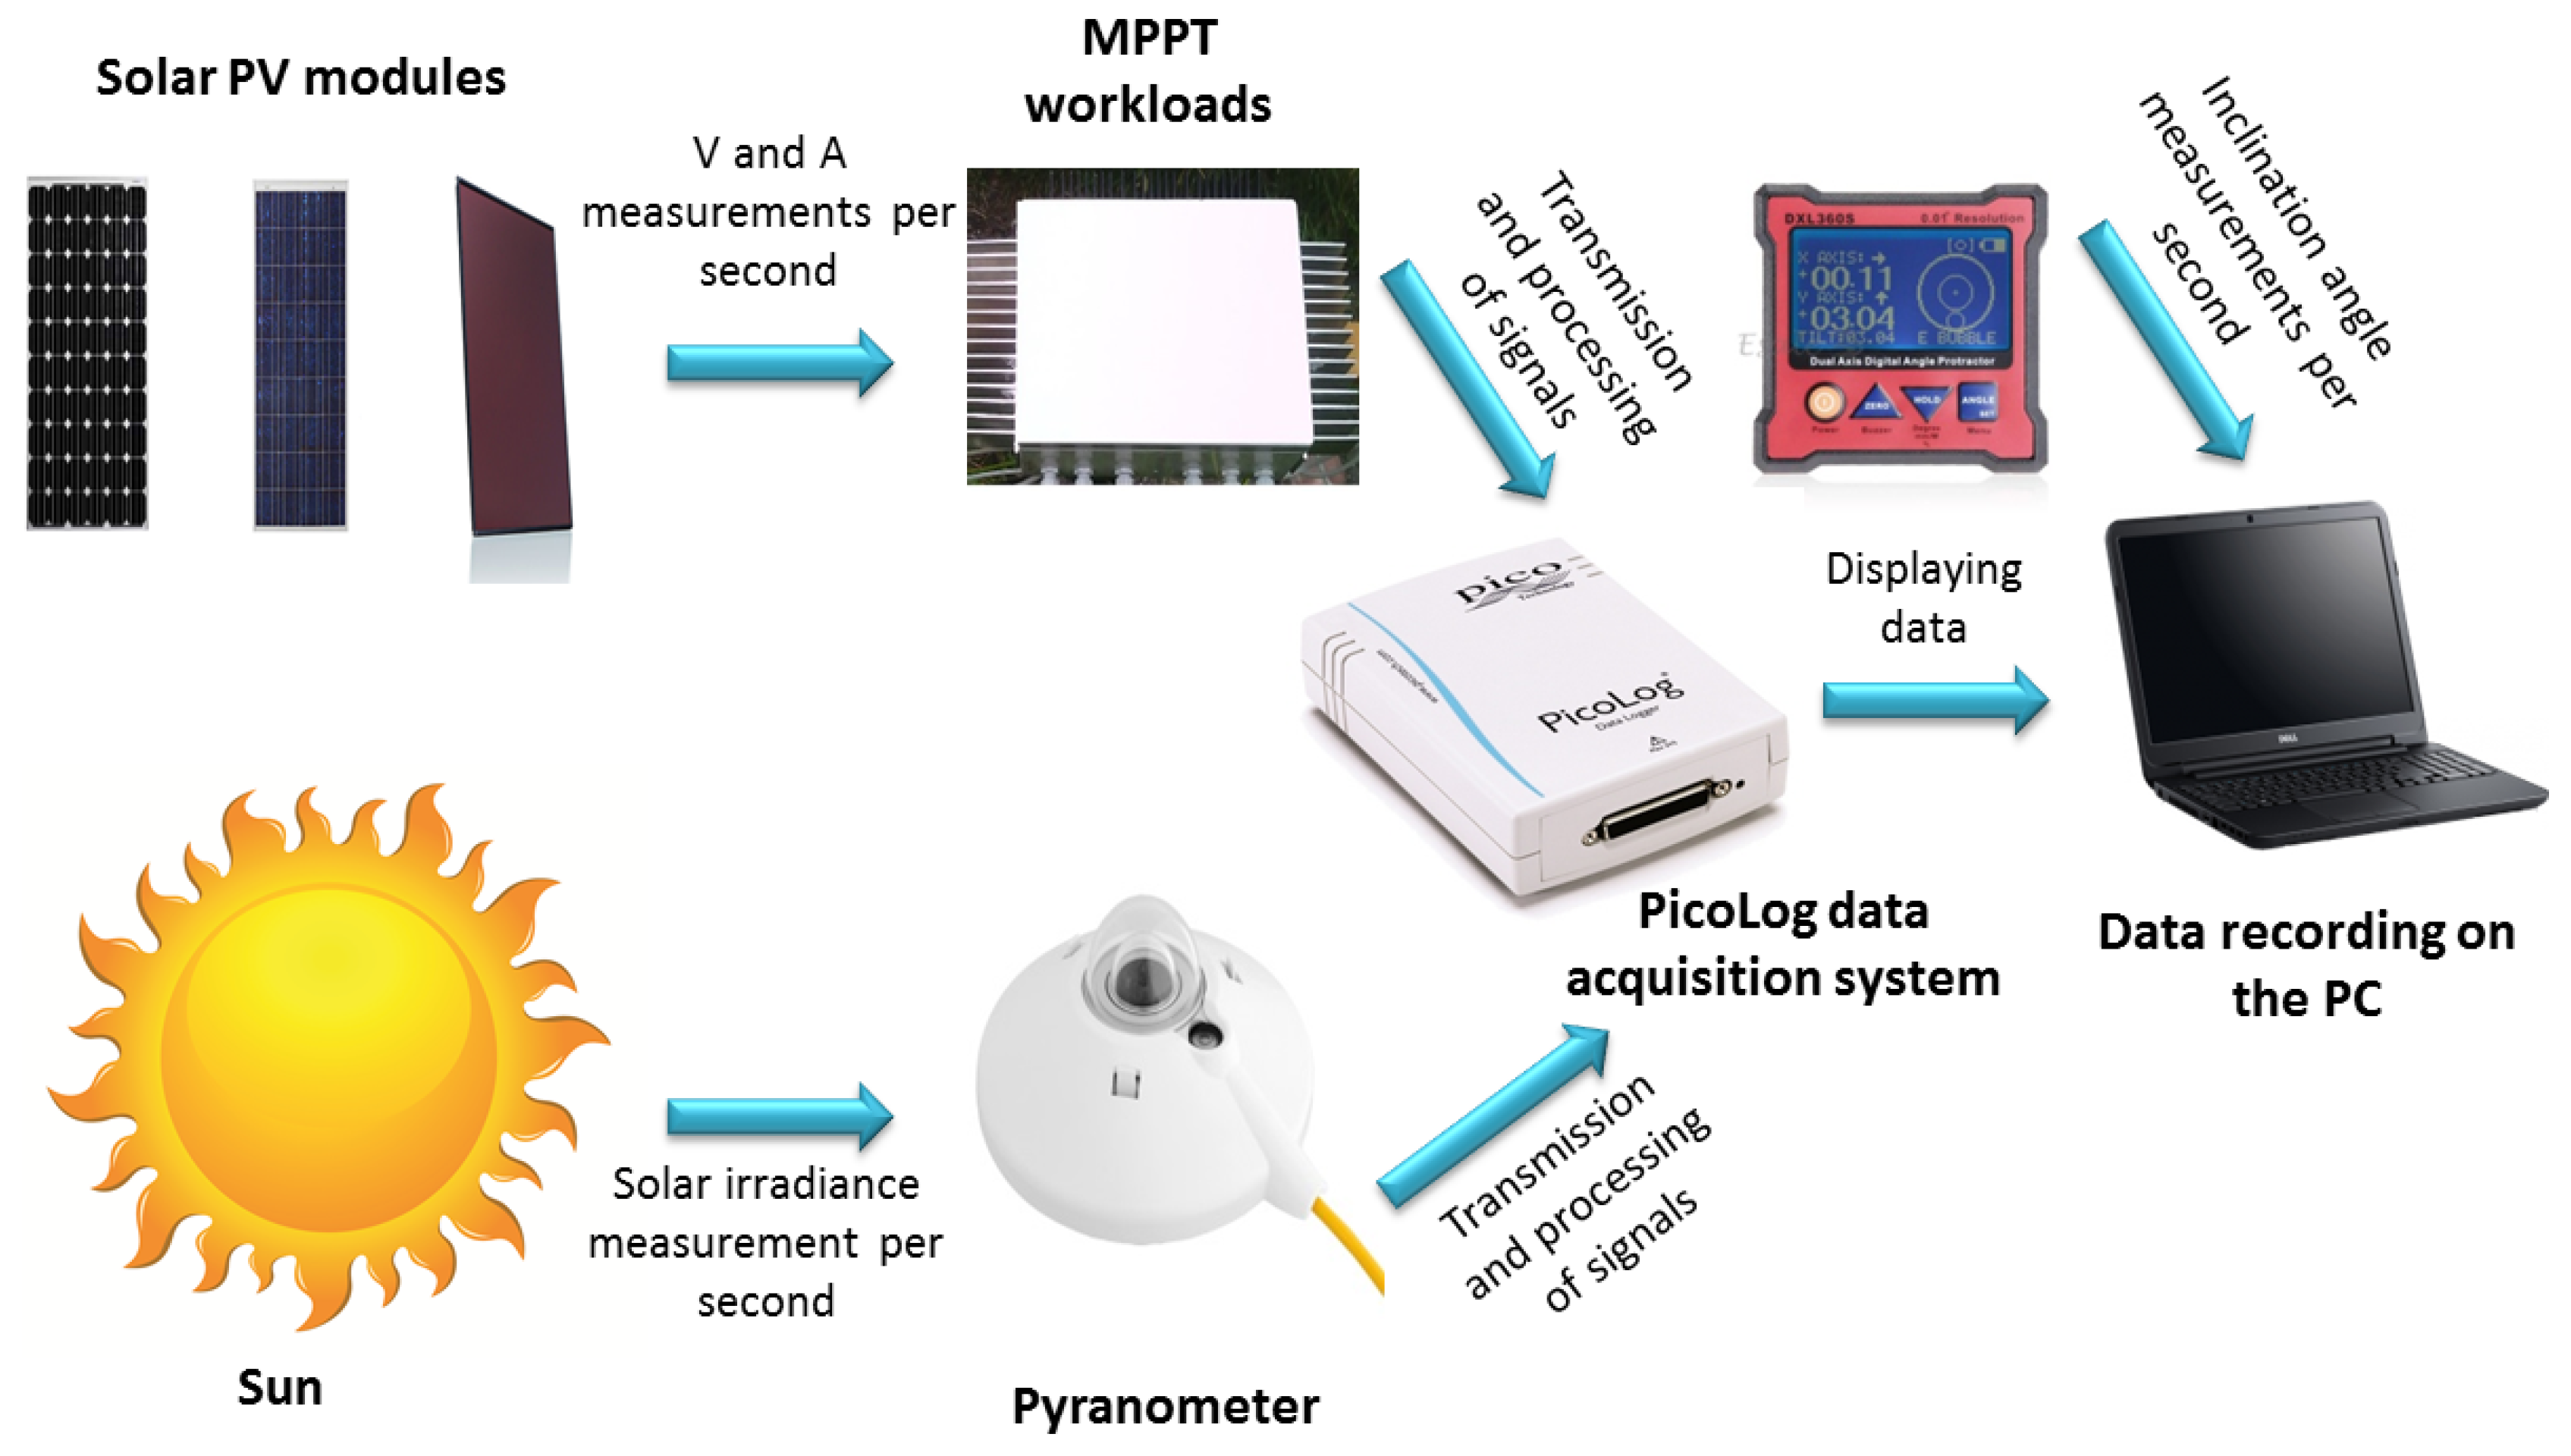
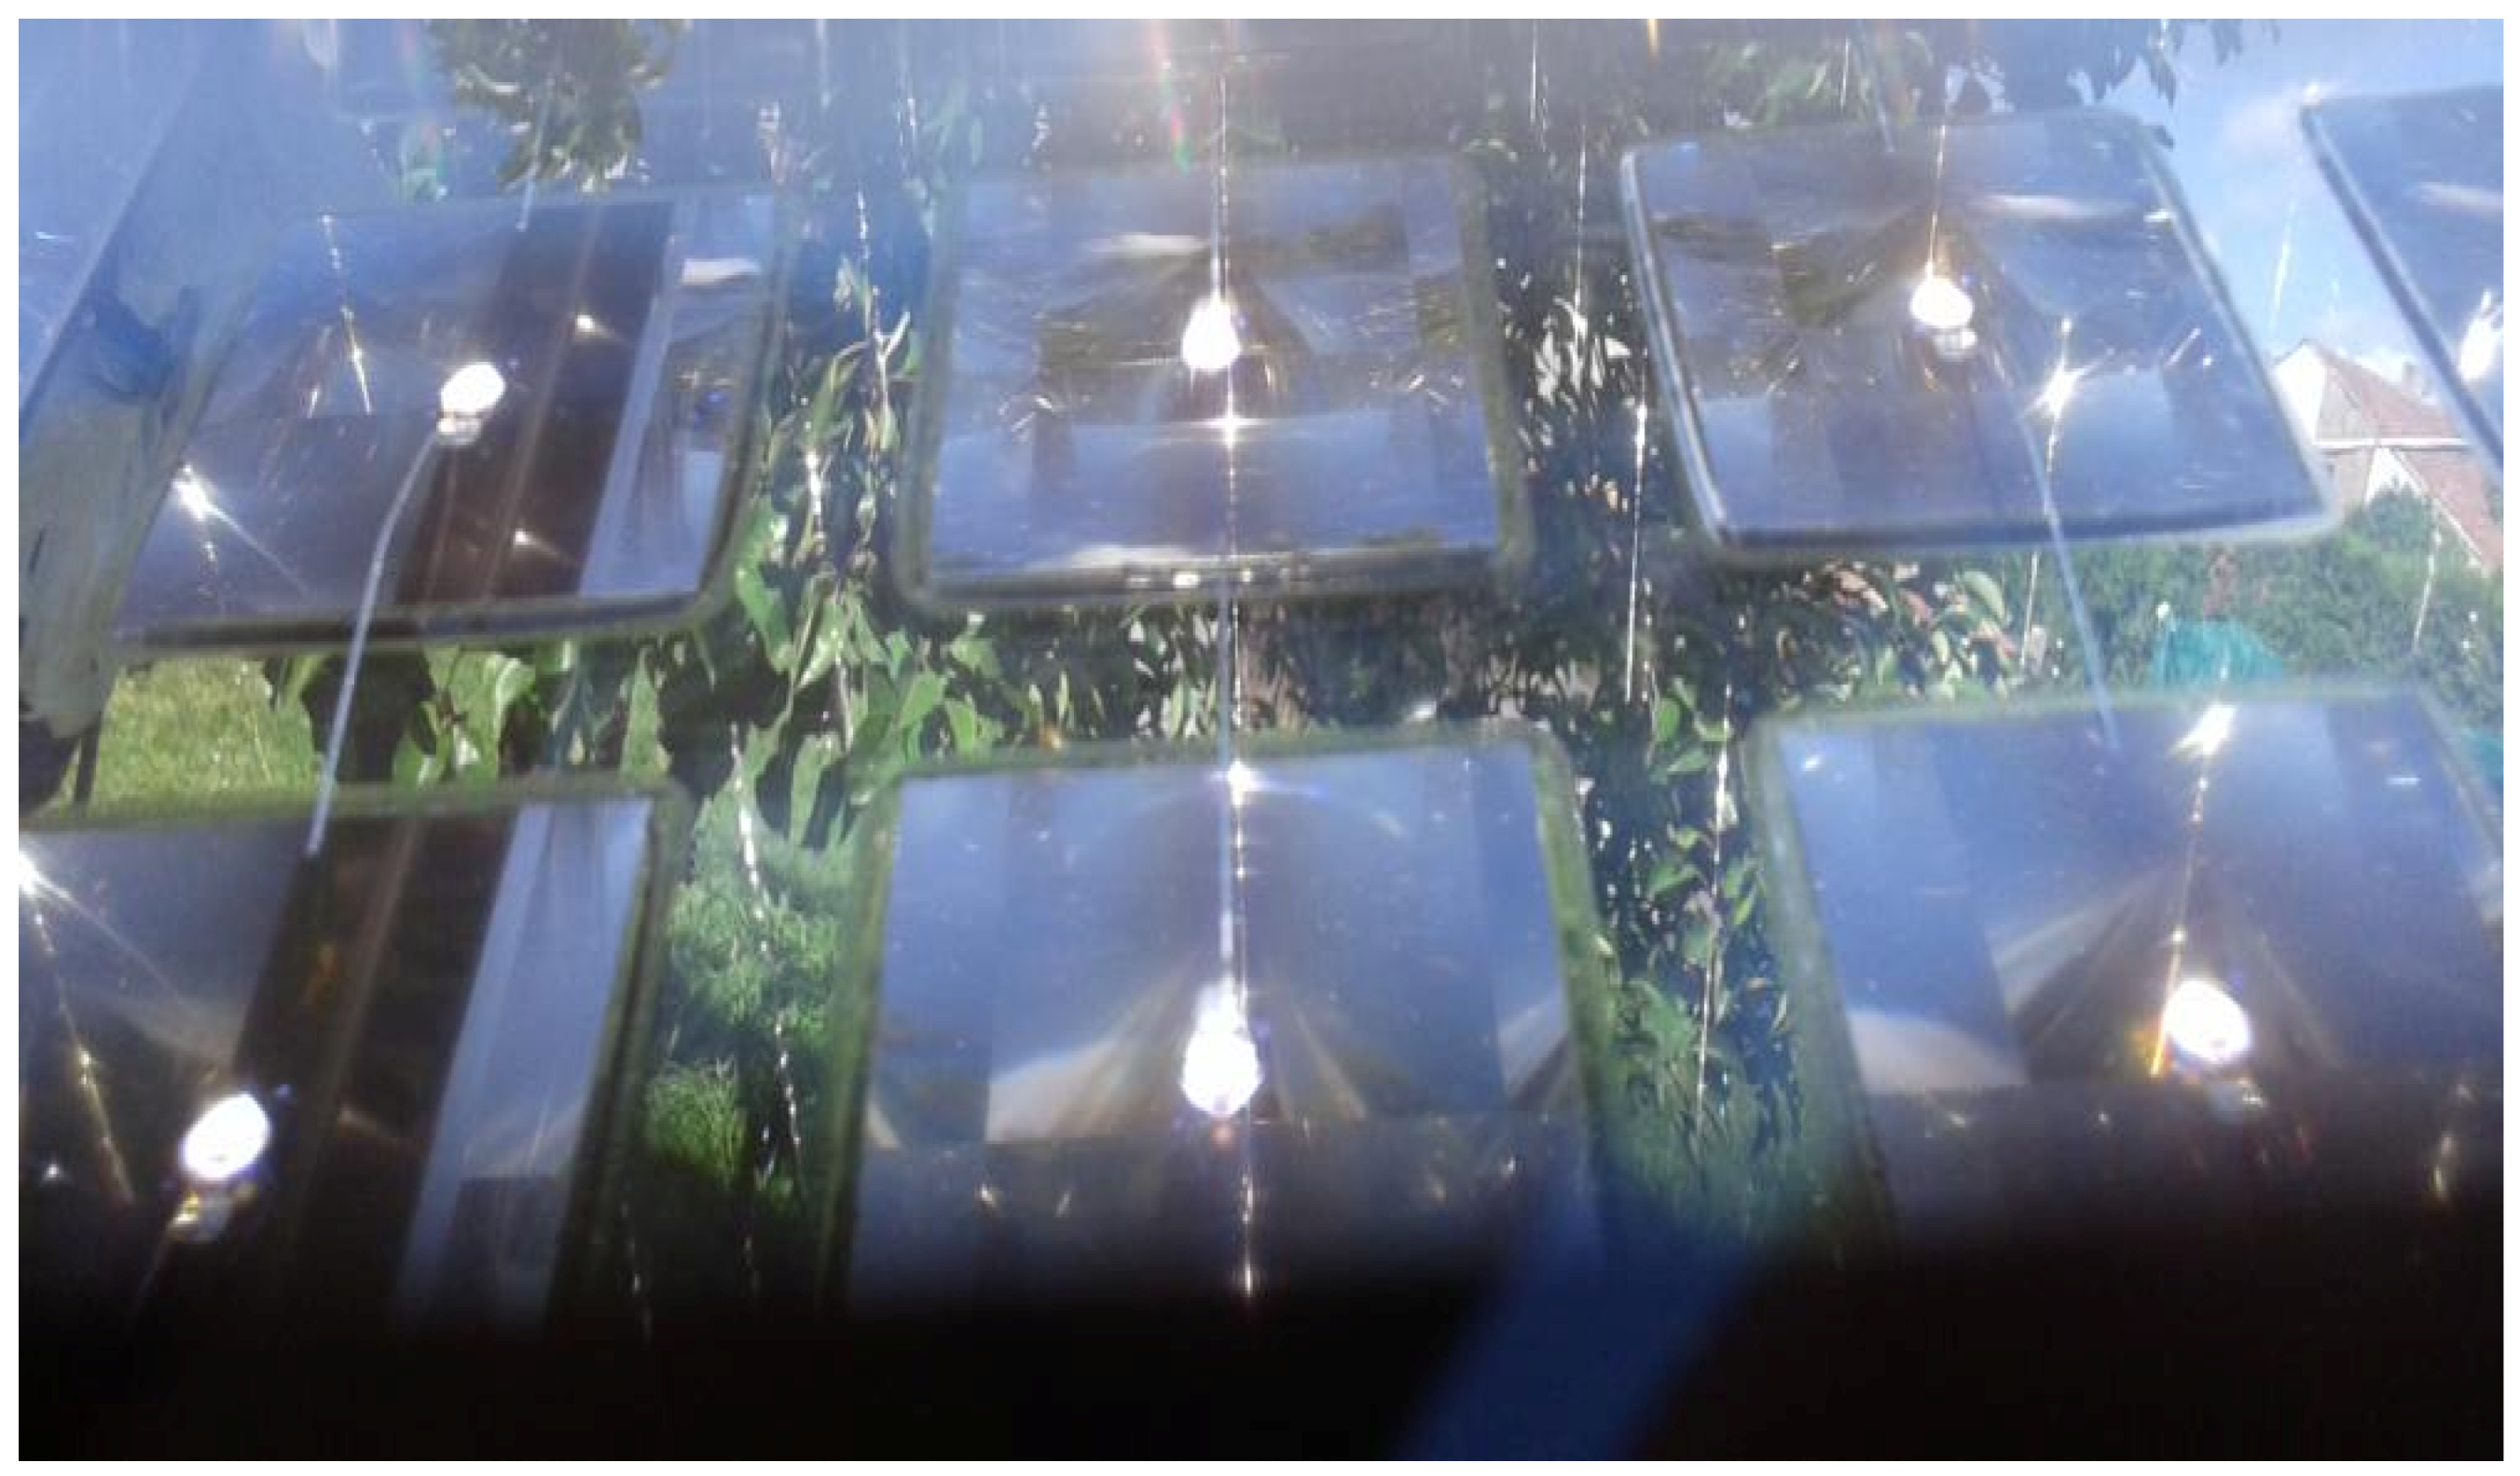
2.3. Circumstances of the Experiment

The current measuring station has been under continuous development since 2013. During the experiments, the solar modules were continuously measured using 2 PicoLog data acquisition systems. The great advantage of the data acquisition device is that it can be mounted on a computer and its software is flexible, so you can see the incoming signals at once. The data was recorded every second with a PC.
The following technical-environmental parameters were defined:
  • voltages and currents with a Voltcraft VC607 professional multimeter that was tested before the measurements with an LT1021 voltage reference (10,000 V ± 5 mV);
  • the radiation intensity is determined by an Eppley Black and White Model 4–48 Pyranometer (±3–5% uncertainty, certified by the National Meteorological Service);
  • the tilt angles of solar modules were investigated using digital timers.
During the measurements, we applied oscillation TMPS workloads. By keeping the voltage and current multiplied to the highest level (i.e., the instantaneous power), the solar module operated at the maximum power point. With the help of these devices it is possible to manually check the maximum power point of the PV modules, thus allowing the correct measurement accuracy (Figure 4).
The solar modules were moved using two linear actuators and photosensors, making it possible to achieve the optimal tilt angle and azimuth setting at all times. The system is suitable for both manual and automatic control, with the linear actuators being turned on and off individually. Thus, it was possible not only to show the tilt angle-orientation tests, but also to show the characteristics of single- and dual-axis tracking systems between 0° and 50°.
Continuous monitoring can be carried out during automatic use. For manual control, the timing automaton is disabled by means of a switch, so it is possible to carry out a set of attempts made by a hand-held remote control. The hand-held remote control is suitable for both horizontal and/or vertical control. Accurate adjustment to the sun was facilitated by the automatic sun tracker, which was checked with the visible focus point (FP) of the CPV solar module (Figure 5). At this position, the sun’s rays are ideally positioned perpendicularly to the solar modules. All four solar modules are located on the same scaffold and surface. Proper setting of the focus point is a major consideration because only with this is it possible to perform a precise, accurate comparative analysis of the other settings. With inadequate solar tracking it is difficult to provide the appropriate measurement conditions, which may lead to erroneous evaluation of the data.

2.4. Data Processing

From an environmental point of view, the ideal, all-day sunny period was 7 June 2016. The main measurement was preceded by three test days (31.05.2017, 01.06.2017, 06.06.2017) in order to achieve correct measurement accuracy. On 7 June 2016, the exact position (FP), and the south (S; azimuth 180°), east (E; azimuth 90°), west (W; azimuth 270°) and horizontal (H; 0°, 0°) angle changes were manually adjusted between 9 am and 6 pm with two digital angle measurers. Before 9 am and after 6 pm shadow periods occur, which would distort the results, so no measurements were made. The starting state was the setting of the focus point of the CPV solar cell, after which the aforementioned orientations and energy production data were measured between 20° and 50°, at 5-degree intervals. The energy output for each orientation and tilt angle was measured for 6 s, and the switching to the next measurement lasted for 2–6 s. Due to the switching of the measuring instruments, it was necessary to wait 5–6 s. With this method, the investigated orientations and energy production data could be measured in a period lasting from 5 to 7 min, then compared to each other. We excluded the change in the radiation intensity of the maximum 7 min compared to the initial state.
An average value of 6 s of energy production data was determined for each hour. For each measurement, a unique bell-shaped day-to-day electricity generation area was created at the end of the period under review. With this area, the daily energy value was determined for each setting. For the best dual-axis tracking system, total energy values were considered to be 100% for each of the three 50 W (m-Si: 446.3 Wh, p-Si: 386.7 Wh, a-Si: 491.9 Wh) solar modules. Thus, for the summer time (near to the summer solstice) at the aforementioned latitude, data were obtained for the three photovoltaic technologies expressed as a percentage of the divergences from the optimum dual-axis tracking system.
Simulated PV energy production was based on the data of the National Renewable Energy Laboratory (2017). The simulations require hourly solar resource data that describe the solar radiation and meteorological conditions at the location of the system. This software can simulate daily PV energy generation (AC-DC) by 365 days of the year anywhere on Earth. The purpose of the preceding simulations was to know how accurate the PV energy production simulation technology was in the case of hourly energy production compared to the real data (considering dual-axis sun-tracking, orientation and tilt angle) in 2016. It may be supposed that our results are valid not only for the time and location of our measurements, but can be used generally for planning targets.
In order to check the calculated data, two photovoltaic systems were used, located relatively close to the measurement system (Siófok, latitude: 46.90906°, longitude: 17.79965°, Balatonudvari, latitude: 46.90101°, longitude: 18.07462°). These systems were chosen as they have internet monitoring, so that day-to-day energy production data is readily available and comparable [67,68].
First, the influence of the dual-axis tracking, the tilt angle, and the orientation in terms of the focus point were compared to the performance and the amount of daily energy produced by the three different 50 W solar modules. In addition, during the measurements, the 6-s real energy production data per hour and the daily energy output per solar module per 1 m2 were specifically determined for comparable statistical analyses.

2.5. Data Analysis

Data analysis, evaluation, and sorting was performed using PicoScope and Microsoft Excel, SPSS Statistics 24 software. The analysis of variance (ANOVA) method was used to break down the variance of the population in order to find out whether the average specific energy production of the solar modules can be verifiably different from the 5% significance level. The null hypothesis states that the average specific energy generation of solar modules is the same, and the counter-hypothesis is that there is at least one solar module whose average specific energy production is significantly different from the others. If the counter-hypothesis was accepted on the basis of the test statistic of variance analysis F, the distribution homogeneity was checked by a Levene test. The null hypothesis of the Levene test states that the deviations are not equal, the rejection of which shows the effect of the distribution homogeneity. This test was required to select the most suitable of the available methods to compare the pairs of different solar modules based on the average specific energy generation: in the case of the distribution homogeneity, the pairwise comparison was tested by a Scheffe test (this is one of the most conservative and, therefore, the most reliable, tests), but if there was no variance homogeneity, Tamhane’s T2 test was used.
The F proportion between groups and within groups is the ratio of divergence. If the variance homogeneity did not exist, Tamhane’s T2 test was used [69].

3. Results and Discussion

3.1. The Influence of Orientation and Tilt Angle in Terms of Energy Yield

On the day of measurement, the maximum height of the sun was 66.03°, which means that the lower tilt angle orientations are more ideal than the larger ones. For all three photovoltaic technologies, the reduction in energy yield and order of magnitude for the tilt angle and orientation were almost identical. The order shown in Figure 6 and Figure 7 is determined by the results of the monocrystalline solar modules. In Hungary, for the southern-orientated systems, the ideal angle of tilt angle is 35° [48]. Compared to a southern orientation of 20° in the examined period, this tilt angle produced a 3.8% and 3.6% reduction in the real energy production for monocrystalline and polycrystalline solar modules, and a 4.6% reduction for the amorphous solar module.

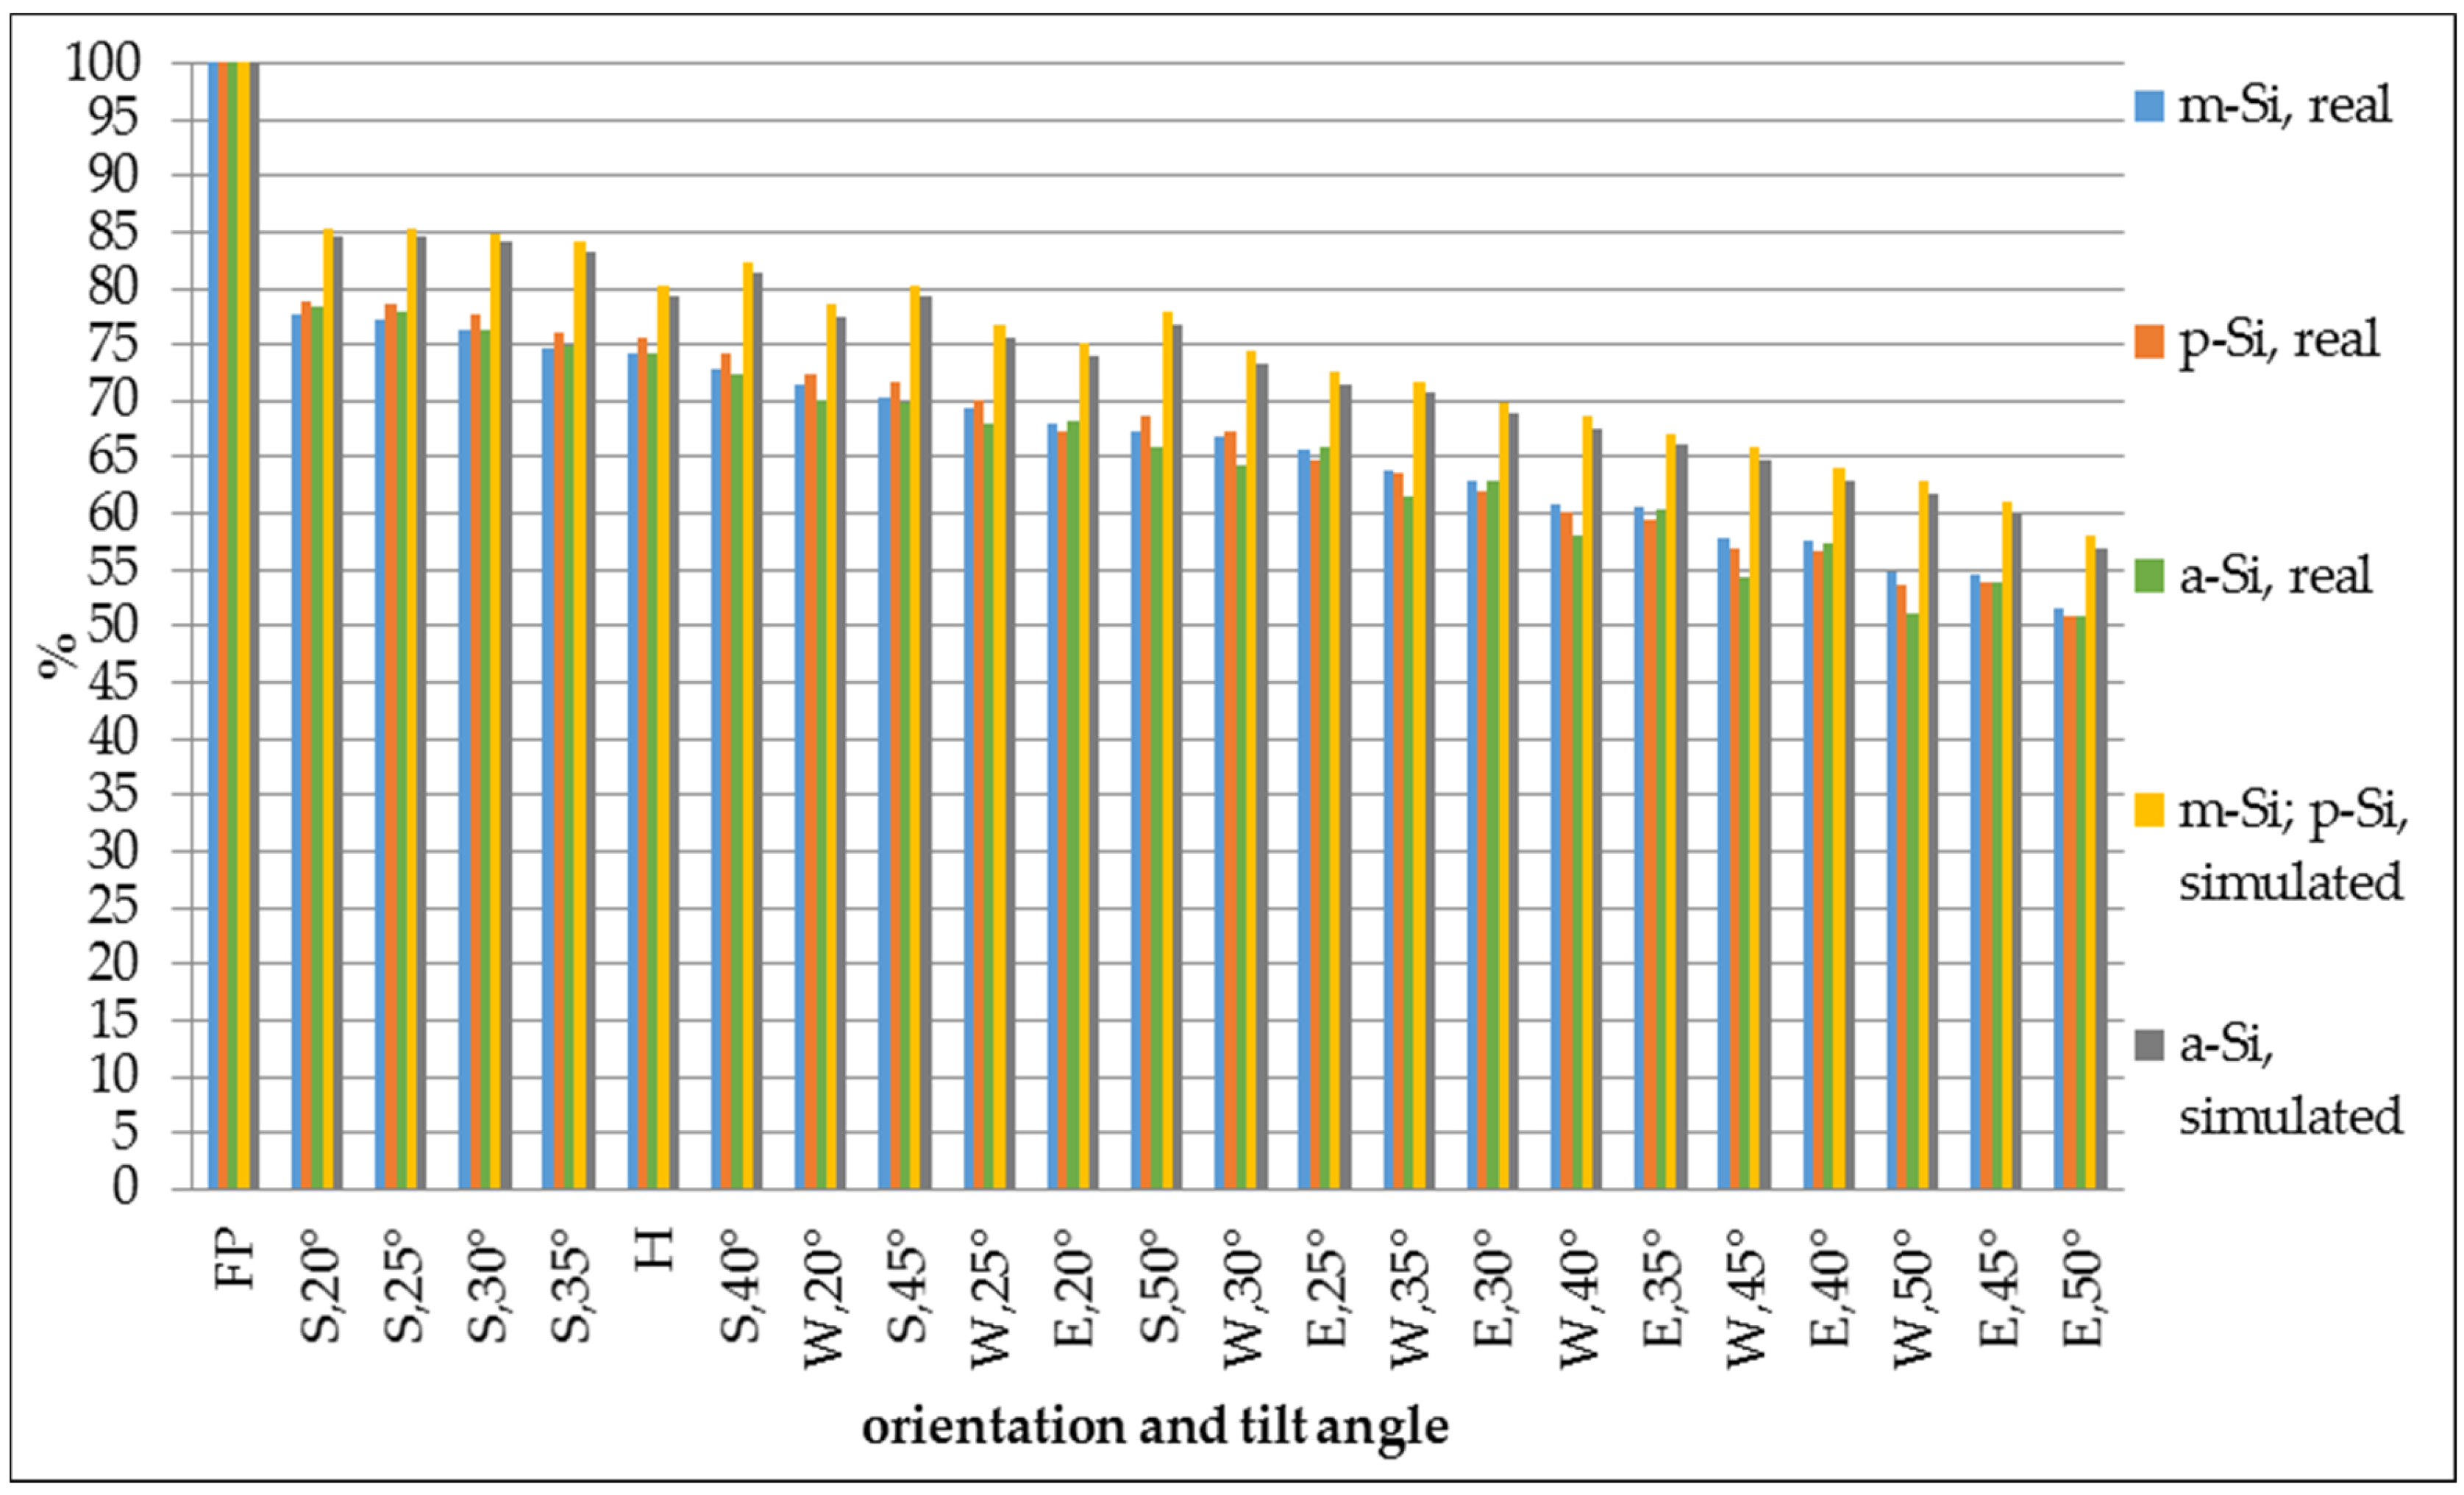
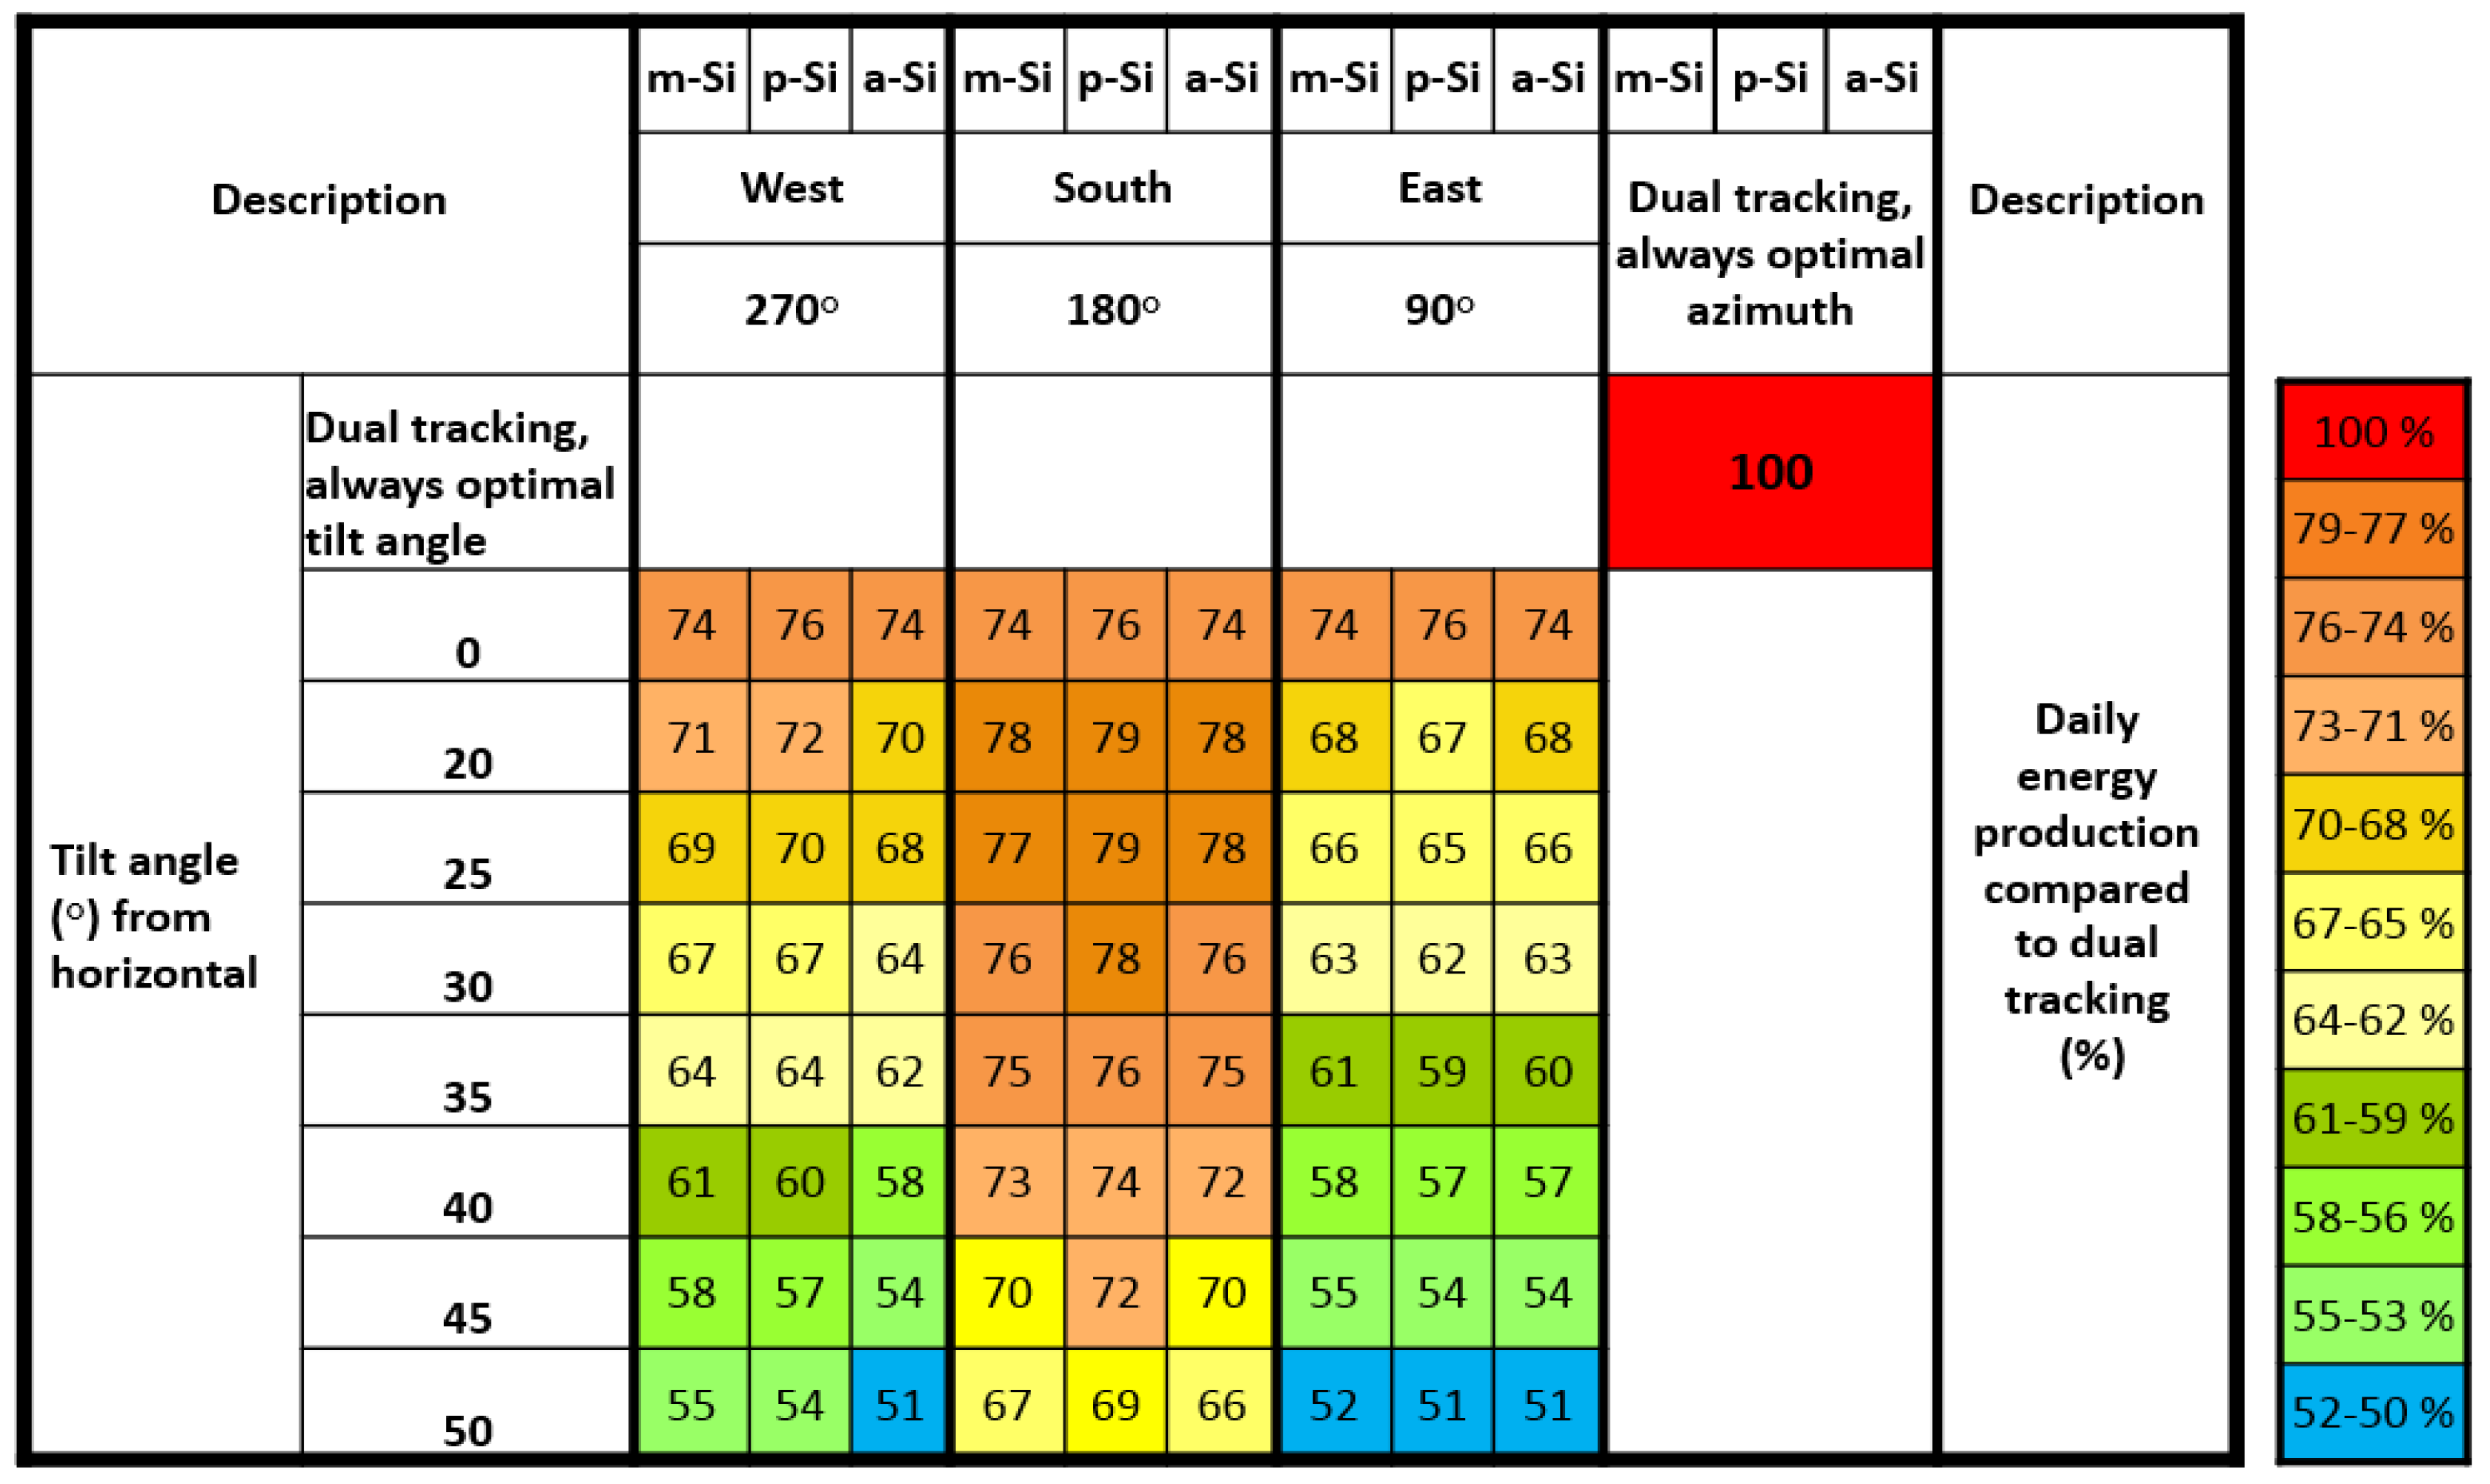
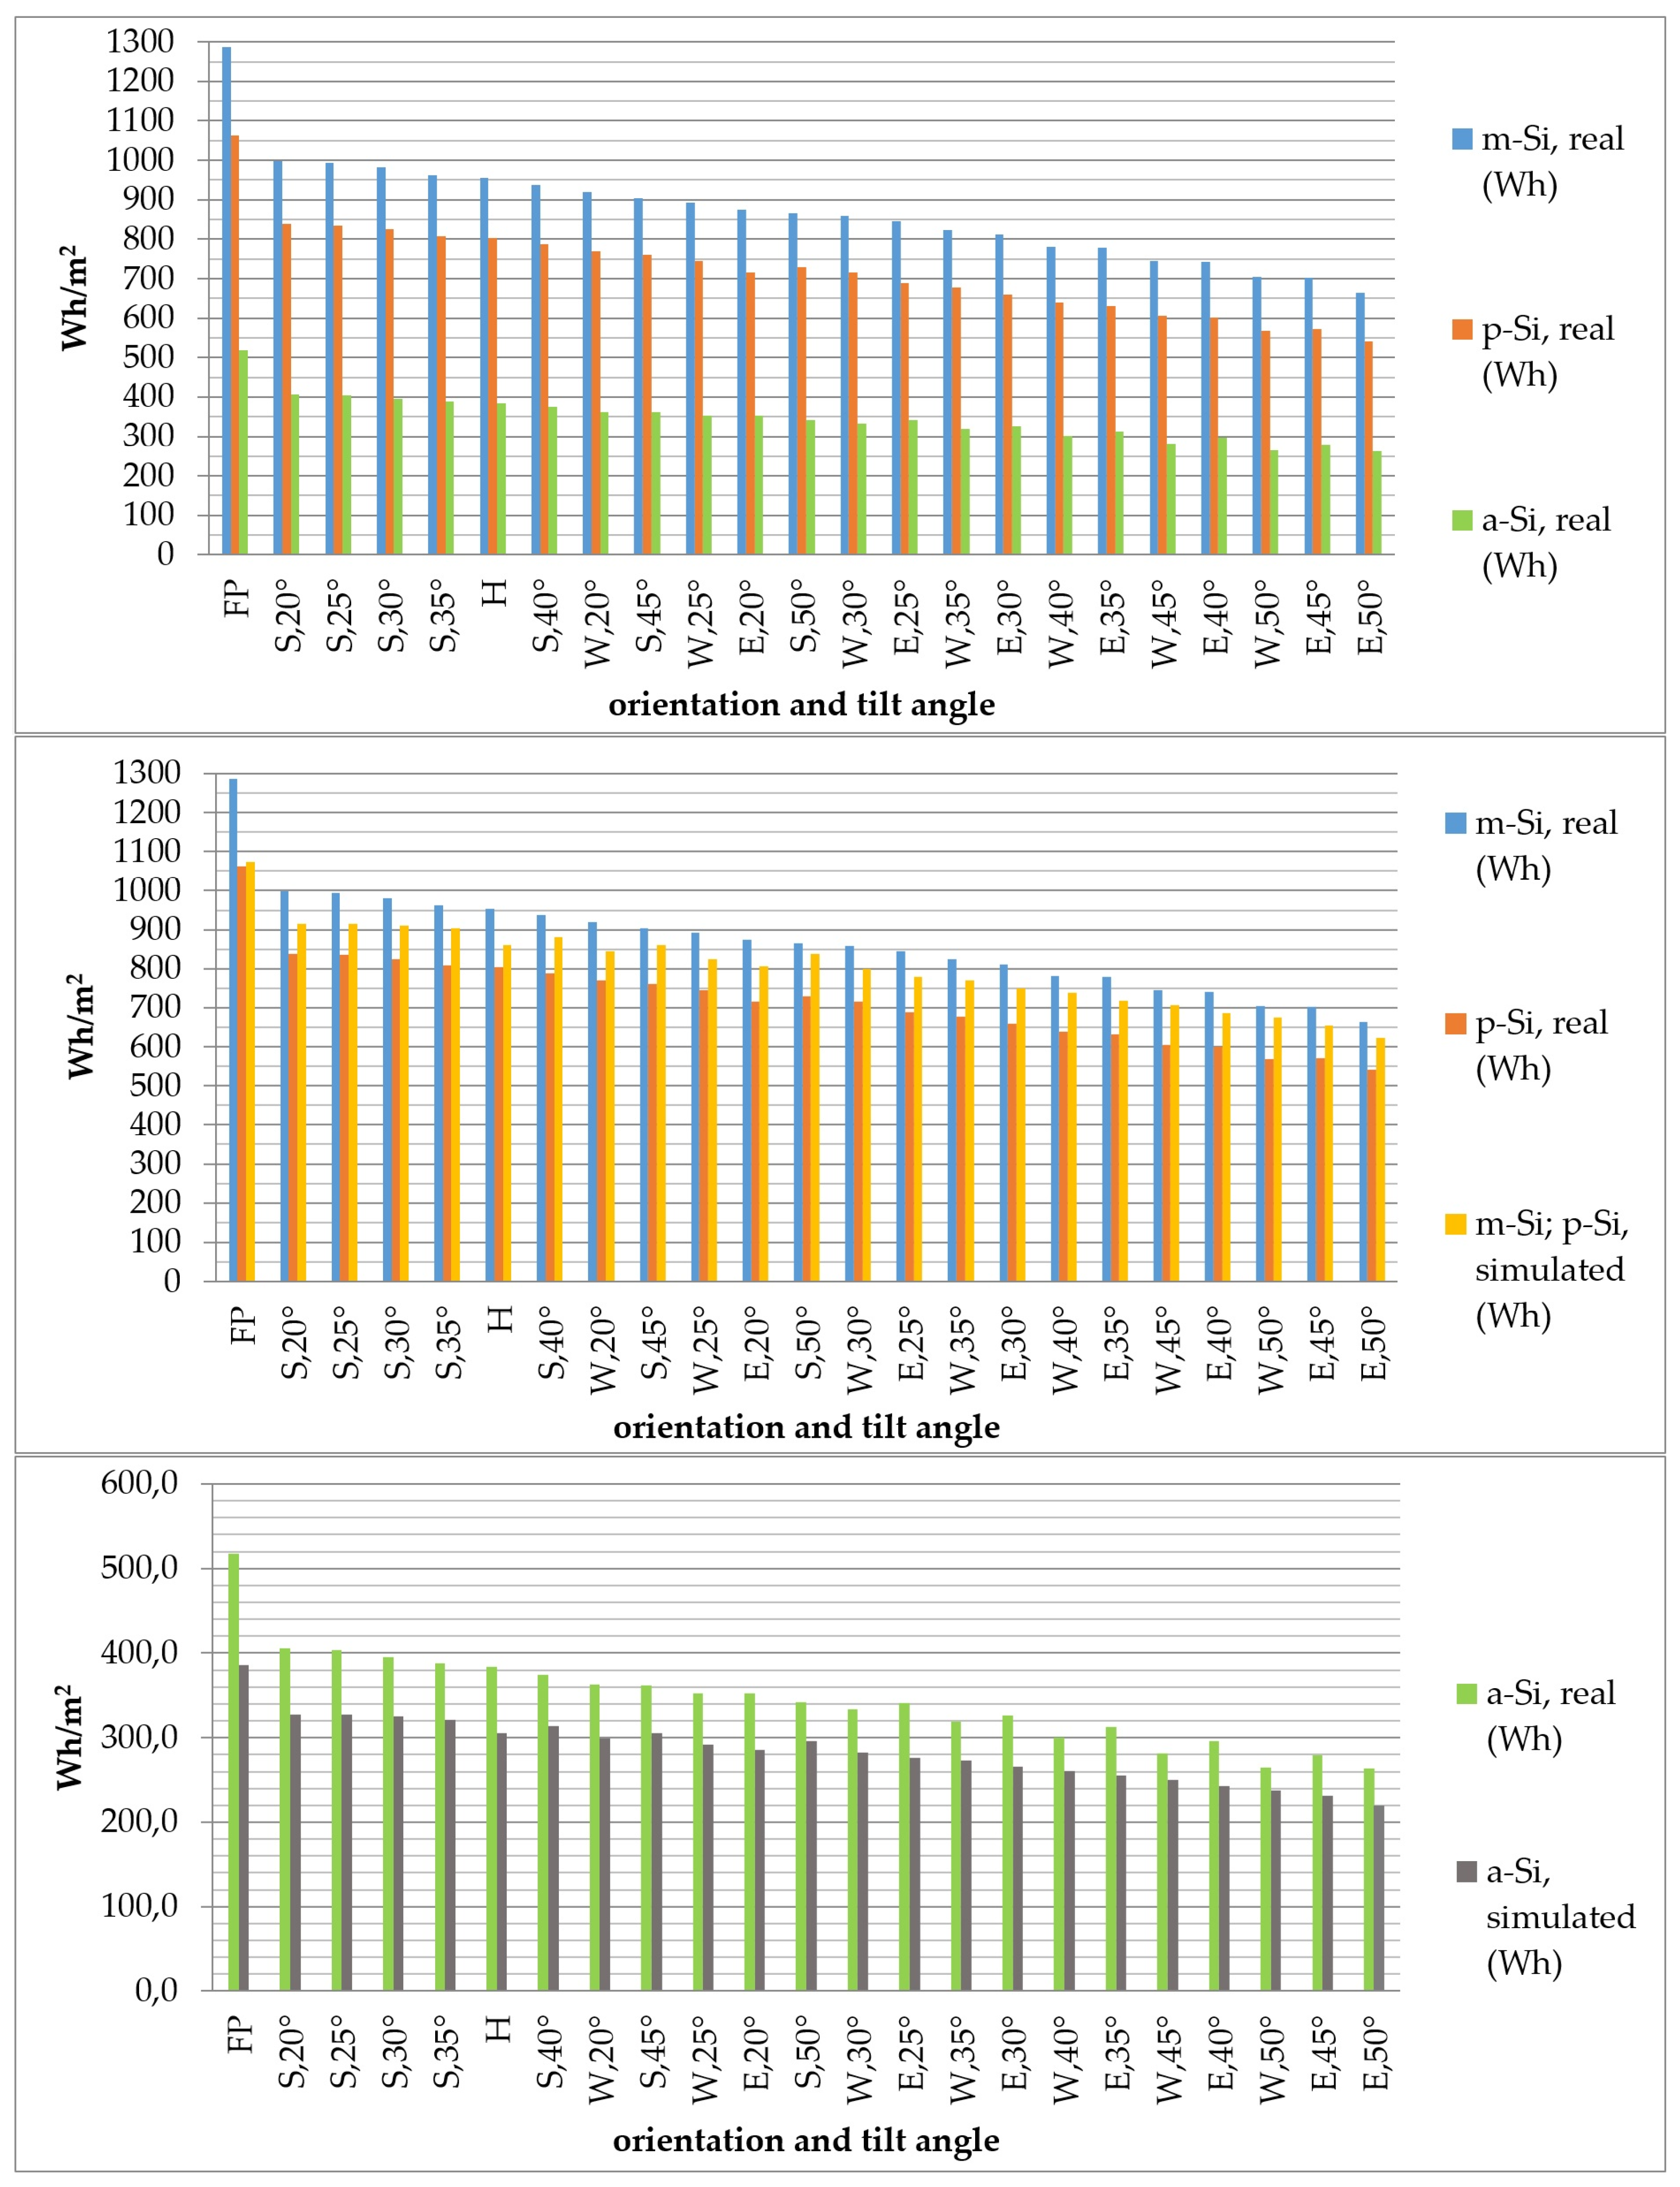
3.2. The Influence of the Dual-Axis Sun-Tracking System in Terms of Real and Simulated Energy Yield

Based on our measurements, the real extra output of the dual-axis tracking system compared to other (non-tracking) solar modules, close to the summer solstice (see Figure 6, Figure 7 and Figure 8), is as follows:
  • relative to a southern orientation of 50° (maximum measured tilt angle): 47.8% more from the m-Si technology, 52.5% more from the p-Si technology, 49.7% more from the m-Si technology;
  • relative to a southern orientation of 35° (ideal yearly fixed tilt angle): 33.7% more from the m-Si technology, 31.4% more from the p-Si technology, 33.6% more from the m-Si technology;
  • the difference is less with a southern orientation of 20° (summer solstice ideal for fixed tilt angle) 28.9% (m-Si), 26.8% (p-Si), 27.6% (a-Si).
On average, the change in the generation of real and simulated energy, taking into account all orientations and tilt angles during the period was as follows:
  • m-Si (real) versus p-Si (real) technology: +21%;
  • m-Si (real) versus m-Si; p-Si (simulated) technology: +7.5%;
  • p-Si (real) versus m-Si; p-Si (simulated) technology: −11%;
     
  • m-Si (real) versus a-Si (real) technology: +152.2%;
  • m-Si (real) versus a-Si (simulated) technology: +203%;
     
  • p-Si (real) versus a-Si (real) technology: +108.4%;
  • p-Si (real) versus a-Si (simulated) technology: +150.2%;
     
  • a-Si (real) versus a-Si (simulated) technology: +19.9%.
All of these results are largely consistent with Chang (2009), Koussa et al. (2011), Vokas et al. (2015), Eke-Senturk (2012), Vickery-Baron (2015) De Simón-Martín et al. (2014) and Maatallah et al. (2011) [49,50,51,53,58,59], who found a surplus of 20–40%, with the observation that the increase in the fixed tilt angle and a better orientation in this latitude and summer range greatly increase the efficiency of the sun-tracking technologies. Using measurement data, three photovoltaic technologies can be compared in order to discover how much less energy is produced in summer with dual-axis tracking at a favorable 20° tilt angle compared to the 35° or a 50° tilt angle.
From an economic point of view, it is important to understand how PV technologies compare with each other in efficient daily energy production in similar conditions. The measurement and simulated results show how effective the technologies are in comparison with each other, a result which can, for example, provide important information on PV power-plant investments when calculating the area required for technology, technology installation and investment costs. The simulated data show less accurate results, proving the importance of real data. Based on simulated data, the tilt angle and orientation showed about 10% more favorable values compared to reality. Differences between real and simulated data would result in a significant difference regarding electricity production in the case of a larger PV power plant (see Figure 6, Figure 7 and Figure 8).
At the time of the summer, everything considered, the eastern and western orientations and tilt angles reduce real and simulated energy production compared to southern orientation on average, as follows (Figure 8):
  • m-Si technology (real), western orientation: −13.8%;
  • p-Si technology (real), western orientation: −15.4%;
  • m-Si, p-Si technology (simulated), western orientation: −13.9%;
     
  • a-Si technology (real), western orientation: −17.1%;
  • a-Si technology (simulated), western orientation: −14.4%;
     
  • m-Si technology (real), eastern orientation: −18.5%;
  • p-Si technology (real), eastern orientation: −21.1%;
  • m-Si, p-Si technology (simulated), eastern orientation: −19.3%;
     
  • a-Si technology (real), eastern orientation: −18.6%;
  • a-Si technology (simulated), eastern orientation: −19.8%.
The results of examining the eastern and western orientations reveal that the amount of electricity produced can be altered not just by the PV technology, but by the orientation as well. The most commonly used technological data shows how much loss can be expected when the sun is high. In special cases, only eastern- or western-orientated photovoltaic systems can be constructed when the problem of choosing the optimal technology emerges alongside the problem of energy loss. The western orientation based on real data is 4.7% more effective applying m-Si solar modules, 5.7% with p-Si, and 1.5% with a-Si solar modules. The simulated data show only a 5.4% improvement for all three technologies, which is less accurate compared to real data. When installing on a roof, if the roof surface is of sufficient size but is orientated east–west, installation on the eastern side can be considered, because from an economic point of view the investment cost of an amorphous silicon photovoltaic system is more advantageous based on real data. Measurements have shown that the a-Si technology is less sensitive to east–west orientation compared to simulated data, and to crystalline technologies.
Consequently, in the absence of a south-facing roof, the western orientation is more suited to the summer solstice. The least sensitive technology to eastern and western orientation based on real data is a-Si, followed by m-Si and then p-Si.
During our research, we examined whether the specific real energy production of each solar module is really different from the others at all orientations and tilt angles. Statistical variance analysis (ANOVA) has proven that the daily average specific energy production of three different solar modules is significantly different (p = 0.000), i.e., different solar energy technologies have a different impact on their specific energy production.
Table 3 shows that the condition for standard deviation homogeneity is met (p = 0.162) in the case of the dual-axis tracking system, and in the other cases there is no variance homogeneity (p < 0.05). Table 3 shows the pairwise comparison of solar modules based on their average specific energy generation. It can be seen that monocrystalline-polycrystalline, monocrystalline-amorphous and amorphous-polycrystalline solar modules also differ significantly in terms of their average specific energy generation (p = 0.000) in the case of the dual-axis tracking system.
In the southern orientation, in all the three solar pairs, we found a significant difference in the average specific energy production (p = 0.000).
In the eastern orientation, there was no significant difference between the monocrystalline–polycrystalline solar modules (the p value exceeded 0.05, in Table 3), while the other two pairs of solar modules experienced a significant difference (p = 0.000).
At the 40–50° tilt angle of the western orientation, we also did not find any significant difference between the specific energy production of monocrystalline–polycrystalline solar modules (bold in Table 3), while in the case of the other degrees, and in all the tilt angles there was a significant difference between the monocrystalline–amorphous and amorphous–polycrystalline solar energy.
Modules bold are those where p > 0.05, i.e., there is no significant difference between the energy output of the two solar modules under comparison

4. Conclusions

Most of the scientific publications have investigated under operating conditions only a few tilt angle-orientation settings at one time (simultaneously), and typically in relation to one technology. We did not find any studies in the international literature that tested at least three PV technologies together (simultaneously) at the same site in terms of dual-axis tracking and at least 4 orientations (east, west, south, horizontal), with energy changes (changing energy production) at 5° intervals and with simulated data. For proper economic or energy production calculations and modeling, it is recommended that as many measurements as possible of the same type are carried out across geographic latitudes, as today’s modeling/forecasting systems are inaccurate. Because of this, the role of data measured in real weather conditions is indispensable since there are no reliable, measured and comparative data for such measurement conditions.
In this experiment, we have found that the most energy can be recovered using mono- and polycrystalline and amorphous PV technology on a sunny summer day (7 June 2016, 9:00 to 18:00) by keeping the solar modules in the focus of the sun (i.e., sun-tracking). If we do not have the option of sun-tracking with the solar modules, i.e., we are dealing with fixed solar modules, then in the case of a sunny summer day, a 20° tilt angle facing south gives the highest energy output. In the case of east or west orientation, the 20° tilt angle is also the most favorable in this period.
During our tests in Hungary carried out at the time of the summer solstice, for the dual-axis tracking system and the different solar modules with different orientations and tilt angles per unit area (1 m2), the southern orientation reached its maximum energy production at 20°, compared to an annual average ideal tilt of 35°. In terms of real energy production, in a unit (1 m2) area with the dual-axis tracking system, m-Si technology is generally the more effective, p-Si technology is the second most effective, while m-Si technology is 21% more effective than p-Si technology, and could be regarded the least effective.
The results of analyzing the eastern and western orientations reveal that the amount of real energy produced is altered not just by the orientation, but also by the technology. Consequently, in the absence of a south-facing roof, the western orientation is more ideal close to the summer solstice. The least sensitive technology to eastern and western orientation is a-Si, followed by m-Si and then p-Si.
This research answers the question of optimum orientation, also taking into account the solar module type. Based on simulated data, the tilt angle and orientation showed about 10% more favorable values compared to reality. Our results can only be used to estimate the yield and revenue surplus; a sun-tracking system comes with greater energy and investment demands, whose return is primarily dependent on current technology, electricity prices, and the weather of that year, and also on the amortization and running costs of the tracking system. It can be stated in general that less favorable technical parameters (tilt angles outside the 20–50° range, non-southern orientation, polycrystalline or amorphous silicon solar modules) enhance the efficiency of the sun-tracking systems. The precise definition of the specific energy production of the three technologies allows us to carry out calculations of the cost of investment, the expected future financial return on investment for the photovoltaic systems, and to choose the most economically favorable PV system in the given circumstances. Our results can be interesting, especially for PV system designers, operators, investors and grid-operators.

Acknowledgments

The research was financed by the Higher Education Institutional Excellence Programme of the Ministry of Human Capacities in Hungary, within the framework of the 4th thematic programme of the University of Debrecen.

Author Contributions

Henrik Zsiborács conceived, designed and performed the experiments. All authors contributed equally in the analysis of the data and the writing and revision of the manuscript.

Conflicts of Interest

The authors declare no conflict of interest.

References

  1. Hosenuzzaman, M.; Rahim, N.A.; Selvaraj, J.; Hasanuzzaman, M.; Malek, A.B.M.A.; Nahar, A. Global prospects, progress, policies, and environmental impact of solar photovoltaic power generation. Renew. Sustain. Energy Rev. 2015, 41, 284–297. [Google Scholar] [CrossRef]
  2. Roth, W. General concepts of photovoltaic power supply systems. Fraunhofer Inst. Sol. Energy Syst. ISE 2005, 1–247. [Google Scholar]
  3. Kumar Sahu, B. A study on global solar PV energy developments and policies with special focus on the top ten solar PV power producing countries. Renew. Sustain. Energy Rev. 2015, 43, 621–634. [Google Scholar] [CrossRef]
  4. Guney, M.S. Solar power and application methods. Renew. Sustain. Energy Rev. 2016, 57, 776–785. [Google Scholar] [CrossRef]
  5. International Energy Agency. Technology Roadmap Solar Photovoltaic Energy, 2014 ed.; International Energy Agency: Paris, France, 2014; pp. 1–60. Available online: https://www.iea.org/publications/freepublications/publication/TechnologyRoadmapSolarPhotovoltaicEnergy_2014edition.pdf (accessed on 16 April 2018).
  6. REN21. Renewable Energy Policy Network for the 21st Century Renewables 2015 Global Status Report; REN21 Secretariat: Paris, France, 2015; pp. 1–251. Available online: http://www.ren21.net/wp-content/uploads/2015/07/REN12-GSR2015_Onlinebook_low1.pdf (accessed on 16 April 2018).
  7. REN21. Renewable Energy Policy Network for the 21st Century Renewables 2016 Global Status Report; REN21 Secretariat: Paris, France, 2016; pp. 1–272. Available online: http://www.ren21.net/wp-content/uploads/2016/05/GSR_2016_Full_Report_lowres.pdf (accessed on 16 April 2018).
  8. Fraunhofer Institute for Solar Energy Systems—ISE. Photovoltaics Report; Fraunhofer ISE: Freiburg, Germany, 2018; pp. 1–45. Available online: https://www.ise.fraunhofer.de/content/dam/ise/de/documents/publications/studies/Photovoltaics-Report.pdf (accessed on 16 April 2018).
  9. REN21. Renewable Energy Policy Network for the 21st Century Renewables 2017 Global Status Report; REN21 Secretariat: Paris, France, 2017; pp. 1–302. Available online: http://www.ren21.net/wp-content/uploads/2017/06/17-8399_GSR_2017_Full_Report_0621_Opt.pdf (accessed on 16 April 2018).
  10. Abbe, G.; Smith, H. Technological development trends in solar-powered aircraft systems. Renew. Sustain. Energy Rev. 2016, 60, 770–783. [Google Scholar] [CrossRef]
  11. Gao, X.-Z.; Hou, Z.-X.; Guo, Z.; Chen, X.-Q. Reviews of methods to extract and store energy for solar-powered aircraft. Renew. Sustain. Energy Rev. 2015, 44, 96–108. [Google Scholar] [CrossRef]
  12. Zamfirescu, C.; Dincer, I. Assessment of a new integrated solar energy system for hydrogen production. Sol. Energy 2014, 107, 700–713. [Google Scholar] [CrossRef]
  13. Chen, Y.; Yu, F.; Liang, S.; Wang, Z.; Liu, Z.; Xiong, Y. Utilization of solar energy in sewage sludge composting: Fertilizer effect and application. Waste Manag. 2014, 34, 2014–2021. [Google Scholar] [CrossRef] [PubMed]
  14. Pandey, A.K.; Tyagi, V.V.; Selvaraj, J.A.; Rahim, N.A.; Tyagi, S.K. Recent advances in solar photovoltaic systems for emerging trends and advanced applications. Renew. Sustain. Energy Rev. 2016, 53, 859–884. [Google Scholar] [CrossRef]
  15. Sharon, H.; Reddy, K.S. A review of solar energy driven desalination technologies. Renew. Sustain. Energy Rev. 2015, 41, 1080–1118. [Google Scholar] [CrossRef]
  16. Khan, J.; Arsalan, M.H. Solar power technologies for sustainable electricity generation—A review. Renew. Sustain. Energy Rev. 2016, 55, 414–425. [Google Scholar] [CrossRef]
  17. Bai, A.; Popp, J.; Balogh, P.; Gabnai, Z.; Pályi, B.; Farkas, I.; Pintér, G.; Zsiborács, H. Technical and economic effects of cooling of monocrystalline photovoltaic modules under Hungarian conditions. Renew. Sustain. Energy Rev. 2016, 60. [Google Scholar] [CrossRef]
  18. Cosme, I.; Cariou, R.; Chen, W.; Foldyna, M.; Boukhicha, R.; Roca i Cabarrocas, P.; Lee, K.D.; Trompoukis, C.; Depauw, V. Lifetime assessment in crystalline silicon: From nanopatterned wafer to ultra-thin crystalline films for solar cells. Sol. Energy Mater. Sol. Cells 2015, 135, 93–98. [Google Scholar] [CrossRef]
  19. Green, M.A.; Emery, K.; Hishikawa, Y.; Warta, W.; Dunlop, E.D. Solar cell efficiency tables (version 48). Prog. Photovoltaics Res. Appl. 2016, 24, 905–913. [Google Scholar] [CrossRef]
  20. Panasonic Corporation. Solar Cell Achieves World’s Highest Energy Conversion Efficiency of 25.6% at Research Level. Available online: http://news.panasonic.com/global/press/data/2014/04/en140410-4/en140410-4.html (accessed on 20 February 2018).
  21. Zsiborács, H.; Pályi, B.; Pintér, G.; Popp, J.; Balogh, P.; Gabnai, Z.; Pető, K.; Farkas, I.; Baranyai, N.H.; Bai, A. Technical-economic study of cooled crystalline solar modules. Sol. Energy 2016, 140. [Google Scholar] [CrossRef]
  22. Zsiborács, H.; Pályi, B.; Baranyai, H.N.; Veszelka, M.; Farkas, I.; Pintér, G. Energy performance of the cooled amorphous silicon photovoltaic (PV) technology. Idojaras 2016, 120, 415–430. [Google Scholar]
  23. ÖKO-HAUS GmbH. Information on the Prices of a-Si Solar Modules, Price Quotation. Available online: https://www.oeko-haus.com/ (accessed on 19 February 2018).
  24. Tyagi, V.V.; Rahim, N.A.A.; Rahim, N.A.; Selvaraj, J.A.L. Progress in solar PV technology: Research and achievement. Renew. Sustain. Energy Rev. 2013, 20, 443–461. [Google Scholar] [CrossRef]
  25. Fraunhofer Institute for Solar Energy Systems ISE. World Record Solar Cell with 44.7% Efficiency. Available online: https://www.ise.fraunhofer.de/en/press-media/press-releases/2013/world-record-solar-cell-with-44-7-efficiency.html (accessed on 20 February 2018).
  26. García-Domingo, B.; Piliougine, M.; Elizondo, D.; Aguilera, J. CPV module electric characterisation by artificial neural networks. Renew. Energy 2015, 78, 173–181. [Google Scholar] [CrossRef]
  27. Renzi, M.; Egidi, L.; Comodi, G. Performance analysis of two 3.5 kWp CPV systems under real operating conditions. Appl. Energy 2015, 160, 687–696. [Google Scholar] [CrossRef]
  28. Talavera, D.L.; Pérez-Higueras, P.; Ruíz-Arias, J.A.; Fernández, E.F. Levelised cost of electricity in high concentrated photovoltaic grid connected systems: Spatial analysis of Spain. Appl. Energy 2015, 151, 49–59. [Google Scholar] [CrossRef]
  29. Dupuis, R.D. Epitaxial growth of III–V nitride semiconductors by metalorganic chemical vapor deposition. J. Cryst. Growth 1997, 178, 56–73. [Google Scholar] [CrossRef]
  30. Kinsey, G.S.; Hebert, P.; Barbour, K.E.; Krut, D.D.; Cotal, H.L.; Sherif, R.A. Concentrator multijunction solar cell characteristics under variable intensity and temperature. Prog. Photovoltaics Res. Appl. 2008, 16, 503–508. [Google Scholar] [CrossRef]
  31. Luque, A.; Andreev, V.M. Concentrator Photovoltaics; Springer: Berlin, Germany, 2007. [Google Scholar]
  32. Martinez, M.; de la Rubia, O.; Rubio, F.; Banda, P. Concentration photovoltaics. In Comprehensive Renewable Energy; Elsevier: New York, NY, USA, 2012; pp. 745–765. [Google Scholar]
  33. Pérez-Higueras, P.; Muñoz, E.; Almonacid, G.; Vidal, P.G. High concentrator photovoltaics efficiencies: Present status and forecast. Renew. Sustain. Energy Rev. 2011, 15, 1810–1815. [Google Scholar] [CrossRef]
  34. CoentrixTM Technology, Coentrix Solar. Technical Information, CX-75 Module. Available online: http://www.renugen.co.uk/concentrix-solar-cx-75-iii/ (accessed on 16 April 2018).
  35. Lőrinczi, I.; Szénásy, I. Increasing the Efficiency of an Experimental Solar Energy Driven Vehicle. 9–13. Available online: https://www.researchgate.net/publication/315799452_INCREASING_THE_EFFICIENCY_OF_AN_EXPERIMENTAL_SOLAR_ENERGY_DRIVEN_VEHICLE (accessed on 16 April 2018).
  36. Rezk, H.; Eltamaly, A.M. A comprehensive comparison of different MPPT techniques for photovoltaic systems. Sol. Energy 2015, 112, 1–11. [Google Scholar] [CrossRef]
  37. Tey, K.S.; Mekhilef, S. Modified incremental conductance MPPT algorithm to mitigate inaccurate responses under fast-changing solar irradiation level. Sol. Energy 2014, 101, 333–342. [Google Scholar] [CrossRef]
  38. Büyükgüzel, B.; Aksoy, M. A current-based simple analog MPPT circuit for PV systems. Turkish J. Electr. Eng. Comput. Sci. 2016, 243906, 3621–3637. [Google Scholar] [CrossRef]
  39. Leyva, R.; Alonso, C.; Queinnec, I.; Cid-Pastor, A.; Lagrange, D.; Martinez-Salamero, L. MPPT of photovoltaic systems using extremum - seeking control. IEEE Trans. Aerosp. Electron. Syst. 2006, 42, 249–258. [Google Scholar] [CrossRef]
  40. Szabó, I. Analysis of an Increased Efficiency Analogue Maximum Performance Tracking Circuit in Solar Power Systems. Ph.D. Thesis, Budapest University of Technology, Budapest, Hungary, 1997. [Google Scholar]
  41. Sullivan, C.R.; Powers, M.J. A High-Efficiency Maximum Power Point Tracker for Photovoltaic Arrays in a Solar-Powered Race Vehicle. In Proceedings of the 24th Annual IEEE Power Electronics Specialist Conference—PESC ’93, Seattle, WA, USA, 20–24 June 1993; pp. 574–580. [Google Scholar]
  42. Masoum, M.A.S.; Dehbonei, H.; Fuchs, E.F. Theoretical and experimental analyses of photovoltaic systems with voltage and current-based maximum power-point tracking. IEEE Trans. Energy Convers. 2002, 17, 514–522. [Google Scholar] [CrossRef]
  43. Liu, Y.-H.; Yang, Z.-Z.; Wang, S.-C.; Huang, J.-W. A Novel Analog MPPT Technique for Low Power Photovoltaic Systems. In Proceedings of the TENCON 2011—2011 IEEE Region 10 Conference, Bali, Indonesia, 21–24 November 2011; pp. 833–837. [Google Scholar]
  44. Mattavelli, P.; Saggini, S.; Orietti, E.; Spiazzi, G. A Simple Mixed-Signal MPPT Circuit for Photovoltaic Applications. In Proceedings of the 2010 Twenty-Fifth Annual IEEE Applied Power Electronics Conference and Exposition (APEC), Palm Springs, CA, USA, 21–25 February 2010; pp. 953–960. [Google Scholar]
  45. Case, M.; Schoeman, J. Minimum component photovoltaic array maximum power point tracker. Vector Electr. Eng. 1999, 4–8. [Google Scholar]
  46. Herrmann, U.; Langer, H.G.; van der Broeck, H. Low Cost DC to AC Converter for Photovoltaic Power Conversion in Residential Applications. In Proceedings of the 24th Annual IEEE Power Electronics Specialist Conference—PESC ’93, Seattle, WA, USA, 20–24 June 1993; pp. 588–594. [Google Scholar]
  47. Schoeman, J.J.; Wyk, J.D. A simplified maximal power controller for terrestrial photovoltaic panel arrays. In Proceedings of the 1982 IEEE Power Electronics Specialists Conference, Cambridge, MA, USA, 14–17 June 1982; pp. 361–367. [Google Scholar] [CrossRef]
  48. Breyer, C.; Schmid, J. Global distribution of optimal tilt angles for fixed tilted PV systems. In Proceedings of the 25th European Photovoltaic Solar Energy Conference and Exhibition/5th World Conference on Photovoltaic Energy Conversion, Valencia, Spain, 6–10 September 2010. [Google Scholar]
  49. Chang, T.P. Output energy of a photovoltaic module mounted on a single-axis tracking system. Appl. Energy 2009, 86, 2071–2078. [Google Scholar] [CrossRef]
  50. Koussa, M.; Cheknane, A.; Hadji, S.; Haddadi, M.; Noureddine, S. Measured and modelled improvement in solar energy yield from flat plate photovoltaic systems utilizing different tracking systems and under a range of environmental conditions. Appl. Energy 2011, 88, 1756–1771. [Google Scholar] [CrossRef]
  51. Vokas, G.A.; Zoridis, G.C.; Lagogiannis, K.V. Single and dual axis PV energy production over Greece: Comparison between measured and predicted data. Energy Procedia 2015, 74, 1490–1498. [Google Scholar] [CrossRef]
  52. Kacira, M.; Simsek, M.; Babur, Y.; Demirkol, S. Determining optimum tilt angles and orientations of photovoltaic panels in Sanliurfa, Turkey. Renew. Energy 2004, 29, 1265–1275. [Google Scholar] [CrossRef]
  53. Eke, R.; Senturk, A. Performance comparison of a double-axis sun tracking versus fixed PV system. Sol. Energy 2012, 86, 2665–2672. [Google Scholar] [CrossRef]
  54. Ismail, M.S.; Moghavvemi, M.; Mahlia, T.M.I. Analysis and evaluation of various aspects of solar radiation in the Palestinian territories. Energy Convers. Manag. 2013, 73, 57–68. [Google Scholar] [CrossRef]
  55. Abdallah, S. The effect of using sun tracking systems on the voltage–current characteristics and power generation of flat plate photovoltaics. Energy Convers. Manag. 2004, 45, 1671–1679. [Google Scholar] [CrossRef]
  56. Quesada, G.; Guillon, L.; Rousse, D.R.; Mehrtash, M.; Dutil, Y.; Paradis, P.-L. Tracking strategy for photovoltaic solar systems in high latitudes. Energy Convers. Manag. 2015, 103, 147–156. [Google Scholar] [CrossRef]
  57. U.S. Energy Information Administration (EIA). Solar Photovoltaic Output Depends on Orientation, Tilt, and Tracking. Available online: https://www.eia.gov/todayinenergy/detail.php?id=18871 (accessed on 20 February 2018).
  58. Vickery, K.; Baron, R.J. Solar photovoltaic energy production comparison of east, west, south-facing and tracked arrays. Can. Soc. Bioeng. 2015, 1–10, Paper No. CSBE15070. [Google Scholar]
  59. De Simón-Martín, M.; Alonso-Tristán, C.; Díez-Mediavilla, M. Performance indicators for sun-tracking systems: A case study in Spain. Energy Power Eng. 2014, 6, 292–302. [Google Scholar] [CrossRef]
  60. Lazaroiu, G.C.; Longo, M.; Roscia, M.; Pagano, M. Comparative analysis of fixed and sun tracking low power PV systems considering energy consumption. Energy Convers. Manag. 2015, 92, 143–148. [Google Scholar] [CrossRef]
  61. Heslop, S.; MacGill, I. Comparative analysis of the variability of fixed and tracking photovoltaic systems. Sol. Energy 2014, 107, 351–364. [Google Scholar] [CrossRef]
  62. Maatallah, T.; El Alimi, S.; Nassrallah, S.B. Performance modeling and investigation of fixed, single and dual-axis tracking photovoltaic panel in Monastir city, Tunisia. Renew. Sustain. Energy Rev. 2011, 15, 4053–4066. [Google Scholar] [CrossRef]
  63. European Commission. JRC Photovoltaic Geographical Information System (PVGIS). Available online: http://re.jrc.ec.europa.eu/pvg_tools/en/tools.html#PVP (accessed on 20 February 2018).
  64. National Renewable Energy Laboratory (NREL). PVWatts Calculator. Available online: http://pvwatts.nrel.gov/ (accessed on 20 February 2018).
  65. Tobe, J. Successful PV Site Evaluation. Available online: https://www.homepower.com/articles/solar-electricity/design-installation/successful-pv-site-evaluation (accessed on 20 February 2018).
  66. Green Power Co. Solar Panels Output Affected by Tilt & Azimuth. Available online: http://greenpowerco.com.au/faqs/solar-panels-output-affected-by-tilt-azimuth/ (accessed on 20 February 2018).
  67. SMA Solar Technology AG. ZMET PV System Profile. Available online: https://www.sunnyportal.com/Templates/PublicPageOverview.aspx?page=96e1e167-9121-42c5-8f5c-bae1923c6a85&plant=a2fa17c6-7f5c-4b13-8a61-3a83f77e5d84&splang=en-US (accessed on 20 February 2018).
  68. SMA Solar Technology AG. SZALONTAI PV System Profile. Available online: https://www.sunnyportal.com/Templates/PublicPageOverview.aspx?plant=152c508b-dca1-48b7-9258-3f32e8574bfa&splang (accessed on 20 February 2018).
  69. Sajtos, L.; Mitev, A. SPSS Research and Data Analysis Manual; Alinea: Budapest, Hungary, 2007. [Google Scholar]
Figure 1. The development of global photovoltaic system capacity (2006–2016) [9].
Sustainability 10 01394 g001
Figure 2. Maximum power-point tracking (MPPT) strategies [38,39,40].
Sustainability 10 01394 g002
Figure 3. The measuring station of the sun-tracking system under examination in Keszthely (upper left, polycrystalline, lower left, amorphous silicon, upper right monocrystalline, lower right concentrated solar module (CPV) technology).
Sustainability 10 01394 g003
Figure 4. Schematic illustration of solar module measuring stations.
Sustainability 10 01394 g004
Figure 5. The accuracy of the setting to the sun’s position can be illustrated with the help of the CPV solar module.
Sustainability 10 01394 g005
Figure 6. The significance of dual-axis tracking, tilt angle and orientation compared to the focus point with the three different photovoltaic technologies, near to the summer solstice (7 June 2016, 9:00–18:00, 100% = m-Si, real: 446.3 Wh; p-Si, real: 386.7 Wh; a-Si, real: 491.9 Wh; m-Si, p-Si simulated: 391 Wh; a-Si, simulated: 367 Wh/50 W nominal output module.)
Sustainability 10 01394 g006
Figure 7. Illustrating the importance of dual-axis tracking, orientation and tilt angle at 3° settings for the three different PV technologies based on real data, near to the summer solstice (7 June 2016, 9:00–18:00, 100% = m-Si: 446.3 Wh, p-Si: 386.7 Wh, a-Si: 491.9 Wh/50 W nominal output module.)
Sustainability 10 01394 g007
Figure 8. Real and simulated energy output projected to 1 m2 for the different solar module types, relating to tilt angle, orientation and sun-tracking (7 June 2016, 9:00–18:00).
Sustainability 10 01394 g008
Table 1. Efficiency rates and market share of mono- (m-Si), polycrystalline (p-Si), and amorphous silicon (a-Si) photovoltaic (PV) modules [5,18,19,20,21,22].
DescriptionMonocrystalline Solar ModulePolycrystalline Solar ModuleAmorphous Silicon Solar Module
Market share (%)85–9010–15
Current maximum efficiency (%)25.620.810.5
Table 2. Electrical and mechanical characteristics of the PV modules examined.
CharacteristicsMonocrystalline Solar ModulePolycrystalline Solar ModuleAmorphous Silicon Solar Module
Country of originGermanyItalyJapan
Manufacturer/DistributerPrevent GmbHEnergiesolaire100Kaneka
ModelSM636-50SL50TU-18PG-EA050
Nominal performance (Pm) (W)505050
Performance tolerance (%)±3%±3%±10%
MPP voltage (Vmp) (V)18.1819.1267
MPP current (Imp) (A)2.82.620.75
Open circuit voltage (Voc) (V)23.1722.6891.8
Short circuit current (Isc) (A)3.082.801.19
Module size (mm): (width × height × depth)510 × 680 × 35545 × 668 × 28960 × 990 × 40
Table 3. The results of the statistical analysis.
NameHomogeneity Analysis, Levene-TestTestm-Si—p-Si (real)m-Si—a-Si (real)p-Si—a-Si (real)
p Value
(p Value)
FP0.162Scheffé test0.0000.0000.000
S200.000Tamhane’s T20.0040.0000.000
S250.000Tamhane’s T20.0050.0000.000
S300.000Tamhane’s T20.0070.0000.000
S350.000Tamhane’s T20.0090.0000.000
S400.000Tamhane’s T20.0120.0000.000
S450.000Tamhane’s T20.0180.0000.000
S500.000Tamhane’s T20.0270.0000.000
E200.000Tamhane’s T20.1030.0000.000
E250.000Tamhane’s T20.1460.0000.000
E300.000Tamhane’s T20.2010.0000.000
E350.000Tamhane’s T20.2490.0000.000
E400.000Tamhane’s T20.3070.0000.000
E450.000Tamhane’s T20.3820.0000.000
E500.000Tamhane’s T20.4260.0000.000
W200.000Tamhane’s T20.0010.0000.000
W250.000Tamhane’s T20.0060.0000.000
W300.000Tamhane’s T20.0260.0000.000
W350.000Tamhane’s T20.0440.0000.000
W400.000Tamhane’s T20.1050.0000.000
W450.000Tamhane’s T20.1530.0000.000
W500.000Tamhane’s T20.1980.0000.000
H0.000Tamhane’s T20.0020.0000.000

