Article

Improving NFC Technology Promotion for Creating the Sustainable Education Environment by Using a Hybrid Modified MADM Model

1
Department of Business and Entrepreneurial Management, Kainan University, No.1, Kainan Rd., Luchu Dist., Taoyuan City 33857, Taiwan
2
Department of Industrial Engineering and Management, National Taipei University of Technology, No. 1, Sec. 3, Chung-Hsiao East Rd., Da’an Dist., Taipei City 10608, Taiwan
3
Graduate Institute of Urban Planning, College of Public Affairs, National Taipei University, No.151, University Rd., San Shia Dist., New Taipei City 23741, Taiwan
*
Author to whom correspondence should be addressed.
Sustainability 2018, 10(5), 1379; https://doi.org/10.3390/su10051379
Submission received: 3 March 2018 / Revised: 24 March 2018 / Accepted: 25 April 2018 / Published: 28 April 2018
(This article belongs to the Section Sustainable Engineering and Science)

Abstract

:
With the growing prevalence of mobile devices, the use of near-field communication (NFC) technology has increased constantly in recent years. Scholars expect NFC technology to be used to develop new campuses with sustainable education environments for safely transferring information or services. In campuses, the decisions to adopt NFC technology considers multiple attribute decision making (MADM) problems, which require multicriteria decision analysis that in turn involves the feedback and interdependence effects among criteria/dimensions. This paper proposes an improvement model that could facilitate NFC technology promotion for creating the sustainable education environment in a campus (Kainan University of Taiwan). Furthermore, in this model, the interdependence and feedback effects among criteria/dimensions, optimal alternative selections, and systematic improvements for NFC technology promotion can be addressed by using a hybrid modified MADM model, which integrating the decision making trial and evaluation laboratory (DEMATEL) method, the DEMATEL-based analytic network process (DANP) method and the modified VlseKriterijumska Optimizacija I Kompromisno Resenje (VIKOR) method. Finally, an empirical case for improving NFC technology promotion in the context of creating the sustainable education environment is presented to prove the proposed model. The results revealed that government policy was the largest driver in NFC technology promotion and the most influential criterion for creating the sustainable education environment, and that alternative C (educational institution) should be the first improvement priority. Furthermore, the comparative results revealed that the proposed method is better than the traditional method because using hybrid modified MADM model can obtain the most realistic performance-gap to innovation and determine the most effective improvement plan towards achieving the aspiration value.

1. Introduction

With the advancement of mobile devices such as smart phones and tablet computers, the application of near-field communication (NFC) technology has been increasing in recent years. NFC is a short-distance wireless technology for transferring data without visible contact [1]. Scholars expect NFC technology to be used in developing smart campuses with best educational environments for safely transferring information or services [2]. To develop an improving model of NFC technology promotion for creating such a sustainable education environment, campuses will need to implement an effective NFC technology environment for satisfying teaching quality, resource control and management needs towards solving the problems of low birthrate in Taiwan and reaching the aspiration value. Simon [3] obtained the Nobel Prize in Economics in 1978 for his work incorporating the basic “aspiration value” concept. The decisions related to the adoption of NFC technology are inherently multiple attribute decision making (MADM) issues, and are of strategic importance for campuses. MADM methods can assist decision-makers to understand value judgments in assessment and information fusions among criteria/dimensions [4,5,6,7,8,9,10,11,12,13,14,15]. Many studies have examined NFC-related methods [1,2,16,17], but these studies have assumed that the relations of criteria/dimensions are hierarchical and independent; in real-world situations, the relationships among criteria/dimensions are often interdependent effects.
To resolve this problem and enable the development of the sustainable education environment, this study proposes a hybrid modified MADM model. This model utilizes the decision making trial and evaluation laboratory (DEMATEL) method to address the interrelationships among criteria/dimensions, and thereby build an influence network relation map (INRM) that can aid decision-makers to assess the complex relationships among criteria/dimensions of the determinants related to NFC technology promotion. The DEMATEL method incorporating the basic concept of the analytic network process (ANP) [18] yields the DEMATEL-based analytic network process (called “DANP”) method, which is utilized to conduct feedback and dependence problems and thereby determine influence weights of the DANP. The modified VlseKriterijumska Optimizacija I Kompromisno Resenje (VIKOR) method can be utilized to calculate performance-gaps by weighting the influence weights to address the conflicting problem among criteria/dimensions; specifically, the modified VIKOR method are utilized to identify how to prioritize the improvement and decrease the performance-gaps in each of the alternatives, which facilitates achieving the INRM-based aspiration value. This differs from the traditional VIKOR approach, in which the maximal and minimal (“max–min”) values of existing alternatives in each criterion performance are adopted as the benchmark for evaluating the performance-gaps. By contrast, in the modified VIKOR method, the aspiration value and worst value (called “aspiration–worst”) are adopted as the benchmark, thereby avoiding simply selecting the most favorable option from among inferior choices at the INRM-based aspiration value. We must identify the sources of cause–effect problems to avoid stop-gap measures, i.e., a systematic approach to problem-solving is required. Thus, we propose a hybrid modified MADM model, which campuses can use not only to perform ranking and selection, but also to perform systematic performance improvement towards achieving the aspiration level (because the traditional concept of “max–min” can only perform ranking and selection, but cannot perform performance improvement) of NFC technology promotion plans. Ultimately, Kainan University (KNU) campus of Taiwan as an empirical case for improving NFC technology promotion in the context of creating the sustainable education environment is examined to prove the proposed hybrid modified MADM model that can effectively determine the performance improvement strategy for achieving the best sustainable development.
The rest of this paper is arranged as follows. Section 2 discusses the literature on the adoption of NFC technology in sustainable campuses and the selection attributes for adopting NFC technology. Section 3 introduces a hybrid modified MADM model for exploring and improving NFC technology promotion for creating the sustainable education environment. Section 4 using KNU campus as example shows an empirical case study analysis to explain how a hybrid modified MADM model can aid decision-makers to select and improve the best NFC technology promotion process for sustainable education environment, and then analyzes the results. Ultimately, conclusions and related remarks are described in Section 5.

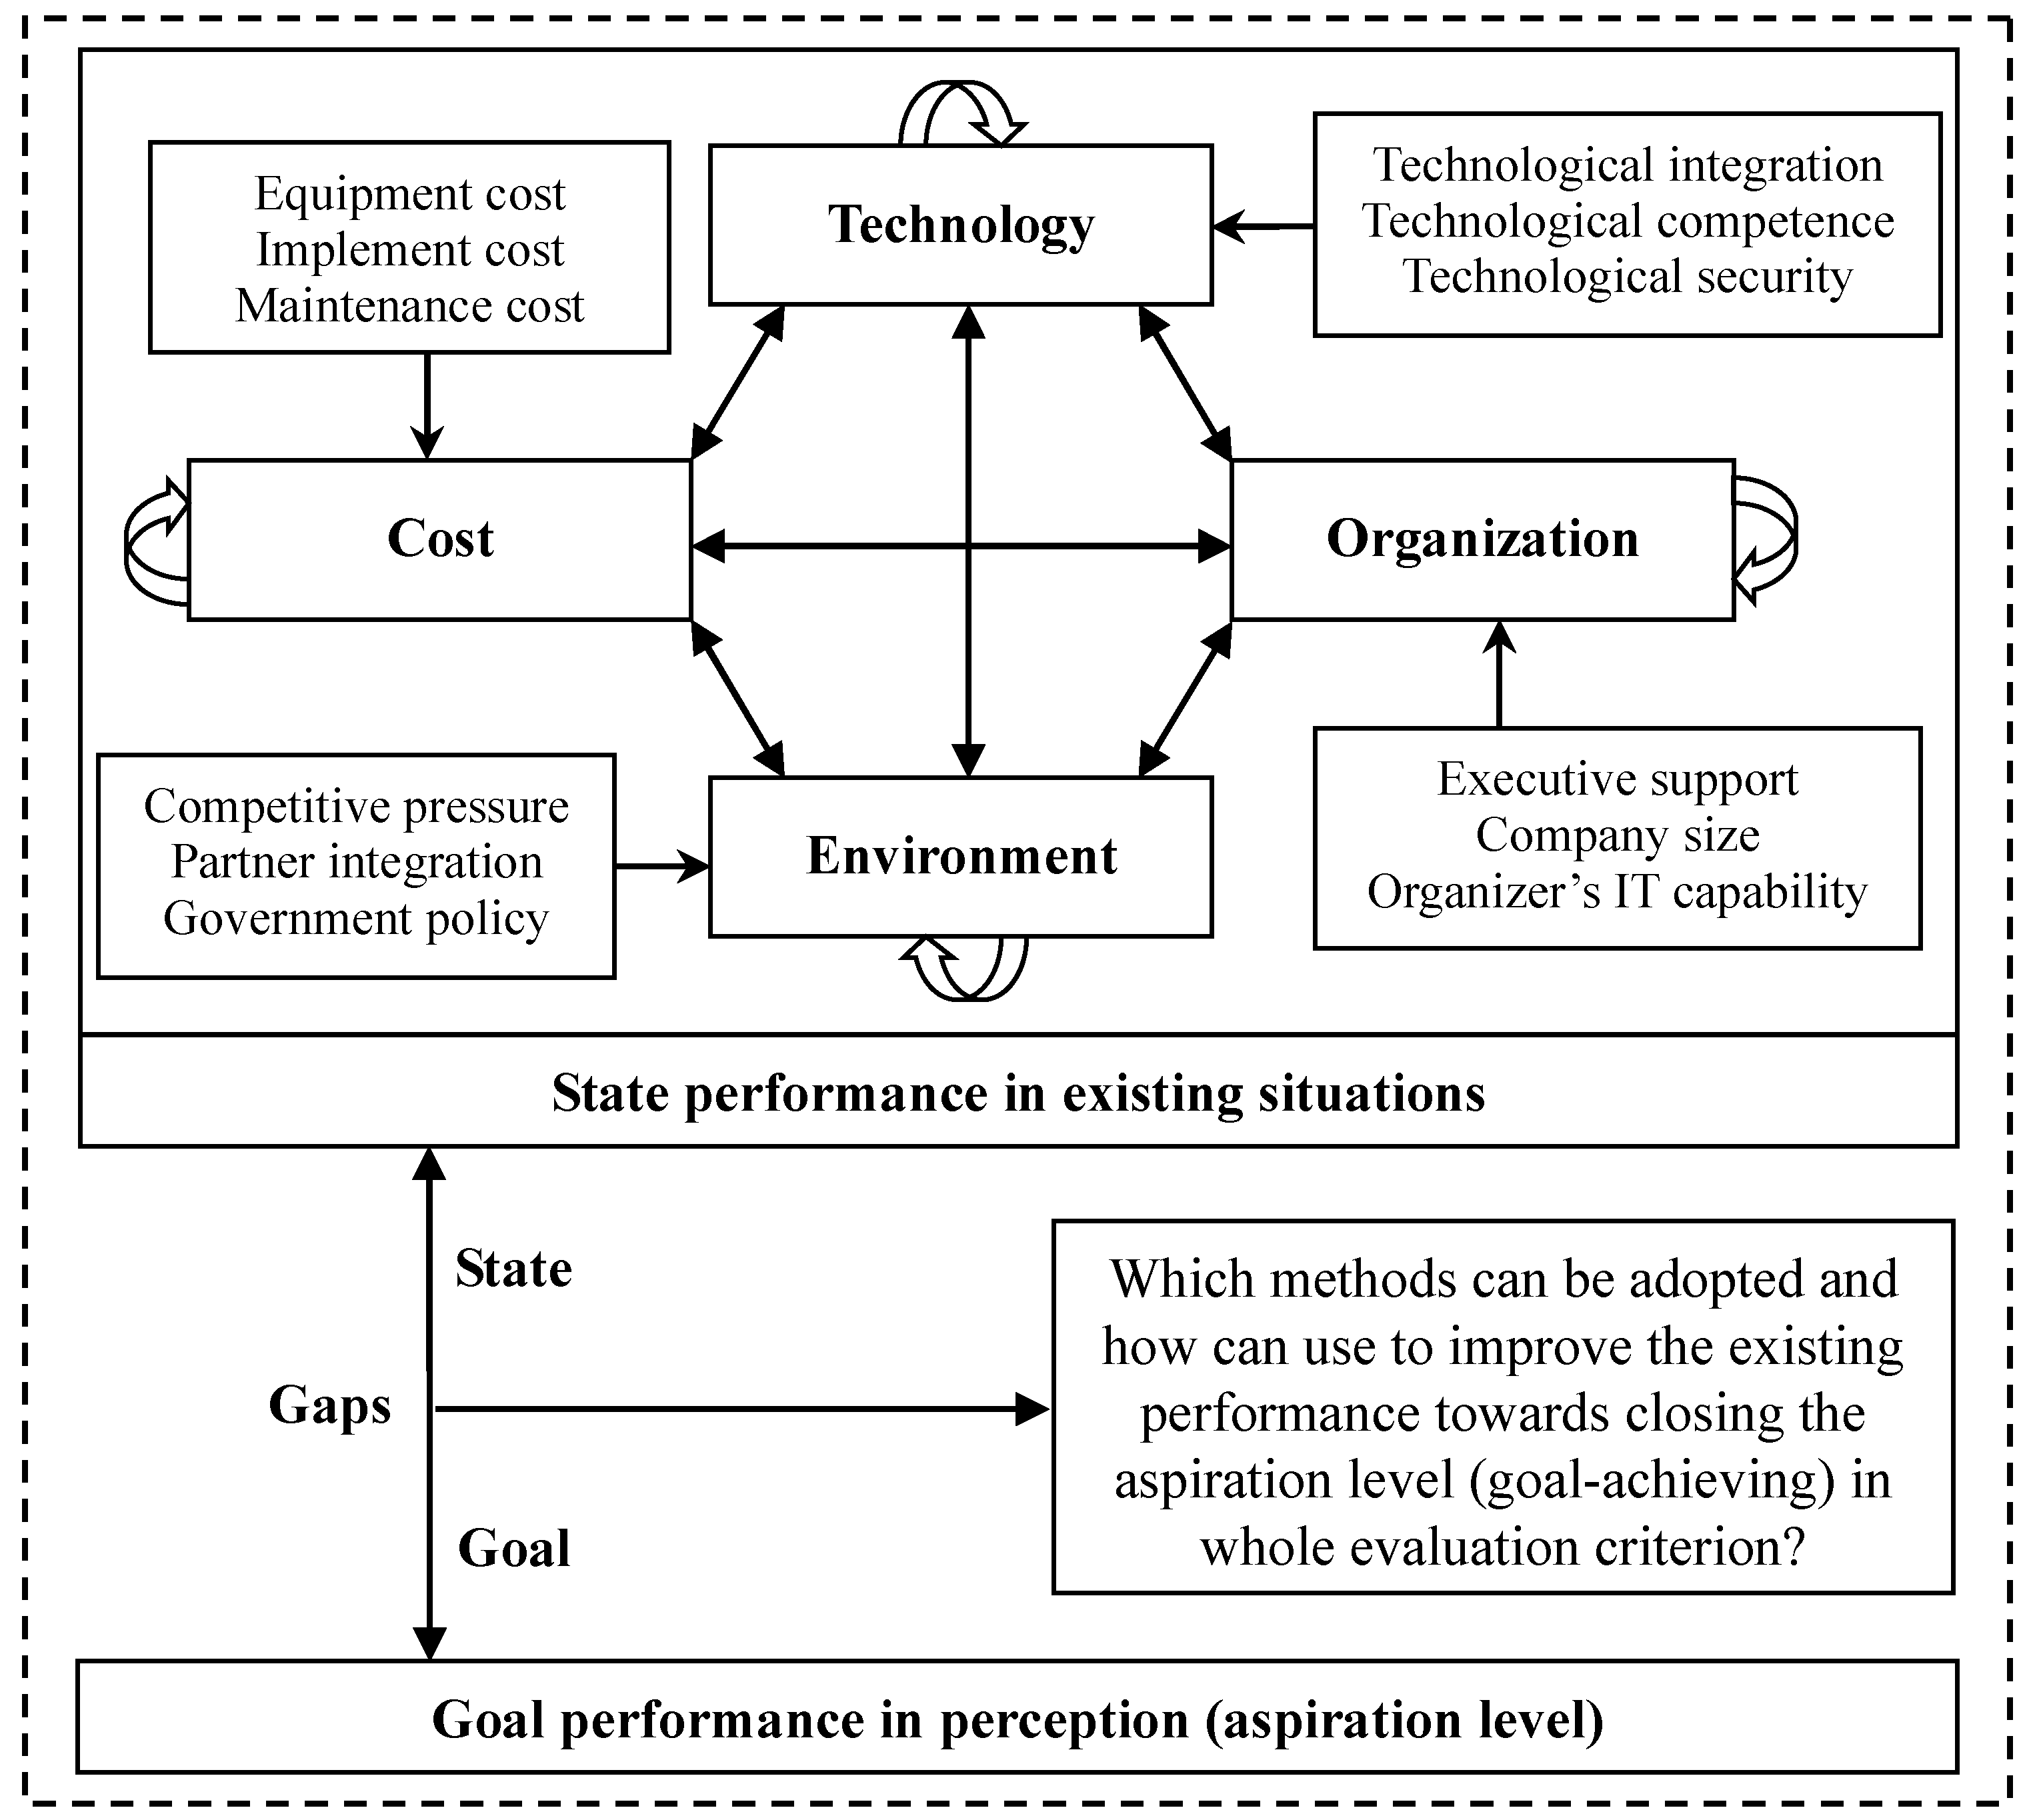
2. Attributes for Evaluating NFC Technology Promotion in Campuses

This section investigates the NFC technology promotion process, compares various assessment frameworks, and identifies possible attributes influencing the NFC technology promotion process in sustainable campuses. Because of the lack of prior study on the attributes used in assessing NFC technology promotion, this study extends on a general assessment framework used for other technology and contexts (i.e., radio-frequency identification; RFID) and collects four dimensions and 12 criteria for examining the NFC technology promotion in KNU campuses, as shown in Figure 1 [8].

2.1. NFC Technology

NFC is a wireless technology of short-range that was developed from RFID. NFC technology enables secure and convenient short-range communication between mobile devices, and can be used for various services such as payment and ticketing as well as for smart environment and educational service applications [19]. Coskun et al. [19] also suggested that various implementations of NFC services in universities can be seen as creating smart environments for students as well as providing efficient workforce management and easier administration services for the staff. Such applications include photocopy services, identification, payment services in university cafes and restaurants, and payment for sport facilities. The technology could also be used for teaching services, resource control and management services, disseminating information, enabling access to services, interactive learning, attendance supervision, and examination systems. Shen et al. [2] reported that NFC technology enables smart classroom system innovation by automating attendance management, locating students, delivering real-time feedback, and providing interactive learning platforms. Pesonen and Horster [1] indicated that NFC has a faster setup time, easier usability, and a superior consumer experience compared with similar technologies such as Bluetooth and RFID (i.e., NFC is focused on interaction). Ok et al. [20] listed several benefits of NFC: first, NFC is compatible with existing RFID infrastructure; second, NFC is highly user-friendly; third, the short transmission range provides reliable security.

2.2. Literature on the Attributes Influencing NFC Technology Promotion

Tornatzky and Fleischer [21] proposed the Technology, Organization and Environment (called TOE framework) for examining the adoption of technological innovations such as NFC and RFID. Brown and Russell [22] collected the data of six retailers to identify the attributes of influencing NFC technology promotion in retail by using the TOE framework. In addition to the TOE framework, the high technology expenditure such as the hardware and software costs can also affect the RFID adoption [8,23]. Lu et al. [8] used four dimensions of Technology, Organization, Environment, and Cost (called TOEC framework) and 13 criteria to improve RFID adoption in the healthcare industry. Similarly, this study adopts the TOEC framework as the four dimensions and 12 criteria of our research framework. The attributes are discussed below.

2.2.1. Technology Dimension

Technological dimensions are also called innovation features in some studies on organizational adoption processes [24]. Technological integration, technological competence and technological security have been suggested to be crucial to NFC or RFID adoption [8,25,26] and are used in our research framework. Technological integration can reduce the complexity and enhance the efficiency of information systems involving NFC or RFID. Technological competence, such as competence in using NFC or RFID applications, can be instilled in an organization by providing a platform for an information technology (IT) system. Technological security is the degree of safety for exchange data and online transactions on an Internet platform.

2.2.2. Organization Dimension

Orlikowski [27] reported that the characteristics of an organization aiming to implement a new technology are very related to the adoption process. Some studies have supported this finding with regard to NFC or RFID adoption, identifying potentially influential criteria such as executive support, company size and the organizer’s IT capabilities [8,24,25,26]. Executives substantially influence the NFC or RFID adoption process because they typically lead to wider support and commitment for the adoption project within their organization. A large company size enables diverse resources to be used in assessing and determining the technology required for profit. For an organization to possess sufficient IT capabilities, such as the capability to manage NFC projects, it requires extensive IT expertise in addressing implementation challenges.

2.2.3. Environment Dimension

Orlikowski [27] emphasized the effect and role of the external environment in the organizational decision to adopt a new technology. Government policy, partner integration and competitive pressure are regarded as the most crucial external criteria [8,24,25,26]. Government policies have a positive effect on IT diffusion. Partner integration is the degree to which the suppliers and customers of a company are willing and ready to carry out commercial activities by utilizing NFC or RFID. With the expansion of competitive pressure, companies may feel the need to attain a competitive advantage through innovations that involve adopting NFC or RFID, which enable accurate data collection and have a high operation efficiency.

2.2.4. Cost Dimension
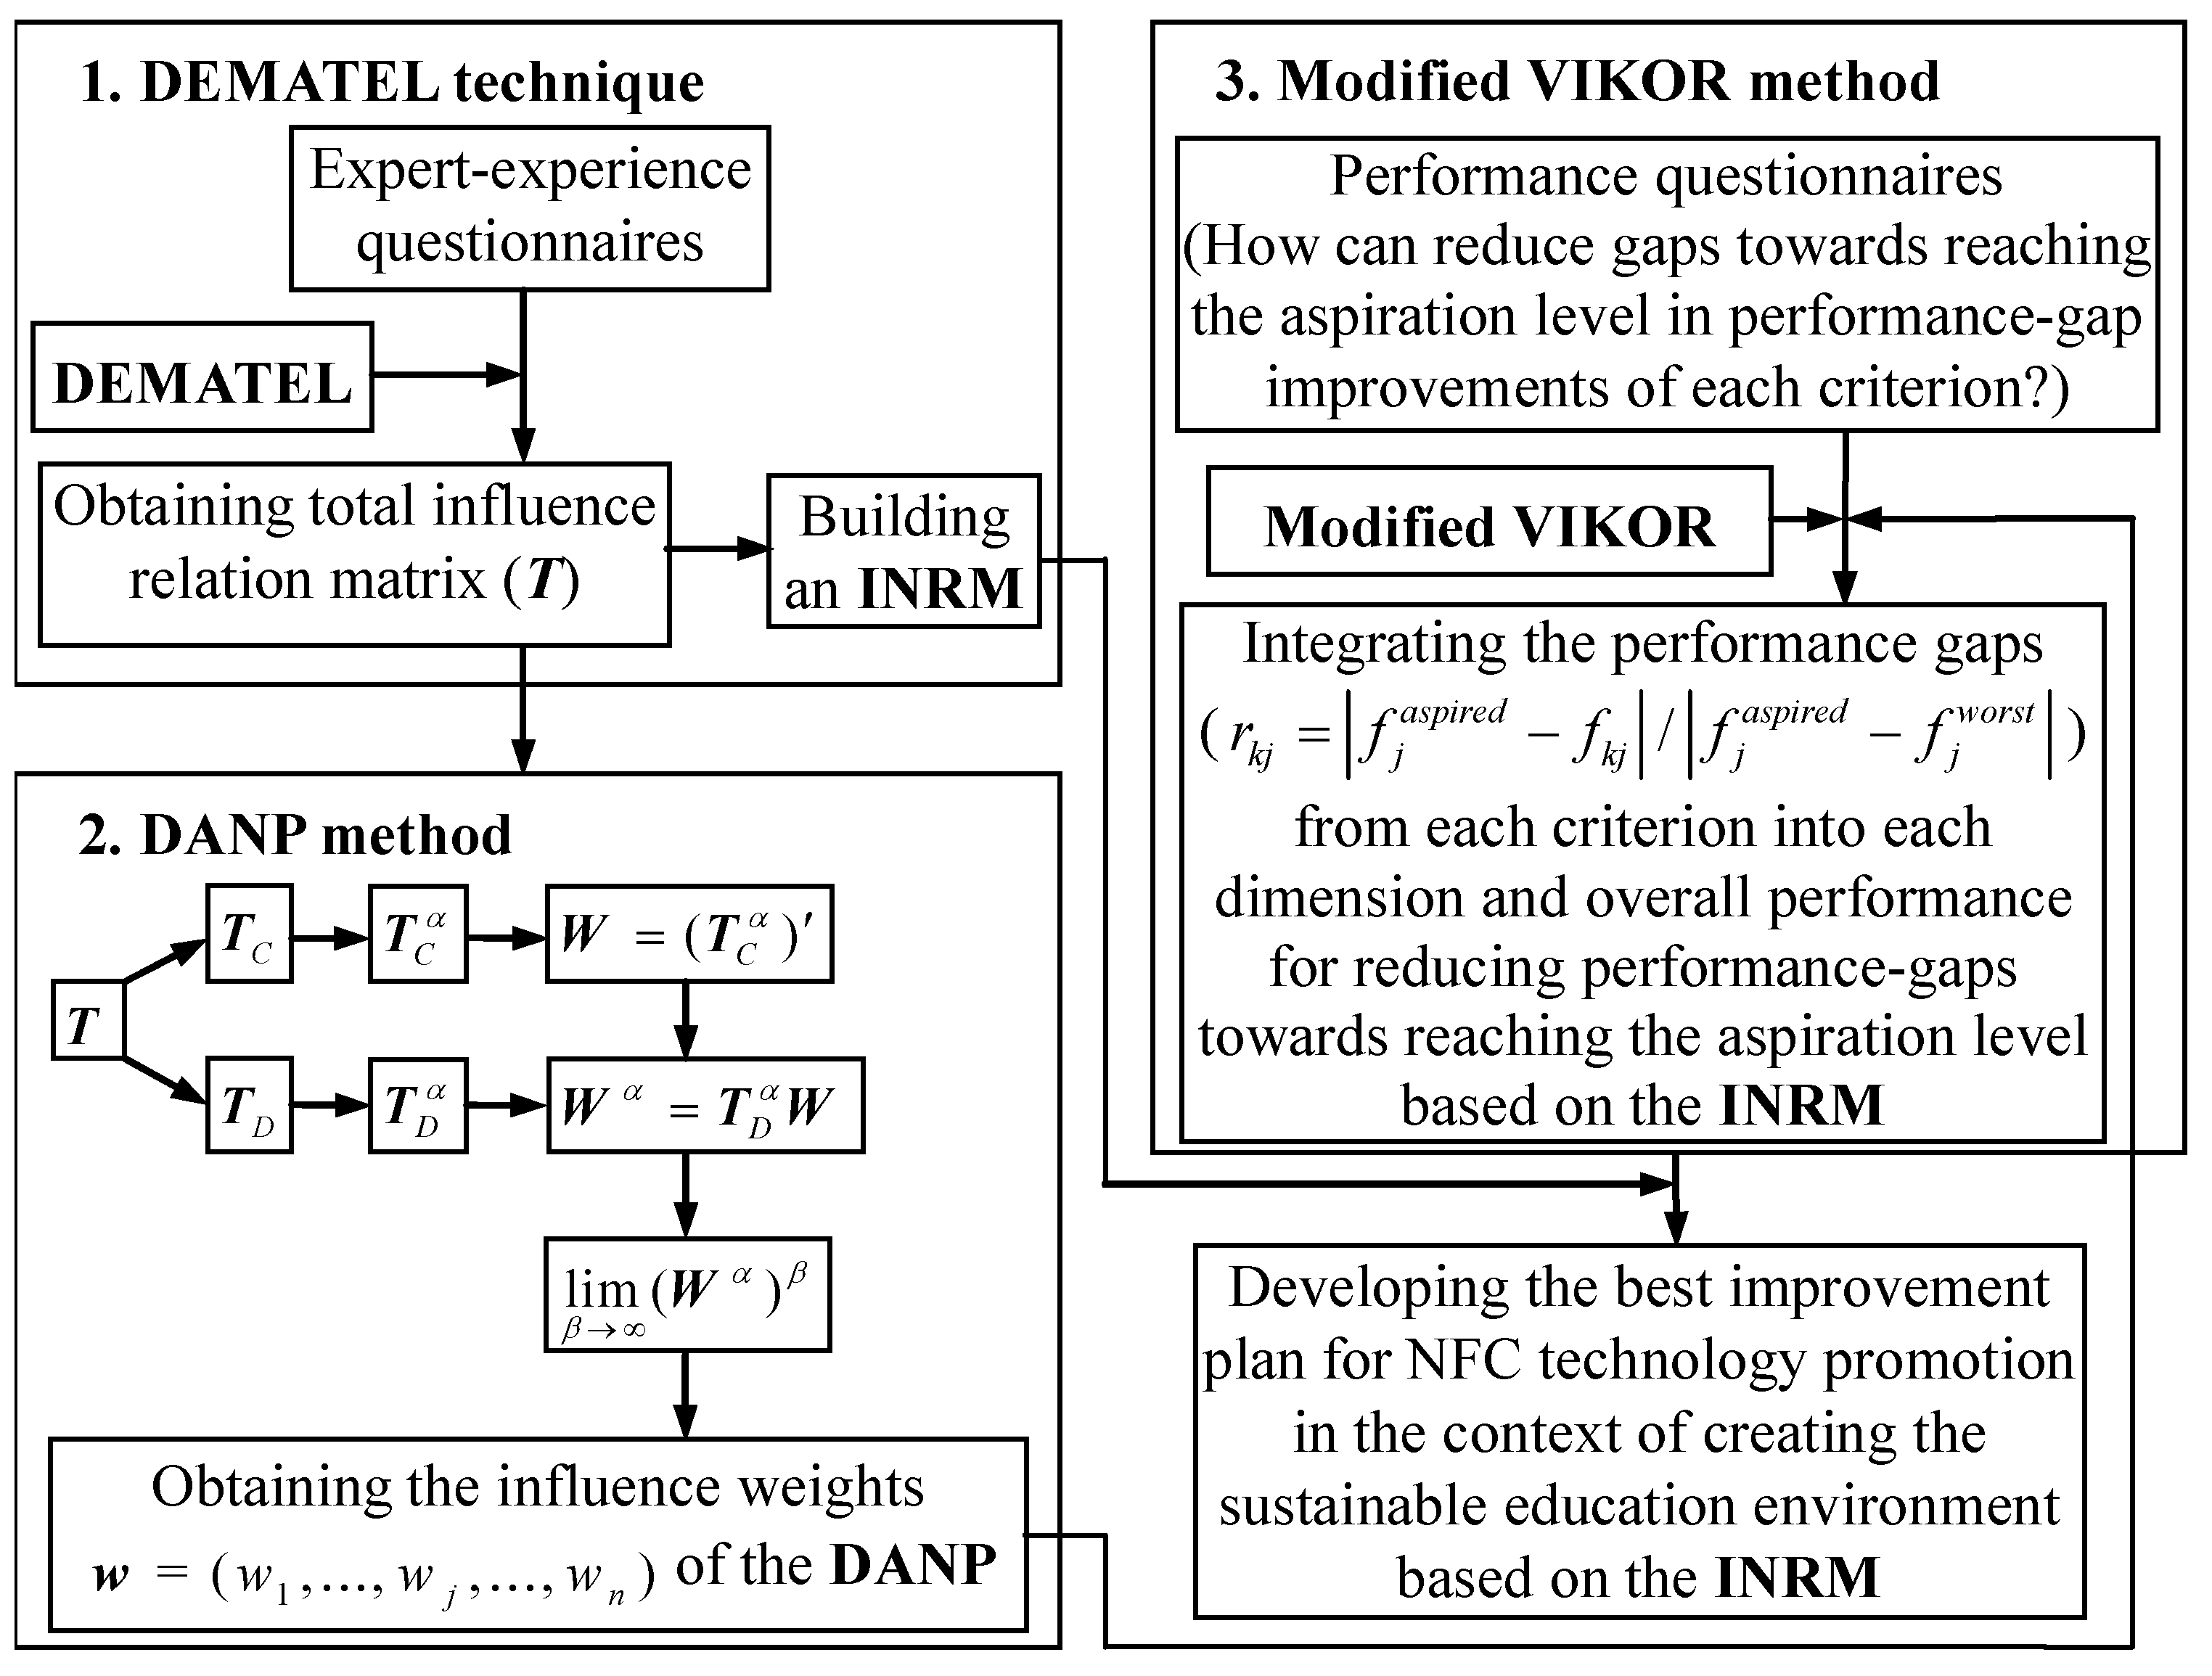
The advantages of any innovation should outweigh the costs of adopting the innovation [24]. Therefore, the related costs of a new technology have a significant impact on the decision to adopt it. In this respect, NFC and RFID technologies are not worth implementing [25]. Most companies remain doubtful about whether the related costs of NFC or RFID can be offset by its promised advantages. The present study investigated the costs associated with NFC and RFID such as equipment, maintenance and implementation costs [8]. The equipment costs include hardware and software costs. The maintenance costs include the cost for servicing the operation of the NFC or RFID system. The implementation costs include initial installation, work disruption and management of associated change costs. Therefore, how can improve the performance-gaps to reduce the implementation costs, it is an important issue in this research.

3. Methodology

The hybrid modified MADM model consists of the DEMATEL method, the DANP method and the modified VIKOR method. The model is used to address the feedback problems and interdependence of the complex interrelationships associated with NFC technology promotion in real-world situations, as indicated in Figure 2. The details are described below.

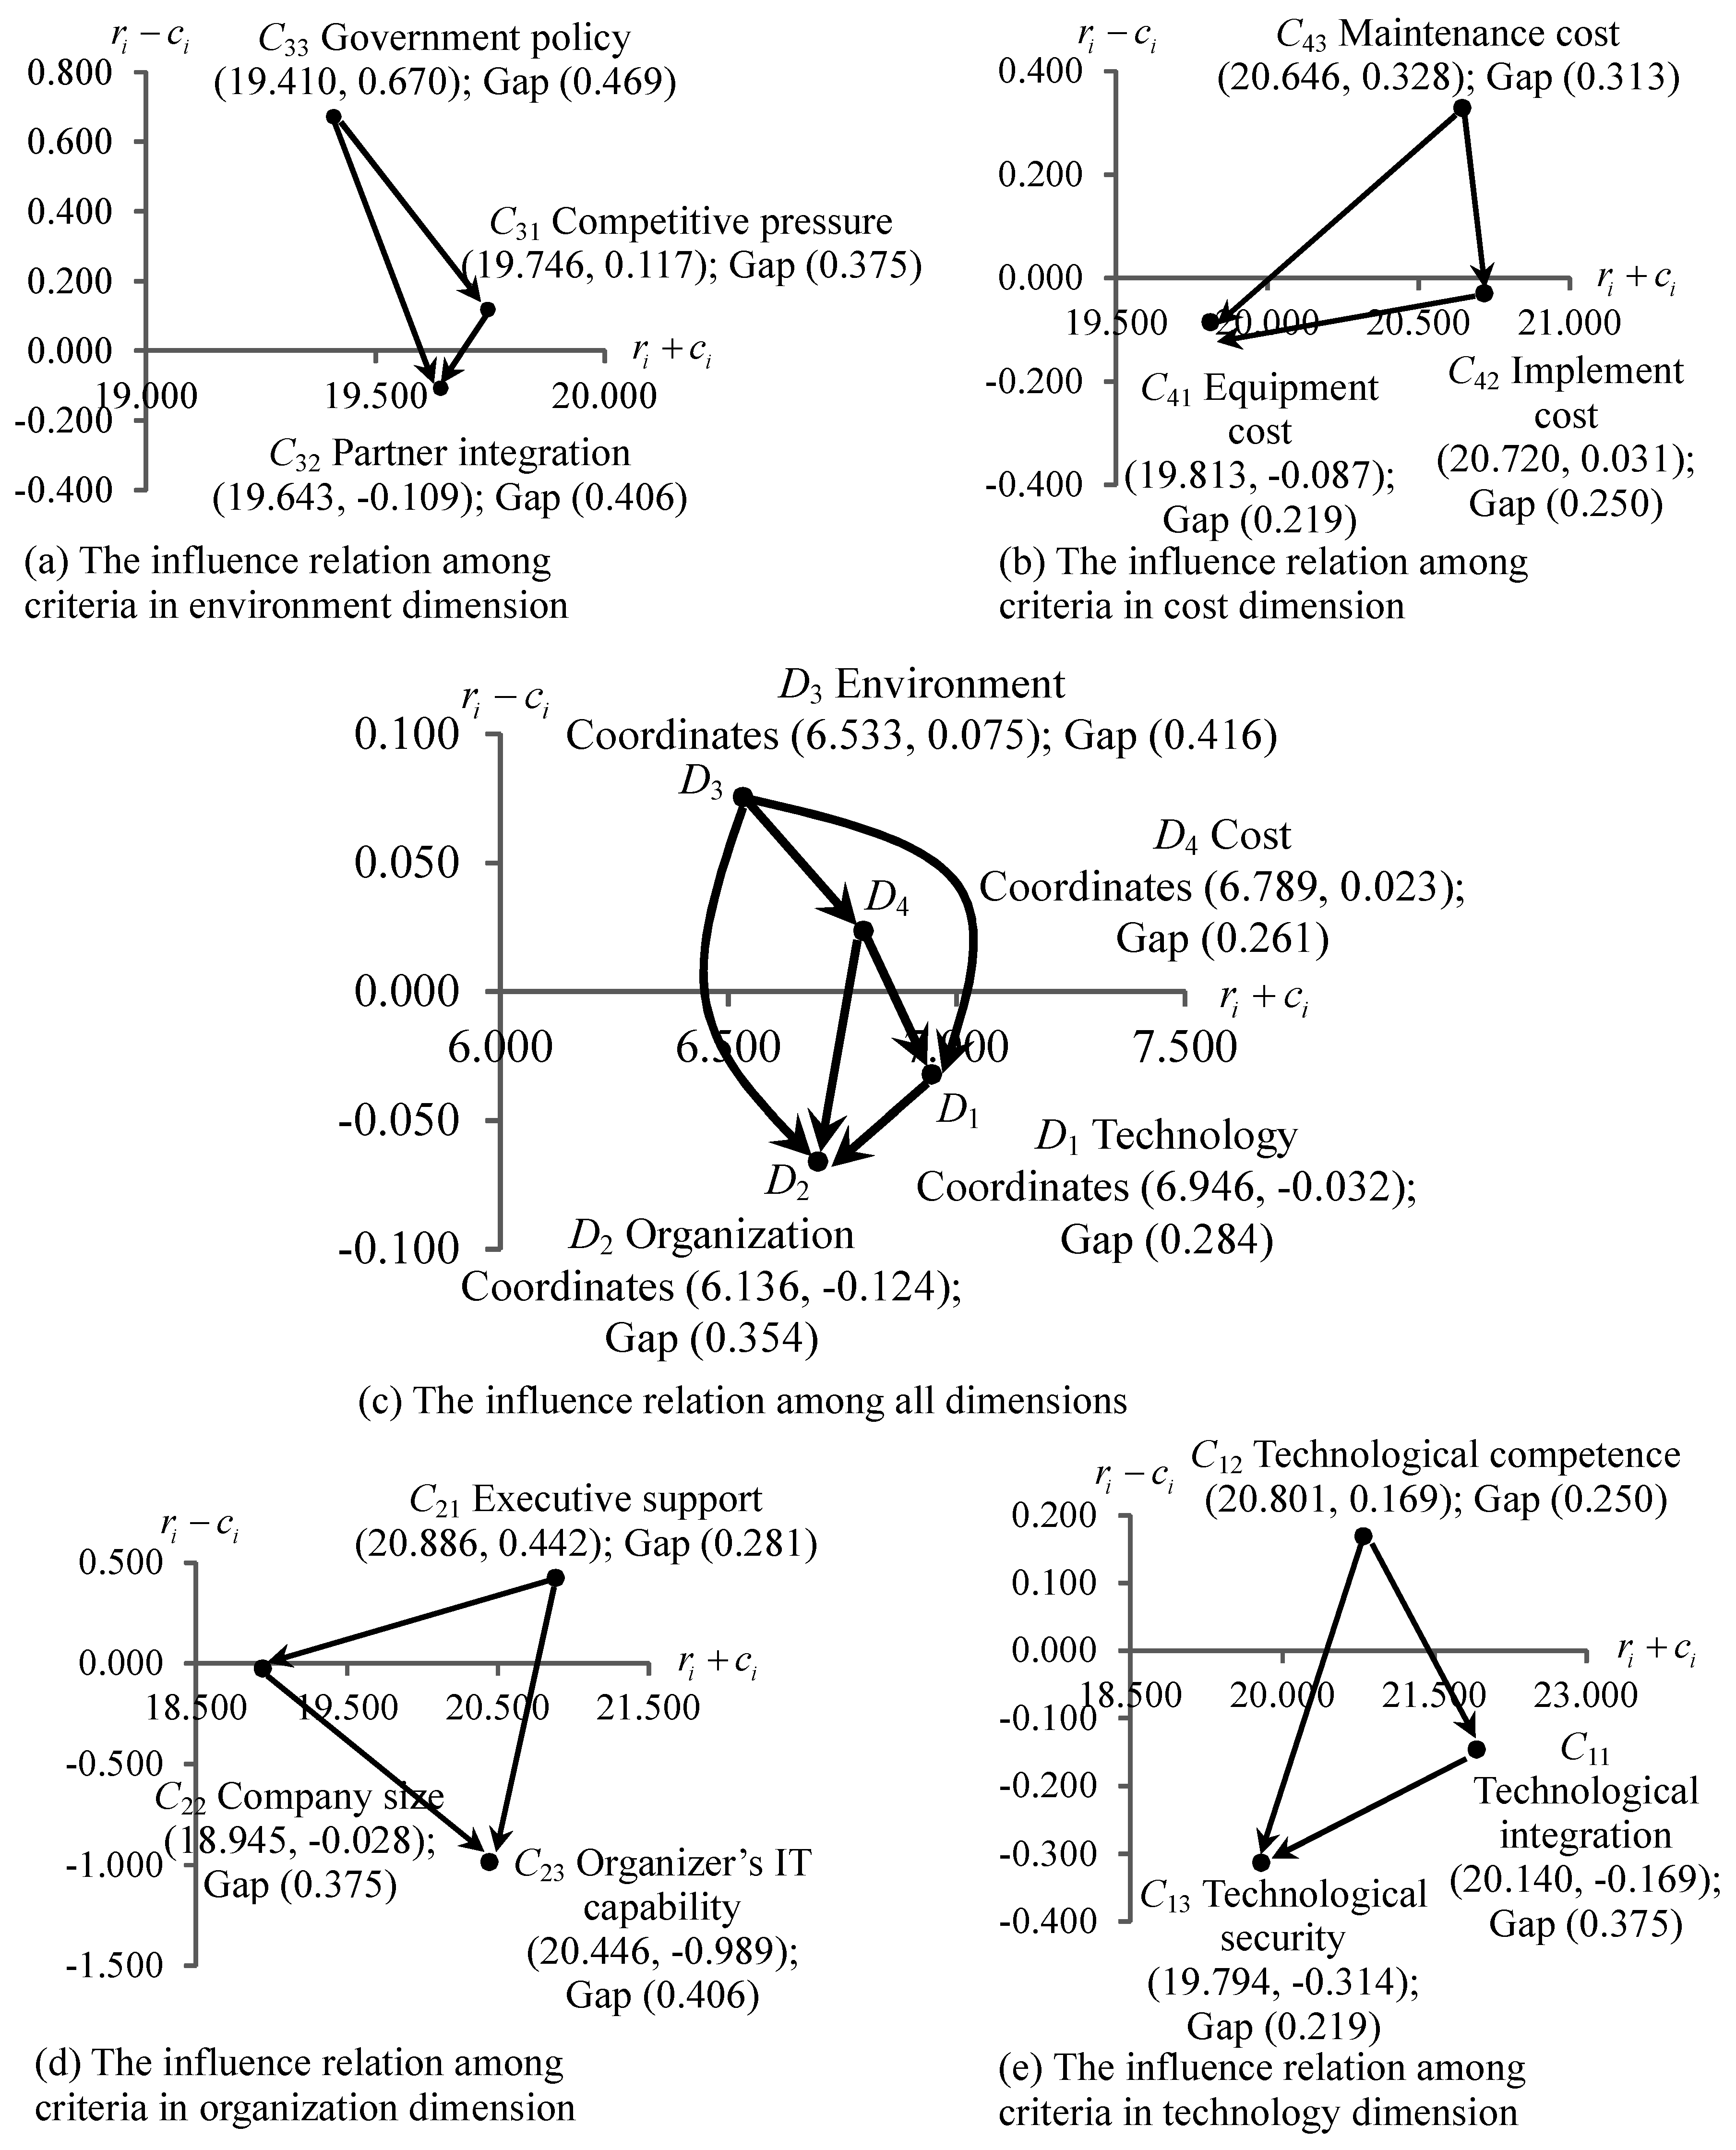
3.1. Establishing the INRM and Total Influence Relation Matrix Utilizing the DEMATEL

The DEMATEL was proposed by the Geneva Battelle Research Center [28,29] to construct structural analysis model. Then, Prof. Tzeng used the DEMATEL method as a MADM method applied in various fields of practical experience experts to determine the interrelationship matrix necessary for solving real-world relationship problems and building an INRM to identify the sources of cause–effect problems, thereby enabling the systematic improvement [4,5,6,7,8,9,10,11,12,13,14,15,30,31,32,33]. Expert questionnaires are used as part of the techniques that survey the degree of influence relation of criterion i on criterion j utilizing a measurement scale from 0 to 4 (no influence ← 0, 1, 2, 3, 4 → very high influence) by a linguistic perception (natural language) of the pairwise comparison of dimensions/criteria according to experts’ experience (see Appendix in detail). The method is described as follows.
Step 1: Construct the average direct influence relation matrix O with expert questionnaires in practical experience. The average matrix O = [ o i j ] n × n is given by Equation (1).
O = [ o 11 o 1 j o 1 n o i 1 o i j o i n o n 1 o n j o n n ]
Step 2: Construct the initial influence relation matrix Q . The initial matrix Q = [ q i j ] n × n can be gained by using Equations (2) and (3).
Q = O / s
s = max i , j [ max 1 i n j = 1 n o i j , max 1 j n i = 1 n o i j ]
where Q = [ q i j ] n × n and 0 q i j 1 .
Step 3: Construct the total influence relation matrix T . The total matrix T = [ t i j ] n × n can be gained by using Equation (4).
T = Q + Q 2 + Q 3 + Q 4 + + Q ϕ = Q ( I + Q + Q 2 + Q 3 + + Q ϕ 1 ) ( I Q ) ( I Q ) 1 = Q ( I Q ϕ ) ( I Q ) 1 = Q ( I Q ) 1 ,   when lim ϕ Q ϕ = [ 0 ] n × n
where I is an identity matrix ( I = ( I Q ) ( I Q ) 1 ) and T = [ t i j ] n × n ( i ,   j = 1 , 2 , , n ).
Step 4: Construct the INRM using the total matrix T . The INRM can be constructed by Equations (5) and (6).
r = [ r i ] n × 1 = [ j = 1 n t i j ] n × 1 = [ r 1 , , r i , , r n ] n × 1
c = [ c j ] 1 × n = [ i = 1 n t i j ] 1 × n = [ c 1 , , c j , , c n ] n × 1
where r i and c j show the sum of ith row and jth column of the total matrix T , respectively.
The INRM can facilitate decision makers in creating systematic improvement strategies for NFC technology promotion via the examination of the direct/indirect influence relationship of the dimensions/criteria.

3.2. Calculated the Influence Weights Using the DANP

The DANP was proposed by Tzeng et al. [33,34] from the basic concepts of the ANP as a MADM method for solving real world problems with feedback and dependence between criteria or dimensions and determining influential weights [9,11,12,13,14,15,33,34,35,36,37,38,39,40,41,42]. The DANP can additionally obtain the relative influence weights not only for use in selection/ranking but also for making performance-gap improvements according to the relationships, including those among real-world dimensions and criteria. The DANP method comprises the following procedures.
Step 1: Calculate the unweighted supermatrix W = ( T C α ) . The total matrix T C can be calculate by criteria, as indicated in Equation (7), where j = 1 m m j = n , m < n , and T C i j as a m i × m j submatrix.
T C = D 1 D j D m c 11 c 1 m 1 c j 1 c j m j c m 1 c m m m c 11 D 1 c 1 m 1 c i 1 D i c i m i c m 1 D m c m m m [ T C 11 T C 1 j T C 1 m T C i 1 T C i j T C i m T C m 1 T C m j T C m m ] n × n | m < n , j = 1 m m j = n
Matrix T C α can be gained by normalizing matrix T C , as indicated in Equation (8).
T C α = D 1 D j D m c 11 c 1 m 1 c j 1 c j m j c m 1 c m m m c 11 D 1 c 1 m 1 c i 1 D i c i m i c m 1 D m c m m m [ T C α 11 T C α 1 j T C α 1 m T C α i 1 T C α i j T C α i m T C α m 1 T C α m j T C α m m ] n × n | m < n , j = 1 m m j = n
where submatrix T C α 11 can be gained by using Equations (9) and (10); similarly, submatrix T C α n n can be gained.
T C 11 = c 11     c 1 j     c 1 m 1 c 11 c 1 i c 1 m 1 [ t C 11 11     t C 1 j 11     t C 1 m 1 11         t C i 1 11     t C i j 11     t C i m 1 11         t C m 1 1 11 t C m 1 j 11 t C m 1 m 1 11 ] d 1 11 = j = 1 m 1 t C 1 j 11 d i 11 = j = 1 m 1 t C i j 11 d m 1 11 = j = 1 m 1 t C m 1 j 11
where d i 11 = j = 1 m 1 t C i j 11 ,   i = 1 ,   2 , ,   m 1 .
T C α 11 = c 11       c 1 j       c 1 m 1 c 11 c 1 i c 1 m 1 [ t C 11 11 / d 1 11 t C 1 j 11 / d 1 11 t C 1 m 1 11 / d 1 11 t C i 1 11 / d i 11 t C i j 11 / d i 11 t C i m 1 11 / d i 11 t C m 1 1 11 / d m 1 11 t C m 1 j 11 / d m 1 11 t C m 1 m 1 11 / d m 1 11 ] =    c 11    c 1 j    c 1 m 1 c 11 c 1 i c 1 m 1 [ t C 11 α 11 t C 1 j α 11 t C 1 m 1 α 11 t C i 1 α 11 t C i j α 11 t C i m 1 α 11 t C m 1 1 α 11 t C m 1 j α 11 t C m 1 m 1 α 11 ] m 1 × m 1
Next, the unweighted supermatrix W = ( T C α ) can be gained by transposing matrix T C α , as indicated in Equation (11).
W = ( T C α ) = D 1 D i D m c 11 c 1 m 1 c i 1 c i m i c m 1 c m m m c 11 D 1 c 1 m 1 c j 1 D j c j m j c m 1 D m c m m m [ W 11 W i 1 W m 1 W 1 j W i j W m j W 1 m W i m W m m ] n × n | m < n , j = 1 m m j = n
where submatrix W 11 can be gained by using Equation (12), where D m denotes the mth dimension, and c m m m denotes the mmth criterion in the mth dimension.
W 11 = ( T C α 11 ) =    c 11    c 1 i    c 1 m 1 c 11 c 1 j c 1 m 1 [ t C 11 α 11 t C i 1 α 11 t C m 1 1 α 11 t C 1 j α 11 t C i j α 11 t C m 1 j α 11 t C 1 m 1 α 11 t C i m 1 α 11 t C m 1 m 1 α 11 ] m 1 × m 1
Step 2: Calculate the weighted super-matrix W α = T D α W . The total matrix T D can be calculate by dimension, as indicated in Equation (13).
T D = [ t 11 D 11     t 1 j D 1 j     t 1 m D 1 m         t i 1 D i 1     t i j D i j     t i m D i m         t m 1 D m 1     t m j D m j     t m m D m m ] m × m d 1 = j = 1 m t 1 j D 1 j d i = j = 1 m t i j D i j d m = j = 1 m t m j D m j
where d i = j = 1 m t i j D i j ,   i = 1 ,   2 , ,   m .
Matrix T D α can be gained by normalizing matrix T D , as indicated in Equation (14).
T D α = [ t 11 D 11 / d 1 t 1 j D 1 j / d 1 t 1 m D 1 m / d 1 t i 1 D i 1 / d i t i j D i j / d i t i m D i m / d i t m 1 D m 1 / d m t m j D m j / d m t m m D m m / d m ] = [ t 11 α 11 t 1 j α 1 j t 1 m α 1 m t i 1 α i 1 t i j α i j t i m α i m t m 1 α m 1 t m j α m j t m m α m m ] m × m
The normalized matrix T D α and the unweighted supermatrix W are utilized to generate the weighted supermatrix W α , as indicated in Equation (15).
W α = T D α W = [ t 11 α 11 × W 11 t i 1 α i 1 × W i 1 t m 1 α m 1 × W m 1 t 1 j α i 1 × W 1 j t i j α i j × W i j t m j α m j × W m j t 1 m α m 1 × W 1 n t i m α i m × W i n t m m α m m × W m m ] n × n = [ [ W α 11 ] m 1 × m 1 [ W α i 1 ] m i × m 1 [ W α m 1 ] m m × m 1 [ W α 1 j ] m 1 × m j [ W α i j ] m i × m j [ W α m j ] m m × m j [ W α 1 m ] m 1 × m m [ W α i m ] m i × m m [ W α m m ] m m × m m ] n × n
Step 3: Calculate the influence weights w = ( w 1 , , w j , , w n ) . The limited weighted supermatrix lim β ( W α ) β can be gained by multiplying multiple times of the weighted supermatrix W α . The influence weights (also called the DANP weights) can then be calculated by using lim β ( W α ) β , where β denotes any number for the exponent.

3.3. Evaluating and Improving the Performance Using the Modified VIKOR

The VIKOR method was proposed by Opricovic and Tzeng [43] according to the concepts of the class distance function [44] as a MADM method to solve the conflicting problem among criteria [33,42,45,46,47]. The modified VIKOR method combines the influence weights with each normalized performance to integrate each criterion into each dimension performance as well as the total performance [5,9,11,15,33,39,40,41,42,45,46,47,48,49,50]. We can subsequently improve the problems of the sustainable education environment according to the INRM to decrease the performance-gaps in criterion/dimension and thereby close the desired aspiration value in the modified VIKOR method (while a traditional concept of MADM, such as traditional VIKOR method, can only perform ranking and selection, and cannot be used for performance-gaps improvement, when using “max–min” as the benchmark) according to the interrelationships of real-world dependence and feedback problems using “aspiration–worst” as the benchmark. We require a systematic approach to problem-solving in real-world situations. We must identify the sources of cause–effect problem according to the INRM for performance-gap improvement (i.e., avoid “piecemeal” or “stop-gap” measures). Therefore, in this study, we set an aspiration value as a benchmark to prevent selecting the most favorable option from among inferior choices. The expansion of the modified VIKOR method is given by Equations (16) and (17).
L k p = { j = 1 n [ w j ( | f j * f k j | | f j * f j | ) ] p } 1 / p
r k j = | f j * f k j | | f j * f j |
where f k j is the performance-score of the j th criterion in the kth alternative, r k j is the degrees of gap (i.e., regret) of the j th criterion in k th alternative, and w j is the influence weights. The modified VIKOR method is described below.
Step 1: Set the aspiration value and worst value. The traditional VIKOR method is given the positive and negative (“max–min”) ideal solution as a benchmark, as indicated in Equations (18) and (19). The traditional VIKOR ranking/selection indicates that the preferred alternative is proximate to the positive ideal solution.
Positive   ideal   solution :   f j * = f j max = max k f k j ,   j = 1 , 2 , , n
Negative   ideal   solution :   f j = f j min = min k f k j ,   j = 1 , 2 , , n
The modified VIKOR method for performance-gap improvement is given the aspiration and worst value (called “aspiration–worst”) as benchmarks, as indicated in Equations (20) and (21).
Aspiration   value :   f a s p i r e d = ( f 1 a s p i r e d , ,   f j a s p i r e d , ,   f n a s p i r e d ) ,   f j * = f j a s p i r e d
Worst   value :   f w o r s t = ( f 1 w o r s t , ,   f j w o r s t , ,   f n w o r s t ) ,   f j = f j w o r s t
In this study, Questionnaires of performance measure were used with items scored from 0 to 4 (very bad/dissatisfaction ← 0, 1, 2, 3, 4 → very good/satisfaction) to evaluate performance-scores by social response (see Appendix in detail). Thus, the worst value at score 0 ( f j w o r s t = 0 ) and the aspiration value can be set at score 4 ( f j a s p i r e d = 4 ).
Step 2: Calculate total average minimal performance-gap/regret (i.e., the group utility) G k , and calculate the respective maximum performance-gap/regret M k . The performance-gap measures for total average minimal performance-gap G k and the respective maximum performance-gap M k can be formulated by using L k p = 1 and L k p = , respectively, as indicated in Equations (22) and (23).
G k = L k p = 1 = j = 1 n w j r k j = j = 1 n w j ( | f j a s p i r e d f k j | | f j a s p i r e d f j w o r s t | )
M k = L k p = = max j ( r k j ) = max j ( | f j a s p i r e d f k j | | f j a s p i r e d f j w o r s t | | j = 1 , 2 , , n )
where min k G k represents the maximum group utility (i.e., how to eliminate the performance-gaps in each dimension/criterion) and max k M k represents the respective maximum regret (i.e., how to seek the largest performance-gap shown as priority improvement of each dimension/criterion).
Step 3: Compute the comprehensive indicators C k . Finally, the comprehensive indicators C k can be gained by using Equation (24).
C k = v ( G k G * ) / ( G G * ) + ( 1 v ) ( M k M * ) / ( M M * ) ,   v [ 0 ,   1 ]
where v shows the strategical weight. Equation (24) can be rewritten as Equation (25) when G * = 0 and M * = 0 , and G = 1 and M = 1 .
C k = v G k + ( 1 v ) M k
The performance-gaps help decision makers to develop the improvement strategies for facilitating NFC technology promotion in the context of creating the sustainable education environment according to the INRM.

4. An Empirical Case Analysis of Improving NFC Technology Promotion in the Context of Creating the Sustainable Education Environment

This paper provides an empirical analysis to prove that the proposed hybrid model can improve NFC technology promotion in the context of creating the sustainable education environment according to the hybrid modified MADM model.

4.1. The Analysis of Results

In this study, we used the DEMATEL method to build the construction of influence relationships in the decision-making problems with four dimensions and 12 criteria for improving and facilitating NFC technology promotion in a real case of Taiwan. According to questionnaires completed by experts with considerable practical experience, the average matrix O can be gained, as indicated in Table 1. The significant confidence reaches 97.2% (greater than 95%) for 13 experts with practical experience in RFID/NFC technology promotion, i.e., the consensus of average gap equals 2.8% (smaller than 5%) in consensus with experts. According to normalizing the average matrix O , the initial matrix Q can also be gained. According to the infinite series of indirect and direct effects for the initial matrix Q , the total matrix T can be gained, as indicated in Table 2, which shows that the relationship among all the criteria have a complex interrelationship. The total matrix T can be divided into the matrix T C (i.e., the total matrix by criteria with dimensions-clustering) and the matrix T D (i.e., the total matrix by dimensions), as indicated in Table 3. Table 3 presents the total effects of the influence given and received for matrix T D and T C . In Table 3, “environment” ( r i c i ) had the largest positive value (0.075), rendering it the most influential dimension in the evaluation/improvement system. “Organization” ( r i c i ) had the smallest negative value (−0.066) and thus is the most easily influenced by other dimensions. Accordingly, decision-makers should consider “environment” as a crucial consideration in NFC technology promotion. “Technology” ( r i + c i ) had the highest positive value (6.946) and thus should be considered the most interactive relationship to other dimensions and had the most interactive dimension by experts. In contrast, “environment” ( r i + c i ) was related the smallest (6.533) to other dimensions. In addition, “government policy” ( r i c i ) exhibited the largest degree of causality (0.670), which thus most likely influences other criteria. “Organizer’s IT capability” ( r i c i ) is the smallest degree of causality (−0.989), thus is the most easily influenced by other criteria. “Technological integration” ( r i + c i ) had the most interactive relationship (21.922) to other criteria. In contrast, “company size” ( r i + c i ) was the least related (18.945) to other criteria. According to Table 3, the INRM can be drawn by illustrating the influence network relationship of four dimensions and 12 criteria, as indicated in Figure 3. Furthermore, as Figure 3 shows, the experts considered that “environment” should be the first priority in terms of improvement; “environment” is the source of cause–effect problem and can influence other dimensions. According to “environment” dimension, the directions of priority improvement are ordered as “government policy”, “competitive pressure”, and “partner integration”. Decision makers should encourage government to engage in policy planning related to NFC technology diffusion to satisfy social/user needs.
By using the DEMATEL method and the concept of the ANP, the influence weights of the DANP can be determined, and the case company can be surveyed to gain indicators for the dependence and feedback (i.e., interrelationship). The DANP can be used to gain an unweighted supermatrix, as indicated in Table 4, which shows the degrees of the weights among the influence relationships. We also considered the impacts of other dimensions to gain the weighted supermatrix, as indicated in Table 5, which shows the degrees of influence brought from other dimensions. To gain the limited weighted supermatrix, the weighted supermatrix is multiplied by itself multiple times. A steady-state supermatrix with the global weights (i.e., influence weights) can then be gained by utilizing the infinite power of the limited weighted supermatrix, as indicated in Table 6. The local weights can be derived from the global weights by using the DANP approach, as indicated in Table 7, which helps decision-makers comprehend the influence weights of four dimensions to perform the selection and ranking. The results show that “technology” (0.2587) was the most important dimension, and that “organizer’s IT capability” (0.3519) was the most important criterion in terms of influence.
Ultimately, the influence weights combine with the modified and traditional VIKOR method to calculate performance-gap of each criterion, each dimensional performance-gap and the total performance-gap to evaluate the determinants of improving NFC technology promotion for creating the sustainable environment (problem-solving) based on the INRM by systematics. The empirical case analysis is utilized to assess the performance-gaps by using the traditional method (VIKOR) and proposed approach (modified VIKOR). The performance-gaps can be determined by analyzing the VIKOR questionnaires, as indicated in Table 8. As the table shows, in the case of the traditional method, the total average gaps for Alternatives A (information technology industry), B (logistics and transportation industry), and C (educational institution) were 0.041, 0.575, and 0.933, respectively, yielding the result A B C. In the case of the proposed approach, the total average gaps for Alternatives A, B, and C were 0.138, 0.239, and 0.327, respectively, yielding the result A B C. The comparative results reveal that, although these rankings are the same, the proposed approach is superior to the traditional method because it can obtain the most realistic performance-gap for creating the best improvement plan; accordingly, Alternative C should be prioritized for improvement because it has the largest total average gap. The traditional method cannot be applied for performance improvement because its gap ratio is equal to zero when f k j is close to max, while, when f k j is close to min, its gap ratio is equal to one. Thus, the proposed approach can determine the most realistic performance-gap ratio from real performance value to the aspiration value in each criterion to perform performance improvement. The proposed approach revealed that the gap results for “technology”, “organization”, “environment”, and “cost” in Alternative C were 0.284, 0.354, 0.416, and 0.261, respectively. These results indicated that “environment” should be the first priority in terms of improvement because it had the largest gap. In addition, for Alternative B, they were 0.259, 0.248, 0.229, and 0.219, respectively. These results indicated that “technology” should be the first priority in terms of improvement. For Alternative A, they were 0.103, 0.198, 0.104, and 0.146, respectively. These results indicated that “organization” should be the first priority in terms of improvement. The results of three alternatives indicated that different industries should adopt distinct improvement strategies. This paper uses the result of Alternative C to improve NFC technology promotion for the sustainable education environment as priority strategy. Furthermore, the comprehensive indicators C k can be also gained, which value of v can make decisions by the experts that is regulated as v = 0 , v = 0.5 and v = 1 in this study. The comprehensive indicator results of 0.469 (respective maximum gap from v = 0 ), 0.398 (the majority of criteria from v = 0.5 ) and 0.327 (the group utility/total average gap from v = 1 ) revealed that “environment” should be the first priority in terms of improvement. This reveals that the proposed model can identify the problem-solving points to facilitate NFC technology promotion according to an empirical case.

4.2. Discussions and Implications

Figure 3 presents the influence network relation map for the dimensions and criteria, and Table 8 presents the performance-gaps, which help policymakers to make reliable decisions. As Figure 3 shows, four dimensions and 12 criteria were found to affect each other. The results showed that “environment” had the highest positive value ( r i c i ) and thus was the most influence dimension regarding improvement priority, which is the sources of the problem, followed by “cost”; “government policy” had the largest positive value ( r i c i ) and thus was the most influence criterion, followed by “competitive pressure”. In other words, the results revealed that “environment” and “cost” have a significant and positive relationship to affect NFC technology promotion; the costs of adopting NFC technology can bring more benefits of innovation, namely a sustainable education environment. However, according to Table 7, “technology” had the highest weight and the best ranking and thus was the most important dimension in terms of influence; “organizer’s IT capability” with the highest weight and best ranking is the most important criterion in terms of influence. These notable results revealed that the decision-makers did not believe that “technology” was the most influential dimension, and that “organizer’s IT capability” was the most influential criterion; however, they nevertheless considered “technology” and “organizer’s IT capability” to be crucial attributions. To address the conflicting problem of ranking/selection and improvement, the influence weights were combined with the compromise ranking method (i.e., the modified VIKOR method) to determine the priority direction of improvement and assess performance-gaps. The performance-gaps show improvement priorities, which is more appropriate for improving NFC technology promotion in the context of creating the sustainable education environment. In the light of Table 8, the comparative results reveal that the modified VIKOR method is more feasible than the traditional VIKOR method because its performance-gaps have not appeared equal to zero and one, which can obtain the most realistic performance-gap and thus establish the performance improvement strategy for achieving the aspiration value. In Table 8, we also observed very interesting phenomenon: the traditional VIKOR method can yield only a relatively optimal ranking and selection results (performance-gaps existed zero and one in three alternatives), and cannot be applied for performance improvement because it presents performance-gaps equal to zero (the zero gap indicates that the traditional VIKOR method has the disadvantage of “picking the best apple from a barrel of rotten apples”); in other words, the proposed approach not only can be utilized for selection and ranking, but also can be utilized for performance improvement for alternatives, even can be utilized for single alternative improvement. According to alternative C (educational institution) in the proposed approach, “environment” dimension is the most easily improved and should be prioritized for improvement because it has the maximum performance-gap value, followed by “organization”, “technology”, and “cost”; “government policy” criterion should be prioritized for improvement because it has the maximum performance-gap value, followed by “partner integration”, “organizer’s IT capability”, and “competitive pressure”. The results showed that the proposed model can solve the decision problems of NFC technology promotion based on the INRM to decrease the performance-gaps and thereby facilitate reaching the aspiration value according to the feedback and the interrelationships of dependence problem in the real world. This study uses the most maximum performance-gap and influence factor as critical attributions for determining the improved strategies. In order to implement an effective NFC technology environment for creating such a sustainable education environment of the low birthrate in Taiwan towards satisfying teaching quality, resource control and management needs, the following managerial implications are proposed for improving NFC technology promotion. Policymakers should consider how to ask campuses make “environment” (D3) their top improvement priority. Another option is that policymakers can refer D3 to guide campuses to prioritize in improvement of “government policy” (C33) for enhancing NFC technology diffusion according to the INRM. In other words, policymakers can refer to the performance-gaps and the INRM to ameliorate their performance of dimensions and criteria in the evaluation/improvement model for improving NFC technology promotion in the context of creating the sustainable education environment. The results revealed that “environment” (D3) most accurately predicted social needs, and thus that policymakers should encourage government to engage in policy planning related to NFC technology diffusion such as teaching services, identification, as well as payment services in campus restaurants, management services and resource control to enhance “environment” through “government policy”.

5. Conclusions and Remarks

Based on real-world relationships, this study constructed hybrid modified MADM model integrating the DEMATEL method, the DANP method and the modified VIKOR method to explore and improve NFC technology promotion in the context of creating a sustainable education environment. Several of the main contributions of this study are described below.
First, this study developed a MADM model for the decision-making on sustainable education environment, and this model can provide policymakers with a deeper comprehension of how to facilitate NFC technology promotion. Second, the DEMATEL method constructed an INRM for systematic improvement, thus facilitating solving real-world interactive relationships and overcoming the independent assumptions. The DANP method derived the influence weights to eliminate the time-consuming pairwise comparisons in the original ANP and solve the feedback and dependence problems. Third, the comparatively favorable result of the traditional approach is replaced with one based on the aspiration value, thereby avoiding selecting the most favorable option from among inferior choices and satisfying the social/user needs of the current competitive markets. The modified VIKOR method can obtain the performance-gaps by setting the aspiration value. The performance-gaps can enable policymakers to decrease these gaps in each criterion and dimension to overcome the decision-making problems and thus reach the INRM-based aspiration value. The INRM can identify the sources of problems and thus enable systematic improvement, which aids policymakers in understanding the causality of decision-making problems and creating improvement strategies. Fourth, the comparative results reveal that the modified MADM model can be utilized for not only “selection and ranking” but also “performance improvement” in reaching the aspiration value. The empirical case analysis shows that the modified MADM model can effectively help policymakers facilitating NFC technology promotion for creating the sustainable education environment by enhancing “environment” level through “government policy”. Accordingly, we conclude that the results can offer guidelines to policymakers by identifying the critical attributes and determining the most effective means of facilitating NFC technology promotion.
In future study, three limitations need to be investigated. First, the future study should use larger samples to verify the findings for enhancing the ability of interpretation because larger samples can create more sophisticated analysis. Second, the evaluation attributes were selected from relevant literature for NFC/RFID technology adoption and from the investigations of pretest questionnaires in practical experience. The future study could adopt different methods, such as in-depth interviews and longitudinal studies, to seek other core attributes for evaluation and improvement analysis. Third, we will use multi-objective decision making (MODM) methods such as changeable spaces programming (CSP) and data envelopment analysis (DEA) to design how to achieve the aspiration value.

Author Contributions

Shu-Kung Hu dealt with the research design, article writing, and analyzed the data. Gwo-Hshiung Tzeng and James-Jiann-Haw Liou dealt with the research design, and article writing. Ming-Tsang Lu and Yen-Ching Chuang dealt with article writing and formatting. They shared article drafting, editing and review. All authors have read and approved the final manuscript.

Acknowledgments

The funding supports from the Ministry of Science and Technology of Taiwan under the grant numbers MOST 105-2221-E-305-007-MY3 and MOST 105-2410-H-424-018 are appreciated. The authors are very grateful to the editorial team and reviewers of the Sustainability journal, who provided valuable comments and suggestions for improving the quality of this article.

Conflicts of Interest

The authors declare no conflict of interest.

Appendix A

The investigation method of questionnaires is described as follows.
Good day! This is an academic research about “Improving NFC technology promotion for creating the sustainable education environment by using a hybrid modified MADM model”. The purpose is to explore NFC technology promotion’s evaluation index, key attributes related to performance evaluation, and performance improvement strategy. As we are greatly impressed by your company’s outstanding achievement in this field, if we could have the honor of obtaining your precious opinions, the result and credibility of this research will be tremendously benefited. All the information provided will be used for academic statistical analysis only, and will not be separately announced to the outside or transferred to other applications. Therefore, please feel at ease in filling out the answers. Your support will be very crucial to the successful completion of this research. We sincerely hope that you would spend some time to express your opinions to be taken as reference for this research. Please accept our most sincere appreciation. Thank you and wish you all the best.
1. Instructions for Filling Out the Questionnaire
This questionnaire is divided into 8 parts: (1) instructions for filling out; (2) dimensions and criteria descriptions; (3) investigation of the degree of importance for dimensions and criteria; (4) method for filling out; (5) comparison of the impact of the 4 dimensions; (6) comparison of the impact of the 12 criteria; (7) investigation of the degree of satisfaction for criteria; (8) personal data.
2. Dimensions and Criteria Descriptions
Table A1. Descriptions of dimensions and criteria.
Dimensions/CriteriaDescriptions
Technology (D1)
 Technological integration (C11)Technological integration can reduce the complexity and enhance the efficiency of information systems involving RFID or NFC
 Technological competence (C12)Technological competence can be instilled in an organization by providing a platform for an information technology (IT) system.
 Technological security (C13)Technological security is the degree of safety for exchanging data and online transactions on an Internet platform.
Organization (D2)
 Executive support (C21)Top management enables obtaining sight, support, and commitment to create a substantial influence on the RFID or NFC adoption process
 Company size (C22)A large company size enables obtaining diverse resources to assess and determine the technology required for profit
 Organizer’s IT capability (C23)The organizer’s IT capability requires extensive IT expertise for addressing implementation challenges
Environment (D3)
 Competitive pressure (C31)With the expansion of competitive pressure, companies may feel the need to attain a competitive advantage through innovations that involve adopting RFID or NFC, which have a high operation efficiency and enable accurate data collection
 Partner integration (C32)Partner integration is the degree to which the customers and suppliers of a company are willing and ready to conduct commercial activities by using RFID or NFC
 Government policy (C33)Government policies have a positive effect on IT diffusion
Cost (D4)
 Equipment cost (C41)The equipment cost includes hardware and software costs
 Implement cost (C42)The implementation cost includes work disruption, initial installation, and management of associated change
 Maintenance cost (C43)The maintenance cost includes the cost for maintaining the operation of the RFID or NFC system
3. Investigation of the Degree of Importance for Dimensions and Criteria According to Experts with Practical Experience
Please fill the number ( ) degree of importance for dimensions and criteria. The degrees of importance are 0 to 4 (Very unimportance ← 0, 1, 2, 3, 4 → Very importance).
Dimensions/CriteriaDegree of Importance
Technology (D1)(    )
 Technological integration (C11)(    )
 Technological competence (C12)(    )
 Technological security (C13)(    )
Organization (D2)(    )
 Executive support (C21)(    )
 Company size (C22)(    )
 Organizer’s IT capability (C23)(    )
Environment (D3)(    )
 Competitive pressure (C31)(    )
 Partner integration (C32)(    )
 Government policy (C33)(    )
Cost (D4)(    )
 Equipment cost (C41)(    )
 Implement cost (C42)(    )
 Maintenance cost (C43)(    )
Please provide other evaluation dimension (        )(    )
Please provide other evaluation criterion (         )(    )
4. Method for Filling Out
Survey the influential relationship among dimensions and criteria. Filling factors influence level: Scales from 0 to 4, No influence (0), Low influence (1), Middle influence (2), High influence (3), Extreme influence (4).
For examples: If the influence degree of A to B is “extreme influence”, then fill 4 under B column; if the influence degree of D to A is “low influence”, then fill 1 under A column.
Dimensions/CriteriaABCD
A 4
B
C
D1
5. Filling the Influential Relationship among Four Dimensions by Pairwise Comparison
DimensionsTechnology (D1)Organization (D2)Environment (D3)Cost (D4)
Technology (D1)
Organization (D2)
Environment (D3)
Cost (D4)
Note: No influence (0); Low influence (1); Middle influence (2); High influence (3); Extreme influence (4).
6. Filling the Influential Relationship among Twelve Criteria by Pairwise Comparison
CriteriaTechnological integration (C11)Technological competence (C12)Technological security (C13)Executive support (C21)Company size (C22)Organizer’s IT capability (C23)Competitive pressure (C31)Partner integration (C32)Government policy (C33)Equipment cost (C41)Implement cost (C42)Maintenance cost (C43)
Technological integration (C11)
Technological competence (C12)
Technological security (C13)
Executive support (C21)
Company size (C22)
Organizer’s IT capability (C23)
Competitive pressure (C31)
Partner integration (C32)
Government policy (C33)
Equipment cost (C41)
Implement cost (C42)
Maintenance cost (C43)
Note: No influence (0); Low influence (1); Middle influence (2); High influence (3); Extreme influence (4).
7. Investigation of the Degree of Satisfaction for Criteria
According to the following twelve criteria to evaluate the degree of satisfaction of NFC technology promotion, including information technology industry (alternative A), logistics and transportation industry (alternative B), and education institution (alternative C). The performance scores are 0 to 4 (very bad/dissatisfaction ← 0, 1, 2, 3, 4 → very good/satisfaction).
CriteriaDegree of Satisfaction (Alternative A)Degree of Satisfaction (Alternative B)Degree of Satisfaction (Alternative C)
Technological integration (C11)(    )(    )(    )
Technological competence (C12)(    )(    )(    )
Technological security (C13)(    )(    )(    )
Executive support (C21)(    )(    )(    )
Company size (C22)(    )(    )(    )
Organizer’s IT capability (C23)(    )(    )(    )
Competitive pressure (C31)(    )(    )(    )
Partner integration (C32)(    )(    )(    )
Government policy (C33)(    )(    )(    )
Equipment cost (C41)(    )(    )(    )
Implement cost (C42)(    )(    )(    )
Maintenance cost (C43)(    )(    )(    )
Note: Very bad (0); Bad (1); Moderate (2); Good (3); Very good (4).
8. Basic Personal Data
(1)
Gender: □Male □Female
(2)
Education Level: □College □University □Master □PhD
(3)
Service Unit:        
(4)
Service Dept.:        
(5)
Job Title:         
(6)
Age: □Under 30 years old (including) □30~35 years old (including) □35~40 years old (including) □40~50 years old (including) □Over 50 years old

References

  1. Pesonen, J.; Horster, E. Near field communication technology in tourism. Tour. Manag. Perspect. 2012, 4, 11–18. [Google Scholar] [CrossRef]
  2. Shen, C.W.; Wu, Y.C.J.; Lee, T.C. Developing a NFC-equipped smart classroom: Effects on attitudes toward computer science. Comput. Hum. Behav. 2014, 30, 731–738. [Google Scholar] [CrossRef]
  3. Simon, H.A. Theories of bounded rationality. In Decision and Organization; McGuire, C.B., Radner, R., Eds.; North-Holland: Amsterdam, The Netherlands, 1972; pp. 161–176. [Google Scholar]
  4. Tzeng, G.H.; Huang, J.J. Multiple Attribute Decision Making: Methods and Applications; CRC Press (Taylor & Francis Group): New York, NY, USA, 2011. [Google Scholar]
  5. Liou, J.J.H.; Tzeng, G.H. Comments on multiple criteria decision making (MCDM) methods in economics: An overview. Technol. Econ. Dev. Econ. 2012, 18, 672–695. [Google Scholar] [CrossRef]
  6. Tzeng, G.H.; Huang, J.J. Fuzzy Multiple Objective Decision Making; CRC Press (Taylor & Francis Group): New York, NY, USA, 2013. [Google Scholar]
  7. Liou, J.J.H. New concepts and trends of MCDM for tomorrow—In honor of Professor Gwo-Hshiung Tzeng on the occasion of his 70th birthday. Technol. Econ. Dev. Econ. 2013, 19, 367–375. [Google Scholar] [CrossRef]
  8. Lu, M.T.; Lin, S.W.; Tzeng, G.H. Improving RFID adoption in Taiwan’s healthcare industry based on a DEMATEL technique with a hybrid MCDM model. Decis. Support Syst. 2013, 56, 259–269. [Google Scholar] [CrossRef]
  9. Hu, S.K.; Lu, M.T.; Tzeng, G.H. Exploring smart phone improvements based on a hybrid MCDM model. Expert Syst. Appl. 2014, 41, 4401–4413. [Google Scholar] [CrossRef]
  10. Hu, S.K.; Lu, M.T.; Tzeng, G.H. Improving mobile commerce adoption using a new hybrid fuzzy MADM model. Int. J. Fuzzy Syst. 2015, 17, 399–413. [Google Scholar] [CrossRef]
  11. Lu, M.T.; Hu, S.K.; Huang, L.H.; Tzeng, G.H. Evaluating the implementation of business-to-business m-commerce by SMEs based on a new hybrid MADM model. Manag. Decis. 2015, 53, 290–317. [Google Scholar] [CrossRef]
  12. Liou, J.J.H.; Tamošaitienė, J.; Zavadskas, E.K.; Tzeng, G.H. New hybrid COPRAS-GMADM model for improving and selecting suppliers in green supply chain management. Int. J. Prod. Res. 2016, 54, 114–134. [Google Scholar] [CrossRef]
  13. Liou, J.J.H.; Lu, M.T.; Hu, S.K.; Cheng, C.H.; Chuang, Y.C. A hybrid MCDM model for improving the electronic health record to better serve client needs. Sustainability 2017, 9, 1819. [Google Scholar] [CrossRef]
  14. Shen, K.Y.; Hu, S.K.; Tzeng, G.H. Financial modeling and improvement planning for the life insurance industry by using a rough knowledge based hybrid MCDM model. Inf. Sci. 2017, 375, 296–313. [Google Scholar] [CrossRef]
  15. Hu, S.K.; Tzeng, G.H. Strategizing for better life development using OECD well-being indicators in a hybrid fuzzy MCDM model. Int. J. Fuzzy Syst. 2017, 19, 1683–1702. [Google Scholar] [CrossRef]
  16. Fernández, M.J.L.; Fernández, J.G.; Aguilar, S.R.; Selvi, B.S.; Crespo, R.G. Control of attendance applied in higher education through mobile NFC technologies. Expert Syst. Appl. 2013, 40, 4478–4489. [Google Scholar] [CrossRef]
  17. Dutot, V. Factors influencing near field communication (NFC) adoption: An extended TAM approach. J. High Technol. Manag. Res. 2015, 26, 45–57. [Google Scholar] [CrossRef]
  18. Saaty, T.L. Decision Making with Dependence and Feedback: The Analytic Network Process; RWS Publications: Pittsburgh, PA, USA, 1996. [Google Scholar]
  19. Coskun, V.; Ozdenizci, B.; Ok, K. A survey on near field communication (NFC) technology. Wirel. Pers. Commun. 2013, 71, 2259–2294. [Google Scholar] [CrossRef]
  20. Ok, K.; Coskun, V.; Aydin, M.; Ozdenizci, B. Current benefits and future directions of NFC Services. In Proceedings of the International Conference on Education and Management Technology (ICEMT), Cairo, Egypt, 2–4 November 2010; pp. 334–338. [Google Scholar]
  21. Tornatzky, L.G.; Fleischer, M. The Processes of Technological Innovation; Lexington Books: Lanham, MD, USA, 1990. [Google Scholar]
  22. Brown, I.; Russell, J. Radio frequency identification technology: An exploratory study on adoption in the South African retail sector. Int. J. Inf. Manag. 2007, 27, 250–265. [Google Scholar] [CrossRef]
  23. Kinsella, B. The Wal-mart factor. Ind. Eng. 2003, 35, 32–36. [Google Scholar]
  24. Premkumar, G.; Roberts, M. Adoption of new information technologies in rural small businesses. Int. J. Manag. Sci. 1999, 27, 467–484. [Google Scholar] [CrossRef]
  25. Sharma, A.; Citurs, A. Radio frequency identification (RFID) adoption drivers: A radical innovation adoption perspective. In Proceedings of the Eleventh American Conference on Information Systems, Omaha, NE, USA, 11–14 August 2005; pp. 1213–1218. [Google Scholar]
  26. Ranganathan, C.; Jha, S. Adoption of RFID technology: An exploratory examination from supplier’s perspective. In Proceedings of the Eleventh American Conference on Information Systems, Omaha, NE, USA, 11–14 August 2005; pp. 2195–2199. [Google Scholar]
  27. Orlikowski, W.J. CASE tools as organizational change: Investigating incremental and radical changes in systems development. MIS Q. 1993, 17, 309–340. [Google Scholar] [CrossRef]
  28. Gabus, A.; Fontela, E. World Problems, an Invitation to Further thought within the Framework of DEMATEL; Battelle Geneva Research Centre: Geneva, Switzerland, 1972. [Google Scholar]
  29. Gabus, A.; Fontela, E. Perceptions of the World Problematique: Communication Procedure, Communicating with Those Bearing Collective Responsibility (DEMATEL Report No. 1); Battelle Geneva Research Centre: Geneva, Switzerland, 1973. [Google Scholar]
  30. Shen, Y.C.; Lin, G.T.R.; Tzeng, G.H. Combined DEMATEL techniques with novel MCDM for the organic light emitting diode technology selection. Expert Syst. Appl. 2011, 38, 1468–1481. [Google Scholar] [CrossRef]
  31. Lee, H.S.; Tzeng, G.H.; Yeih, W.; Wang, Y.J.; Yang, S.C. Revised DEMATEL: Resolving the Infeasibility of DEMATEL. Appl. Math. Model. 2013, 37, 6746–6757. [Google Scholar] [CrossRef]
  32. Peng, K.H.; Tzeng, G.H. A hybrid dynamic MADM model for problems-improvement in economics and business. Technol. Econ. Dev. Econ. 2013, 19, 638–660. [Google Scholar] [CrossRef]
  33. Tzeng, G.H.; Shen, K.Y. New Concepts and Trends of Hybrid Multiple Criteria Decision Making; CRC Press (Taylor & Francis Group): New York, NY, USA, 2017. [Google Scholar]
  34. Tzeng, G.H.; Chiang, C.H.; Li, C.W. Evaluating intertwined effects in e-learning programs: A novel hybrid MCDM model based on factor analysis and DEMATEL. Expert Syst. Appl. 2007, 32, 1028–1044. [Google Scholar] [CrossRef]
  35. Yang, J.L.; Tzeng, G.H. An integrated MCDM technique combined with DEMATEL for a novel cluster-weighted with ANP method. Expert Syst. Appl. 2011, 38, 1417–1424. [Google Scholar] [CrossRef]
  36. Wang, Y.L.; Tzeng, G.H. Brand marketing for creating brand value based on a MCDM model combining DEMATEL with ANP and VIKOR methods. Expert Syst. Appl. 2012, 39, 5600–5615. [Google Scholar] [CrossRef]
  37. Liu, C.H.; Tzeng, G.H.; Lee, M. H Improving tourism policy implementation—The use of hybrid MCDM models. Tour. Manag. 2012, 33, 413–426. [Google Scholar] [CrossRef]
  38. Liu, C.H.; Tzeng, G.H.; Lee, M.H.; Lee, P.Y. Improving metro-airport connection service for tourism development: Using hybrid MCDM models. Tour. Manag. Perspect. 2013, 6, 95–107. [Google Scholar] [CrossRef]
  39. Chiu, W.Y.; Tzeng, G.H.; Li, H.L. A new hybrid MCDM model combining DANP with VIKOR to improve e-store business. Knowl.-Based Syst. 2013, 37, 48–61. [Google Scholar] [CrossRef]
  40. Liou, J.J.H.; Chuang, Y.C.; Tzeng, G.H. A fuzzy integral-based model for supplier evaluation and improvement. Inf. Sci. 2014, 266, 199–217. [Google Scholar] [CrossRef]
  41. Shen, K.Y.; Yan, M.R.; Tzeng, G.H. Combining VIKOR-DANP model for glamor stock selection and stock performance improvement. Knowl.-Based Syst. 2014, 58, 86–97. [Google Scholar] [CrossRef]
  42. Lu, I.Y.; Kuo, T.; Lin, T.S.; Tzeng, G.H.; Huang, S.L. Multicriteria decision analysis to develop effective sustainable development strategies for enhancing competitive advantages: Case of the TFT-LCD industry in Taiwan. Sustainability 2016, 8, 646. [Google Scholar] [CrossRef]
  43. Opricovic, S.; Tzeng, G.H. Compromise solution by MCDM methods: A comparative analysis of VIKOR and TOPSIS. Eur. J. Oper. Res. 2004, 156, 445–455. [Google Scholar] [CrossRef]
  44. Yu, P.L. A class of solutions for group decision problems. Manag. Sci. 1973, 19, 936–946. [Google Scholar] [CrossRef]
  45. Opricovic, S. Multicriteria Optimization of Civil Engineering Systems; Faculty of Civil Engineering: Belgrade, Serbia, 1998. [Google Scholar]
  46. Opricovic, S.; Tzeng, G.H. Multicriteria planning of post-earthquake sustainable reconstruction. Comput.-Aided Civil Infrastruct. Eng. 2002, 17, 211–220. [Google Scholar] [CrossRef]
  47. Opricovic, S.; Tzeng, G.H. Extended VIKOR method in comparison with outranking methods. Eur. J. Oper. Res. 2007, 178, 514–529. [Google Scholar] [CrossRef]
  48. Liou, J.J.H.; Tsai, C.Y.; Lin, R.H.; Tzeng, G.H. A modified VIKOR multiple-criteria decision method for improving domestic airlines service quality. J. Air Transp. Manag. 2011, 17, 57–61. [Google Scholar] [CrossRef]
  49. Ou Yang, Y.P.; Shieh, H.M.; Tzeng, G.H. A VIKOR technique based on DEMATEL and ANP for information security risk control assessment. Inf. Sci. 2013, 232, 482–500. [Google Scholar] [CrossRef]
  50. Xiong, L.; Teng, C.L.; Zhu, B.W.; Tzeng, G.H.; Huang, S.L. Using the D-DANP-mV model to explore the continuous system improvement strategy for sustainable development of creative communities. Int. J. Environ. Res. Public Health 2017, 14, 1309. [Google Scholar] [CrossRef] [PubMed]
Figure 1. Research framework for improving NFC technology promotion in the context of creating the sustainable education environment to facilitate closing goal-achieving.
Sustainability 10 01379 g001
Figure 2. Hybrid modified MADM model procedures.
Sustainability 10 01379 g002
Figure 3. Influence network relation map (INRM) for systematic improvement: (a) The influence relation among criteria in environment dimension; (b) The influence relation among criteria in cost dimension; (c) the influence relation among all dimensions; (d) The influence relation among criteria in organization dimension; (e) The influence relation among criteria in technology dimension.
Sustainability 10 01379 g003
Table 1. The average direct influence relation matrix O.
CriteriaC11C12C13C21C22C23C31C32C33C41C42C43
C110.0003.3333.4172.6672.1672.6672.9173.4172.5003.0003.0833.083
C123.2500.0003.5832.9171.9173.0002.6672.6672.5002.6673.0832.667
C133.1673.0000.0002.9172.0832.5002.5002.3333.0002.1672.4172.417
C213.4172.7502.5830.0003.0833.3332.6672.6672.5832.7502.7502.917
C222.2502.0832.0832.6670.0003.1672.5002.3332.3333.0832.5002.750
C232.5832.9172.5832.8333.1670.0002.1672.5002.8332.2502.5002.250
C312.9172.7502.4172.6672.4172.4170.0003.0002.5832.5002.8332.667
C322.6672.8332.4172.6672.1673.0003.3330.0002.5832.0002.6672.333
C333.3332.5832.9172.6671.9172.9172.4173.0830.0002.5002.4172.750
C413.2502.3332.3332.9172.8332.9172.2502.0002.0000.0003.3332.750
C422.9172.8332.7502.6672.7502.9172.5832.4172.3333.0000.0003.333
C433.0002.9172.4172.5833.2502.9172.8332.5832.1673.3333.0000.000
Note: The consensus of average gap = 1 n ( n 1 ) i = 1 n j = 1 n ( | a i j a a i j a 1 | / a i j a ) × 100 % = 2.8 % < 5 % in consensus of experts, where n is the number of criteria, a is the number of 13 experts in practical experience.
Table 2. The total influence relation matrix T.
CriteriaC11C12C13C21C22C23C31C32C33C41C42C43
C110.9080.9420.9220.9170.8420.9560.8890.9070.8420.9020.9400.921
C120.9650.8180.8960.8920.8070.9320.8530.8580.8140.8630.9080.880
C130.9010.8440.7410.8350.7570.8590.7930.7940.7740.7940.8320.816
C210.9820.9080.8820.8230.8500.9550.8650.8700.8270.8780.9120.899
C220.8530.7970.7780.8060.6790.8540.7720.7720.7360.7970.8120.803
C230.8840.8400.8120.8320.7850.7880.7830.7970.7680.7960.8330.811
C310.9100.8520.8230.8430.7800.8730.7370.8250.7760.8170.8580.838
C320.8890.8410.8110.8300.7620.8740.8170.7290.7650.7910.8410.816
C330.9300.8560.8450.8510.7750.8940.8130.8360.7110.8250.8560.848
C410.9120.8350.8160.8440.7870.8800.7950.7940.7560.7420.8660.835
C420.9440.8860.8630.8750.8190.9190.8400.8400.7980.8620.8110.887
C430.9580.8990.8650.8840.8430.9310.8570.8550.8040.8810.9060.805
Table 3. The sum of influences given/received from matrix TD and TC.
Dimensions/Criteriariciri + cirici
Technology (D1)3.4573.4896.946−0.032
Organization (D2)3.3163.3826.697−0.066
Environment (D3)3.3043.2296.5330.075
Cost (D4)3.4103.3876.7980.023
Technological integration (C11)10.88811.03421.922−0.147
Technological competence (C12)10.48510.31620.8010.169
Technological security (C13)9.74010.05419.794−0.314
Executive support (C21)10.65410.23220.8860.422
Company size (C22)9.4589.48618.945−0.028
Organizer’s IT capability (C23)9.72910.71720.446−0.989
Competitive pressure (C31)9.9319.81419.7460.117
Partner integration (C32)9.7679.87619.643−0.109
Government policy (C33)10.0409.37019.4100.670
Equipment cost (C41)9.8639.95019.813−0.087
Implement cost (C42)10.34410.37520.720−0.031
Maintenance cost (C43)10.48710.15920.6460.328
Table 4. The unweighted supermatrix W = ( T C α ) .
CriteriaC11C12C13C21C22C23C31C32C33C41C42C43
C110.3270.3600.3620.3540.3510.3490.3520.3500.3530.3560.3510.352
C120.3400.3050.3390.3270.3280.3310.3300.3310.3250.3260.3290.330
C130.3330.3350.2980.3180.3200.3200.3190.3190.3210.3180.3200.318
C210.3380.3390.3400.3130.3450.3460.3380.3370.3380.3360.3350.333
C220.3100.3070.3090.3230.2900.3270.3130.3090.3070.3130.3140.317
C230.3520.3540.3510.3630.3650.3280.3500.3550.3550.3510.3520.350
C310.3370.3380.3360.3380.3390.3340.3150.3530.3450.3390.3390.341
C320.3440.3400.3360.3400.3390.3390.3530.3160.3540.3380.3390.340
C330.3190.3220.3280.3230.3230.3270.3320.3310.3010.3220.3220.320
C410.3260.3260.3250.3270.3300.3260.3250.3230.3260.3040.3370.340
C420.3400.3420.3410.3390.3370.3410.3410.3430.3380.3540.3170.350
C430.3340.3320.3340.3340.3330.3320.3330.3330.3350.3420.3460.310
Table 5. The weighted super-matrix W α = T D α W .
CriteriaC11C12C13C21C22C23C31C32C33C41C42C43
C110.0830.0920.0920.0920.0910.0900.0920.0910.0920.0920.0910.091
C120.0870.0780.0870.0850.0850.0860.0860.0860.0850.0850.0850.086
C130.0850.0850.0760.0820.0830.0830.0830.0830.0840.0830.0830.083
C210.0850.0850.0850.0770.0850.0850.0850.0850.0850.0850.0850.084
C220.0780.0770.0770.0800.0720.0810.0790.0780.0770.0790.0790.080
C230.0880.0890.0880.0900.0900.0810.0880.0890.0890.0890.0890.089
C310.0820.0820.0810.0810.0820.0800.0740.0830.0810.0810.0810.081
C320.0830.0820.0810.0820.0820.0820.0830.0740.0830.0810.0810.081
C330.0770.0780.0790.0780.0780.0790.0780.0780.0710.0770.0770.076
C410.0820.0820.0820.0830.0840.0820.0820.0810.0820.0750.0830.084
C420.0860.0860.0860.0860.0850.0860.0860.0860.0850.0880.0780.087
C430.0840.0840.0840.0850.0840.0840.0840.0840.0840.0850.0860.077
Table 6. The steady-state super-matrix lim β ( W α ) β with influence weights.
CriteriaC11C12C13C21C22C23C31C32C33C41C42C43
C110.09090.09090.09090.09090.09090.09090.09090.09090.09090.09090.09090.0909
C120.08500.08500.08500.08500.08500.08500.08500.08500.08500.08500.08500.0850
C130.08280.08280.08280.08280.08280.08280.08280.08280.08280.08280.08280.0828
C210.08430.08430.08430.08430.08430.08430.08430.08430.08430.08430.08430.0843
C220.07820.07820.07820.07820.07820.07820.07820.07820.07820.07820.07820.0782
C230.08820.08820.08820.08820.08820.08820.08820.08820.08820.08820.08820.0882
C310.08090.08090.08090.08090.08090.08090.08090.08090.08090.08090.08090.0809
C320.08130.08130.08130.08130.08130.08130.08130.08130.08130.08130.08130.0813
C330.07720.07720.07720.07720.07720.07720.07720.07720.07720.07720.07720.0772
C410.08200.08200.08200.08200.08200.08200.08200.08200.08200.08200.08200.0820
C420.08550.08550.08550.08550.08550.08550.08550.08550.08550.08550.08550.0855
C430.08370.08370.08370.08370.08370.08370.08370.08370.08370.08370.08370.0837
Table 7. The influential weights of dimensions and criteria.
DimensionsLocal WeightsRankingsCriteriaLocal WeightsRankingsGlobal WeightsRankings
Technology (D1)0.25871Technological integration (C11)0.351310.09091
Technological competence (C12)0.328620.08504
Technological security (C13)0.320130.08287
Organization (D2)0.25073Executive support (C21)0.336320.08435
Company size (C22)0.311830.078211
Organizer’s IT capability (C23)0.351910.08822
Environment (D3)0.23944Competitive pressure (C31)0.337720.080910
Partner integration (C32)0.339710.08139
Government policy (C33)0.322630.077212
Cost (D4)0.25122Equipment cost (C41)0.326330.08208
Implement cost (C42)0.340410.08553
Maintenance cost (C43)0.333320.08376
Table 8. The comparison of performance-gap for the traditional and modified VIKOR methods.
Dimensions/CriteriaGlobal WeightsLocal WeightsScore AScore BScore CTraditional Method (Gap)Proposed Approach (Gap)
ABCABC
Technology (D1) 0.25873.5902.9632.8640.0000.8240.7400.1030.2590.284
 Technological integration (C11)0.09090.35133.7503.1252.5000.0000.5001.0000.0630.2190.375
 Technological competence (C12)0.08500.32863.7502.8753.0000.0001.0000.8750.0630.2810.250
 Technological security (C13)0.08280.32013.2502.8753.1250.0001.0000.3330.1880.2810.219
Organization (D2) 0.25073.2093.0072.5820.0500.4611.0000.1980.2480.354
 Executive support (C21)0.08430.33633.3752.8752.8750.0001.0001.0000.1560.2810.281
 Company size (C22)0.07820.31183.1252.8752.5000.0000.4001.0000.2190.2810.375
 Organizer’s IT capability (C23)0.08820.35193.1253.2502.3750.1430.0001.0000.2190.1880.406
Environment (D3) 0.23943.5843.0842.3370.0000.3981.0000.1040.2290.416
 Competitive pressure (C31)0.08090.33773.8753.2502.5000.0000.4551.0000.0310.1880.375
 Partner integration (C32)0.08130.33973.3753.0002.3750.0000.3751.0000.1560.2500.406
 Government policy (C33)0.07720.32263.5003.0002.1250.0000.3641.0000.1250.2500.469
Cost (D3) 0.25123.4173.1252.9570.1110.5990.8300.1460.2190.261
 Equipment cost (C41)0.08200.32633.6253.1253.1250.0001.0001.0000.0940.2190.219
 Implement cost (C42)0.08550.34043.6253.1253.0000.0000.8001.0000.0940.2190.250
 Maintenance cost (C43)0.08370.33333.0003.1252.7500.3330.0001.0000.2500.2190.313
Total average gap ratio ( C k ) 0.0410.5750.9330.1380.2390.327
Ranking (1)(2)(3)(1)(2)(3)
Note: Alternatives A, B, and C are information technology industry, logistics and transportation industry, and education institution, respectively.

