Article

Spatial Changes of Urban Heat Island Formation in the Colombo District, Sri Lanka: Implications for Sustainability Planning

1
Graduate School of Life and Environmental Sciences, University of Tsukuba, 1-1-1 Tennodai, Tsukuba, Ibaraki 305-8572, Japan
2
Department of Environmental Management, Faculty of Social Sciences and Humanities, Rajarata University of Sri Lanka, Mihintale 50300, Sri Lanka
3
National Institute for Environmental Studies, 16-2 Onogawa, Tsukuba, Ibaraki 305-8506, Japan
4
Faculty of Life and Environmental Sciences, University of Tsukuba, 1-1-1 Tennodai, Tsukuba, Ibaraki 305-8572, Japan
*
Authors to whom correspondence should be addressed.
Sustainability 2018, 10(5), 1367; https://doi.org/10.3390/su10051367
Submission received: 16 March 2018 / Revised: 11 April 2018 / Accepted: 20 April 2018 / Published: 27 April 2018
(This article belongs to the Special Issue Urban Green Infrastructure and Climate Adaptation)

Abstract

:
The formation of surface urban heat islands (SUHIs) can cause significant adverse impacts on the quality of living in urban areas. Monitoring the spatial patterns and trajectories of UHI formations could be helpful to urban planners in crafting appropriate mitigation and adaptation measures. This study examined the spatial pattern of SUHI formation in the Colombo District (Sri Lanka), based on land surface temperature (LST), a normalized difference vegetation index (NDVI), a normalized difference built-up index (NDBI), and population density (PD) using a geospatial-based hot and cold spot analysis tool. Here, ‘hot spots’ refers to areas with significant spatial clustering of high variable values, while ‘cold spots’ refers to areas with significant spatial clustering of low variable values. The results indicated that between 1997 and 2017, 32.7% of the 557 divisions in the Colombo District persisted as hot spots. These hot spots were characterized by a significant clustering of high composite index values resulting from the four variables (LST, NDVI (inverted), NDBI, and PD). This study also identified newly emerging hot spots, which accounted for 49 divisions (8.8%). Large clusters of hot spots between both time points were found on the western side of the district, while cold spots were found on the eastern side of the district. The areas identified as hot spots are the more urbanized parts of the district. The emerging hot spots were in areas that had undergone landscape changes due to urbanization. Such areas are found between the persistent hot spots (western parts of the district) and persistent cold spots (eastern parts of the district). Generally, the spatial pattern of the emerging hot spots followed the pattern of urbanization in the district, which had been expanding from west to east. Overall, the findings of this study could be used as a reference in the context of sustainable landscape and urban planning for the Colombo District.

Graphical Abstract

1. Introduction

The United Nations population projection shows that by 2050, the world’s urban population would increase by 2.5 billion [1]. The United Nations has also projected that urbanization rate would be faster in the developing regions (Asia and Africa) [1]. Previous studies show that rapid urbanization results in many environmental problems, such as urban heat island (UHI) effects, climate change at the local and regional scales [2], greenhouse gas emissions, and the breakdown of ecological cycles [3,4].
The UHI phenomenon is recognized as among the various negative impacts of the rapid urbanization [5]. It has occurred as a result of increasing land surface temperature (LST) due to vegetation loss, thus giving way to the expansion of impervious surfaces [2,3]. UHIs can cause adverse impacts on humans and the environment, e.g., compromised human health and comfort and elevated energy consumption, among others [3,6,7]. Hence, it is essential to study the spatial variation of UHIs to enable implementation of appropriate mitigation and adaptation measures. As such, UHI is a major research topic in many fields, such as urban planning, urban climatology, urban geography, and urban ecology [3].
UHI can be classified into two types: (1) SUHI; and (2) atmospheric UHI. SUHI is measured by using LST derived from satellite data (thermal bands), while atmospheric UHI is measured based on air temperature data, e.g., those collected by weather stations [8,9,10]. UHI studies based on the LST are getting more popular among scientists owing to the availability of a series of sensors (such as Landsat, MODIS, and ASTER) that provide vast coverage of the world [8,9]. In addition, temporal repetition and full spatial coverage [9,11] as well as time and cost-effectiveness of satellite thermal remote sensing data [12] help to identify the changing pattern of urban climate dynamics [9,11]. Furthermore, thermal remote sensing facilitates the examination of the relationship between LST and urban landscape pattern and the potential impacts of SUHIs on urban ecological environments [5]. Hence, small to medium size SUHI studies in various cities have been conducted [2,3,10,13,14]. On the other hand, SUHI studies have been undertaken for various city landscapes such as those of coastal cities [3,4,15], desert cities [16] and mountain cities [10]. SUHI-related studies for tropical coastal cities are getting more popular. Most of the studies are focused on the relationship between LST and urban landscape pattern [3,4].
Mean LST has been used in many studies to identify the spatial pattern of SUHI effects in urban areas [17,18,19,20]. LST based on the thermal remote sensing better identifies the climatic conditions compared to air temperature from weather stations [9,21]. The Getis-Ord Gi* statistic is among the most commonly used tool for analyzing spatial changes in clustering patterns of hot spot and has been used in many fields of studies, including healthcare [22], disaster management [23], urbanization [24], transport management [25], infrastructure development [26], incident management [27], land cover influence [28], heat wave vulnerability [29], ecology [30], green volume estimation [31], and LST changes [9,28,32]. For an area or a pixel to become a hot spot, it should have a high value and be surrounded by other areas or pixels, also with high values [33]. In other words, a hot spot refers to areas or pixels with significant spatial clustering of high variable values. Hot and cold spot analysis can also be used to detect changes in the spatial clustering pattern of LST between time points [9]. Hence, this present study focused on using available methodologies to identify the changing spatial clustering pattern of SUHI formation of the Colombo District of Sri Lanka.
Over the past decade, the Colombo District, the administrative and economic center of the country, has undergone rapid infrastructural urban development, including various development projects, e.g., road development [34] and urban beautification projects [4,35]. However, due to these infrastructural developments, most of the vegetated areas have been lost and have become impervious surfaces. This landscape transformation is hypothesized to have contributed to SUHI formation in the area [4,12]. Previous SUHI studies of the Colombo Metropolitan Area (CMA) and Colombo City are available based on the pixel-based remote sensing data [4,12]. These previous studies reveal that SUHI expanded into the northern, southern, and eastern parts of the district, and was mainly distributed along the western coastal belt [4,12]. However, SUHI related research is still needed to identify vulnerable areas for implementing sustainable urban planning.
Previous studies [4,12] were focused on identifying LST changes based on the green and impervious surface using pixel-based thermal remote sensing data by using the absolute value of the variables. The findings of the above two studies helped to identify SUHI effects in only the western part of Colombo District. However, these studies were unable to identify the SUHI formation pattern and its spatiotemporal changes based on the administrative boundaries. Administrative boundaries are much more important for policy makers and urban planners to implement the suitable mitigation measures. Hence, this present study focused on examining the spatial pattern of SUHI formation in the Colombo District based on four variables, namely LST, NDVI, NDBI, population density, by using the geospatial-based hot and cold spots analysis tool. In addition, it also identified new SUHI hot spots formed between 1997 and 2017. The study hypothesized that the use of LST, NDVI, NDBI, and population density, as well as the use of a geospatial-based hot and cold spot analysis tool, could provide a better understanding of the SUHI formation and its spatiotemporal pattern based on the 557 administrative divisions of the Colombo District. The spatiotemporal changes of SUHI formation can be used as a proxy indicator to facilitate future sustainable landscape and urban planning.

2. Materials and Methods

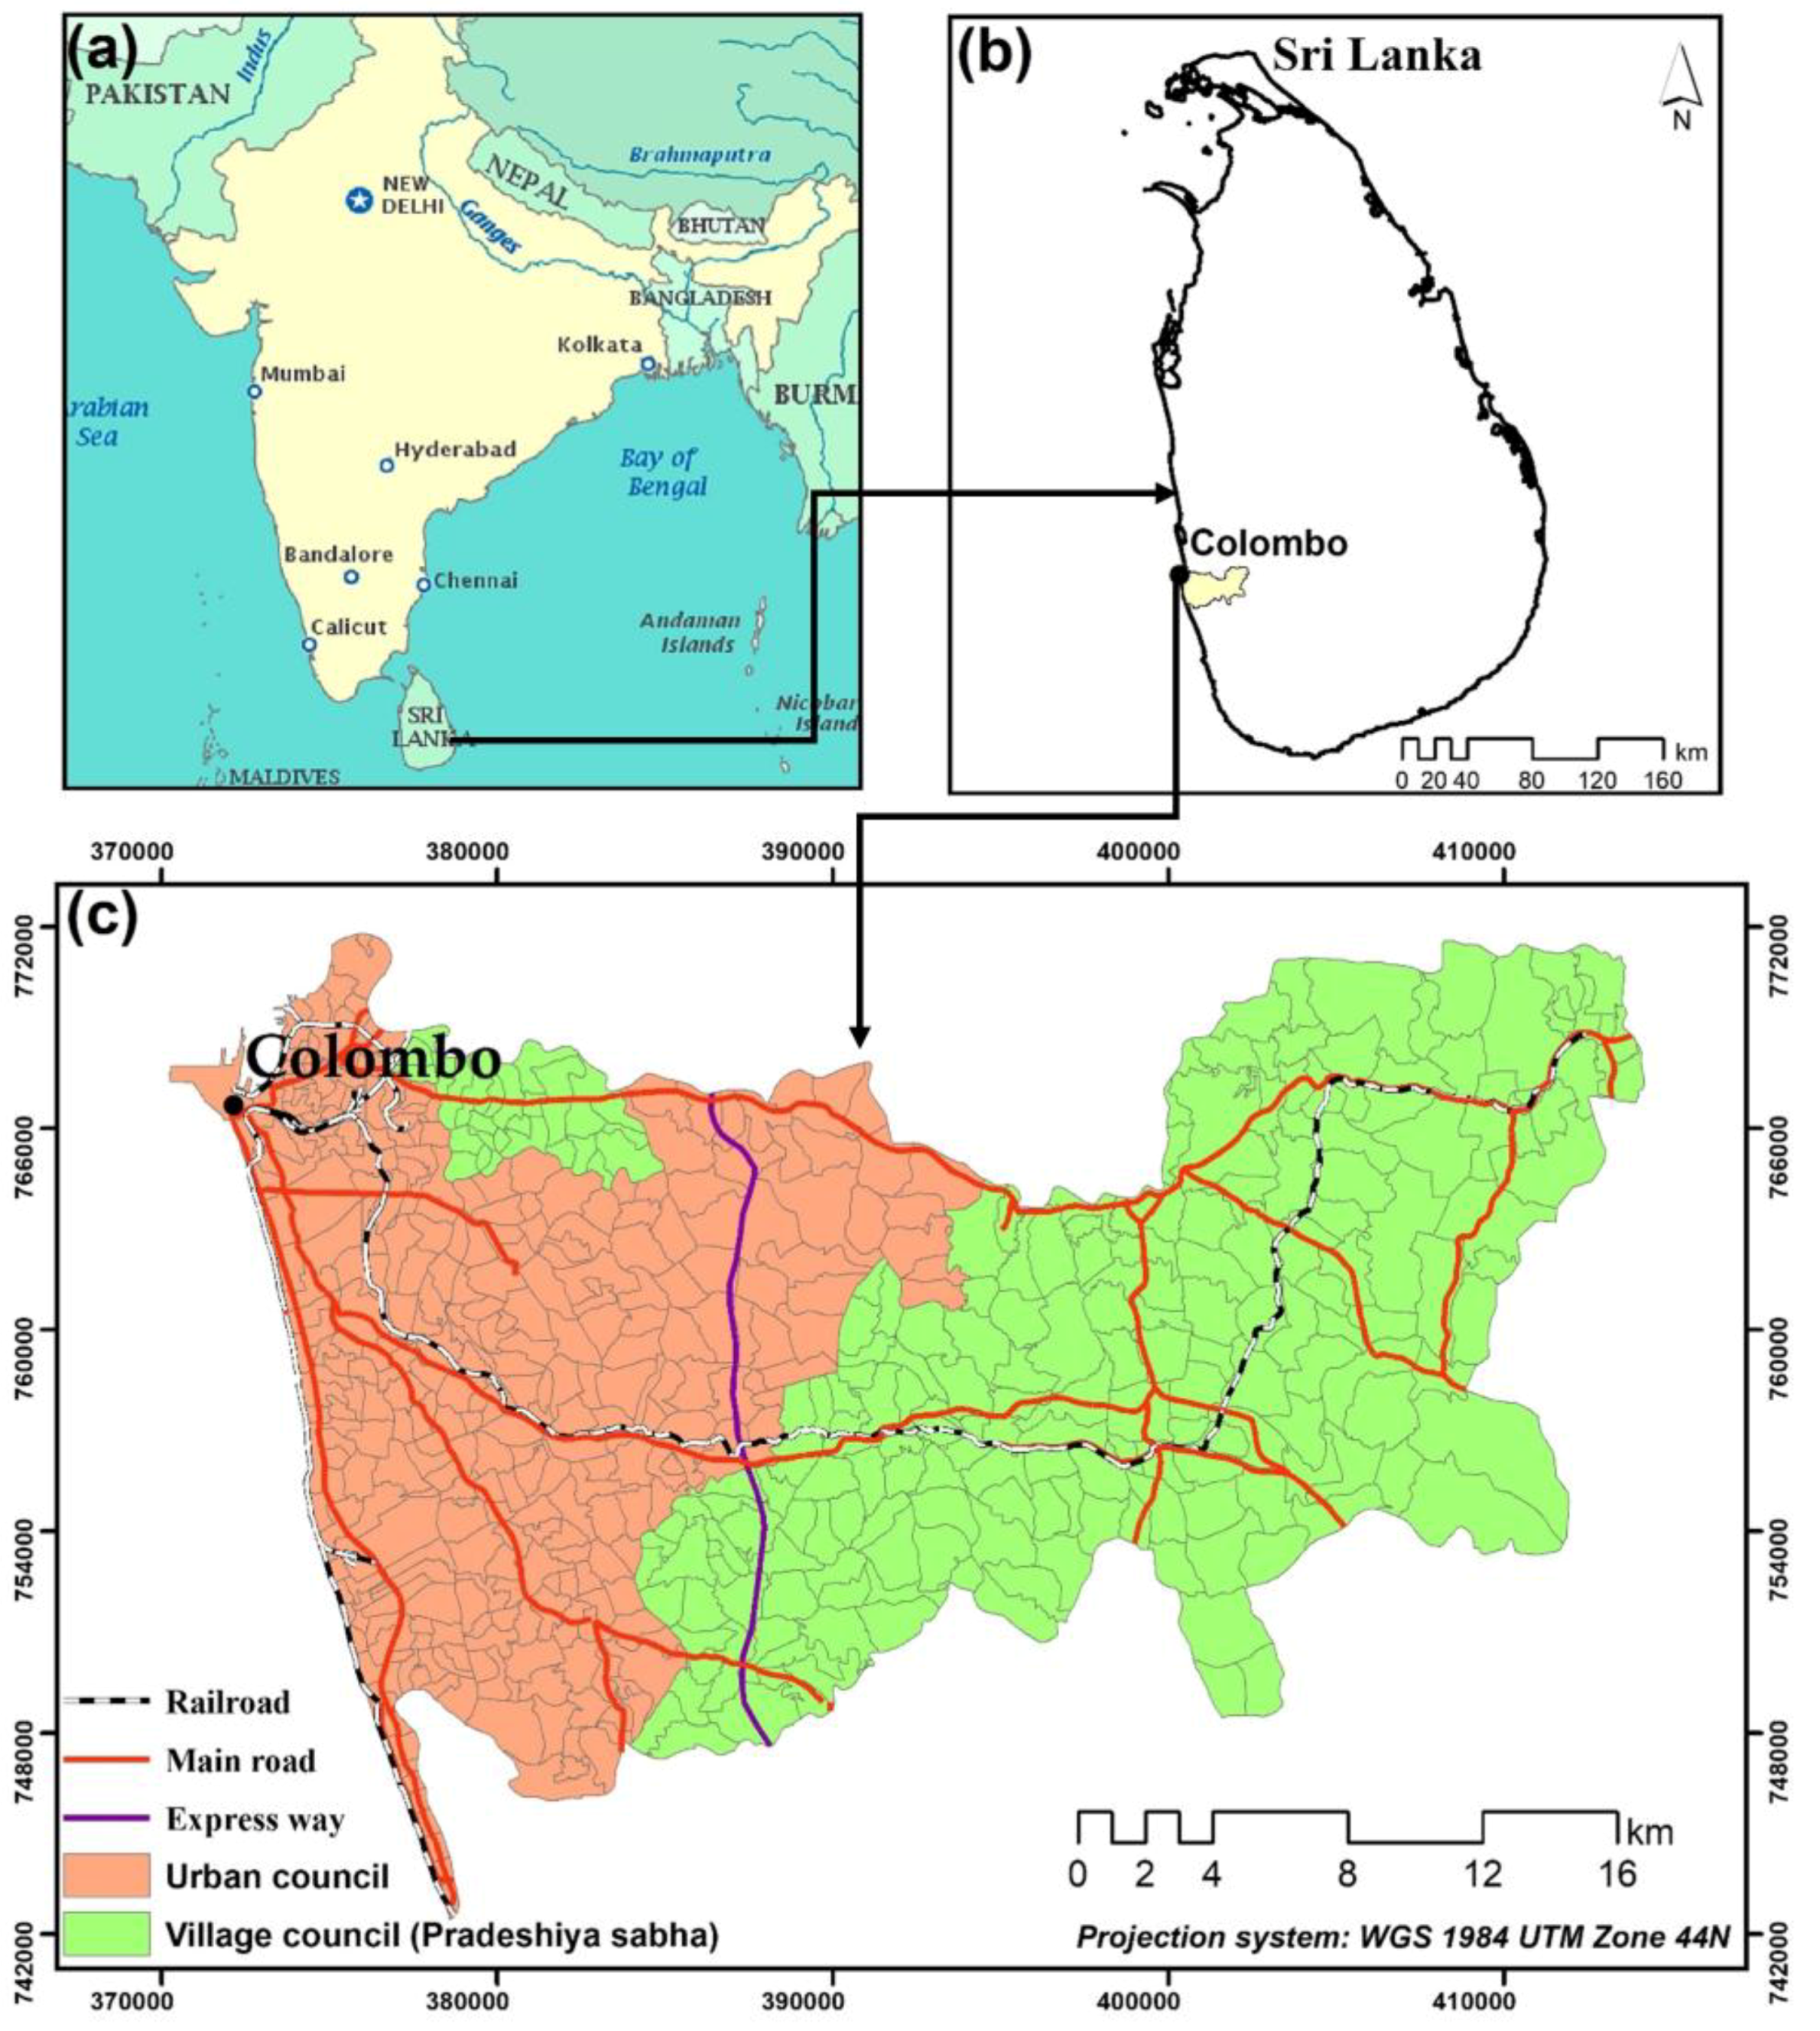
2.1. Study Area: the Colombo District, Sri Lanka

The Colombo District is situated in a western province of Sri Lanka, an island in the western part of the Indian Ocean (Figure 1), between 6°42′ and 6°58′ N latitude and 79°50′ and 80°13′ E longitude.
The district is situated in a lowland region, characterized by a typically hot and humid climate [4] with two main monsoons and two inter-monsoon periods. The southwest monsoon from late May to the end of September delivers much rainfall, while the northeast monsoon from the end of November to mid-February [36] brings relatively less rainfall. Hence, the period from December to early March can be considered as a dry period of the study area. The average annual rainfall is 2300 mm [4], and the mean annual temperature is approximately 28 °C [37]. Mean daily sunshine varies from 9 h in February to 5 h in June [38]. Most of the built-up areas in the district are found along the coastal belt on its western side and along the main transportation network. Between 2001 and 2012, the urban population of the Colombo District increased by 23% [39]. Colombo district population shows an increasing trend. It increased by 1,699,241 in 1981 [40] to 2,449,364 (projected) in 2017.

2.2. Satellite Images

Landsat images acquired during the dry season on the 7th February 1997 (Landsat 5 TM) and the 13th January 2017 (Landsat 8 OLI/TIRS) (http://earthexplorer.usgs.gov/) were used in this study (Table 1). The Colombo District is located on path 141 and row 55. The two satellite images were projected using a WGS84/UTM 44 N projection. Before processing, the images were subjected to radiometric calibration and atmospheric correction using the TerrSet software [10]. During this correction, the digital number (DN) values of the multispectral bands were converted to surface reflectance values. The DN value of thermal bands converted into atmosphere brightness temperature in degree Kelvin [10,41]. The pre-processed images were used to extract the LST, NDVI, and NDBI of the study area for 1997 and 2017.

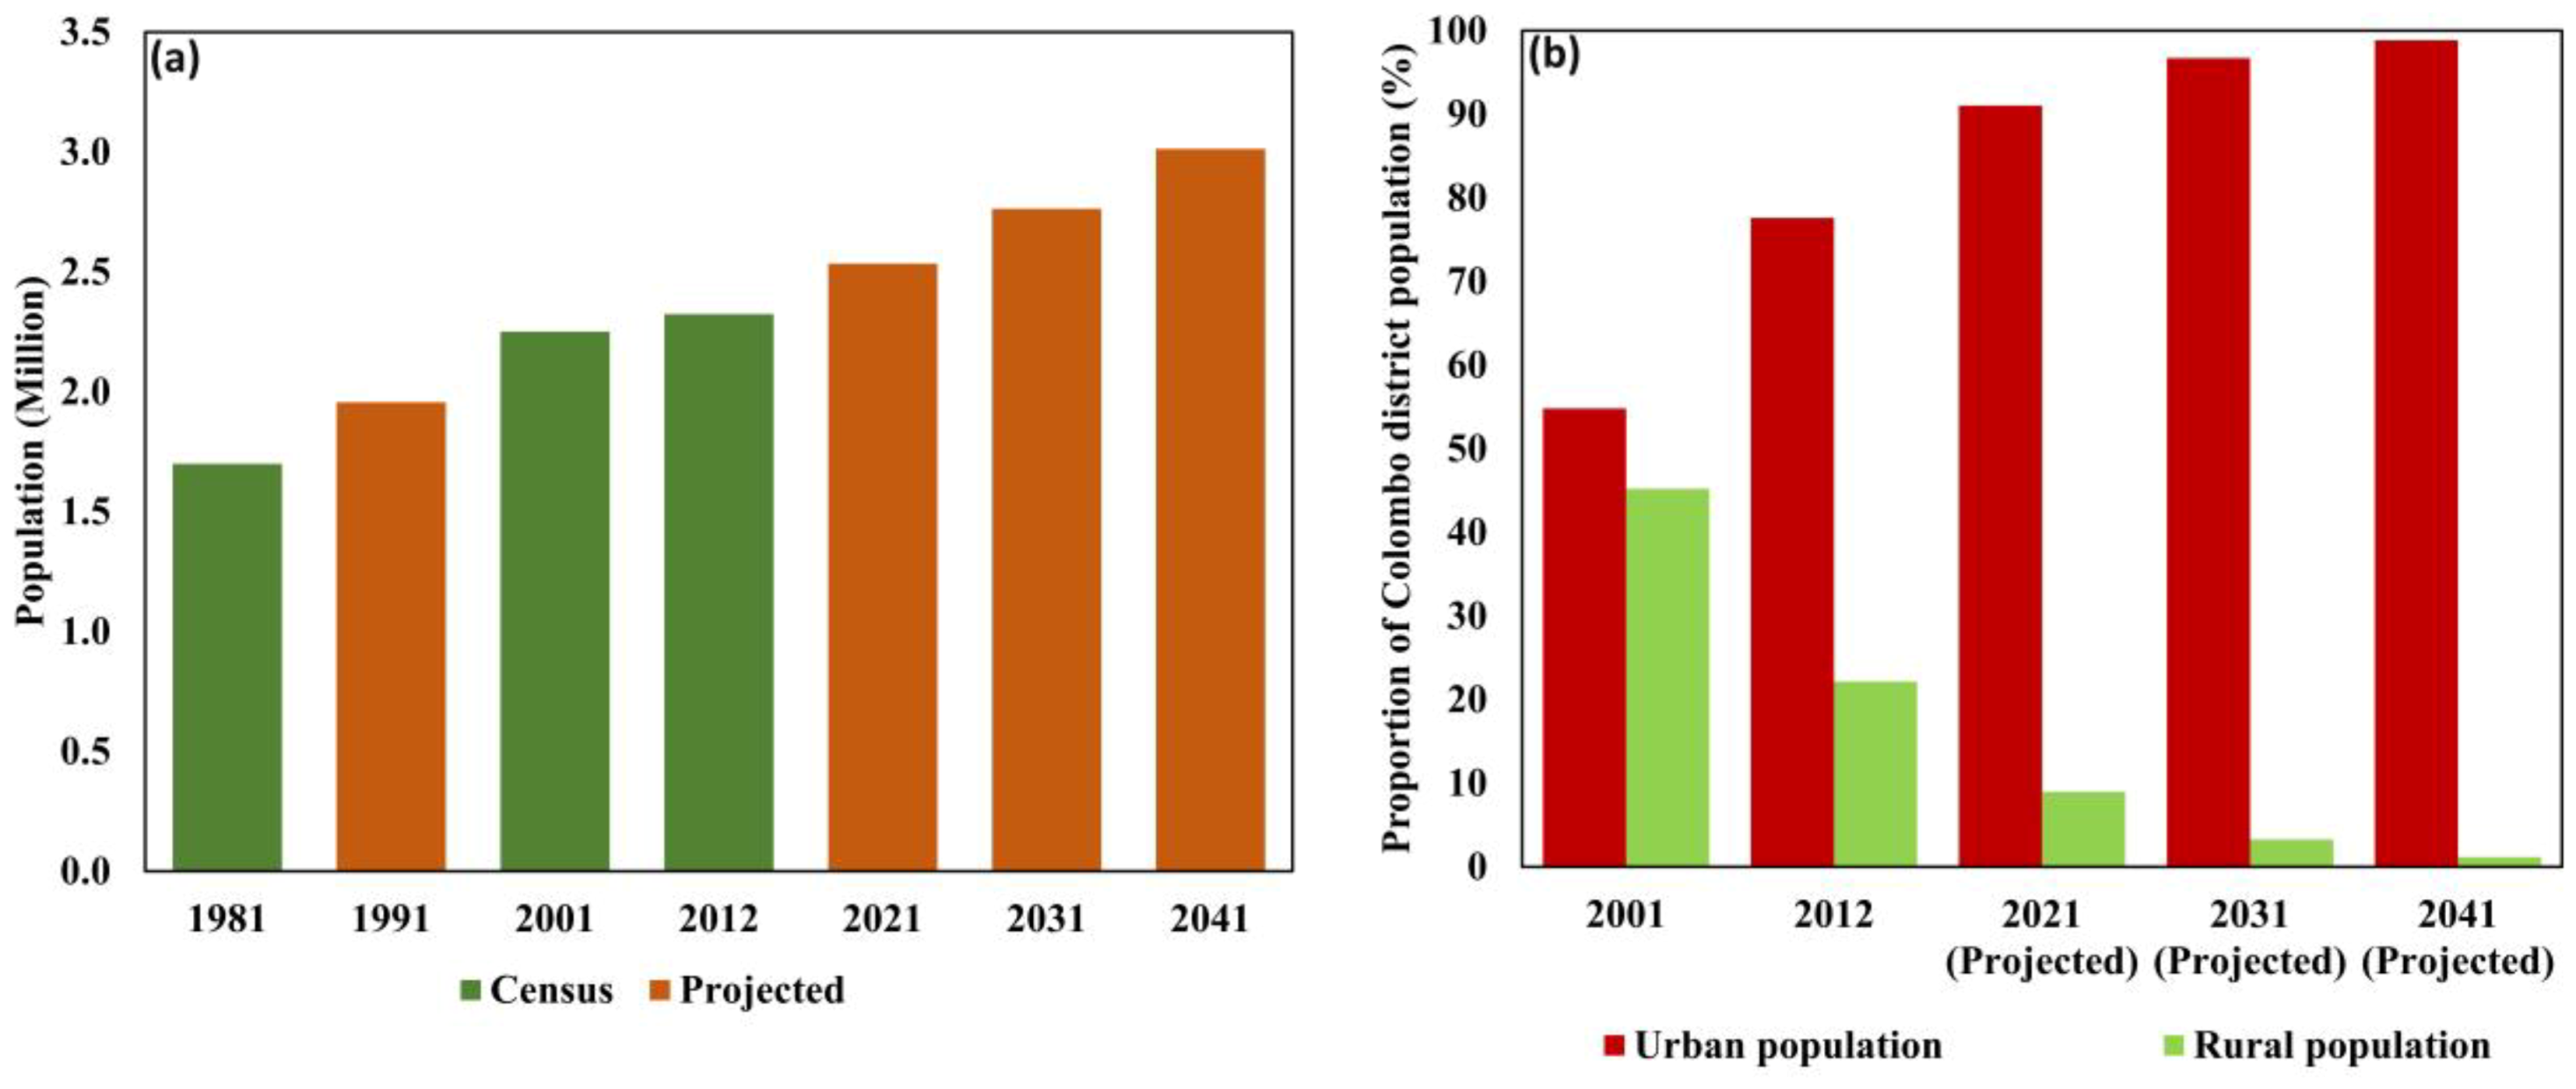
2.3. Population Data

The population of the Colombo District in 1997 and 2017 was projected using the population of 1981, 2001, and 2012 census data. The average population growth rate (APGR) was calculated based on the population for each administrative division for the census year 1981, 2001 and 2017. The population for 1997 and 2017 was projected by using the APGR of each division. The population density of each administrative division was calculated by dividing its population by its land area.

2.4. NDVI Calculation

The NDVI, an important variable in urban climate studies [42], is derived from remote sensing data by using the reflectance in the red (RED) and near-infrared (NIR) portions of the electromagnetic spectrum [43,44]. The NDVI map produced had a value ranging from −1 to +1. Larger NDVI values indicate vegetation, small positive values represent bare soils or built-up areas, and negative or close to zero values indicate water [45]. The NDVI is expressed as:
NDVI = ( NIR RED ) ( NIR + RED )
where NIR = band 4 (Landsat TM) and band 5 (for Landsat OLI) and RED = band 3 (Landsat TM) and band 4 (Landsat OLI).

2.5. NDBI Calculation

The NDBI, an index for impervious surfaces or built-up areas [42], was calculated from remote sensing data using reflectance in the NIR and mid-infrared (MIR) portions of the spectrum [46]. It has been commonly used in previous studies to identify the impervious surfaces [42,45,47]. NDBI values range between −1 and 1, with values close to 0 indicating vegetation; negative values indicate water bodies, while positive values indicate built-up areas [47,48]. The NDBI is defined as:
NDBI = ( MIR NIR ) ( MIR + NIR )
where MIR = band 5 (Landsat TM) and band 6 (Landsat OLI) and NIR = band 4 (Landsat TM) and band 5 (Landsat OLI).

2.6. LST Retrieval

The standard way of extracting LST from raw Landsat imagery involves the conversion of the thermal band’s DN values into radiance values. These radiance values are the ones used to derive at-satellite brightness temperatures [3,41,49]. In this study, preprocessed thermal bands (with at-satellite brightness temperatures values expressed in degrees Kelvin) were used. In the retrieval of LST values, the at-satellite brightness temperatures needed to be scaled using land surface emissivity values [50]. Here, the NDVI method [50] was used to derive land surface emissivity values. After deriving the emissivity values, the emissivity-corrected LST values were extracted as follows:
LST = T B 1 + ( λ × T B / ρ ) I n ε
where TB = Landsat TM Band 6 and Landsat TIRS Band 10 at-satellite brightness temperature in degrees Kelvin; λ = wavelength of emitted radiance (λ = 11.5 μm for Landsat TM Band 6 [41] and λ = 10.8 μm for Landsat TIRS Band 10 [10]; ρ = h × c/σ (1.438 × 10⁻² m K), where σ = Boltzmann constant (1.38 × 10⁻²³ J/K), h = Planck’s constant (6.626 × 10⁻³⁴ Js), and c = velocity of light (2.998 × 10⁸ m/s); and ε is the land surface emissivity estimated using the NDVI method [50]. The extracted LST values were subsequently converted from degrees Kelvin to degrees Celsius (°C).

2.7. Hot and Cold Spots Analysis

The ArcGIS optimized hot spot analysis (Getis-Ord Gi*) tool was used to aid spatial analysis [9,23,51]. More specifically, this technique identified hot and cold spots of LST, NDBI, NDVI, and the population density for the entire study area using their respective mean values in each administrative division.
The Gi* statistic for each feature class or administrative division represented the z-score. Higher positive z-values were categorized as a hot spot, and smaller negative z-values were classified as a cold spot. The z-value represents the clustering significance for a specified distance based on the confidence level [52]. In this study, hot and cold spots were classified into seven categories based on their Gi Bin values: very hot spot (99% significant), hot spot (95% significant), warm spot (90% significant), not statistically significant, cool spot (90% significant), cold spot (95% significant), and very cold spot (99% significant) [9].

2.8. Spatiotemporal Analysis of Hot and Cold Spots

The spatiotemporal pattern of hot and cold spots was examined by using four variables between 1997 and 2017 based on two approaches. First, the seven categories of hot and cold spots identified in Section 2.7 were reclassified into three general categories: (1) hot spot (warm, hot, and very hot); (2) cold spot (cool and cold and very cold spot); and (3) not-significant spot for each time point. Subsequently, these two sets of generalized categories were cross-tabulated to detect the changes. This process resulted in nine categories for each of the four variables, namely hot spot to not-significant, hot spot to cold spot, not-significant to hot spot, not-significant to cold spot, cold spot to hot spot, cold spot to not-significant, persistent hot spot, persistent not-significant, and persistent cold spot.
Second, for each time point, a composite map of the reclassified four variables was generated. To do this, the categories of the NDVI map were inverted (i.e. the hot spot became cold spot and cold spot became hot spot) because this variable had a negative relationship with the other three variables. During the calculation of hot and cold spots in Section 2.7, the NDVI high areas were classified as a hot spot while low NDVI low value areas classified as a cold spot. The NDVI low value areas showed an absence of vegetation, as they were directly affected by occurring SUHI formation. The following rules were used to reclassify the categories: (1) if two or more of the four variables indicated hot spot, the administrative division was classified as a hot spot; (2) if two or more of the four variables indicated cold spot, the administrative division was classified as a cold spot; and (3) if three or more of the four variables indicated not-significant, the administrative division was classified as a not-significant spot. Rules (1) and (2) were possible because there was not a single instance where there were two variables that indicated hot spot and two variables that indicated cold spot. After producing two composite maps of the four variables (one for 1997 and one for 2017), the changes were detected. This process also resulted in nine categories discussed as above.

3. Results

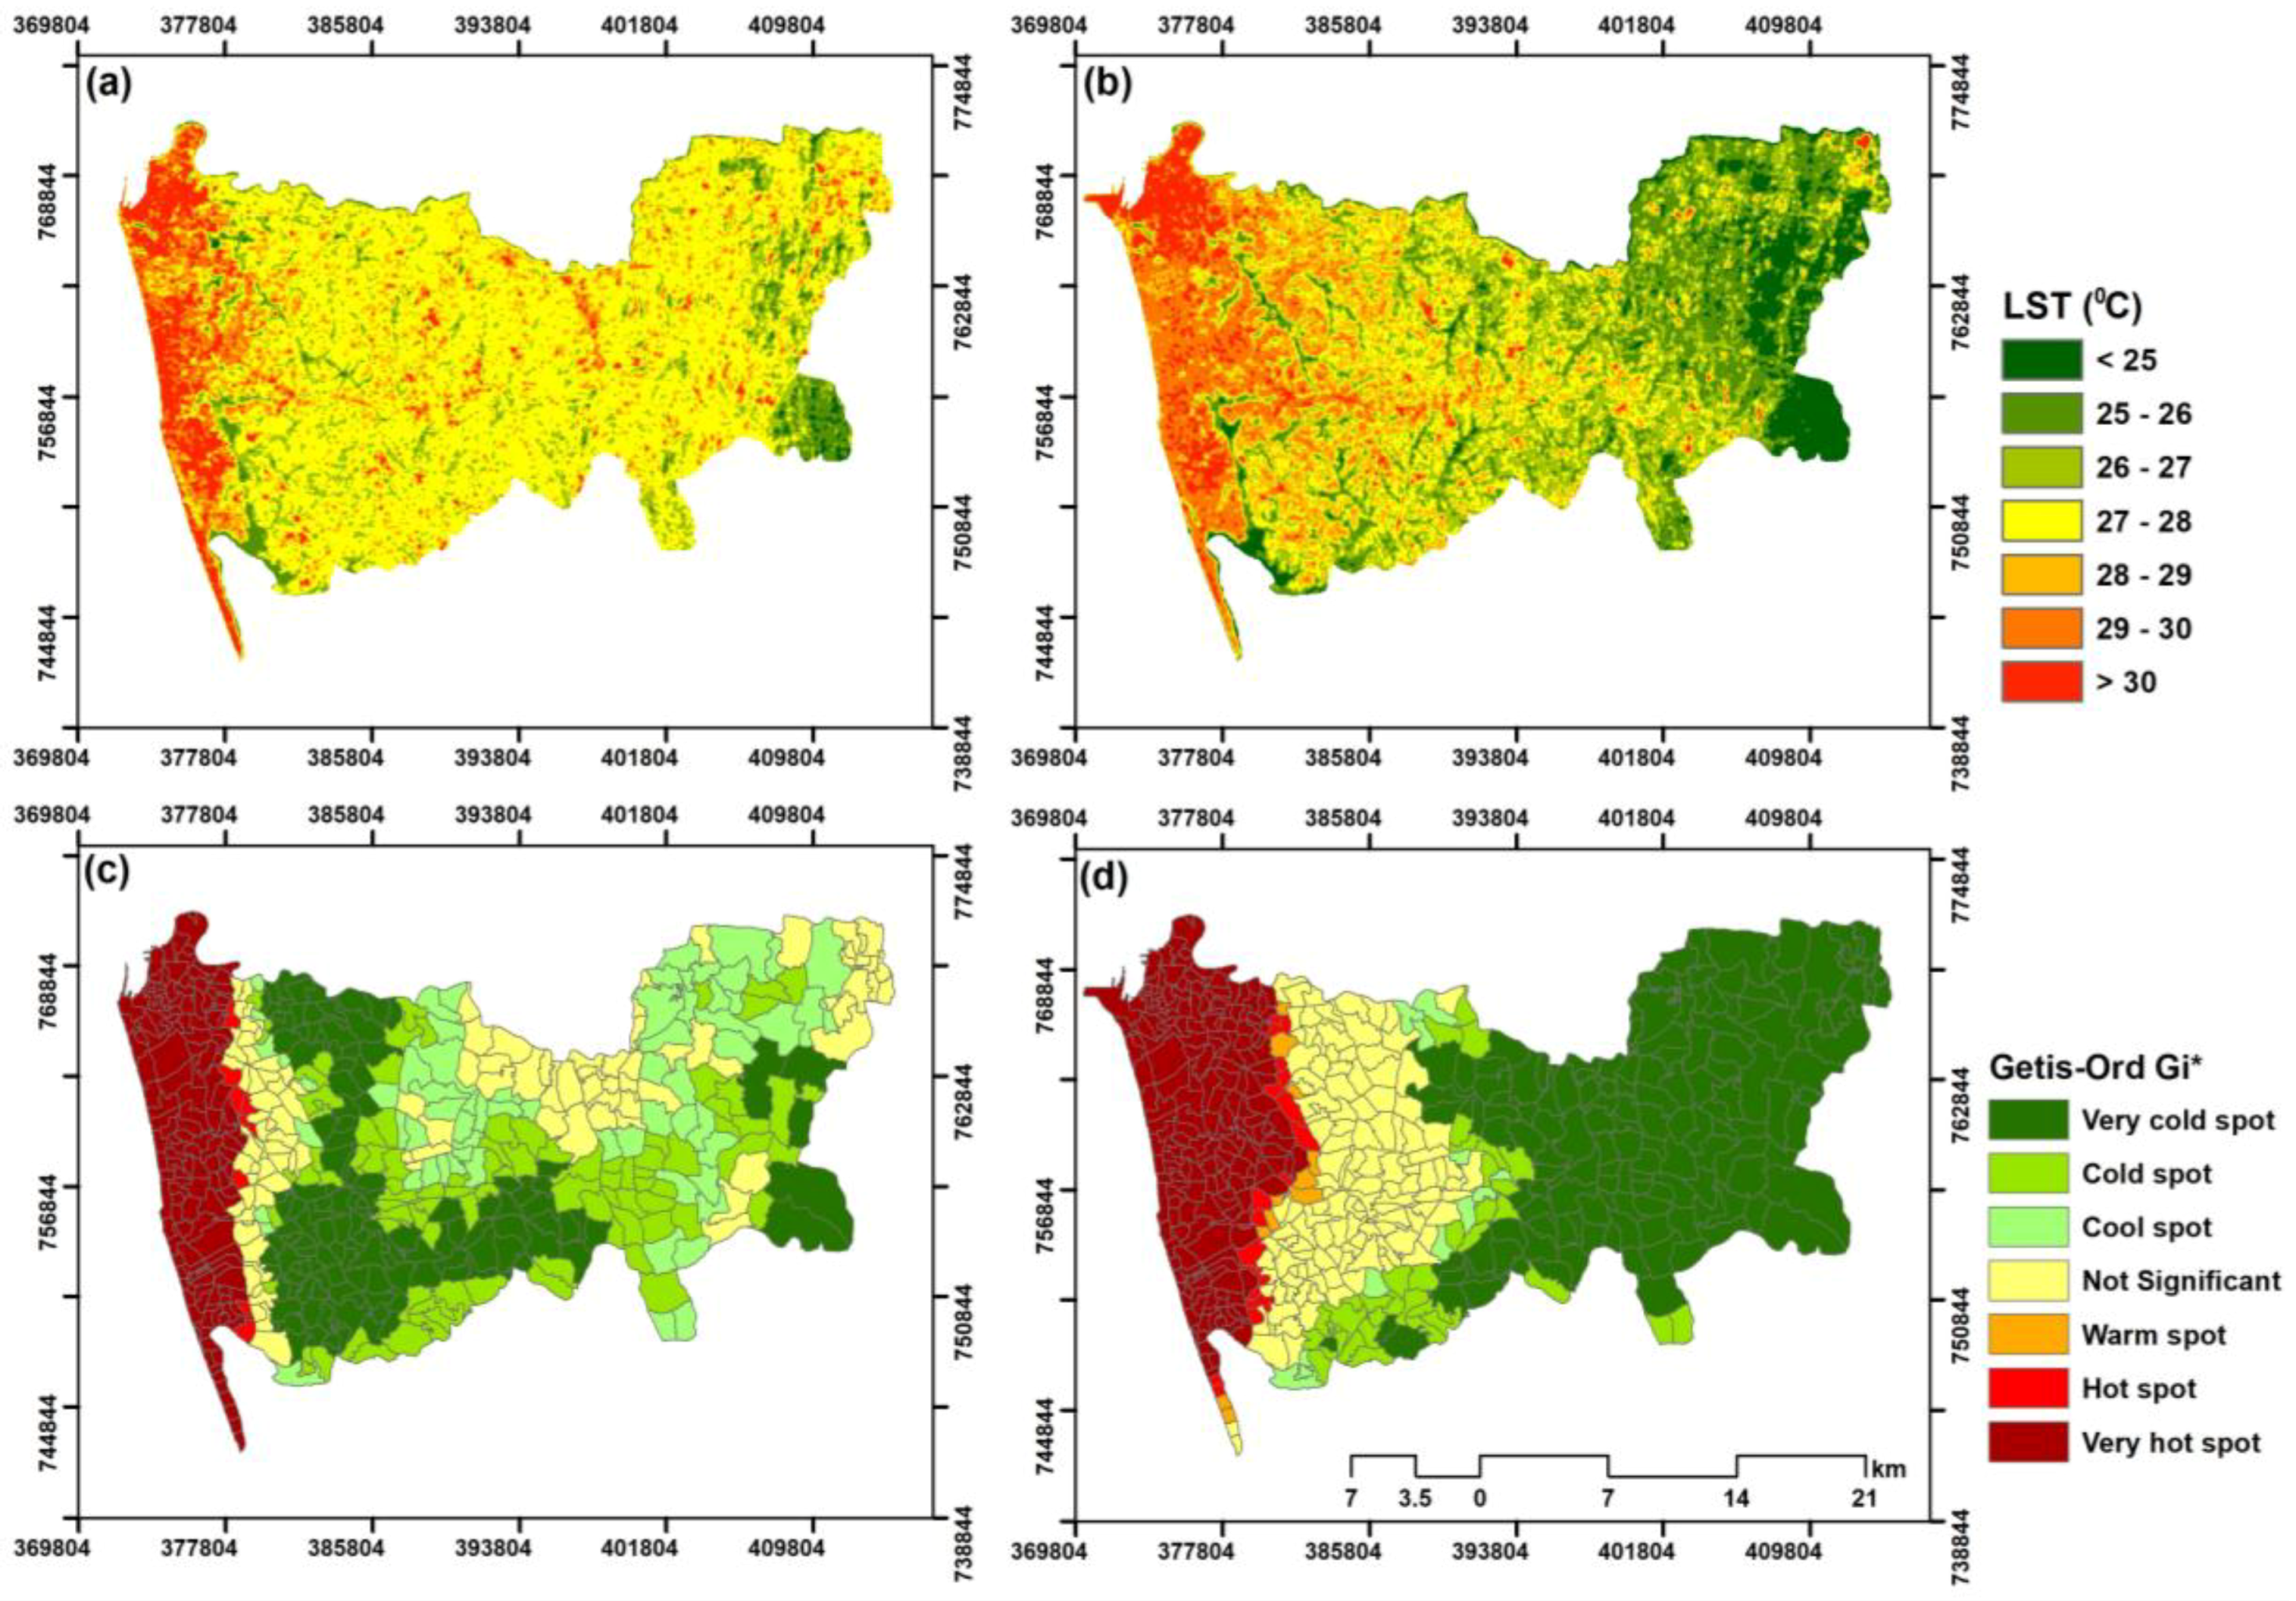
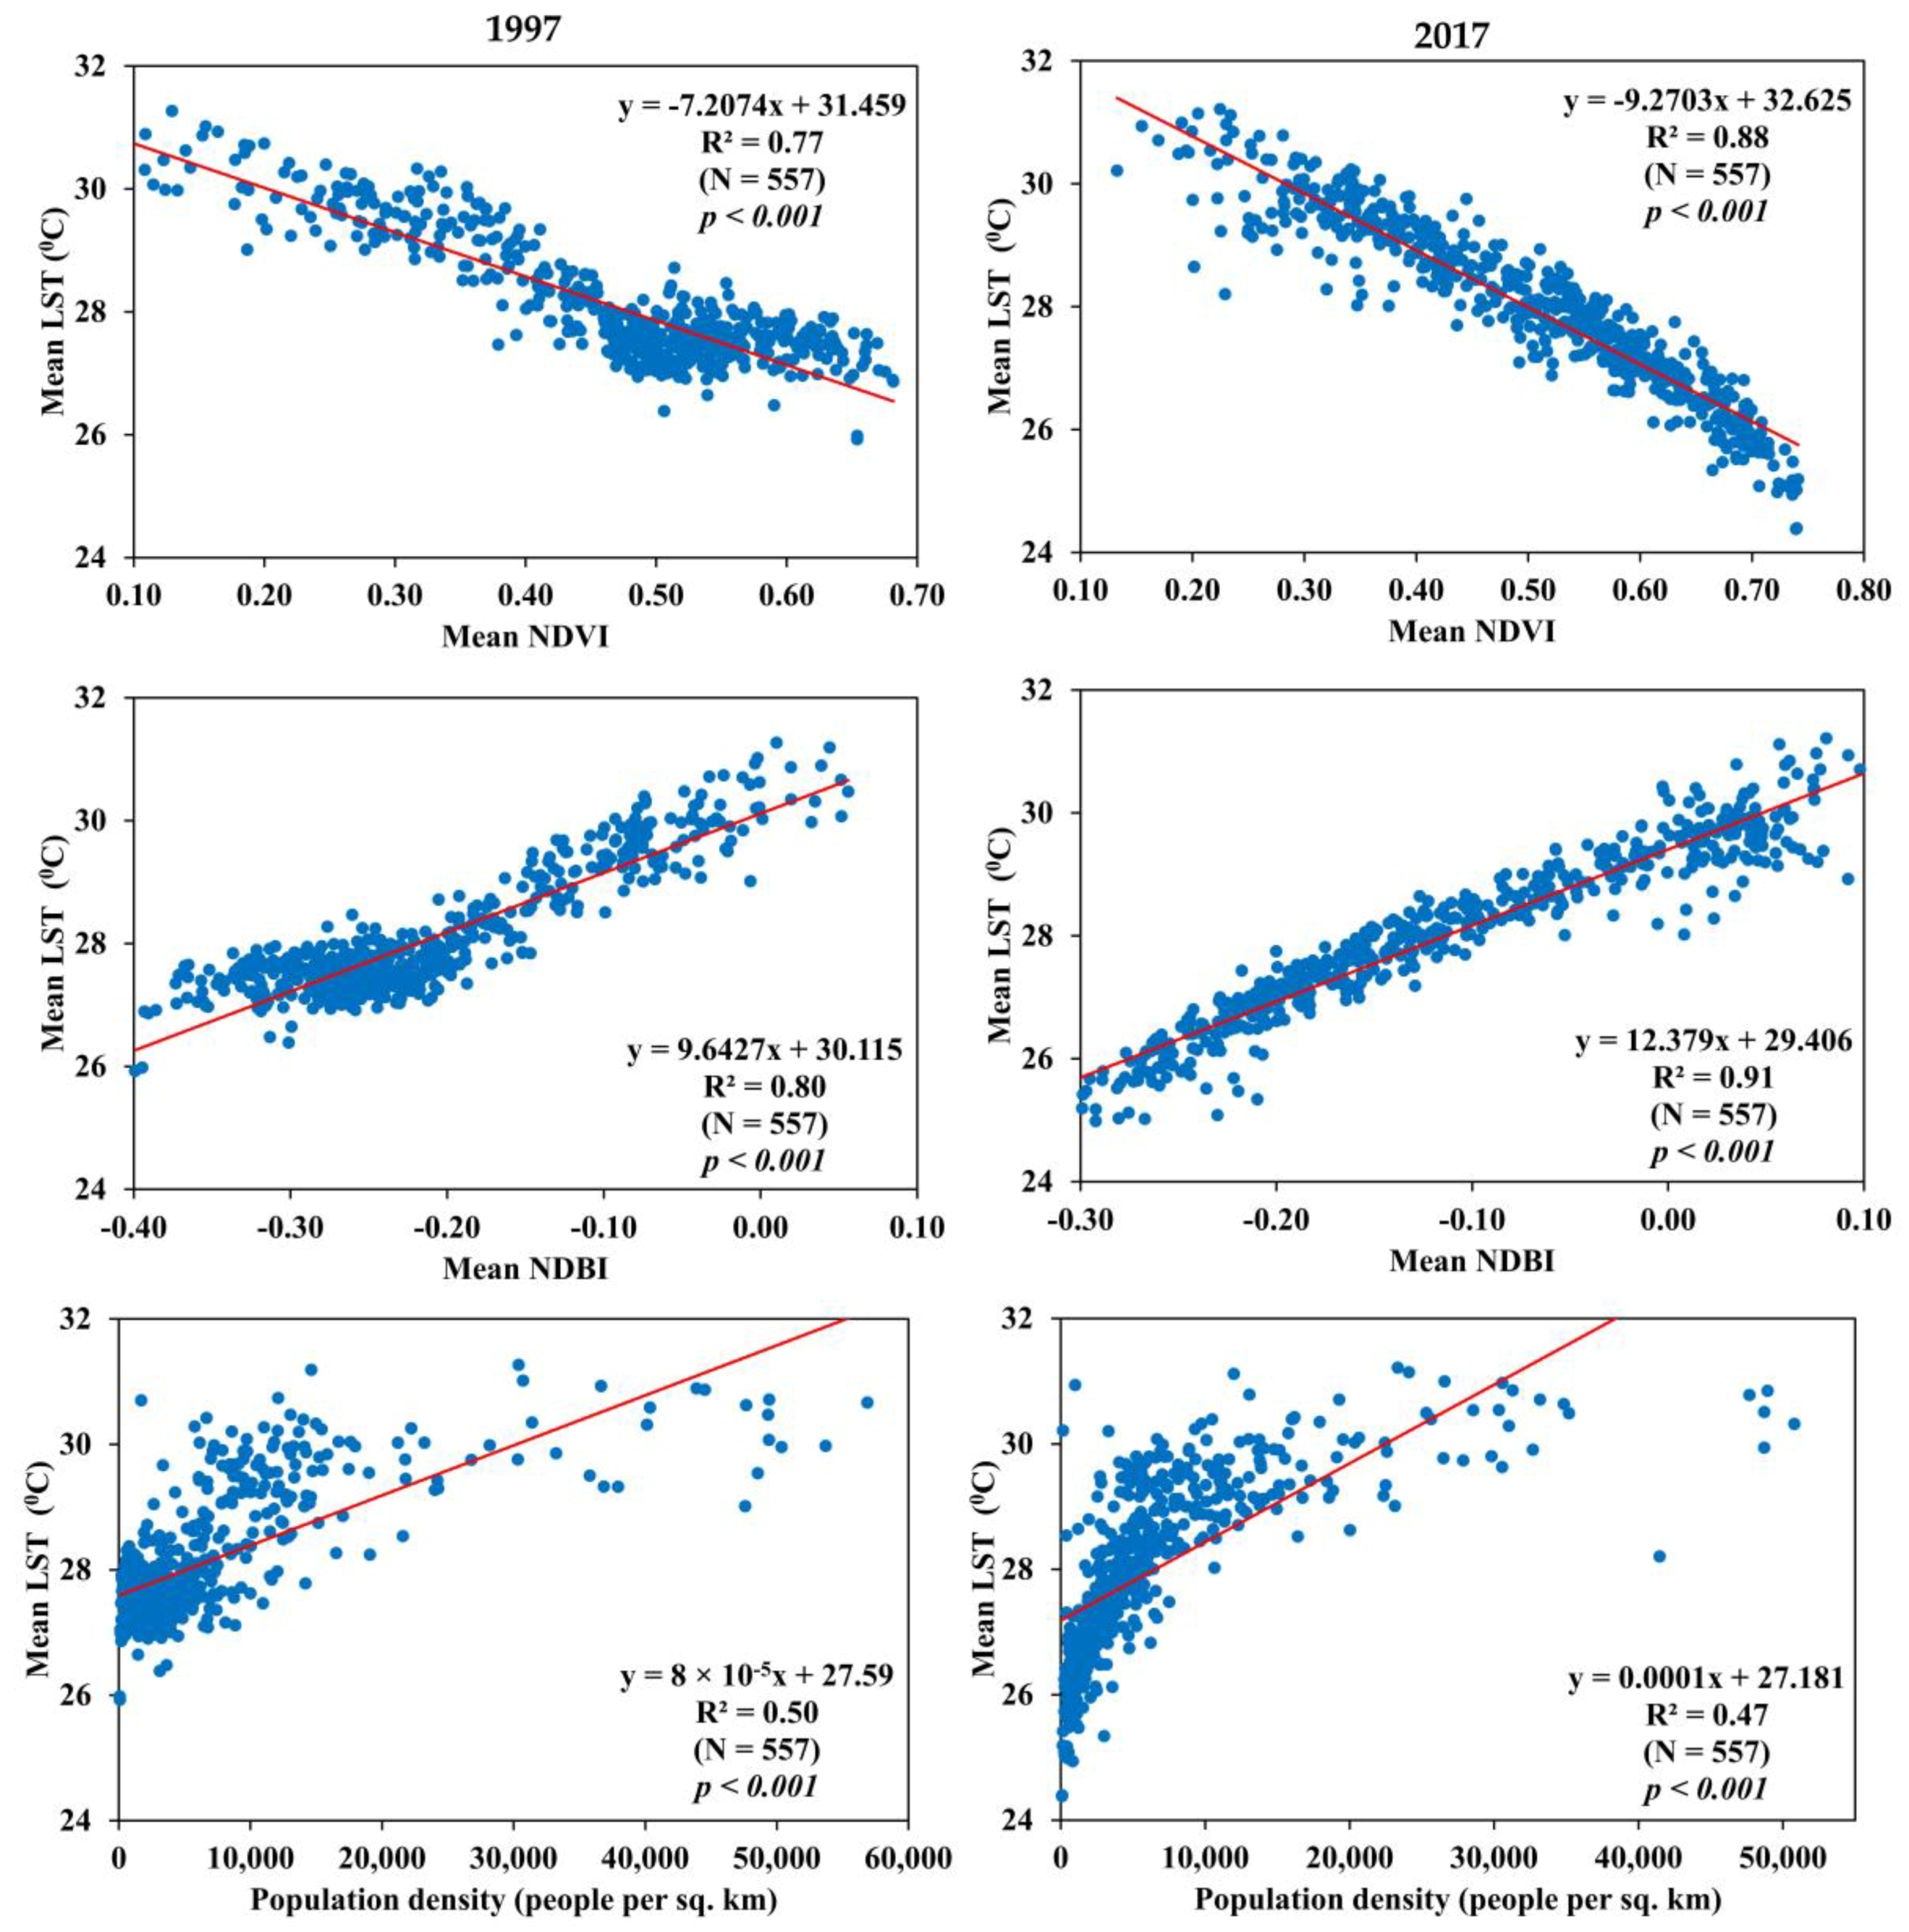
3.1. Mean LST and Its Hot and Cold Spots in 1997 and 2017

Figure 2a,b show the LST map of the Colombo District. In 1997, LST ranged between 22.0 °C and 35.8 °C and had a mean value of 27.7 °C. In 2017, mean LST was 27.2 °C, while LST ranged between 22.9 °C and 34.2 °C. The Colombo District is the commercial hub of Sri Lanka and its fastest growing area. Because of rapid and mostly unplanned urban landscape changes, most of the areas with natural vegetation had been replaced by roads, buildings, and other development, thus contributing to the increasing LST of the area and the SUHI effect, especially in urban areas. In 1997, high LST areas were mostly found in the western part (Colombo City) of the district and along the western coastal belt. However, in 2017, areas with high LST expanded north, south and eastwards, ensuing the urban development pattern in these areas.
Figure 2c,d present the spatial clustering patterns of LST hot and cold spots in the Colombo District for 1997 and 2017. There was a general similarity in the pattern of the hot spot and LST distribution in the study area for both time points. Most of the very hot spots accumulated in the western part of the district, while very cold spots were mainly found in the central areas and eastern side of the district in 1997. By 2017, the very cold spots had shifted to the eastern part of the district. Both LST very hot and very cold spot clusters increased during the 20-year period, from 27.8% to 36.6% and from 24.1% to 26.9%, respectively. Most of the hot spots in 1997 were changed to very hot spots in 2017. Many of the not-significant spots located in the western part of the district had been changed to very hot spot, hot spot, or warm spot by 2017. Conversely, many of the not-significant, cold, and cool spots located in the eastern part of the district in 1997 had changed to very cold spots by 2017. In 1997 most of the not-significant spots were randomly distributed across the district and had been aggregated into the central part of the district by 2017, adjoining the hot spot clusters.

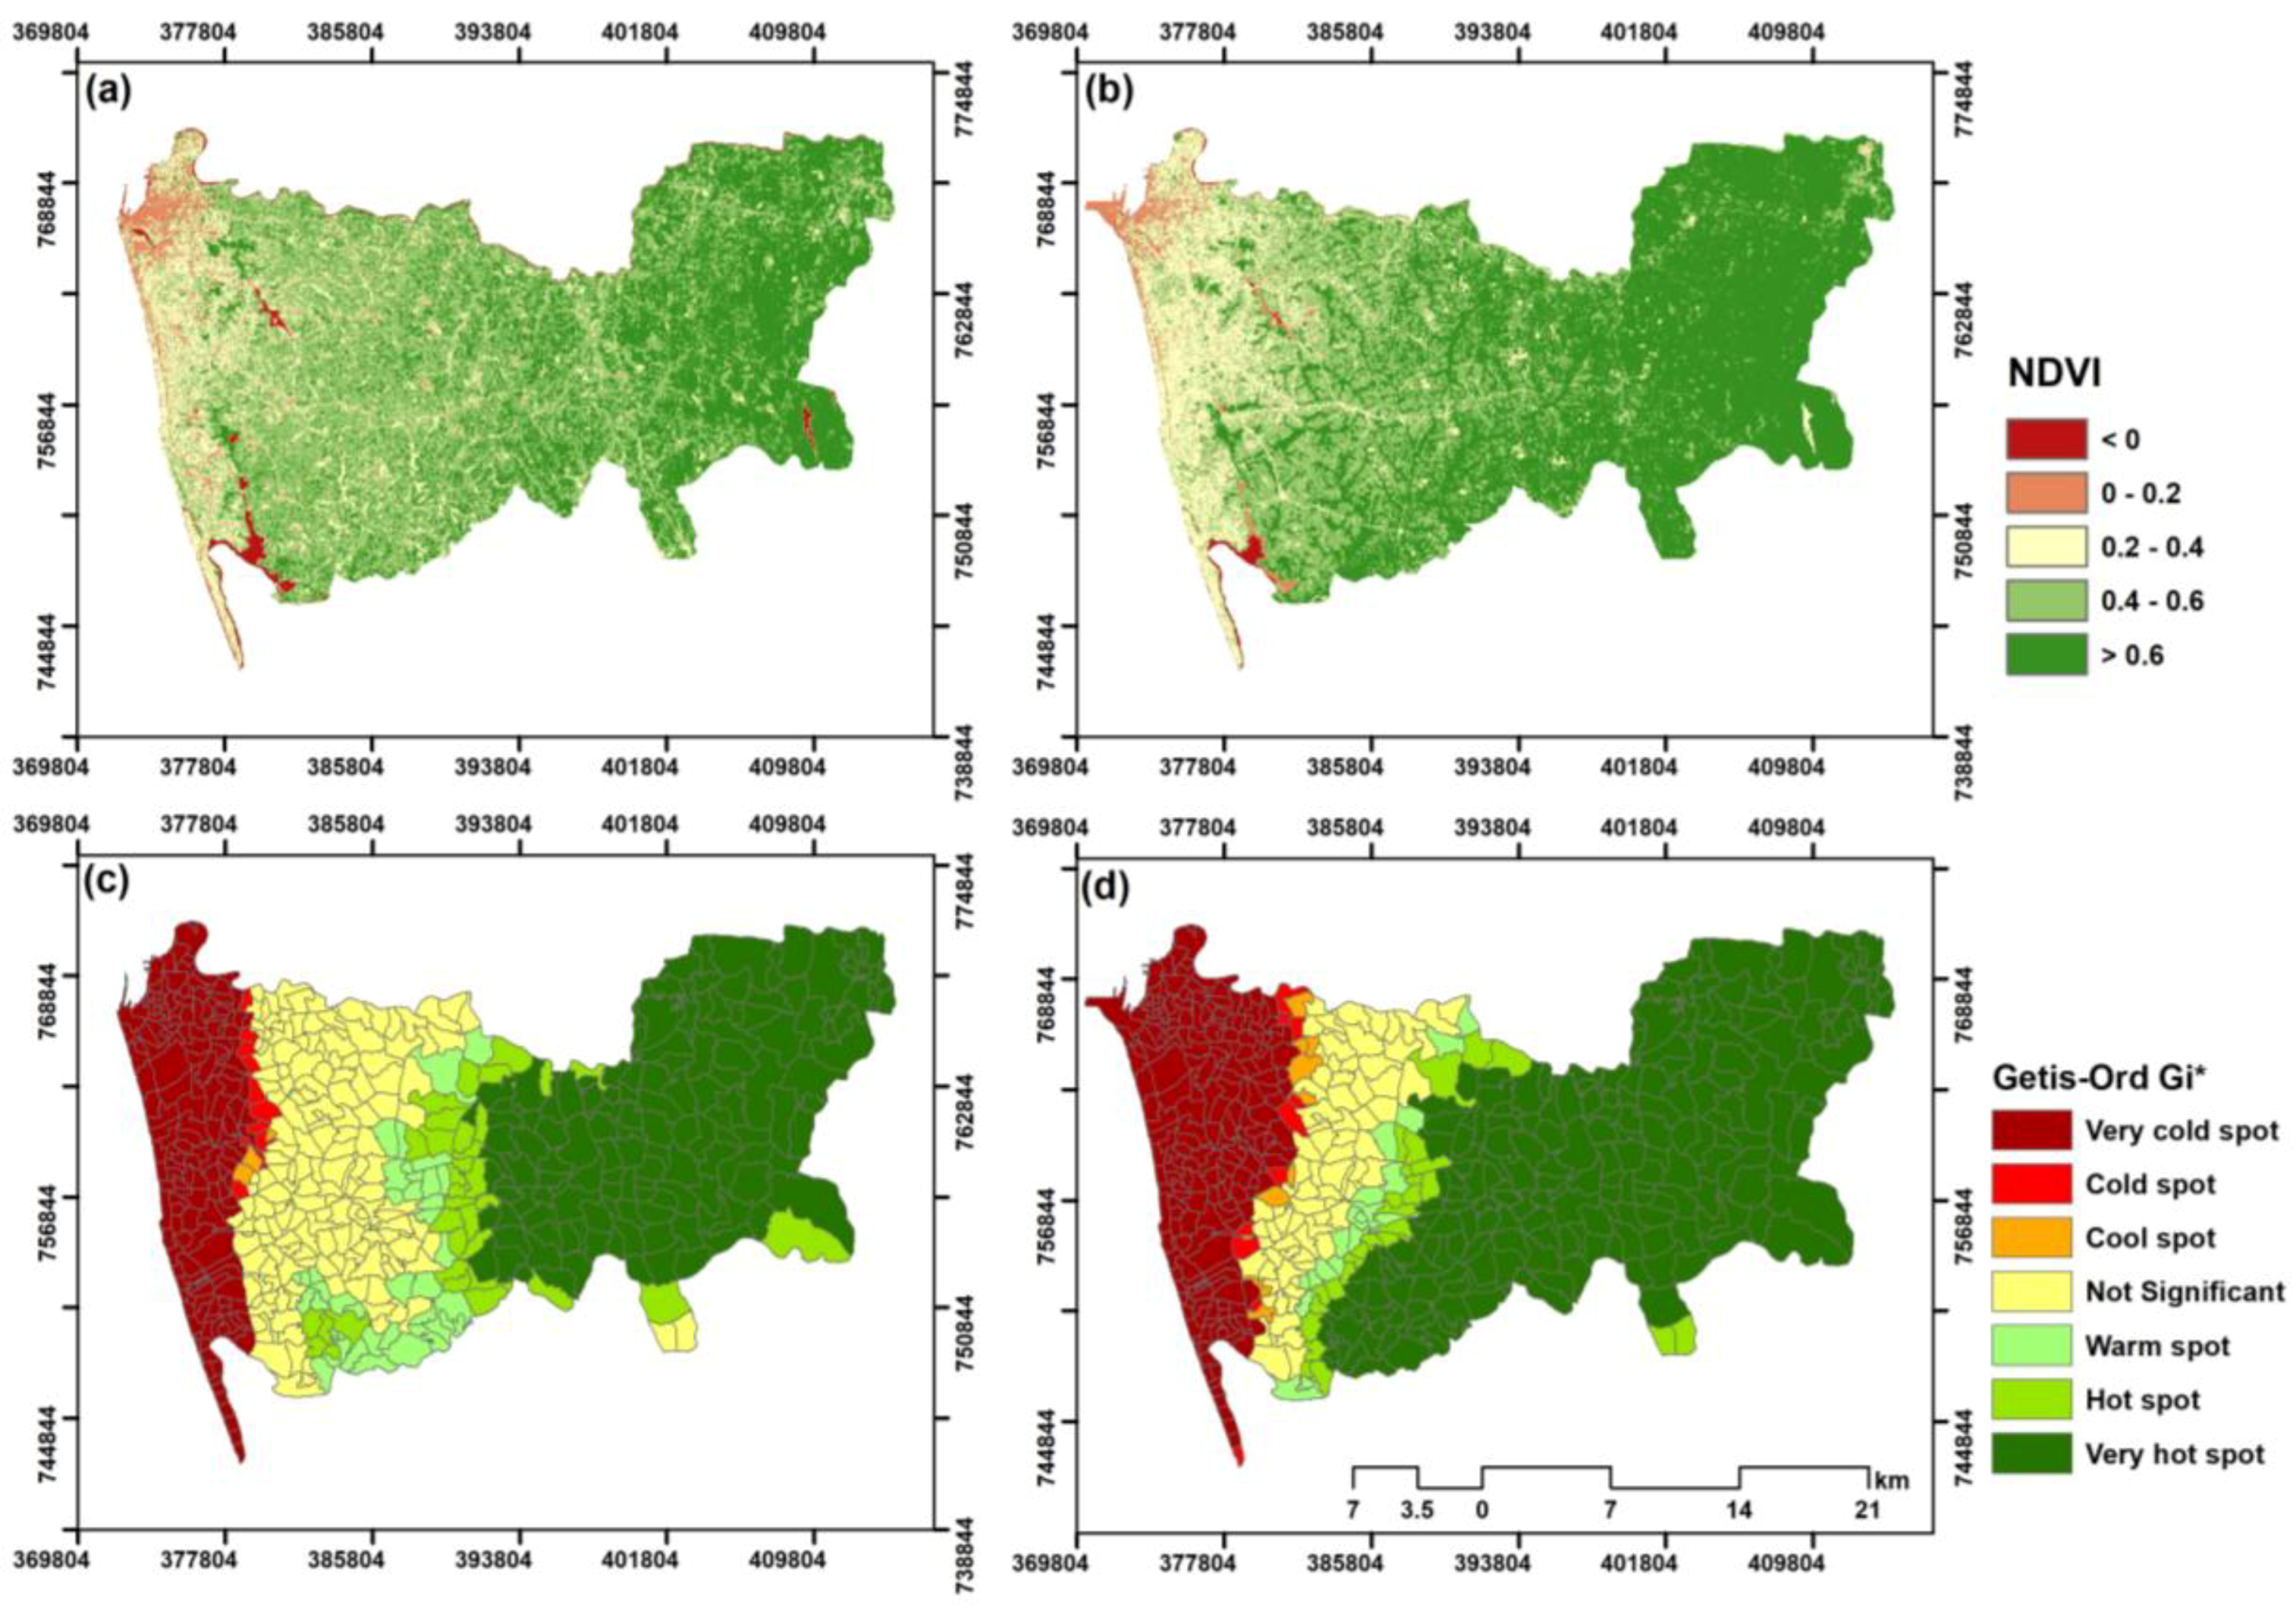
3.2. Mean NDVI and Hot and Cold Spots in 1997 and 2017

Figure 3a,b present the NDVI maps of the Colombo District for 1997 and 2017. In 1997, the NDVI ranged from −1 to 0.81, while in 2017, it ranged between −0.32 and 0.84. The results showed the growth of vegetated areas in the eastern part of the district. Figure 4 shows that LST had a negative and significant relationship with NDVI for the two-time points, with the R2 values (coefficients of determination) for the association being strong. The correlation between NDVI and mean LST showed improvements from 1997 to 2017. The increase in the correlation between mean LST and NDVI from 1997 to 2017 might have been due to changes in the proportion of vegetation per unit area as a result of urbanization.
Figure 3c,d show the spatial clustering pattern of NDVI hot and cold spots in the Colombo District in 1997 and 2017. Most of the very hot spots (statistically significant clustered areas with high NDVI values) were located in the eastern part of the district, while the very cold spots were mainly found in the western part. Some of the hot and warm spots in 1997 had changed to very hot spots in 2017, while some of the not-significant spots in 1997 had changed to hot or warm spot in 2017. The percentage of NDVI very hot spots had increased from 24.8% to 36.3% during the 20-year period. This was indicative of increasing vegetation cover, especially in the eastern part of the district. These areas experienced an increasing trend of vegetation cover due to the improving cropland like rubber plantation. The percentage of very cold spots had increased from 30.3% to 37.7% over the 20-year period, which reflected a decreasing trend in vegetation cover, especially in the western part of the district.

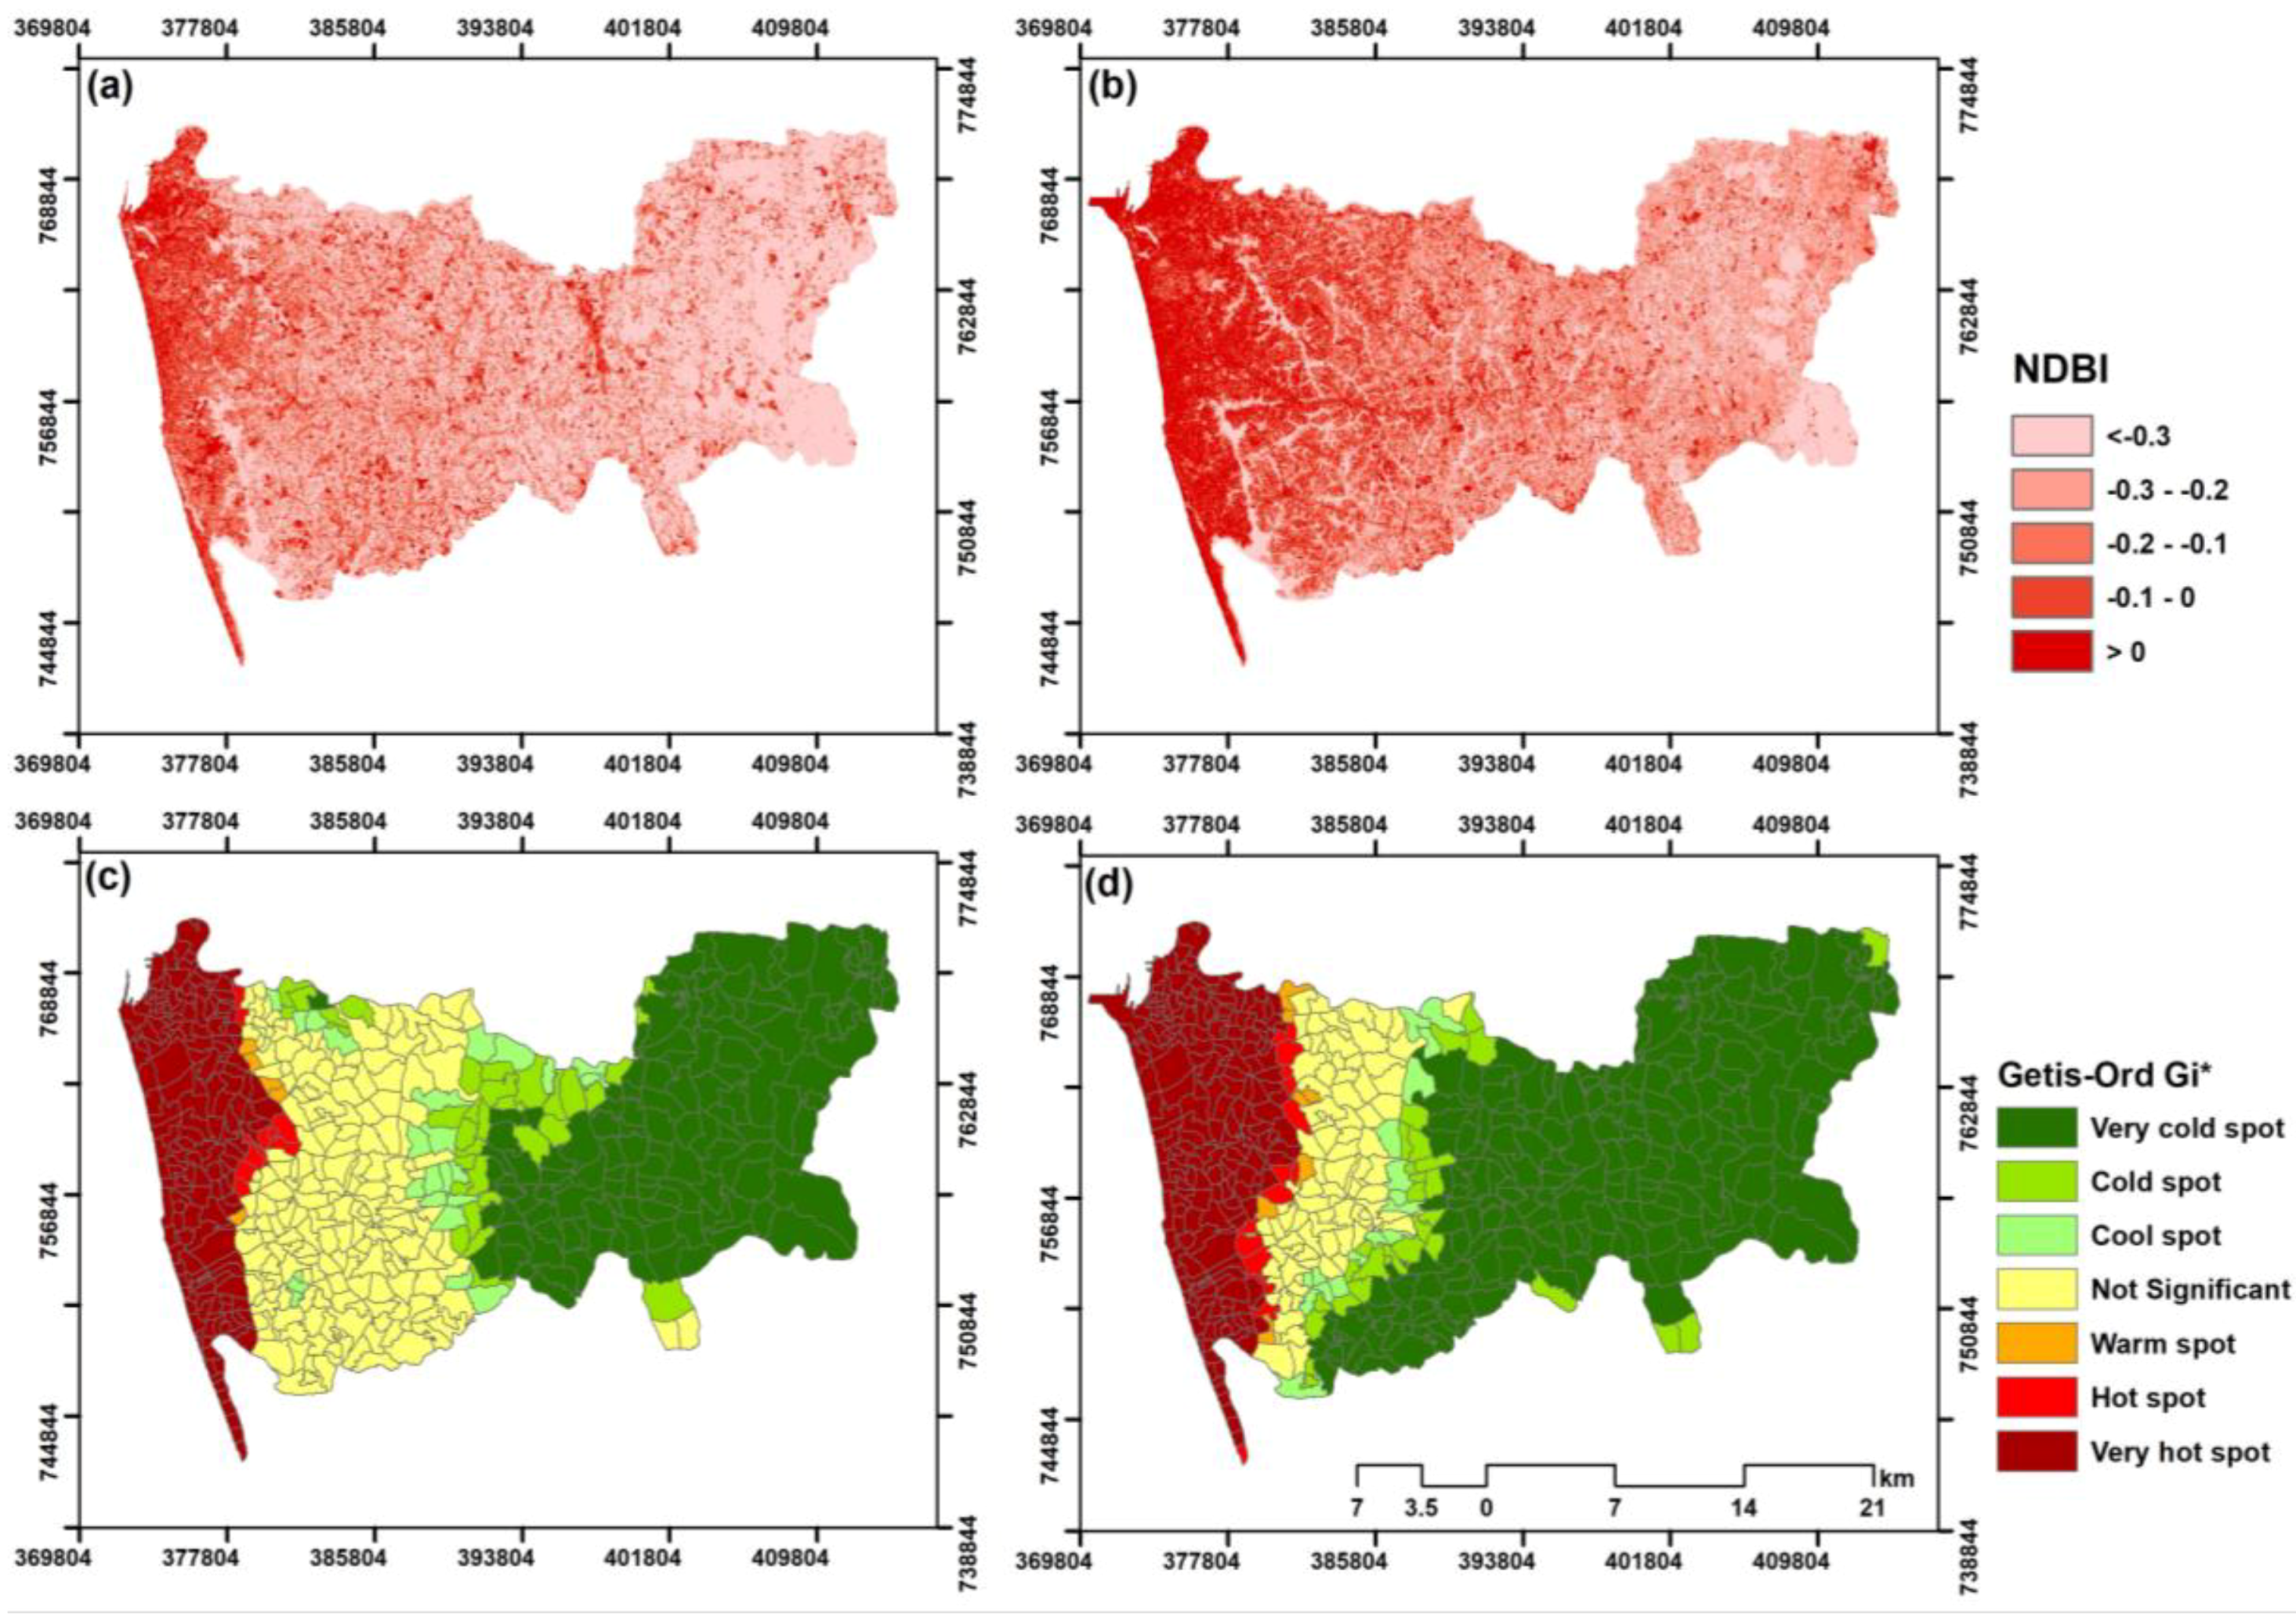
3.3. Mean NDBI and Its Hot and Cold Spots in 1997 and 2017

Figure 5a,b present the NDBI maps of Colombo District for 1997 and 2017. The minimum and maximum NDBI values for 1997 ranged between −1.00 and 0.39, while for 2017, they ranged between −0.31 and 0.37. In 1997, high NDBI value-areas were located mostly in the Colombo City area, along the western coastal belt, and adjacent to the main transportation network mainly in the western part of the district. However, by 2017, these areas had also expanded to the north, east, and south along the main transportation network and coastal belt toward to the central areas of the district. In addition, the newly reclaimed land adjacent to the Colombo harbor (Port City) development project helped to add new land to the Colombo District. These developments increased the impervious surface in the western part of the district [4].The fast urban expansion of these areas was due to the rapid development of the Colombo District after the conclusion of 30 years of civil war [4,35]. Figure 4 shows LST had a positive and significant relationship with NDBI for the two-time points and that the R2 values were high. The increase in the correlation between mean LST and NDBI from 1997 to 2017 indicates that the effect of SUHI has become more detectable as the area becomes more urbanized. This result is consistent with other findings that show that the intensity UHI is positively correlated with city size [10,53].
Figure 5c,d show the spatial clustering patterns of NDBI hot and cold spots in the Colombo District for 1997 and 2017. Most of the very hot spots were accumulated in the western part of the district along the coastal belt, while the very cold spots were mainly located in the eastern part of the district. Some of the hot and warm spots in 1997 had changed to very hot spots by 2017. An increase in the number of the very cold spots was observed between 1997 and 2017. The percentage of very hot spots increased from 30.3% to 37.2% between 1997 and 2017, and these were concentrated in the western part of the district. The percentage of very cold spots increased from 23.2% to 35% over the same period. A decrease of almost 50% in the number of the not-significant spots was also observed over the 20-year period. The result showed that the area of impervious surfaces had increased, particularly towards the center of the district.

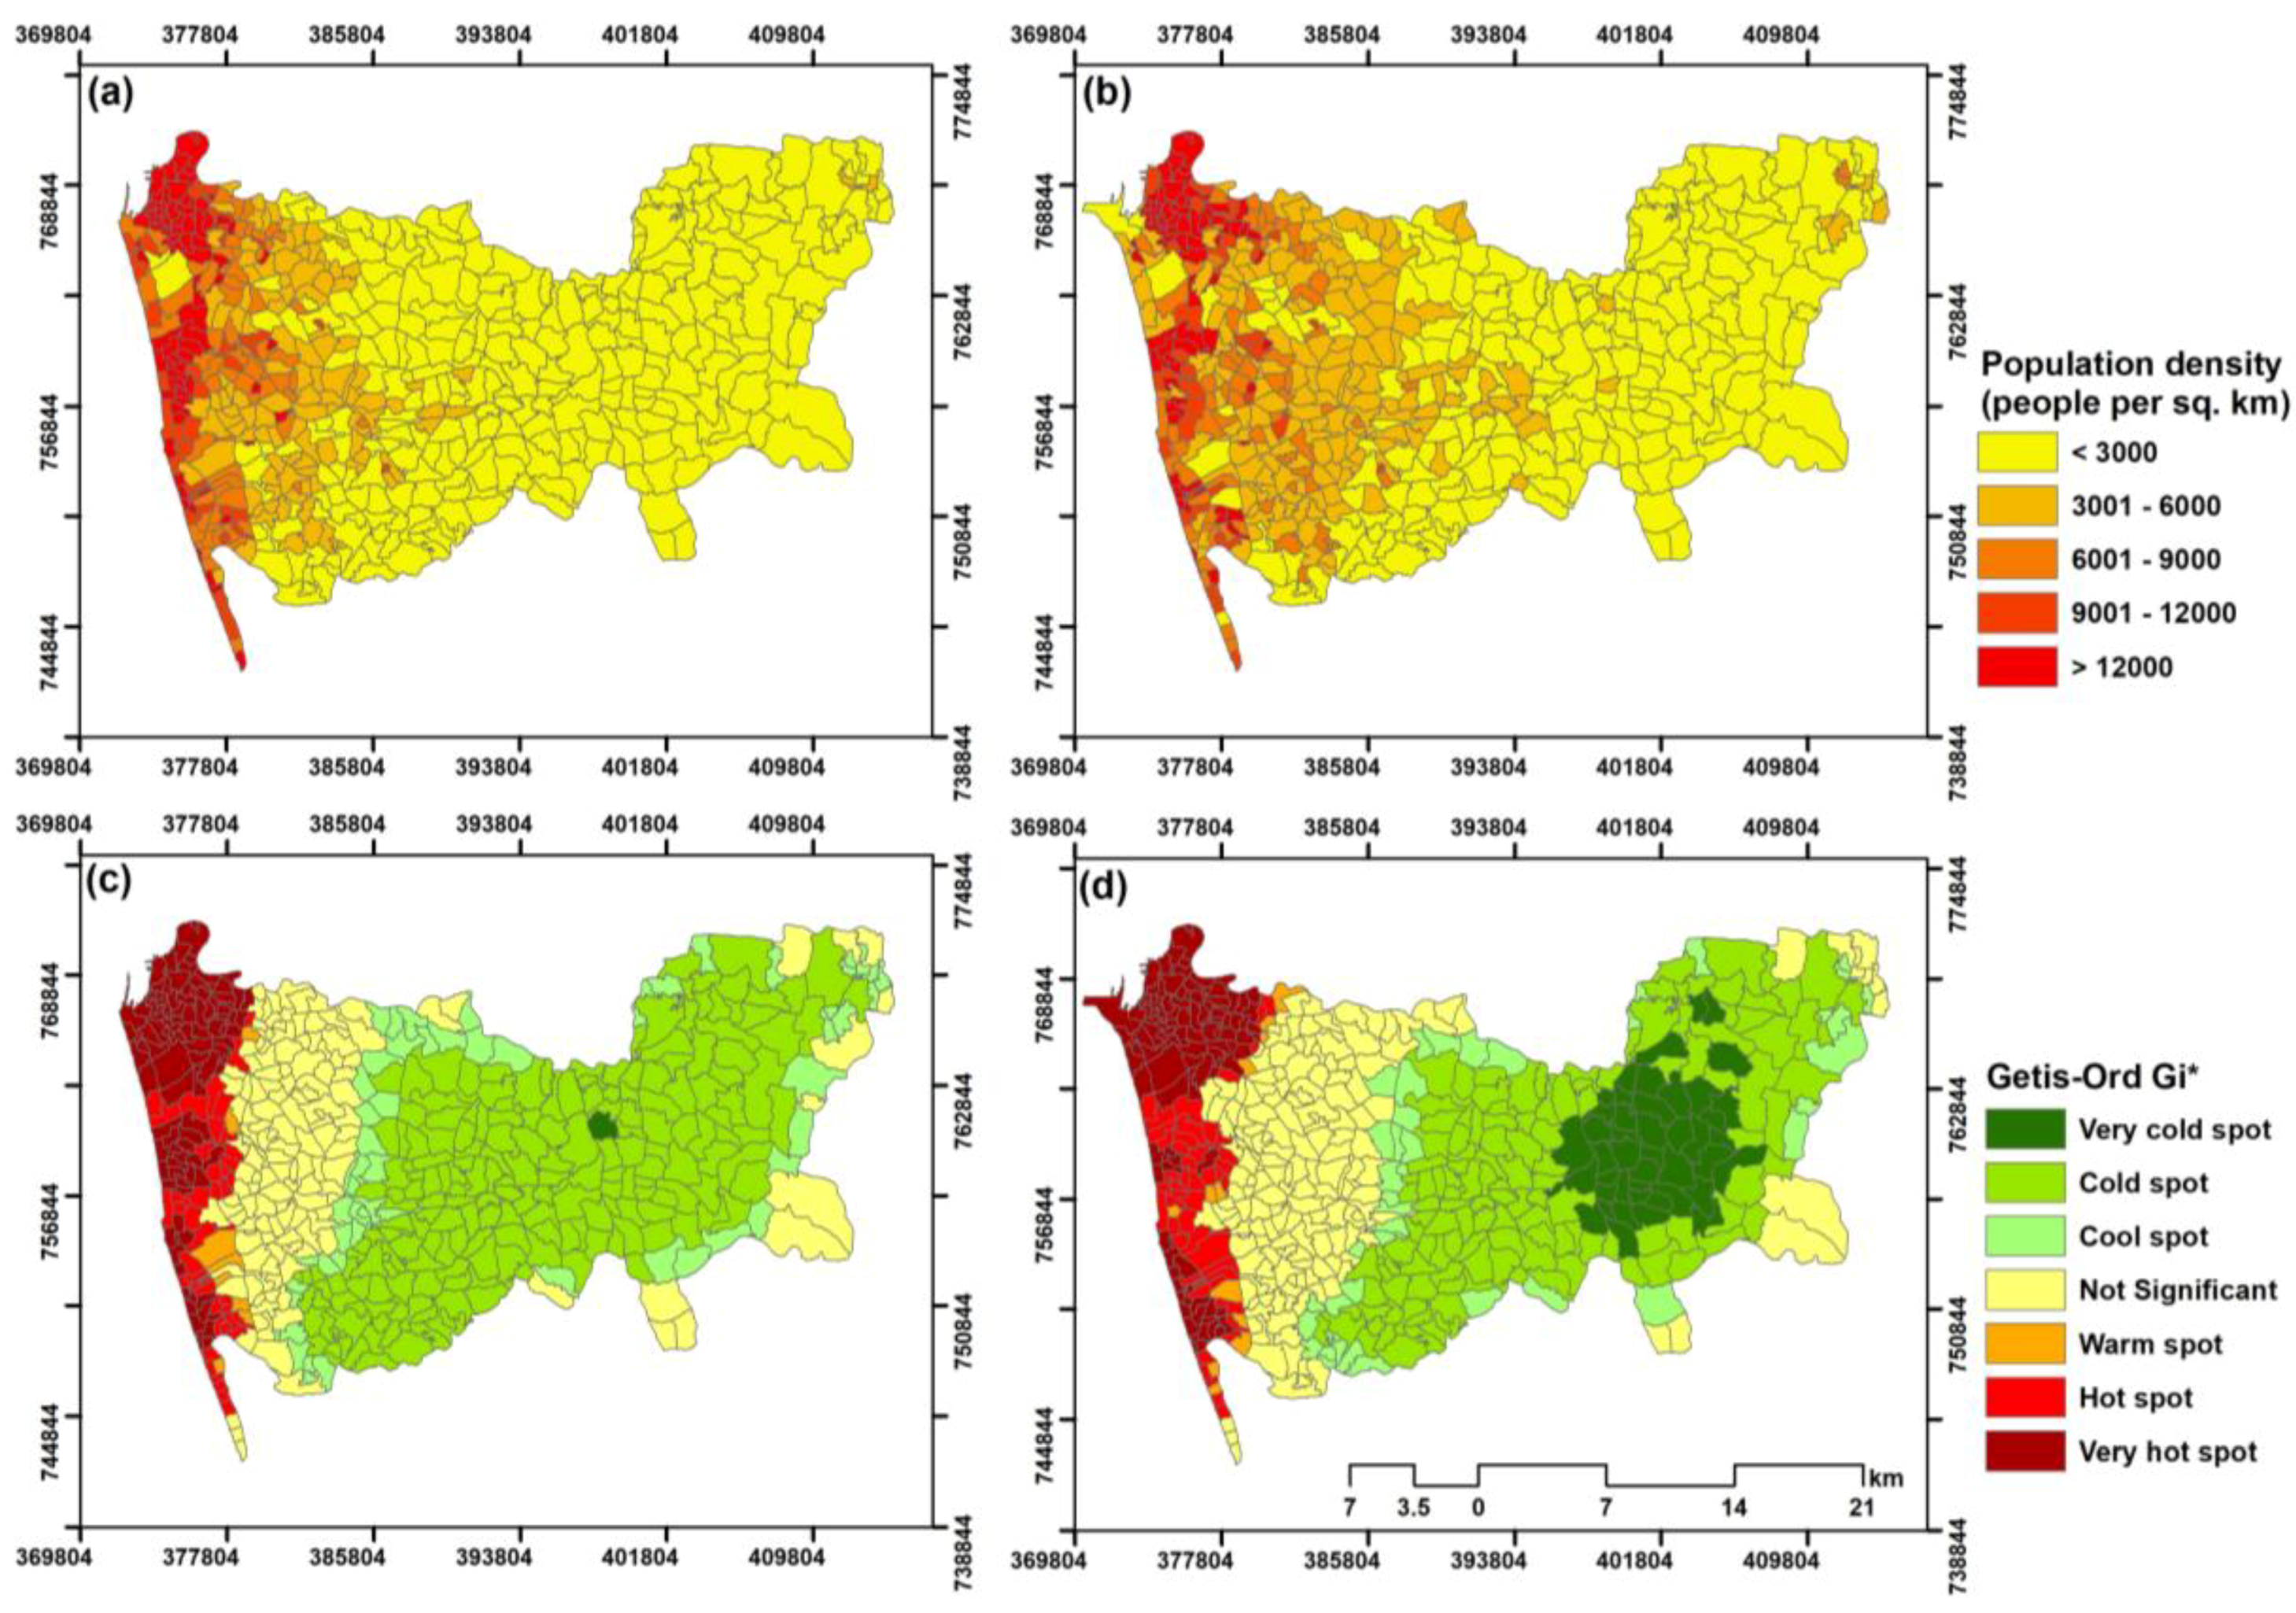
3.4. Population Density and Hot and Cold Spots in 1997 and 2017

Figure 6a,b show the population density map for the Colombo District for 1997 and 2017. The increase in population density from 1997 to 2017 occurred mainly in the western part of the district and closely followed the NDBI pattern of the district. The scatter plots reveal that population density was positively correlated with LST for both time points (Figure 4).
Figure 6c,d show the spatial clustering patterns of population density hot and cold spots in the Colombo District for 1997 and 2017. Most of the very hot spots were located in three main clusters in both 1997 and 2017, with development in 2017 being particularly marked. The first cluster was located in the Colombo Central Business District (CBD) and Kolonnawa area, the second cluster was located in the southern part of the Colombo Municipal Council (CMC) and Dehiwala area, and the third cluster was located in Rathmalana and Moratuwa area.

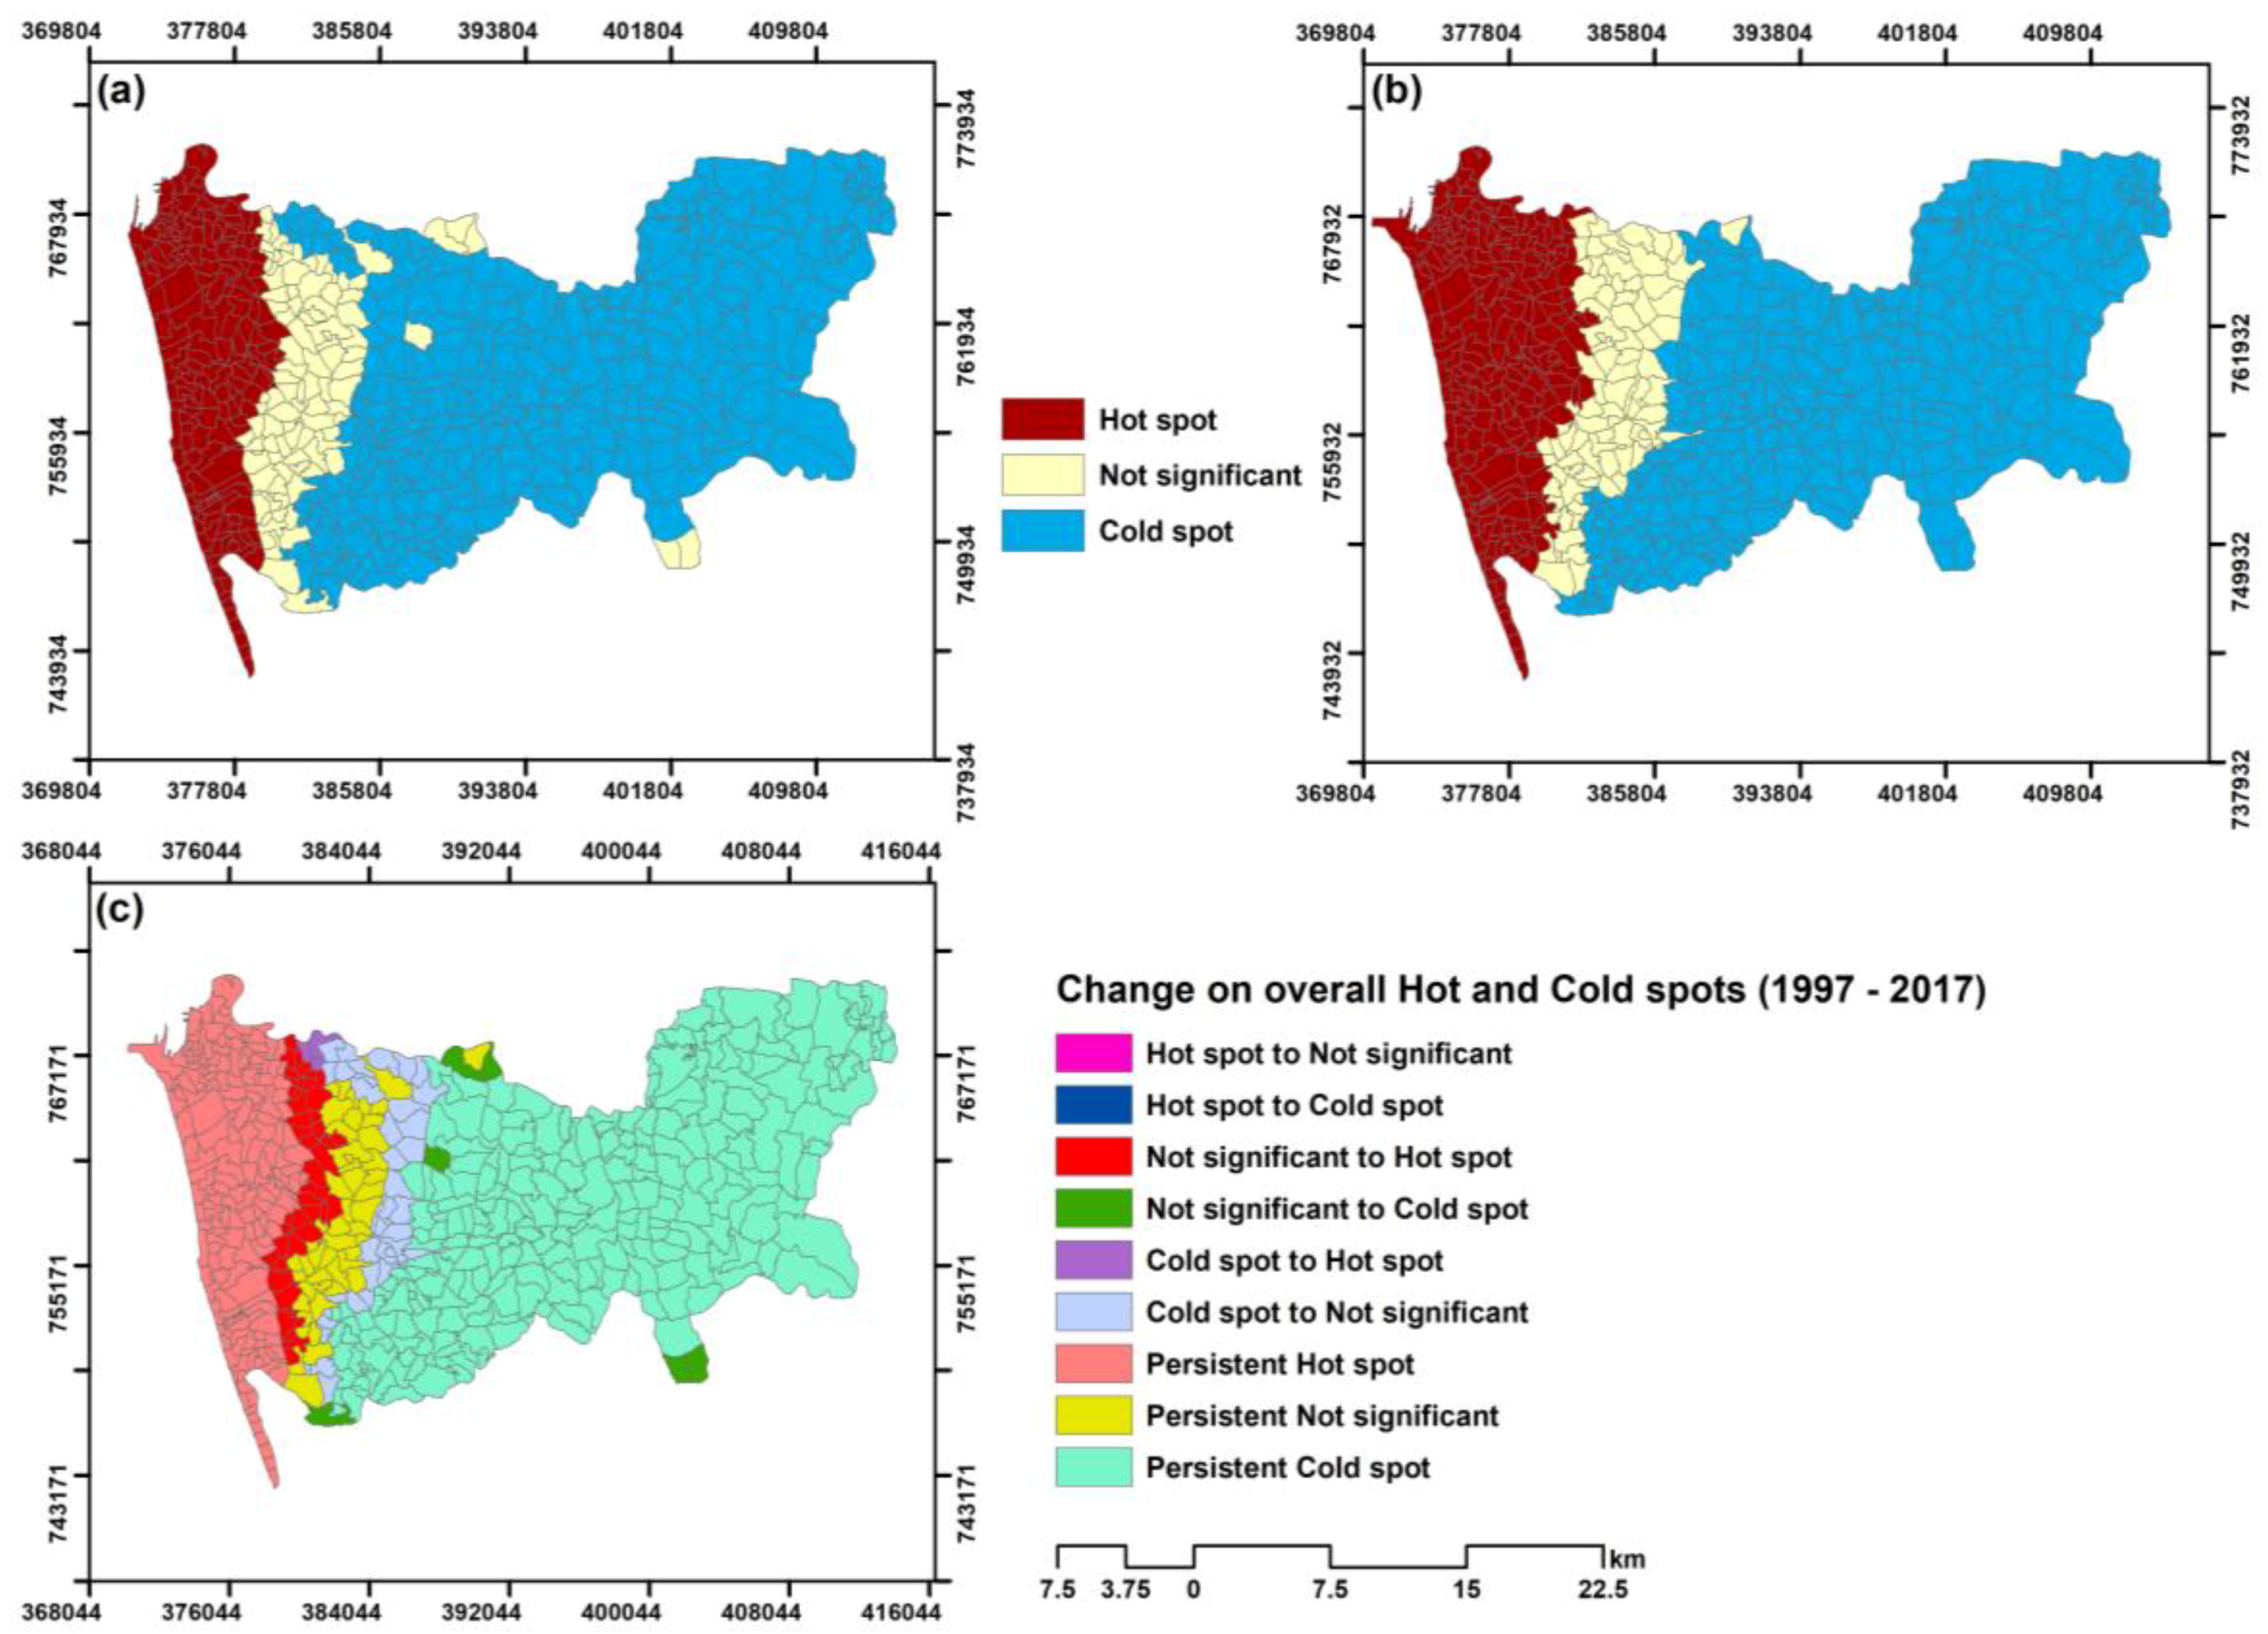
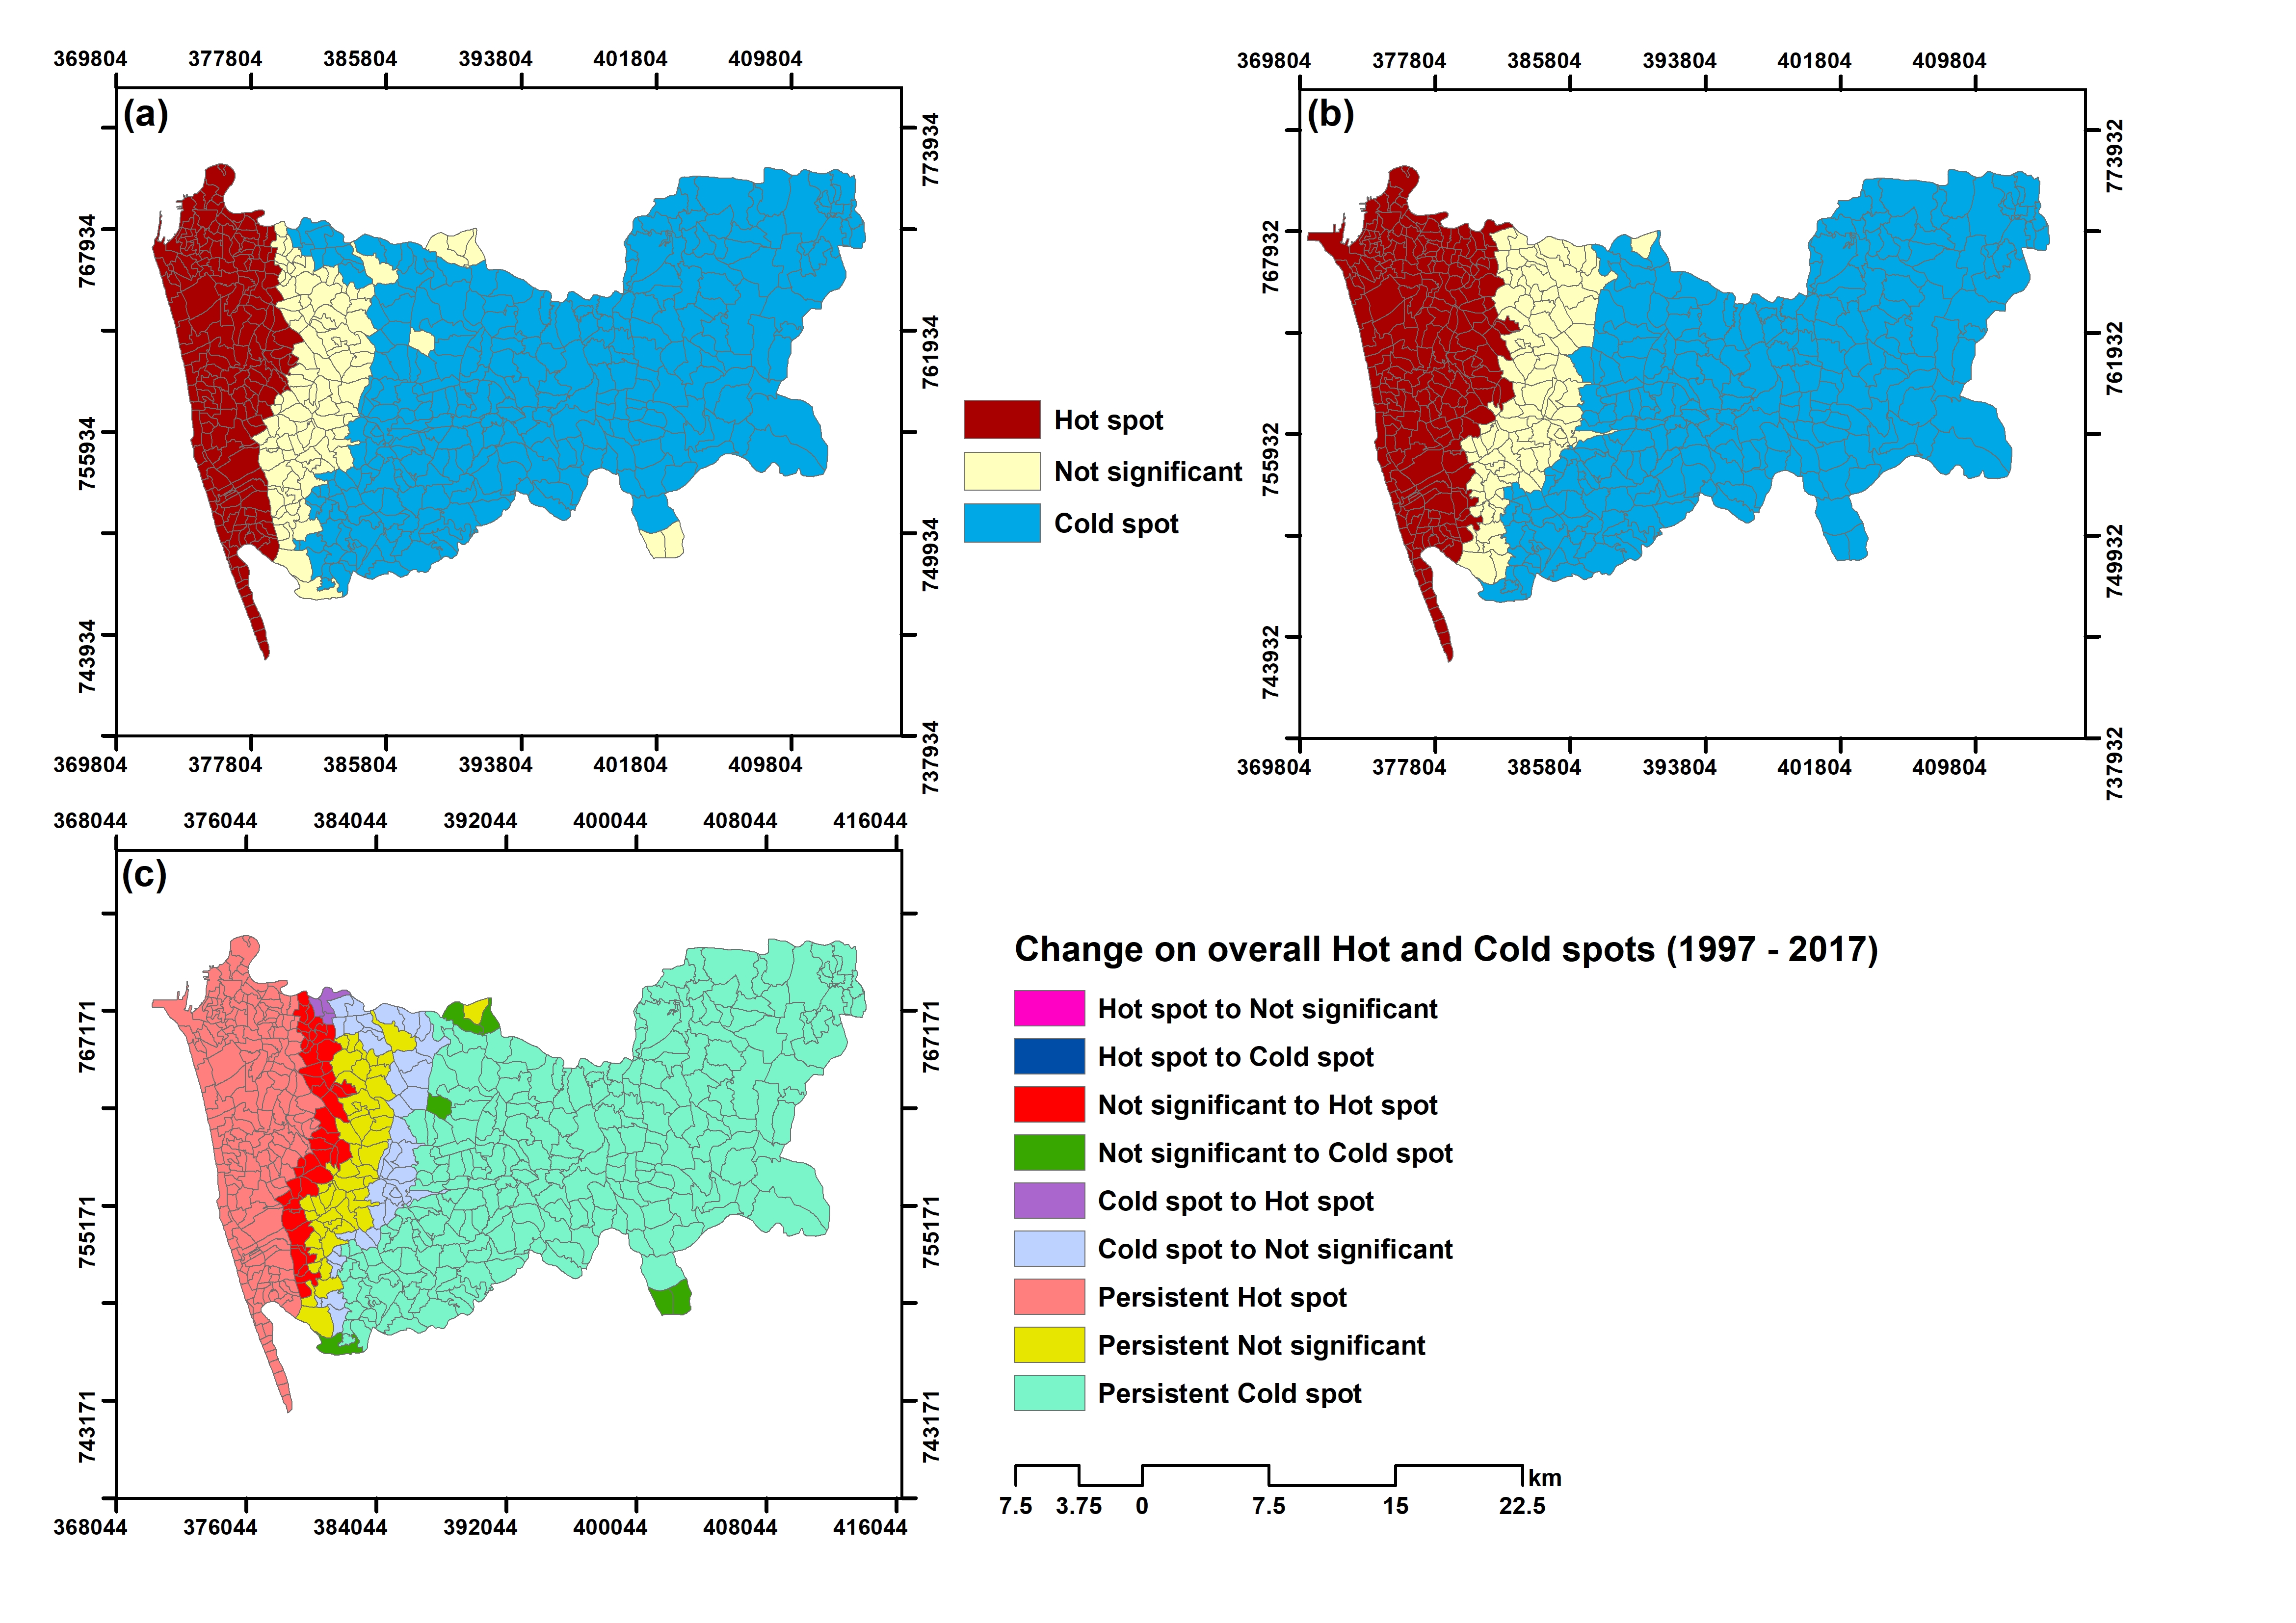
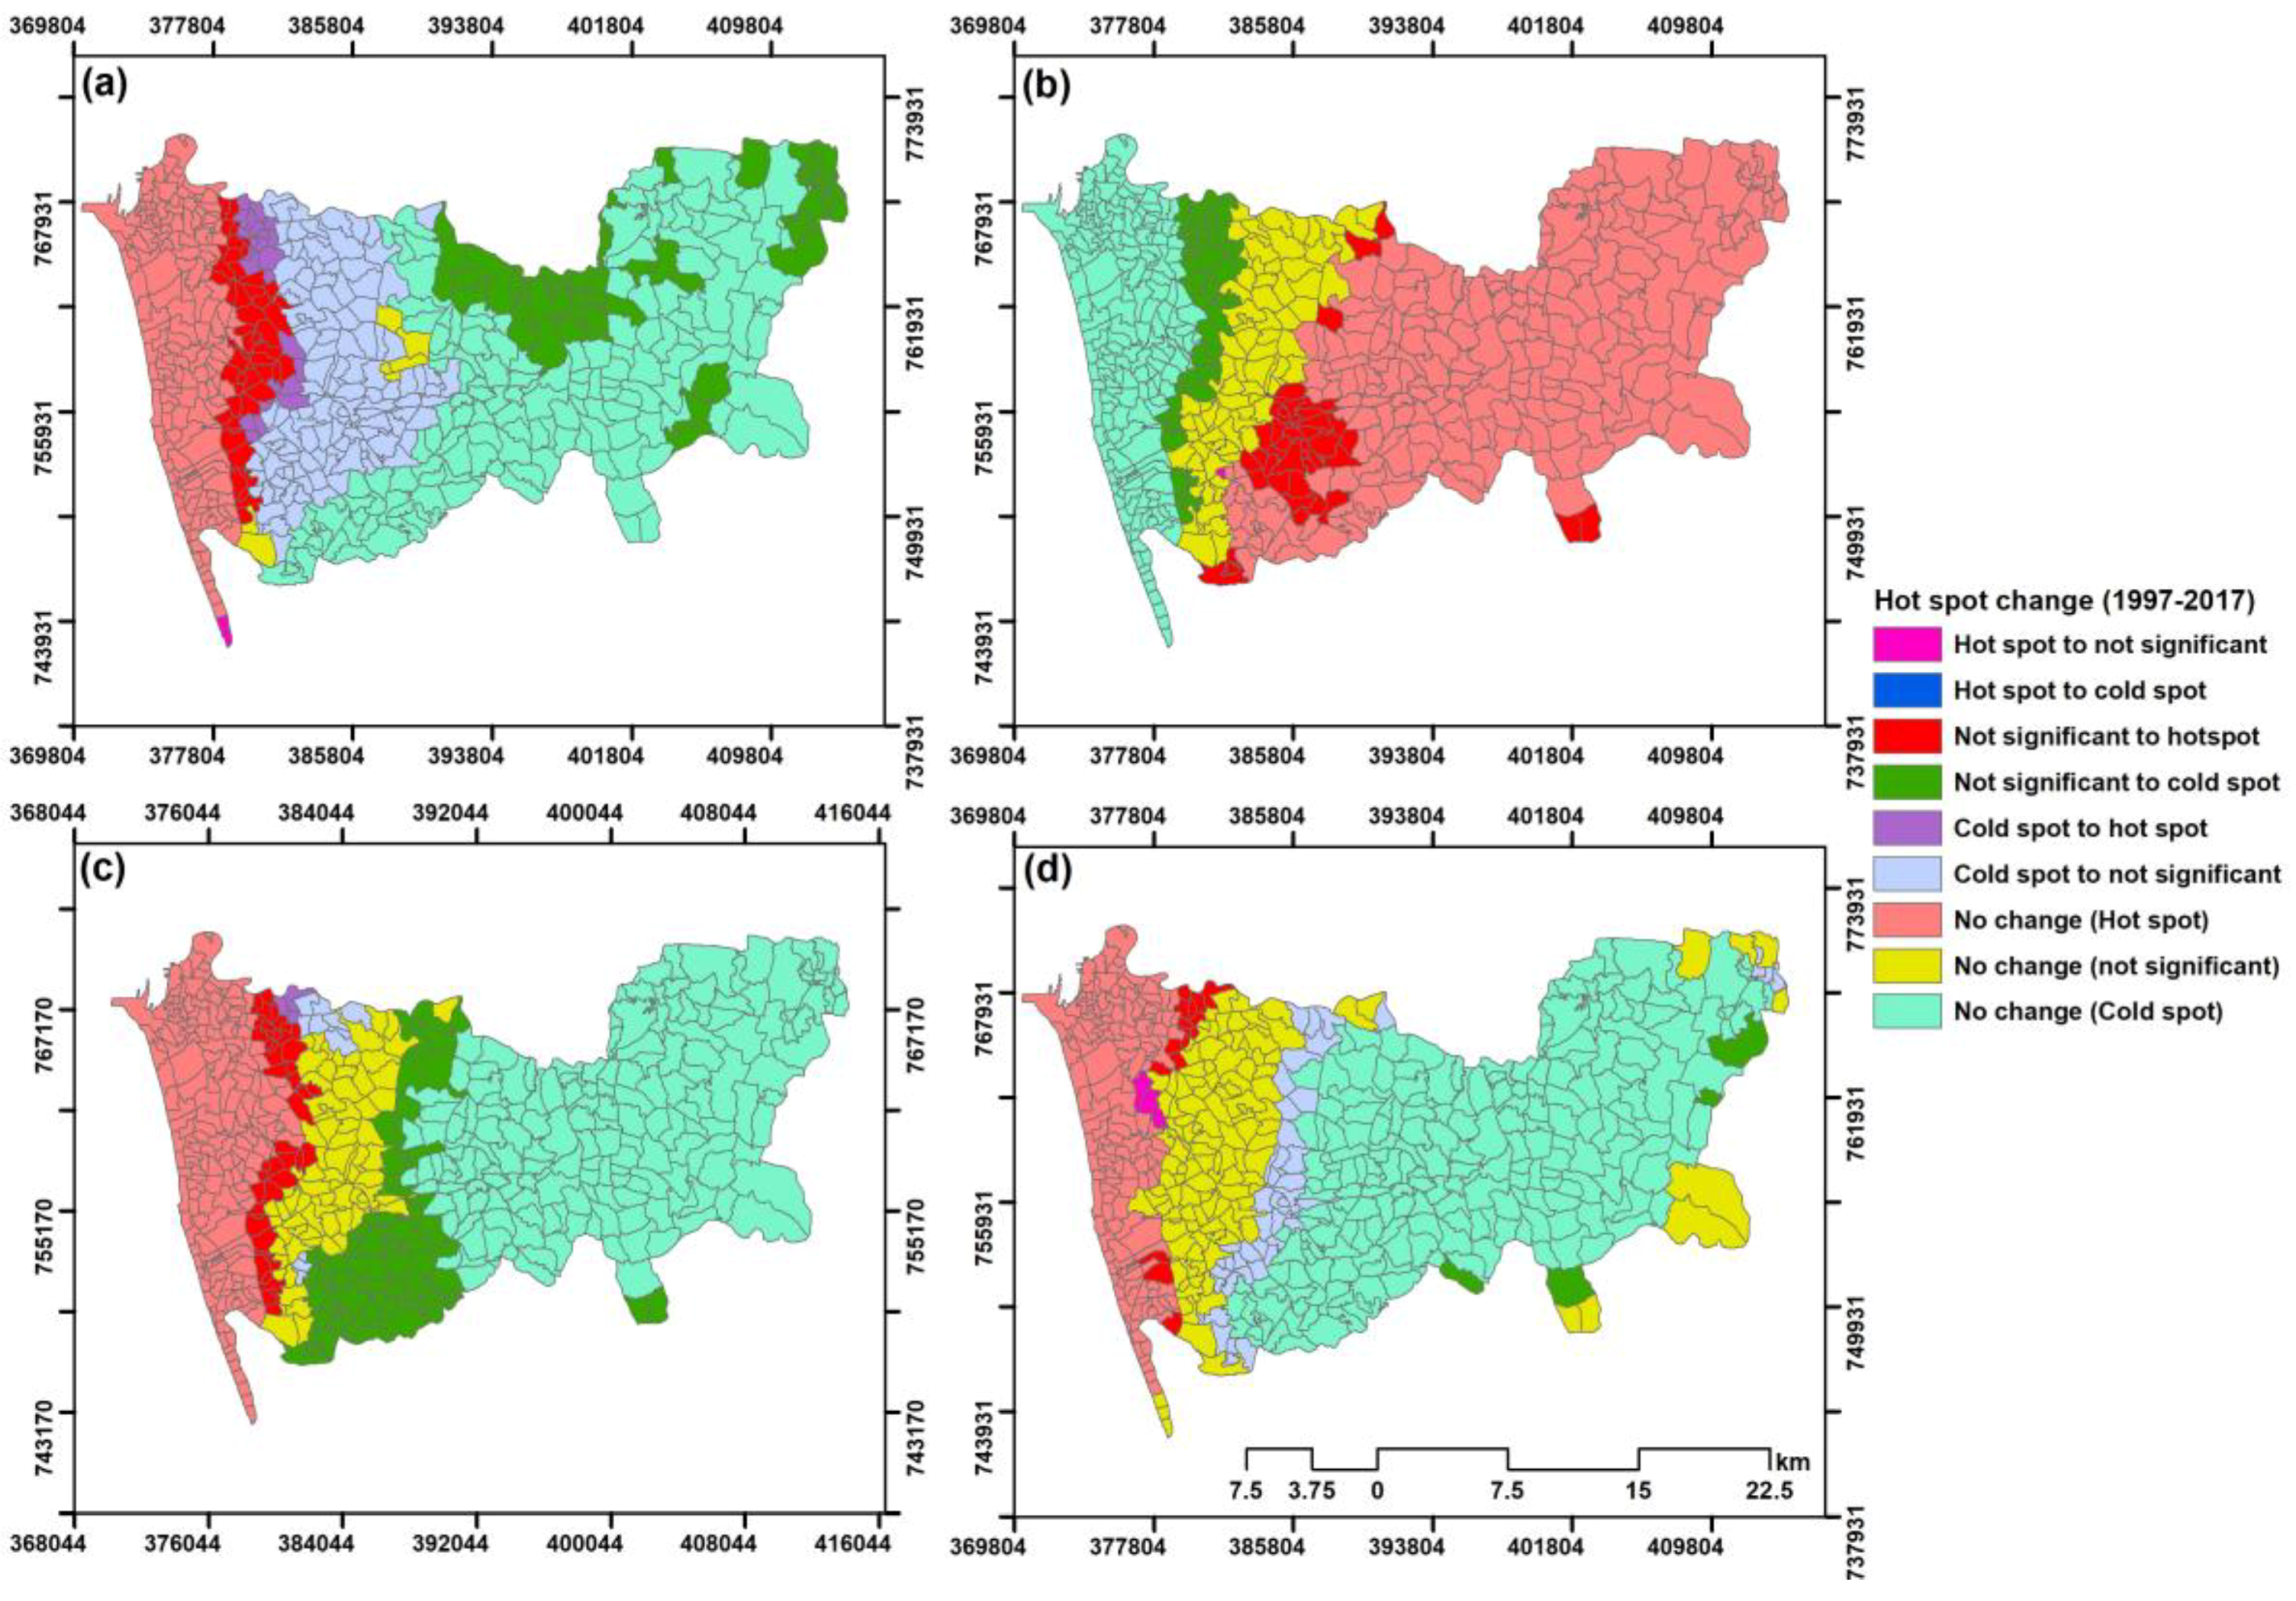
3.5. Changing Pattern of Hot and Cold Spots from 1997 to 2017

Figure 7a and Table 2 and Table 3 present the results of the change in LST hot and cold spots between 1997 and 2017. The percentage of hot spots increased from 29.4% to 41.8%, while cold spots decreased from 52.2% to 35.5% during the 20-year period (Table 2). Also, 8.6% of the not-significant spot had converted to hot spots, while 8.4% of the not-significant spots had changed to cold spots by 2017. In addition, 21% of the cold spots had changed to not-significant by 2017 (Table 3).
Figure 7b and Table 2 and Table 3 present the changing pattern of NDVI hot and cold spots during the 20-year study period. The total percentage of hot and cold spots had increased by 6.8% (37.7% in 1997 to 44.5% in 2017) and 8.6% (32.7% in 1997 to 41.3% in 2017), respectively, while the percentage of not-significant spot had decreased by nearly 50% (29.6% in 1997 to 14.2% in 2017) (Table 2).
Due to a decline in green space, 8.6% of not-significant spots were converted to cold spots (low NDVI values). Over the past 20 years, 32.7% of the divisions have remained cold spots (persistent cold spots) for NDVI and these divisions are found on the western side or the urbanized section of the district. On the other hand, 7% of the not-significant spots had been replaced by hot spots (high NDVI values), indicating improvement of vegetation cover (Table 3).
Figure 7c and Table 2 and Table 3 show the changing pattern of NDBI in a hot spot during the 20-year study period. The results show a declining pattern of not-significant spot from 33.8% in 1997 to 15.4% in 2017, while the percentage of hot and cold spots increased by 8.1% (33.0% in 1997 to 41.1% in 2017) and 10.2% (33.2% in 1997 to 43.4% in 2017), respectively (Table 2). During this period, 7.5% of the not-significant spots had been replaced by hot spot, and 12.7% had changed to cold spots (Table 3). Changing hot spot areas were located to the west of the not-significant spots while changing cold spots were located on the east side of the district. The result showed the newly added built-up areas were located on the western side of the district, as was the development pattern of the district from 1997 to 2017. The spatial changes of clustering pattern of population density based on hot and cold spots are shown in Figure 7d. The percentage of hot and not-significant spots had increased by 2.4% (27.8% in 1997 to 30.2% in 2017) and 4.8% (25.9% in 1997 to 30.7% in 2017), respectively, between 1997 and 2017. A total of 2.9% of the not-significant spots had changed to hot spots, and 7.9% of the cold spot had changed to not-significant spot (Table 3). Most of the newly added hot spots were located in the northwestern part of the district.
Figure 8a,b show the overall changes of clustering pattern of hot and cold spots maps in 1997 and 2017, respectively, while Figure 8c presents the change in the overall hot spots and cold spots from 1997 to 2017. The results showed that 32.7% of the areas in the district were clustered as hot spots at both time points, while 8.8% of the areas remained as not-significant spots and 42.5% remained as cold spots during this period (Table 4). In addition, 7.7% of the not-significant spots had been converted to newly added hot spot by 2017. All of the newly added hot spots were located adjoining persistent hot spots. On the other hand, most of the newly added not-significant spots were located connecting to newly added hot spots. These results showed the changing pattern of SUHI hot spots from west to east due to the increase of impervious surfaces and declining vegetation cover.

4. Discussion

4.1. Spatiotemporal Pattern of Hot and Cold Spots

Increasing LST through the modification and transformation of vegetated surfaces into built-up areas is a serious challenge, particularly in unplanned cities [2]. Hence, LST is an important climate-related factor that can help diagnose and characterize changes in the thermal conditions of urban environments. Increasing urban population, growth of built-up areas, and decreasing vegetation cover are the leading causes of changes in the urban thermal environment [2]. Hot spot and cold spot maps for LST, NDVI, NDBI, and population density were created using Getis-Ord Gi* for 1997 and 2017. The identification of hot and cold spots using this method did not depend on whether the variable values were high or low [9]. It considered the value of neighboring features. Therefore, the results could be compared confidently to provide a better analysis of the SUHI effects in the Colombo District.
According to the hot and cold spots analysis, the effects of SUHI had intensified over the past 20 years and affected more administrative divisions (Figure 2 and Figure 7a). In 1997, most of the very hot spots were located along the western coastal belt within the urban development of Colombo. However, in 2017, most of the newly added hot spots were located further to the east in areas adjoining the 1997 hot spots. The results showed that some of the not-significant spots in 1997 had changed to hot spots by 2017. Changes in hot spots were consistent with recent urban development in the Colombo District. LST hot and not-significant spots tended to have increased, while cold spots tended to have decreased between 1997 and 2017 (Table 2). The hot spot results for LST could support greater understanding of the trends in SUHI formation from 1997 to 2017. All of the hot spot areas were highly clustered in the urban centers, along main roads, and within some industrial zones. Very cold spot was located in rural areas in the eastern part of the district. During the 20-year study period, 21% of the cold spots had changed to not-significant areas, while 8.6% of the not-significant spot had been converted to the hot spots (Table 3). This trend showed that not-significant areas are vulnerable to conversion as hot spot areas over a short period. Hence, suitable remedial measures need to be taken to control the negative impacts of SUHI.
Most of the NDVI cold spots were found in the western part of the district, and hot spots were located in the eastern part (Figure 3 and Figure 7b). Much of the agricultural land and other vegetated areas were located in the eastern part of the district. The result showed some of the not-significant spots in the south of the district in 1997 had changed to hot spots by 2017. It also showed the effects of improvements in the vegetated area in these zones, with an increase in the area of rubber cultivation land between 1997 and 2017. During this period, NDVI hot and cold spots tended to increase, and the not-significant spots tended to decrease (Table 2). Most of the not significant spots were replaced by cold spots due to the reduction in vegetated areas, and some of the not-significant areas had converted to hot spots as a result of improvements in vegetation cover. The hot and cold spots analysis could help with improving understanding of the level of vegetation cover loss or improvement during the study period. The very cold spots of the LST are large areas dominated by the vegetation cover in the eastern part of the district. Improved vegetation cover effected some control over the SUHI phenomenon, and it led to improved living conditions of the local population in the eastern part of the study area. Vegetation cover is important because it mitigates negative impacts of SUHI, as can be seen when comparing Figure 2 and Figure 3 for the Colombo District.
Higher LST was consistently recorded in high-density built-up areas. The NDBI hot and cold spots (Figure 5 and Figure 7c) distribution maps could help to identify spatial variations in the distribution of SUHI in the Colombo District over the 20-year study period. The persistent hot spot clusters were found in the western part of the district along the coastal belt in both time periods, while cold spots were located in the eastern part of the district. The results revealed that some of the not-significant spots in the eastern part of the district in 1997 had changed to cold spots by 2017. For NDBI, the number of hot and cold spots had increased, while the number of the not-significant spots had decreased. During the 20-year study period, 33% of the areas had become hot spots, and all were located in the western part of the district. This result showed that none of the hot spot areas had changed to cold or not-significant spots. In addition, 7.5% of the not-significant areas had been converted to hot spots during the study period (Table 3). These changes can be attributed to rapid urbanization between 1997 and 2017. According to the 2012 population and housing census data, the urban population comprised 54.6% of the total population in 2001 but had increased to 77.6% by 2012. The Colombo District underwent rapid urbanization after 2009 as a result of the conclusion of the 30-year civil war. Most of the urban enhancement projects and transportation system development projects were located in the Colombo metropolitan area because the Colombo District is the capital and main commercial center of the country [4,12,54]. Urban growth is likely to continue in the future [54]. Hence, the not-significant spots can be identified as areas vulnerable to becoming hot spots in the short term.
The population density hot and cold spots had three significant spatial features at both time points in the Colombo District (Figure 6 and Figure 7d). One population density cluster was located in the Colombo CBD and Kolonnawa area. Colombo harbor, the central bus terminal, central railway station, and the head office of the main banks, companies, and government departments were located in these areas. As a result of the availability of these facilities, a high population density was found in these areas. In addition, in 2017, a newly added hot spot was recorded around the Kotikawatta-Mulleriyawa area (Figure 7d). The second cluster was located in the southern part of the CMC and Dehiwala areas. The people lived in the northern and eastern parts of the country had temporarily migrated into this area due to the civil war. After the conclusion of 30 years of civil war in 2009, some of them have moved back to the original location (north and east of the country). This is the one of the reasons for the reduced population in 2017, especially in some administrative divisions located in the western part of the district. This is reflected in the decreasing trend of the population of Colombo City from 2001 to 2011 (−86,000 resident population) [39]. The third cluster was located around the Rathmalana and Moratuwa areas and was due to the Rathmalana industrial zone. Hot and cold spots cluster maps for population density helped to identify the SUHI distribution in the district.
The result of the study showed that the negative impacts associated with SUHI would directly affect areas with high population density areas. On the other hand, the socio-economic activities of the residents in these areas, associated with industries, houses, parking lots, roads, and other construction activities could contribute to the formation of the SUHI phenomenon [5] in the Colombo District.
In 2012, the Colombo District had a population of 2,324,349 (11.4% of the country’s population), making Colombo the most densely populated district in the country (3438 people per km2), but with a total land area occupying only 1.01% of the country’s area [39]. Figure 9a shows that the population of Colombo District is continuously increasing, while Figure 9b shows the growth of urban population and decline of rural population from 2001, predicted to 2041. This rapid urban population growth in Colombo District is expected to continue in the future. Land availability will be the main challenge for housing and for zoning plans to facilitate this urban growth [4] and will enhance the SUHI of the district. Therefore, it is important to improve the vegetation cover (green space), especially in highly populated areas, as well as alongside the road network and in industrial areas and public places, such as schools, religious places, and government institutions, so as to mitigate the adverse impacts of SUHI effects through future urban sustainable planning.
The overall hot and cold spot change maps (Figure 8c) helped to identify the spatial changes of the clustering pattern of SUHI in Colombo District and could be used as a tool to improve future urban landscape planning. During the 20-year study period, nearly one-third of the total divisions persisted as hot spots. All of these areas were located in the western part of the district, which needs to be considered as a SUHI affected area, and appropriate measures to mitigate the adverse impacts of the SUHI need to be developed and implemented. Not-significant spots were particularly vulnerable to changing to hot spots in the near term, as shown by the overall change in hot and cold spots. Furthermore, 43 divisions of not-significant areas in 1997 were converted into hot spots by 2017. The conversion rate of not-significant areas to hot spots was higher than that of cold spots to hot spots. During the last 20 years, only three cold spot divisions have been converted into hot spots. Therefore, it is particularly important to take into account the effects of development proposals in a persistent not-significant spot in future urban planning activities.

4.2. Implications for Urban Sustainability

The results of this study showed the increase in SUHI effects between 1997 and 2017 in the Colombo District. Several important differences could be observed. The hot and cold spot analysis showed an increase in high LST clusters, built-up areas, and population density, and a decrease in green areas, particularly in the western part of the district. As urbanization intensified, more natural areas were replaced by impervious surfaces, which reflect less of the sun’s energy. However, SUHI formation does not only occur due to the expansion of impervious surfaces but also due to a decline in vegetation cover in urban areas. Vegetation cover helps to minimize SUHI effects by providing shade that can prevent direct exposure of land surfaces to solar radiation. An increase in vegetation cover leads to lower surface temperatures because vegetation cover helps to generate cool island effects through evapotranspiration [7,10]. Therefore, it is essential that consideration is given in future landscape and urban planning to increasing urban vegetation cover, particularly in LST very hot spot areas. Parkland and tree cover provision should be enhanced along transportation systems, and vegetation cover should be increased in public places, such as temples, schools, hospitals, and government office premises so as to minimize adverse SUHI effects in the district.
Changes in the overall hot and cold spots showed that 182 divisions (32.7%) of the areas in the district had clustered as hot spots within the 20-year study period. Urban planners should pay more attention to these areas in order to control SUHI effects by implementing urban greening concepts. This study indicated that 47% of the not-significant areas in 1997 had changed to hot spots by 2017. The pattern showed that cold spots were first changed to not-significant spots, and subsequently into hot spots. Therefore, the persistent not-significant spot is more vulnerable to conversion to a hot spot in the short term. This issue needs to be addressed to avoid the occurrence of SUHI in the remaining, not-significant areas. Firstly, planners need to consider persistent not-significant spots as these may be in danger of changing to hot spots within a short period. Secondly, priority should also be given to newly added not-significant spots (cold spot to not-significant) to prevent them from becoming hot spots in the future. The SUHI hot spot pattern could be observed to follow a western to eastern direction, following the urbanization pattern of the district. Therefore, policy-makers should focus on the concept of urban greening in the context of rapid urbanization. It is recommended that the remaining green areas in the district be maintained, and new green areas be established, such as parks, walking paths, urban forest gardens, and greenbelts alongside the transportation network. In comparison to newly added hot spots, very few areas became newly added cold spots between 1997 and 2017, and most of these areas were distributed in areas surrounding stable cold spot areas.
Increasing SUHI affected areas would have an adverse impact on the local residents, giving rise to deteriorating quality of living environment, increased mortality rates, increased energy consumption, and increased hospitalization rates in elderly and children [3,4,7,55]. Therefore, it is recommended that urban planners and policymakers should pay greater attention to minimize SUHI effects in the Colombo District. In this context, it would be beneficial for the western province environmental ministry and Urban Development Authority (UDA) to introduce urban greening projects, especially along the main road network, which would help to enhance the environmental quality of the district. Government policymakers should also introduce new rules and regulations regarding urban development [12], while local government can introduce tree planting activities along the main road network in the district.
The results of the hot and cold spots analysis could be used for more effective urban planning. This study was conducted based on the 557 administrative divisions in the district, and it is straightforward to demarcate the boundaries of local government authorities and implement mitigation measures for areas that have become hot spots. The result would help to minimize the adverse impacts of SUHI on people as well as the environment. This study showed a trend in the conversion of not-significant areas to hot spots, rather than to cold spots. Therefore, urban planners and policymakers need to implement appropriate mitigation activities to control SUHI formation and SUHI effects. The concept of urban greening could be introduced in these areas to minimize SUHI effects on the environment. In addition, green building concepts could be introduced for new construction activities. This would help to minimize the adverse effects of SUHI in the future. Hot and cold spot change maps provide a useful guide to help with the prioritization of administrative units based on the cluster types.

4.3. Limitations of the Study

The analysis of this study was performed based on the two satellite images only. The use of more satellite images captured in multiple time points will provide more information, which can result in a much stronger trend analysis. However, this study was constrained by the unavailability of clear and usable satellite images that were temporarily consistent with the two satellite images that were used (1997 and 2017). The difference in the acquisition time between the two images might have influenced our findings because various environmental factors, including wind speed, surface moisture, humidity, and the intensity of Sun’s radiation, which might not be temporarily consistent or stationary across time points could influence surface temperature values [10]. Similarly, the temporal non-stationarity of the physical and atmospheric conditions of the area due to the images’ difference in acquisition time could also have influenced the temporal variation of the NDVI. Hence, it is recommended that the results be interpreted in light of these limitations.

5. Conclusions

The result of the study showed a SUHI hot spot pattern changing from the western to the eastern direction of the Colombo district. The result revealed that 182 administrative divisions (32.7%) had been persistent hot spots during the last twenty years. Furthermore, 43 divisions of not-significant spots had become hot spots. This pattern showed that not-significant spots were particularly vulnerable to becoming hot spots in the future. In addition, 49 divisions were identified as emerging hot spots in the near future. The hot spots were located in the western part of the district while cold spots were located in the eastern part of the district. The spatial pattern of the emerging SUHI hotspots mirrors the urban development pattern of the Colombo District.
The results could help improve understanding of the formation of SUHI in Colombo District. Urban planners and policymakers should pay greater consideration to the remaining, not-significant clustering areas to prevent or control SUHI formation in these areas in the short term. It is recommended that new green urban development be introduced to control adverse SUHI effects in the future. Overall, the findings of this study could be used as a reference in the context of sustainable landscape and urban planning for the Colombo District.

Author Contributions

The corresponding author, Manjula Ranagalage, proposed the topic and spearheaded the data processing and analysis, as well as the writing of the manuscript. Ronald C. Estoque, Xinmin Zhang, and Yuji Murayama helped in the design, research implementation and analysis, and writing of the manuscript.

Acknowledgments

This study was supported by JSPS Grant-in-Aid for Challenging Exploratory Research, 16K12816 and Basic Research A, 16H01830.

Conflicts of Interest

The authors declare no conflicts of interest.

References

  1. United Nations (UN). World Urbanization Prospects: The 2014 Revision: Highlights; United Nations: New York, NY, USA, 2015; Volume 12. [Google Scholar]
  2. Singh, P.; Kikon, N.; Verma, P. Impact of land use change and urbanization on urban heat island in Lucknow city, Central India. A remote sensing based estimate. Sustain. Cities Soc. 2017, 32, 100–114. [Google Scholar] [CrossRef]
  3. Estoque, R.C.; Murayama, Y.; Myint, S.W. Science of the Total Environment Effects of landscape composition and pattern on land surface temperature: An urban heat island study in the megacities of Southeast Asia. Sci. Total Environ. 2017, 577, 349–359. [Google Scholar] [CrossRef] [PubMed]
  4. Ranagalage, M.; Estoque, R.C.; Murayama, Y. An Urban Heat Island Study of the Colombo Metropolitan Area, Sri Lanka, Based on Landsat Data (1997–2017). ISPRS Int. J. Geo-Inf. 2017, 6, 189. [Google Scholar] [CrossRef]
  5. Zhang, X.; Estoque, R.C.; Murayama, Y. An urban heat island study in Nanchang City, China based on land surface temperature and social-ecological variables. Sustain. Cities Soc. 2017, 32, 557–568. [Google Scholar] [CrossRef]
  6. Voogt, J.A. Urban Heat Islands Cities, 2004. Available online: http:// www. actionbioscience.org/environment/voogt.html (accessed on 5 March 2018).
  7. US Environmental Protection Agency (EPA). Reducing Urban Heat Islands: Compendium of Strategies Urban Heat Island Basics; US Environmental Protection Agency: Washington, DC, USA, 2009.
  8. Myint, S.W.; Wentz, E.A.; Brazel, A.J.; Quattrochi, D.A. The impact of distinct anthropogenic and vegetation features on urban warming. Landsc. Ecol. 2013, 28, 959–978. [Google Scholar] [CrossRef]
  9. Tran, D.X.; Pla, F.; Latorre-Carmona, P.; Myint, S.W.; Caetano, M.; Kieu, H.V. Characterizing the relationship between land use land cover change and land surface temperature. ISPRS J. Photogramm. Remote Sens. 2017, 124, 119–132. [Google Scholar] [CrossRef]
  10. Estoque, R.C.; Murayama, Y. Monitoring surface urban heat island formation in a tropical mountain city using Landsat data (1987–2015). ISPRS J. Photogramm. Remote Sens. 2017, 133, 18–29. [Google Scholar] [CrossRef]
  11. Stathopoulou, M.; Cartalis, C. Daytime urban heat islands from Landsat ETM+ and Corine land cover data: An application to major cities in Greece. Sol. Energy 2007, 81, 358–368. [Google Scholar] [CrossRef]
  12. Senanayake, I.P.; Welivitiya, W.D.D.P.; Nadeeka, P.M. Remote sensing based analysis of urban heat islands with vegetation cover in Colombo city, Sri Lanka using Landsat-7 ETM+ data. Urban Clim. 2013, 5, 19–35. [Google Scholar] [CrossRef]
  13. Li, J.; Wang, X.; Wang, X.; Ma, W.; Zhang, H. Remote sensing evaluation of urban heat island and its spatial pattern of the Shanghai metropolitan area, China. Ecol. Complex. 2009, 6, 413–420. [Google Scholar] [CrossRef]
  14. Li, Y.Y.; Zhang, H.; Kainz, W. Monitoring patterns of urban heat islands of the fast-growing Shanghai metropolis, China: Using time-series of Landsat TM/ETM+ data. Int. J. Appl. Earth Obs. Geoinf. 2012, 19, 127–138. [Google Scholar] [CrossRef]
  15. Sakakibara, Y.; Owa, K. Urban-rural temperature differences in coastal cities: Influence of rural sites. Int. J. Climatol. 2005, 25, 811–820. [Google Scholar] [CrossRef]
  16. Myint, S.W.; Brazel, A.; Okin, G.; Buyantuyev, A. Combined Effects of Impervious Surface and Vegetation Cover on Air Temperature Variations in a Rapidly Expanding Desert City. GISci. Remote Sens. 2010, 47, 301–320. [Google Scholar] [CrossRef]
  17. Chaudhuri, G.; Mishra, N.B. Spatio-temporal dynamics of land cover and land surface temperature in Ganges-Brahmaputra delta: A comparative analysis between India and Bangladesh. Appl. Geogr. 2016, 68, 68–83. [Google Scholar] [CrossRef]
  18. Rasul, A.; Balzter, H.; Smith, C. Spatial variation of the daytime Surface Urban Cool Island during the dry season in Erbil, Iraqi Kurdistan, from Landsat 8. Urban Clim. 2015, 14, 176–186. [Google Scholar] [CrossRef]
  19. Tan, M.H.; Li, X.B. Integrated assessment of the cool island intensity of green spaces in the mega city of Beijing. Int. J. Remote Sens. 2013, 34, 3028–3043. [Google Scholar] [CrossRef]
  20. Wu, H.; Ye, L.-P.; Shi, W.-Z.; Clarke, K.C. Assessing the effects of land use spatial structure on urban heat islands using HJ-1B remote sensing imagery in Wuhan, China. Int. J. Appl. Earth Obs. Geoinf. 2014, 32, 67–78. [Google Scholar] [CrossRef]
  21. Nichol, J.E.; To, P.H. Temporal characteristics of thermal satellite images for urban heat stress and heat island mapping. ISPRS J. Photogramm. Remote Sens. 2012, 74, 153–162. [Google Scholar] [CrossRef]
  22. Tsai, P.-J.; Lin, M.-L.; Chu, C.-M.; Perng, C.-H. Spatial autocorrelation analysis of health care hotspots in Taiwan in 2006. BMC Public Health 2009, 9, 464. [Google Scholar] [CrossRef] [PubMed]
  23. Gajovic, V.; Todorovic, B. Spatial and temporal analysis of fires in Serbia for period 2000–2013. J. Geogr. Inst. Jovan Cvijic SASA 2013, 63, 297–312. [Google Scholar] [CrossRef]
  24. Rodriguez Lopez, J.M.; Heider, K.; Scheffran, J. Frontiers of urbanization: Identifying and explaining urbanization hot spots in the south of Mexico City using human and remote sensing. Appl. Geogr. 2017, 79, 1–10. [Google Scholar] [CrossRef]
  25. Yun, S.B.; Yoon, S.H.; Ju, S.; Oh, W.S.; Ma, J.W.; Heo, J. Taxi cab service optimization using spatio-temporal implementation to hot-spot analysis with taxi trajectories. In Proceedings of the 5th ACM SIGSPATIAL International Workshop on Mobile Geographic Information Systems, Burlingame, CA, USA, 2016; pp. 12–18. [Google Scholar]
  26. Rauner, S.; Eichhorn, M.; Thrän, D. The spatial dimension of the power system: Investigating hot spots of Smart Renewable Power Provision. Appl. Energy 2016, 184, 1038–1050. [Google Scholar] [CrossRef]
  27. Songchitruksa, P.; Zeng, X. Getis-Ord Spatial Statistics to Identify Hot Spots by Using Incident Management Data. Transp. Res. Rec. J. Transp. Res. Board 2010, 2165, 42–51. [Google Scholar] [CrossRef]
  28. Li, Z.; Liu, S.; Zhang, X.; West, T.O.; Ogle, S.M.; Zhou, N. Evaluating land cover influences on model uncertainties—A case study of cropland carbon dynamics in the Mid-Continent Intensive Campaign region. Ecol. Modell. 2016, 337, 176–187. [Google Scholar] [CrossRef]
  29. Wolf, T.; McGregor, G. The development of a heat wave vulnerability index for London, United Kingdom. Weather Clim. Extrem. 2013, 1, 59–68. [Google Scholar] [CrossRef] [Green Version]
  30. Wasowicz, P. Non-native species in the vascular flora of highlands and mountains of Iceland. PeerJ PrePints 2016, 4, e1559. [Google Scholar] [CrossRef] [PubMed]
  31. Handayani, H.H.; Estoque, R.C.; Murayama, Y. Estimation of built-up and green volume using geospatial techniques: A case study of Surabaya, Indonesia. Sustain. Cities Soc. 2018, 37, 581–593. [Google Scholar] [CrossRef]
  32. Das Majumdar, D.; Biswas, A. Quantifying land surface temperature change from LISA clusters: An alternative approach to identifying urban land use transformation. Landsc. Urban Plan. 2016, 153, 51–65. [Google Scholar] [CrossRef]
  33. ESRI (a). How Hot Spot Analysis (Getis-Ord Gi) Works? 2016. Available online: http://pro.arcgis.com/en/pro-app/tool-reference/spatial-statistics/h-how-hot-spot-analysis-getis-ord-gi-spatial-stati.htm (accessed on 2 March 2018).
  34. RDA. 2017. Available online: http://www.rda.gov.lk/source/expressways.htm (accessed on 28 February 2018).
  35. Senanayake, I.P.; Welivitiya, W.D.D.P.; Nadeeka, P.M. Urban green spaces analysis for development planning in Colombo, Sri Lanka, utilizing THEOS satellite imagery—A remote sensing and GIS approach. Urban For. Urban Green. 2013, 12, 307–314. [Google Scholar] [CrossRef]
  36. Johansson, E.; Emmanuel, R. The influence of urban design on outdoor thermal comfort in the hot, humid city of Colombo, Sri Lanka. Int. J. Biometeorol. 2006, 51, 119–133. [Google Scholar] [CrossRef] [PubMed]
  37. Herath, D.; Pitawala, A.; Gunatilake, J. Heavy metals in road deposited sediments and road dusts of Colombo Capital, Sri Lanka. J. Natl. Sci. Found. Sri Lanka 2016, 44, 193–202. [Google Scholar] [CrossRef]
  38. Emmanuel, R.; Johansson, E. Influence of urban morphology and sea breeze on hot humid microclimate: The case of Colombo, Sri Lanka. Clim. Res. 2006, 30, 189–200. [Google Scholar] [CrossRef]
  39. Department of Census and Statistics. Census of Population and Housing 2012; Key Finding: Colombo, Sri Lanka; Department of Census and Statistics: Colombo, Sri Lanka, 2012. [Google Scholar]
  40. Department of Census and Statistics, Census of Population and Housing, Department of Census and Statistics: Colombo, Sri Lanka, 2001. Available online: http://www.statistics.gov.lk/PopHouSat/PDF/p7%20 population%20and%20Housing%20Text-11-12-06.pdf (accessed on 28 February 2018).
  41. Weng, Q.; Lu, D.; Schubring, J. Estimation of land surface temperature-vegetation abundance relationship for urban heat island studies. Remote Sens. Environ. 2004, 89, 467–483. [Google Scholar] [CrossRef]
  42. Chen, X.L.; Zhao, H.M.; Li, P.X.; Yin, Z.Y. Remote sensing image-based analysis of the relationship between urban heat island and land use/cover changes. Remote Sens. Environ. 2006, 104, 133–146. [Google Scholar] [CrossRef]
  43. Kumar, D.; Shekhar, S. Statistical analysis of land surface temperature-vegetation indexes relationship through thermal remote sensing. Ecotoxicol. Environ. Saf. 2015, 121, 39–44. [Google Scholar] [CrossRef] [PubMed]
  44. Orhan, O.; Ekercin, S.; Dadaser-Celik, F. Use of Landsat land surface temperature and vegetation indices for monitoring drought in the Salt Lake Basin Area, Turkey. Sci. World J. 2014, 2014. [Google Scholar] [CrossRef] [PubMed]
  45. Zhang, Y.; Odeh, I.O.A.; Han, C. Bi-temporal characterization of land surface temperature in relation to impervious surface area, NDVI and NDBI, using a sub-pixel image analysis. Int. J. Appl. Earth Obs. Geoinf. 2009, 11, 256–264. [Google Scholar] [CrossRef]
  46. Kikon, N.; Singh, P.; Singh, S.K.; Vyas, A. Assessment of urban heat islands (UHI) of Noida City, India using multi-temporal satellite data. Sustain. Cities Soc. 2016, 22, 19–28. [Google Scholar] [CrossRef]
  47. Zha, Y.; Gao, J.; Ni, S. Use of normalized difference built-up index in automatically mapping urban areas from TM imagery. Int. J. Remote Sens. 2003, 24, 583–594. [Google Scholar] [CrossRef]
  48. Liu, H.; Weng, Q. Enhancing temporal resolution of satellite imagery for public health studies: A case study of West Nile Virus outbreak in Los Angeles in 2007. Remote Sens. Environ. 2012, 117, 57–71. [Google Scholar] [CrossRef]
  49. Chander, G.; Markham, B.L.; Helder, D.L. Summary of current radiometric calibration coefficients for Landsat MSS, TM, ETM+, and EO-1 ALI sensors. Remote Sens. Environ. 2009, 113, 893–903. [Google Scholar] [CrossRef]
  50. Sobrino, J.A.; Jiménez-Muñoz, J.C.; Paolini, L. Land surface temperature retrieval from LANDSAT TM 5. Remote Sens. Environ. 2004, 90, 434–440. [Google Scholar] [CrossRef]
  51. Ord, J.K.; Getis, A. Local Spatial Autocorrelation Statistics: Distributional Issues and an Application. Geogr. Anal. 1995, 27, 286–306. [Google Scholar] [CrossRef]
  52. ESRI (b). What is a z-Score? What is a p-Value? 2016. Available online: http://pro.arcgis.com/en/pro-app/tool-reference/spatial-statistics/what-is-a-z-score-what-is-a-p-value.htm (accessed on 2 March 2018).
  53. Oke, T.R. City size and the urban heat island. Atmos. Environ. 1973, 7, 769–779. [Google Scholar] [CrossRef]
  54. Subasinghe, S.; Estoque, R.C.; Murayama, Y. Spatiotemporal Analysis of Urban Growth Using GIS and Remote Sensing: A Case Study of the Colombo Metropolitan Area, Sri Lanka. Int. J. Geo-Inf. 2016, 5, 1–19. [Google Scholar] [CrossRef]
  55. Rizwan, A.M.; Dennis, L.Y.C.; Liu, C. A review on the generation, determination and mitigation of Urban Heat Island. J. Environ. Sci. 2008, 20, 120–128. [Google Scholar] [CrossRef]
Figure 1. Location map of the study area: (a) Map of South Asia (Map source: www.yourchildlearns.com); (b) Location of the Colombo District; (c) the extent of the study area with urban and rural demarcation and road network of the Colombo District.
Sustainability 10 01367 g001
Figure 2. The spatial pattern of (a) LST 1997; (b) LST 2017; (c) Hot and Cold spots of LST 1997; (d) Hot and Cold spots of LST 2017 in the Colombo District.
Sustainability 10 01367 g002
Figure 3. The spatial pattern of (a) NDVI 1997; (b) NDVI 2017; (c) Hot and Cold spots of NDVI 1997; (d) Hot and Cold spots of NDVI 2017 in Colombo District. Here, NDVI values refer to the original values (not inverted). The inverted NDVI hot and cold spots in Section 2.8 were used in Figure 8.
Sustainability 10 01367 g003
Figure 4. Scatter plots between NDVI, NDBI, and Population density with mean LST in 1997 to 2017.
Sustainability 10 01367 g004
Figure 5. The spatial pattern of (a) NDBI 1997; (b) NDBI 2017; (c) Hot and Cold spots of NDBI 1997, (d) Hot and Cold spots of NDBI 2017 in the Colombo District.
Sustainability 10 01367 g005
Figure 6. The spatial pattern of (a) Population density 1997; (b) Population density 2017; (c) Hot and Cold spot of Population density 1997; (d) Hot and Cold spot of Population density 2017 in the Colombo District.
Sustainability 10 01367 g006
Figure 7. Changing in the spatial pattern of (a) Hot and cold spot change of LST; (b) Hot and cold spot change of NDVI (not inverted); (c) Hot and Cold spot change of NDBI; (d) Hot and Cold spot change of Population density from 1997–2017 in the Colombo District.
Sustainability 10 01367 g007
Figure 8. Change in the spatial pattern of SUHI formation (a) Overall hot and cold spots in 1997; (b) Overall hot and cold spots in 2017; (c) Change in overall hot and cold spots from 1997 to 2017 in the Colombo District.
Sustainability 10 01367 g008
Figure 9. (a) Population growth of the Colombo District. Note: The 1991 population was projected using a 1.4% growth rate (1981–2001). 2021, 2031 and 2041 populations were projected using a 0.9% growth rate (average between 1981–2001 and 2001–2012); (b) Proportion of urban and rural population in the Colombo District. 2021, 2031 and 2041 data were projected using a 3.9% (urban) and −6.6 (rural) growth rate (Data Source: Census Data Statistics 1981, 2001, and 2012).
Sustainability 10 01367 g009
Table 1. Descriptions of the Landsat images used.
(a) Landsat Data for Two Time Points
SensorScene IDAcquisition DateTimeSeason
GMTLocal
Landsat-5 TMLT51410551997038BKT01February 7, 199704:18:3809:48:38Dry
Landsat-8 OLI/TIRSLC81410552017013LGN00January 13, 201704:54:0510:24:05Dry
(b) Features of Landsat TM 5 and 8 OLI/TIRS Images
Electromagnetic RegionTM 58 OLI/TIRSResolution (Meter)
BandsWavelength (Micrometers)BandsWavelength (Micrometers)
Coastal aerosol--10.43–0.4530
Blue10.45–0.5220.45–0.5130
Green20.52–0.6030.53–0.5930
Read30.63–0.6940.64–0.6730
Near infrared (NIR)40.76–0.9050.85–0.8830
Short wave infrared (SWIR) 151.55–1.7561.57–1.6530
Short wave infrared (SWIR) 272.08–2.3572.11–2.2930
Panchromatic--80.50–0.6830
Cirrus--91.36–1.3830
Thermal infrared (TIR) 1610.40–12.501010.60–11.19120 1 30
100 1 30
Thermal infrared (TIR) 2--1111.50–12.51100 1 30
1 The Landsat TM 5 thermal band images were acquired at 120 m and those for Landsat 8 OLI/TIRS at 100 m resolution but resampled to 30 m. source: http://landsat.usgs.gov/.
Table 2. Hot and cold spots of LST, NDVI, NDBI and population density (% of administrative division).
CategoriesLSTNDVINDBIPopulation Density
19972017199720171997201719972017
Very cold spot24.126.930.337.723.235.00.27.9
Cold spot16.56.51.81.85.75.436.123.9
Cool spot11.72.20.51.84.33.110.17.4
Total cold spot52.235.532.741.333.243.446.339.1
Not-significant18.322.629.614.233.815.425.930.7
Warm spot0.02.06.83.40.91.41.42.2
Hot spot1.63.26.14.81.82.58.19.2
Very hot spot27.836.624.836.330.337.218.318.9
Total hot spot29.441.837.744.533.041.127.830.2
Table 3. Percentage change of hot and cold spots from 1997 to 2017 (% of administrative division).
Changes CategoriesLSTNDVINDBIPopulation Density
Hot spot to Not-significant0.40.20.00.5
Hot spot to Cold spot0.00.00.00.0
Not-significant to Hot spot8.67.07.52.9
Not-significant to Cold spot8.48.612.70.7
Cold spot to Hot spot4.10.00.50.0
Cold spot to Not-significant21.00.02.07.9
Persistent Hot spot29.137.533.027.3
Persistent Not-significant1.314.013.522.3
Persistent Cold spot27.132.730.738.4
Total100100100100
Table 4. Change in the overall hot and cold spots from 1997 to 2017.
CategoryNumber of DivisionPercentage
Persistent Hot spot18232.7
Persistent Not-significant498.8
Persistent Cold spot23742.5
Not-significant to Hot spot437.7
Cold spot to Hot spot30.5
Cold spot to Not-significant376.6
Not-significant to Cold spot61.1
Hot spot to Not-significant00
Hot spot to Cold spot00
Total557100

