Toward the Coordinated Sustainable Development of Urban Water Resource Use and Economic Growth: An Empirical Analysis of Tianjin City, China


Abstract
:1. Introduction
2. Materials and Methods
2.1. Construction of Water Decoupling Model
2.2. LMDI Decomposition Model
2.3. Expansion of Water Decoupling Model
2.4. Data Sources
3. Results and Discussion
3.1. Analysis of the Decoupling Relationship
3.1.1. Analysis of the Decoupling Relationship between the Total Volume of Industrial Water Utilization and Tianjin Economic Growth
3.1.2. Analysis of Decoupling Relationship between Water Utilization of Three Industries and Economic Growth in Tianjin
3.2. Analysis of Decoupling Driving Factors
4. Conclusions and Recommendations
- The total volume of industrial water utilization of Tianjin first decreased, with some fluctuation and then increased, also with some fluctuation. The average annual growth rate was −0.15%, indicating a generally decreasing trend in the total volume of industrial water utilization. Tianjin’s GDP increased year by year, with an average annual growth rate of 14.29%. These results suggest that the industrial water utilization and economic growth in Tianjin achieved a strong decoupling state.
- The economic scale effect drove the relationship between industrial water utilization and economic growth. This led to a transition of expansive negative decoupling to expansive coupling to a sustained state of weak decoupling. This relieved the water pressure caused by the expansion of economic scale. As a result, the growth rate of industrial water utilization was lower than the growth rate of economic growth.
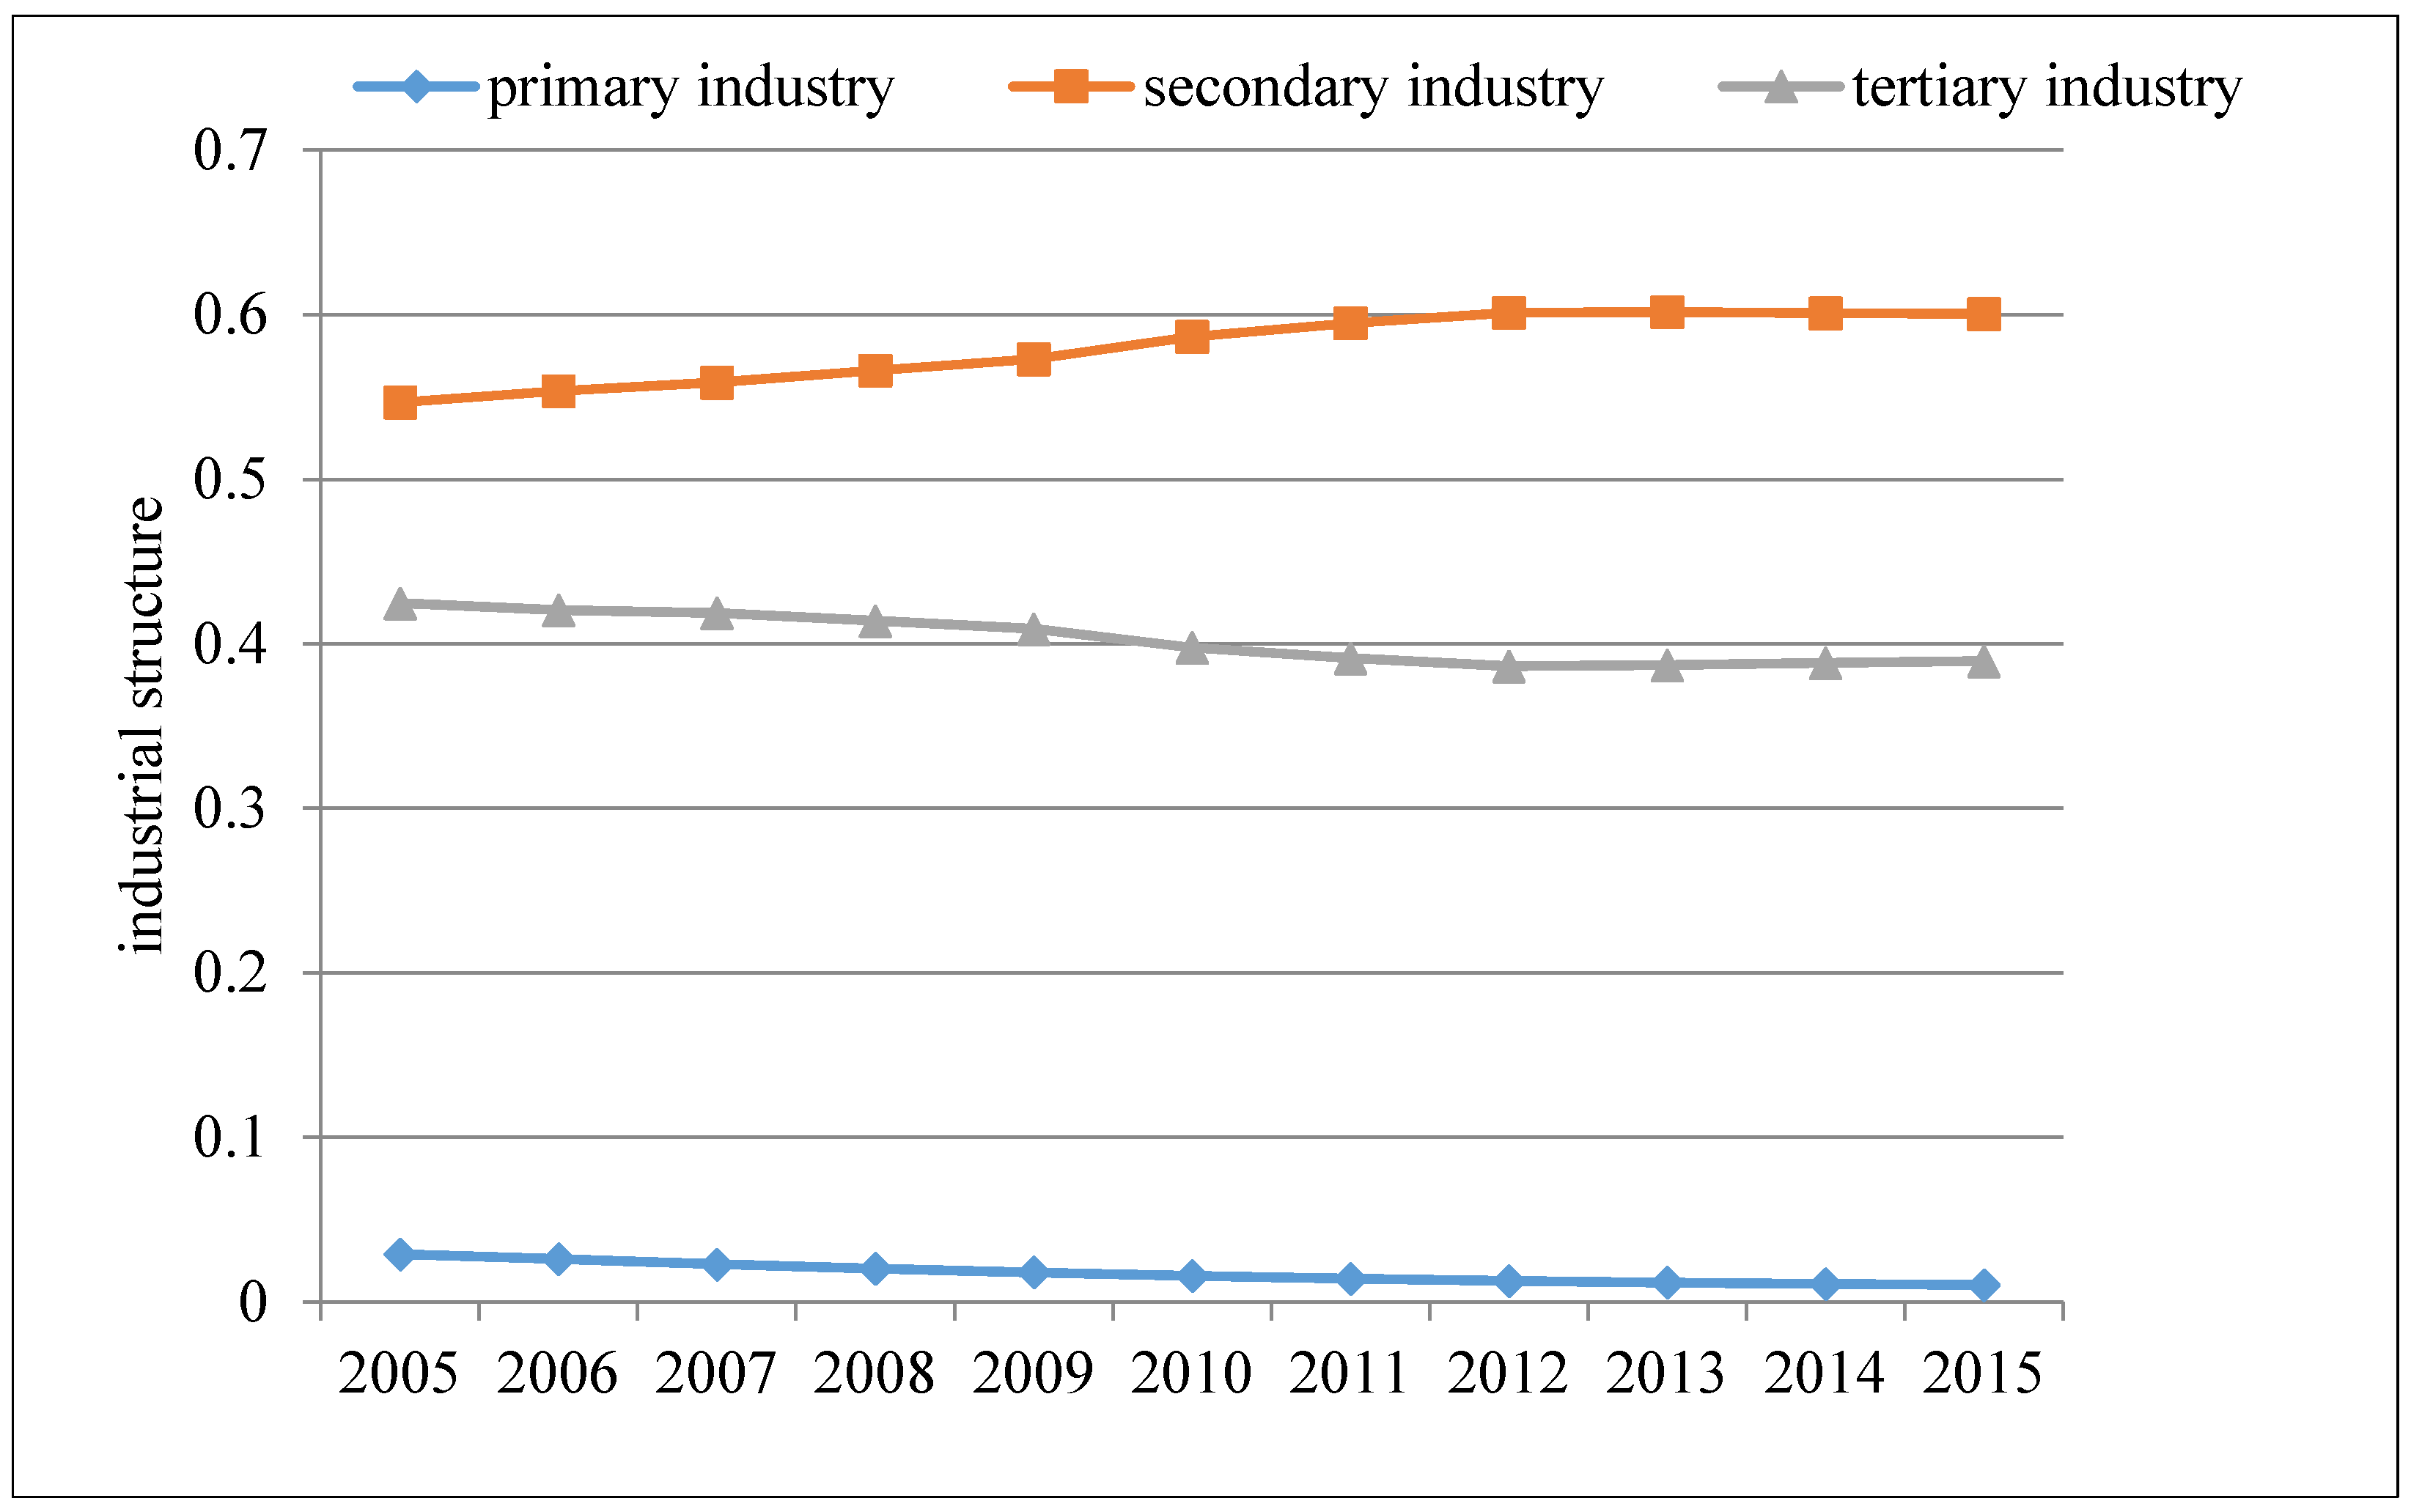
- The industrial structure effect was the main factor driving the decoupling between industrial water utilization and economic growth. The decline in the proportion of primary industry was the main reason for the decline of industrial water utilization. Tianjin’s current industrial structure was “tertiary, secondary, primary”; the proportion of added value from high water-consuming and low-yield primary industries was less than 1.5%. In contrast, the proportion of water utilization was as high as 65%. The proportion of added value from low water-consuming and high-yield tertiary industries was low. As such, there remains significant water-saving potential by optimizing the industrial structure and increasing the representation of the tertiary industry.
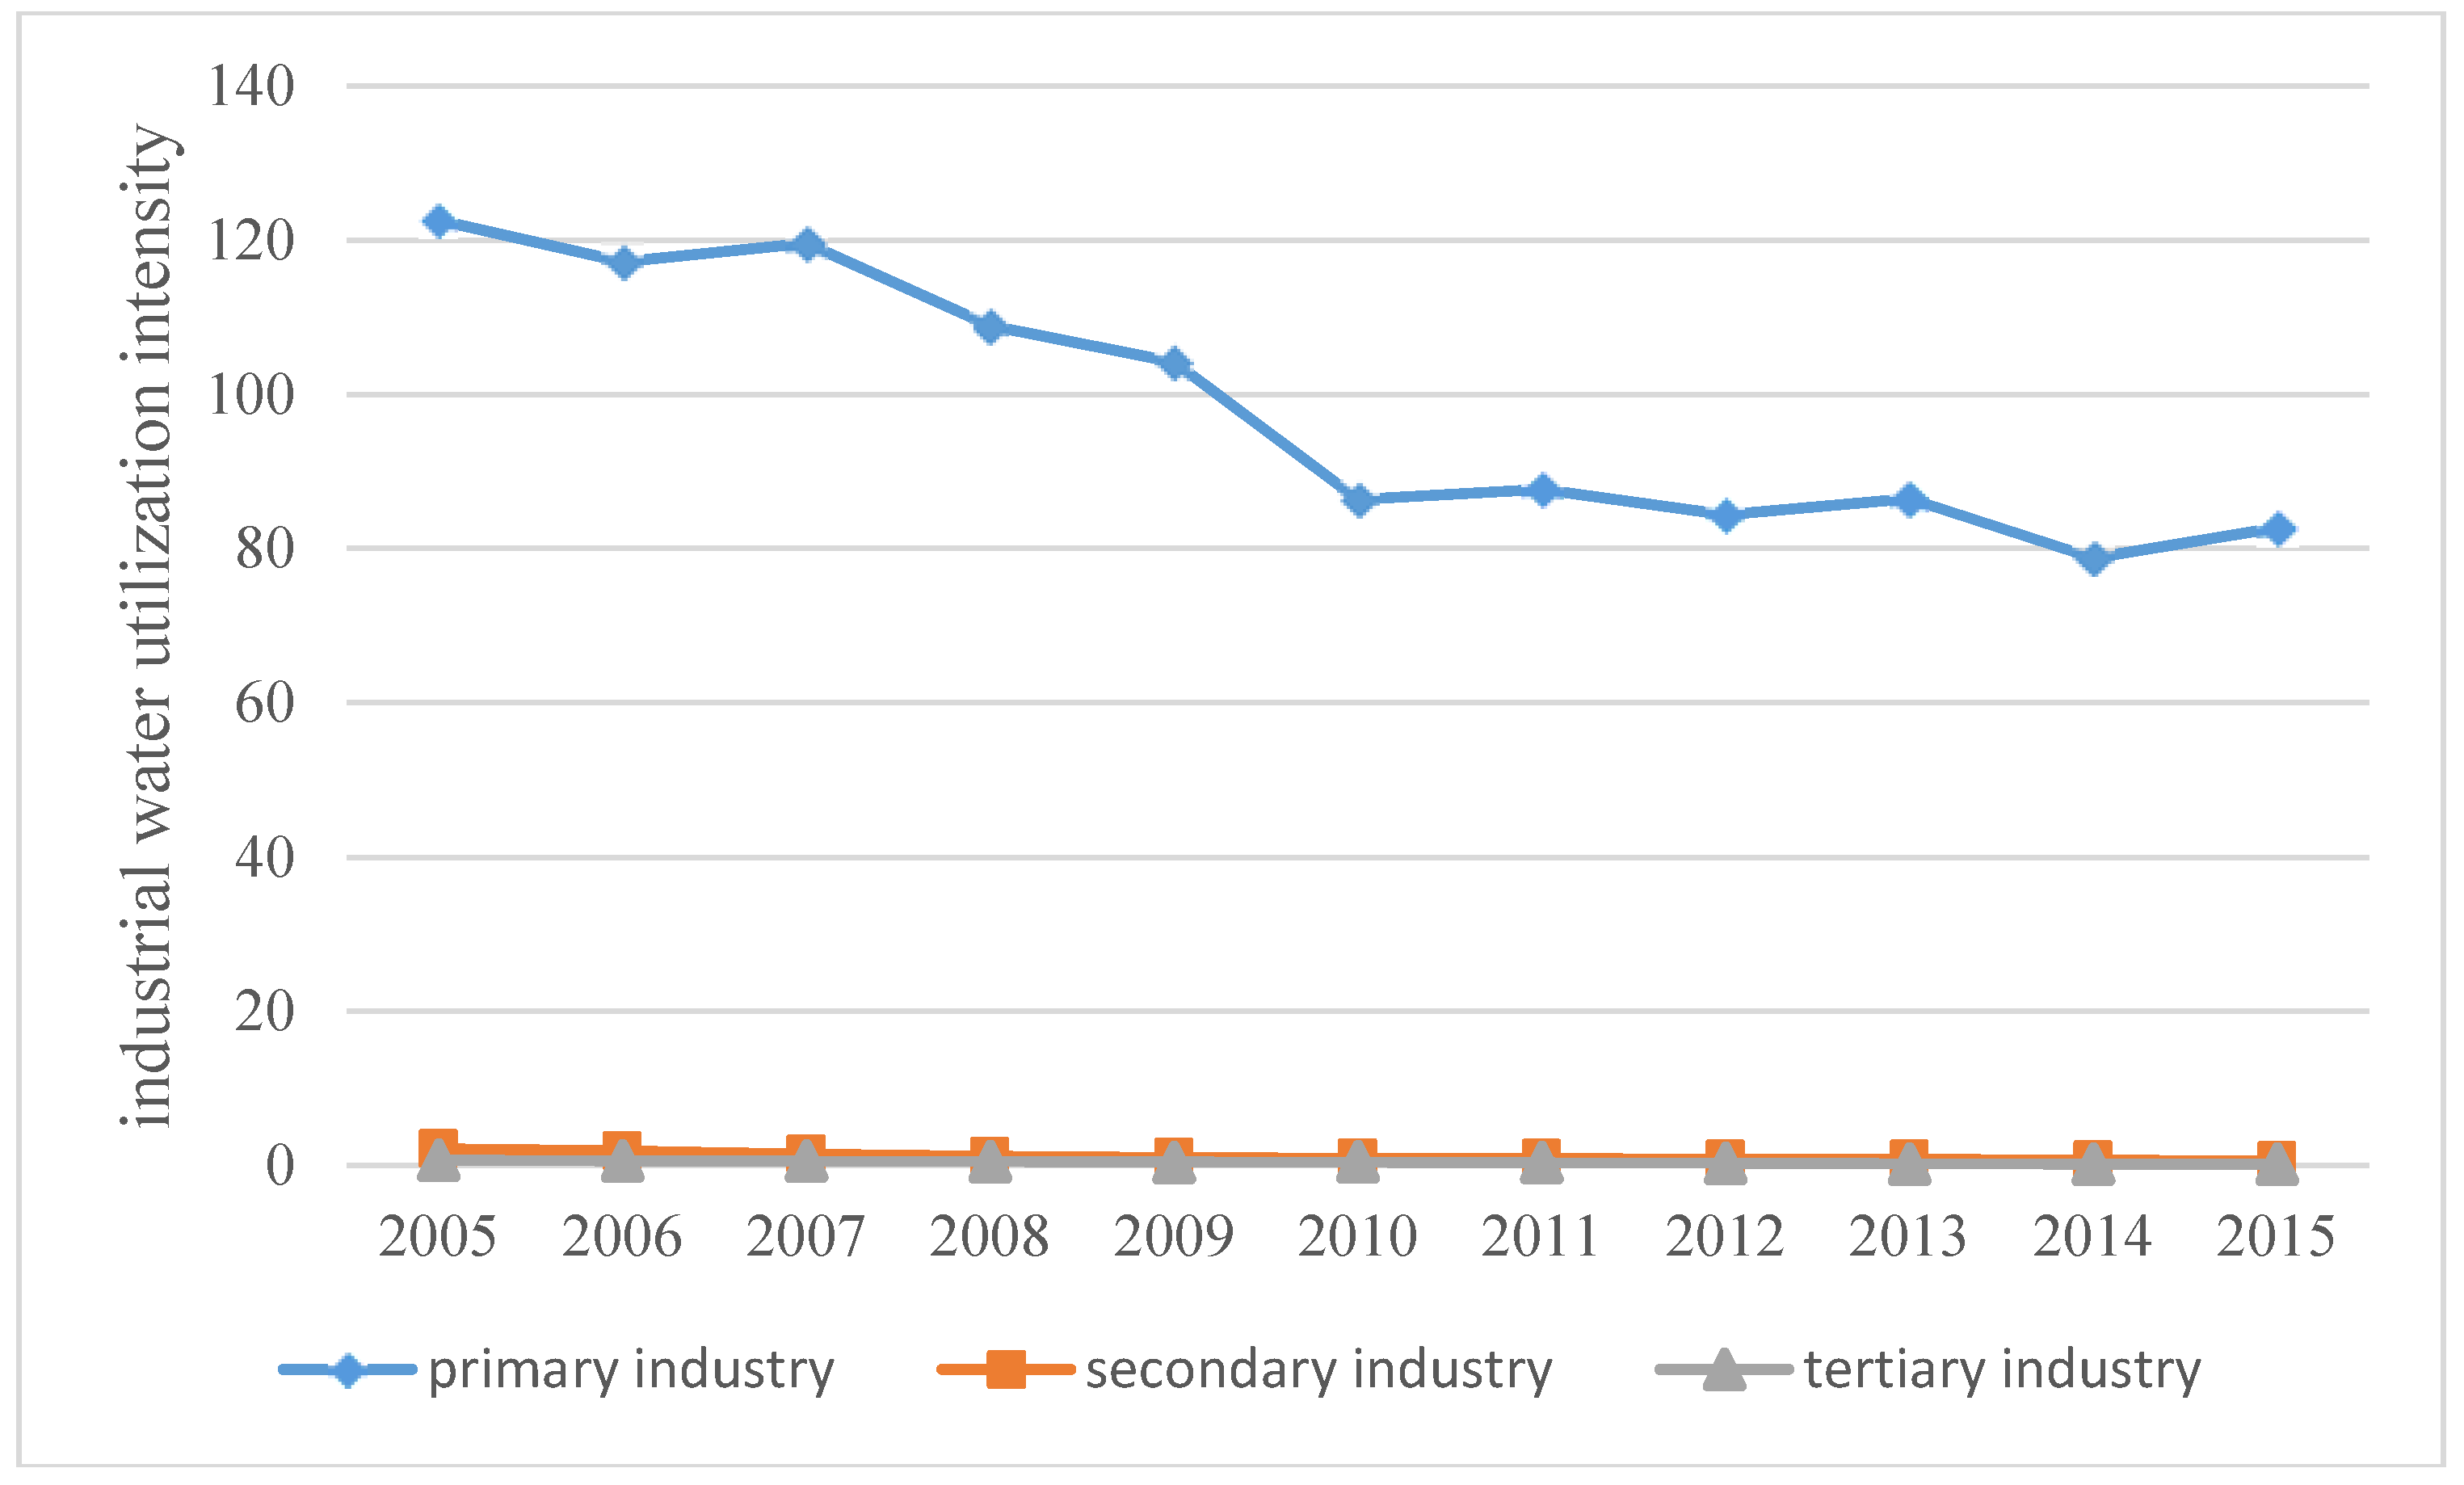
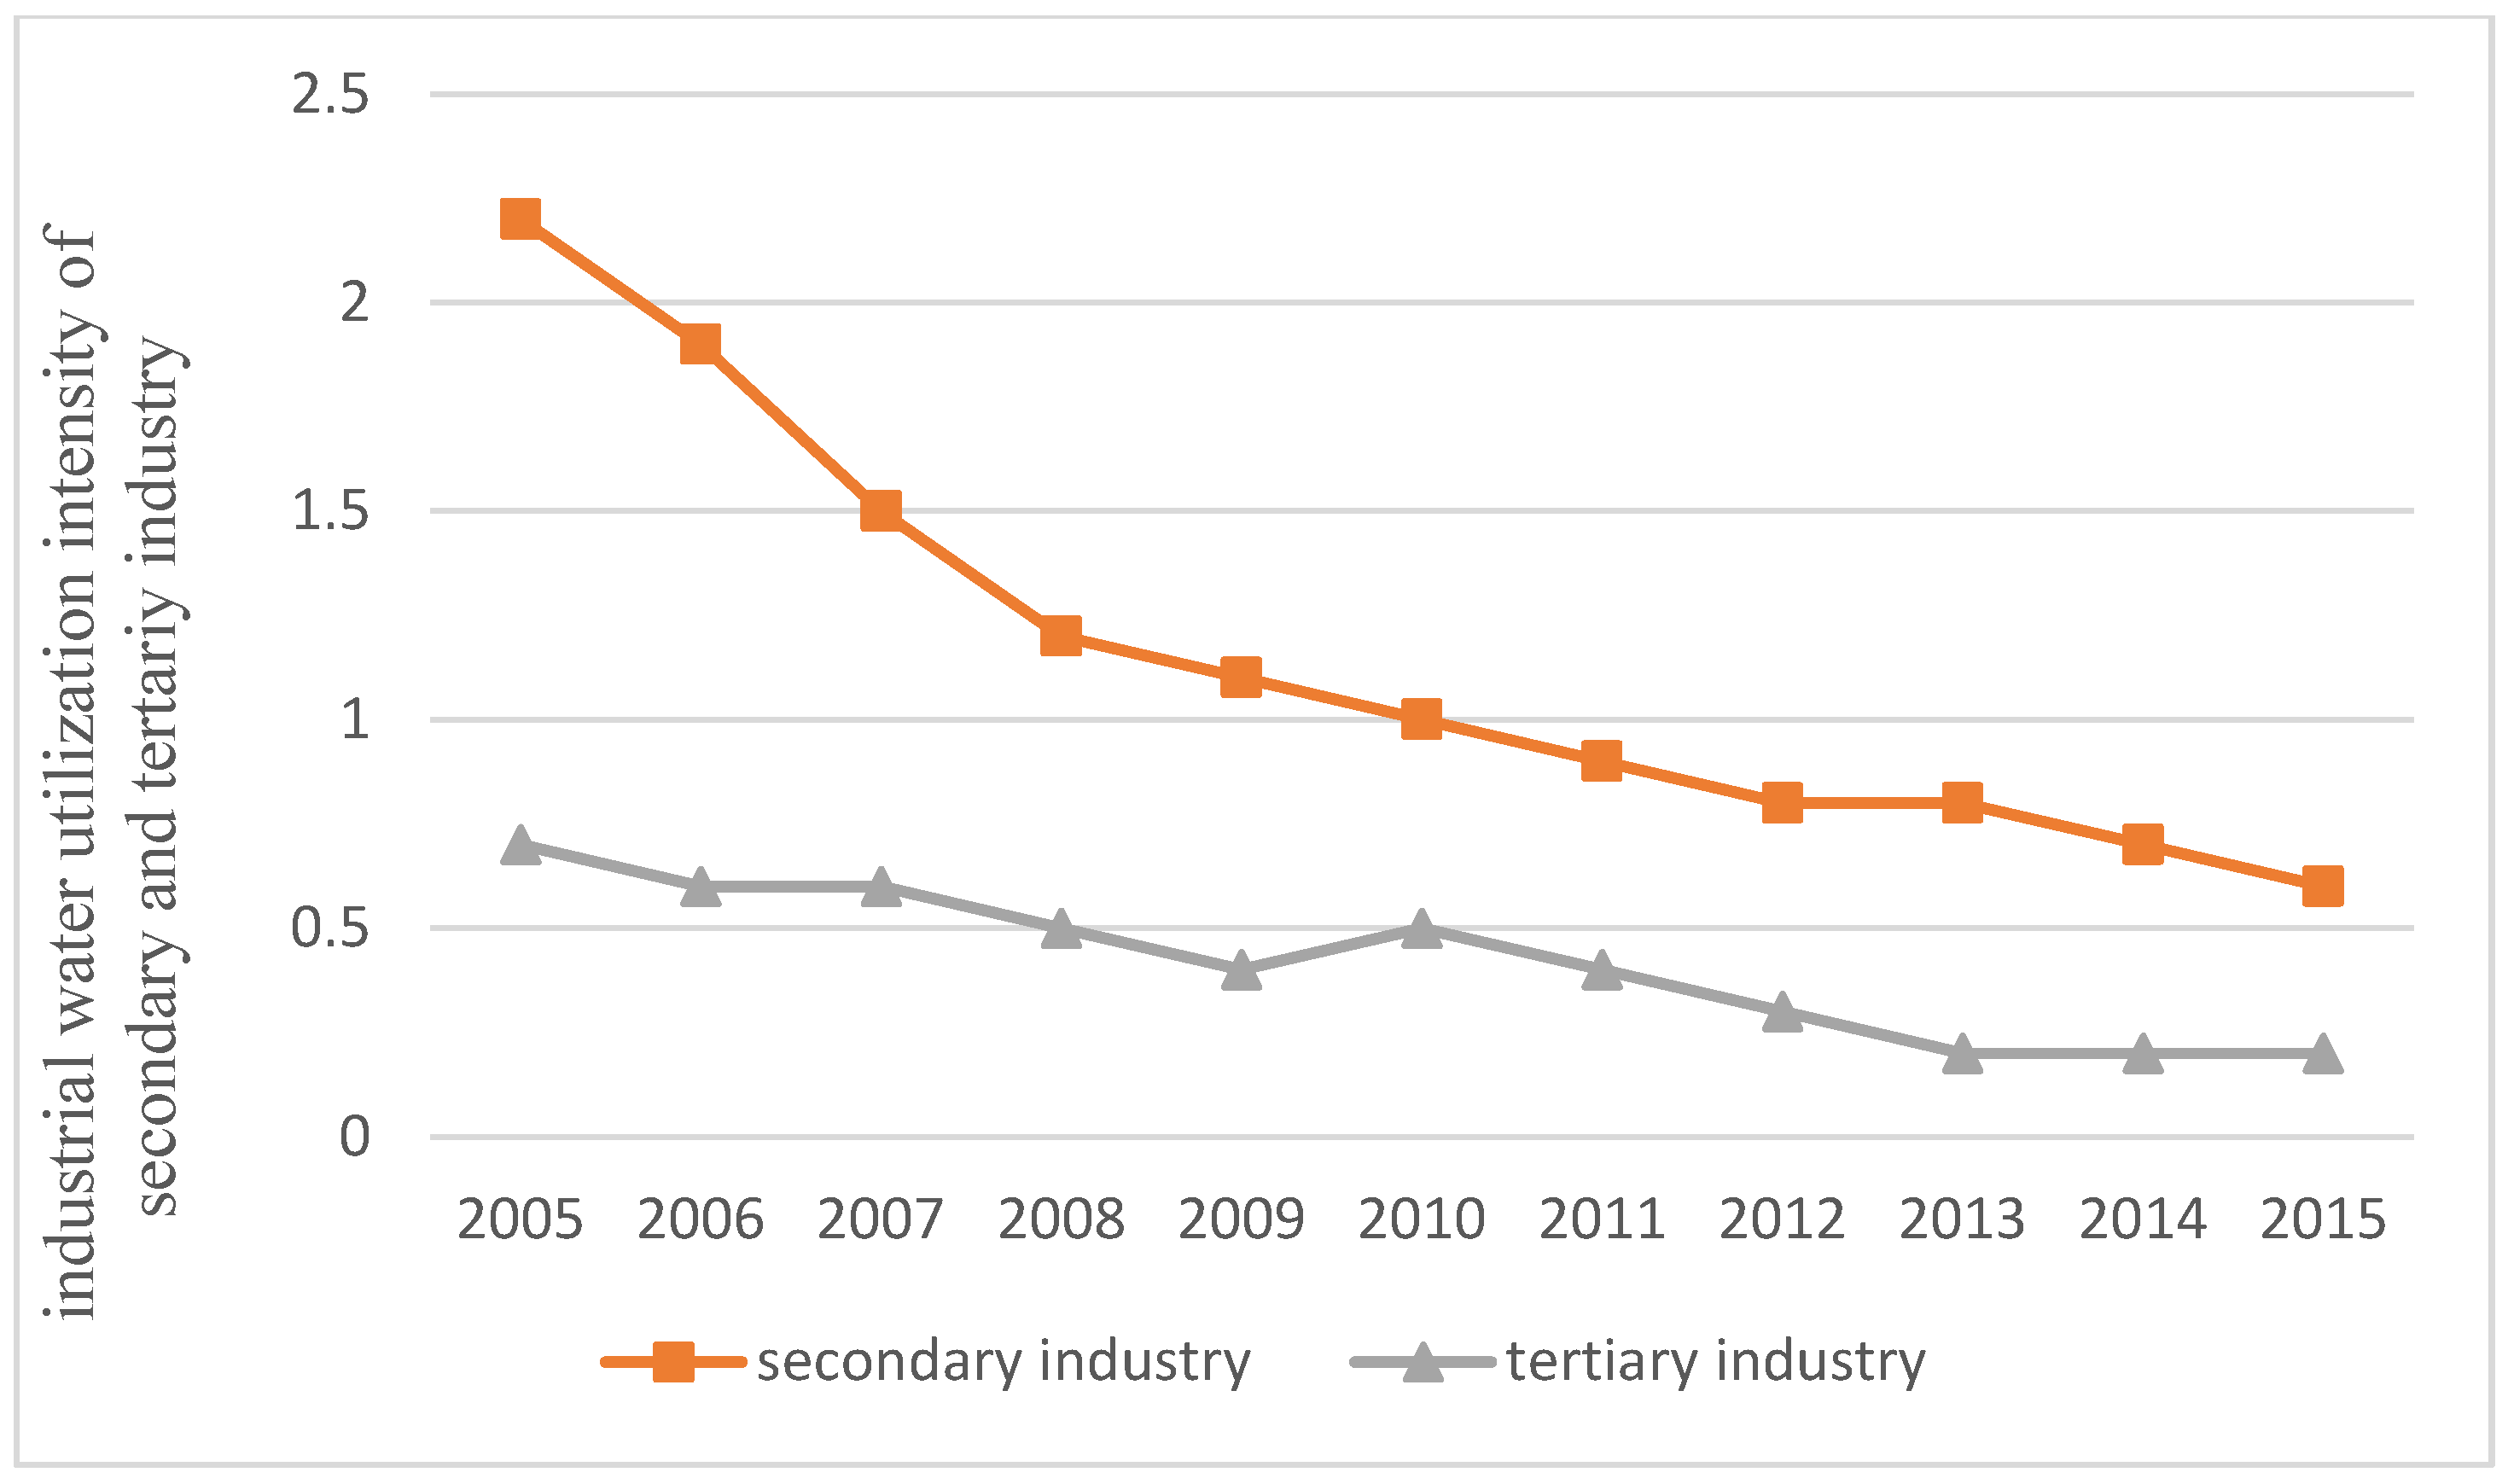
- The industrial water intensity effect steadily drove the decoupling of industrial water utilization from economic growth. During the study period, the industrial water utilization intensity of all three major industries decreased. However, the industrial water utilization intensity of primary industry remained high. Emphasizing reductions in the water utilization intensity of primary industry would help reduce the total volume of industrial water consumed.
- Strengthen the control of water utilization and improve the water resource utilization rate. It is important to target high water-consuming primary industries to implement water resources management practices that combine total quantity control and quota management. This would actively improve basic water supply facilities, treat wastewater and sewage and recycle reclaimed water using advanced technology and improve the efficiency of water resources utilization.
- Rapidly optimize the industrial structure and optimize water resource allocation. The changes in the industrial structure have a driving effect on economic growth and industrial water utilization decoupling. We recommend promoting industrial development from a low to high level, increasing the proportion of low water-consuming and high added value tertiary industries, such as financial services and foreign trade. We also recommend transforming economic development patterns and maximizing the construction of a water-saving society.
- Apply water-saving technology and reduce the intensity of industrial water utilization. Industrial water utilization intensity is an important factor driving the decoupling of industrial water utilization and economic growth. Decreasing the water utilization intensity means decreasing the water utilization per GDP. We also recommend improving the efficiency of agricultural irrigation, by adopting water-saving irrigation technologies such as sprinkler irrigation, micro irrigation and drip irrigation; developing and popularizing advanced technology of low water utilization and eliminating the capacity that does not meet standards.
Acknowledgments
Author Contributions
Conflicts of Interest
References
- The Organisation for Economic Co-operation and Development (OECD). OECD Environmental Indicators: Development, Measurement and Use; The Organisation for Economic Co-operation and Development: Paris, France, 2003. [Google Scholar]
- Toma, P.; Massari, S.; Miglietta, P.P. Life cycle approaches to sustainable regional development. In Life Cycle Approaches to Sustainable Regional Development; Massari, S., Sonnemann, G., Balkau, F., Eds.; Routledge, Taylor & Francis Group: New York, NY, USA, 2016; pp. 143–148. [Google Scholar]
- Vehmas, J.; Luukkanen, J.; Kaivo-Oja, J. Linking analyses and environmental Kuznets curves for aggregated material flows in the EU. J. Clean. Prod. 2007, 15, 1662–1673. [Google Scholar] [CrossRef]
- Tapio, P. Towards a theory of decoupling: Degrees of decoupling in the EU and the case of road traffic in Finland between 1970 and 2001. Transp. Policy 2005, 12, 137–151. [Google Scholar] [CrossRef]
- Wang, Q.; Chen, X. Energy policies for managing China’s carbon emission. Renew. Sustain. Energy Rev. 2015, 50, 470–479. [Google Scholar] [CrossRef]
- Conrad, E.; Cassar, L. Decoupling Economic Growth and Environmental Degradation: Reviewing Progress to Date in the Small Island State of Malta. Sustainability 2014, 6, 6729–6750. [Google Scholar] [CrossRef]
- Wei, S. Decoupling cultivated land loss by construction occupation from economic growth in Beijing. Habitat Int. 2014, 43, 198–205. [Google Scholar]
- Taiyang, Z.; XIanjin, H.; Baiyuan, W. Analysis of decoupling relationship between economic growth and construction land expansion. J. Nat. Resour. 2010, 1, 18–31. [Google Scholar]
- Schandl, H.; Hatfield-Dodds, S.; Wiedmann, T.; Geschke, A.; Cai, Y.; West, J.; Newth, D.; Baynes, T.; Lenzen, M.; Owen, A. Decoupling global environmental pressure and economic growth: Scenarios for energy use, materials use and carbon emissions. J. Clean. Prod. 2016, 132, 45–56. [Google Scholar] [CrossRef]
- Lamastra, L.; Miglietta, P.P.; Toma, P.; De, L.F.; Massari, S. Virtual water trade of agri-food products: Evidence from italian-chinese relations. Sci. Total Environ. 2017, 599–600, 474–482. [Google Scholar] [CrossRef] [PubMed]
- Naqvi, A.; Zwickl, K. Fifty shades of green: Revisiting decoupling by economic sectors and air pollutants. Ecol. Econ. 2017, 133, 111–126. [Google Scholar] [CrossRef]
- Wang, Q.; Li, R. Journey to burning half of global coal: Trajectory and drivers of China’s coal use. Renew. Sustain. Energy Rev. 2016, 58, 341–346. [Google Scholar] [CrossRef]
- Andreoni, V.; Galmarini, S. Decoupling economic growth from carbon dioxide emissions: A decomposition analysis of Italian energy consumption. Energy 2012, 44, 682–691. [Google Scholar] [CrossRef]
- Freitas, L.C.D.; Kaneko, S. Decomposing the decoupling of CO2 emissions and economic growth in Brazil. Ecol. Econ. 2011, 70, 1459–1469. [Google Scholar] [CrossRef]
- Longhofer, W.; Jorgenson, A. Decoupling reconsidered: Does world society integration influence the relationship between the environment and economic development? Soc. Sci. Res. 2017, 65, 17–29. [Google Scholar] [CrossRef] [PubMed]
- Roinioti, A.; Koroneos, C. The decomposition of CO2 emissions from energy use in Greece before and during the economic crisis and their decoupling from economic growth. Renew. Sustain. Energy Rev. 2017, 76, 448–459. [Google Scholar] [CrossRef]
- Lee, C.M.; Rosalez, E.R. Economic Growth, Carbon Abatement Technology and Decoupling Strategy—The Case of Taiwan. Aerosol Air Qual. Res. 2017, 17, 1549–1557. [Google Scholar] [CrossRef]
- Zhang, M.; Wang, W. Decouple indicators on the CO2 emission-economic growth linkage: The Jiangsu Province case. Ecol. Indic. 2013, 32, 239–244. [Google Scholar] [CrossRef]
- Zhou, X.; Zhang, M.; Zhou, M.; Zhou, M. A comparative study on decoupling relationship and influence factors between China’s regional economic development and industrial energy–related carbon emissions. J. Clean. Prod. 2016, 142, 783–800. [Google Scholar] [CrossRef]
- Wang, Q.; Chen, X.; Jha, A.N.; Rogers, H. Natural gas from shale formation—The evolution, evidences and challenges of shale gas revolution in United States. Renew. Sustain. Energy Rev. 2014, 30, 1–28. [Google Scholar] [CrossRef]
- Diakoulaki, D.; Mandaraka, M. Decomposition analysis for assessing the progress in decoupling industrial growth from CO2 emissions in the EU manufacturing sector. Energy Econ. 2007, 29, 636–664. [Google Scholar] [CrossRef]
- Lu, I.J.; Lin, S.J.; Lewis, C. Decomposition and decoupling effects of carbon dioxide emission from highway transportation in Taiwan, Germany, Japan and South Korea. Energy Policy 2007, 35, 3226–3235. [Google Scholar] [CrossRef]
- Zi, T.; Jie, S.; Shi, C.B.; Zheng, L.; Bi, K.X. Decoupling indicators of CO2 emissions from the tourism industry in China: 1990–2012. Ecol. Indic. 2014, 46, 390–397. [Google Scholar]
- Wang, Q.; Jiang, X.-T.; Li, R. Comparative decoupling analysis of energy-related carbon emission from electric output of electricity sector in Shandong Province, China. Energy 2017, 127, 78–88. [Google Scholar] [CrossRef]
- Zhu, H.L.; Pan, L.J.; Li, W.Y. Decoupling relationship between water use and economic development in yunnan and guizhou provinces during the first ten years of the great western development strategy. South-to-North Water Transf. Water Sci. Technol. 2013, 11, 1–5. [Google Scholar]
- Urama, K.C.; Bjørnsen, P.K.; Riegels, N.; Vairavamoorthy, K.; Herrick, J.; Kauppi, L.; Mcneely, J.A.; Mcglade, J.; Eboh, E.; Smith, M. UNEP IRP Report—Options for Decoupling Economic Growth from Water Use and Water Pollution—Factsheet; United Nations Environment Programme: Paris, France, 2016. [Google Scholar]
- Arto, I.; Andreoni, V.; Rueda-Cantuche, J.M. Global use of water resources: A multiregional analysis of water use, water footprint and water trade balance. Water Resour. Econ. 2016, 15, 1–14. [Google Scholar] [CrossRef]
- Paolo Miglietta, P.; De Leo, F.; Toma, P. Environmental Kuznets curve and the water footprint: An empirical analysis. Water Environ. J. 2017, 31, 20–30. [Google Scholar] [CrossRef]
- Miglietta, P.P.; Morrone, D.; Leo, F.D. The Water Footprint Assessment of Electricity Production: An Overview of the Economic-Water-Energy Nexus in Italy. Sustainability 2018, 10, 228. [Google Scholar] [CrossRef]
- Pellicer-Martínez, F.; Martínez-Paz, J.M. The Water Footprint as an indicator of environmental sustainability in water use at the river basin level. Sci. Total Environ. 2016, 571, 561–574. [Google Scholar] [CrossRef] [PubMed]
- Sallam, O.M. Water footprints as an indicator for the equitable utilization of shared water resources: (Case study: Egypt and Ethiopia shared water resources in Nile Basin). J. Afr. Earth Sci. 2014, 100, 645–655. [Google Scholar] [CrossRef]
- Achour, H.; Belloumi, M. Decomposing the influencing factors of energy consumption in Tunisian transportation sector using the LMDI method. Transp. Policy 2016, 52, 64–71. [Google Scholar] [CrossRef]
- Carmona, M.J.C.; Collado, R.R. LMDI decomposition analysis of energy consumption in Andalusia (Spain) during 2003–2012: The energy efficiency policy implications. Energy Effic. 2016, 9, 1–17. [Google Scholar]
- González, P.F.; Landajo, M.; Presno, M.J. Multilevel LMDI decomposition of changes in aggregate energy consumption. A cross country analysis in the EU-27. Energy Policy 2014, 68, 576–584. [Google Scholar] [CrossRef]
- Martínez, C.I.P.; Silveira, S. Energy Use in Manufacturing Industries Evidence from Sweden. 2013. Available online: https://link.springer.com/chapter/10.1007/978-3-642-37753-2_39 (accessed on 23 April 2018).
- Wang, Q.; Li, R. Drivers for energy consumption: A comparative analysis of China and India. Renew. Sustain. Energy Rev. 2016, 62, 954–962. [Google Scholar] [CrossRef]
- Cansino, J.M.; Sánchez-Braza, A.; Rodríguez-Arévalo, M.L. Driving forces of Spain’s CO2 emissions: A LMDI decomposition approach. Renew. Sustain. Energy Rev. 2015, 48, 749–759. [Google Scholar] [CrossRef]
- Mahony, T.O. Decomposition of Ireland’s carbon emissions from 1990 to 2010: An extended Kaya identity. Energy Policy 2013, 59, 573–581. [Google Scholar] [CrossRef]
- Moutinho, V.; Moreira, A.C.; Silva, P.M. The driving forces of change in energy-related CO2 emissions in Eastern, Western, Northern and Southern Europe: The LMDI approach to decomposition analysis. Renew. Sustain. Energy Rev. 2015, 50, 1485–1499. [Google Scholar] [CrossRef]
- Oh, I.; Wehrmeyer, W.; Mulugetta, Y. Decomposition analysis and mitigation strategies of CO emissions from energy consumption in South Korea. Energy Policy 2010, 38, 364–377. [Google Scholar] [CrossRef]
- Timilsina, G.R.; Shrestha, A. Factors affecting transport sector CO2 emissions growth in Latin American and Caribbean countries: An LMDI decomposition analysis. Int. J. Energy Res. 2009, 33, 396–414. [Google Scholar] [CrossRef]
- Wang, Q.; Li, R. Decline in China’s coal consumption: An evidence of peak coal or a temporary blip? Energy Policy 2017, 108, 696–701. [Google Scholar] [CrossRef]
- Zhao, C.; Chen, B. Driving force analysis of the agricultural water footprint in China based on the LMDI method. Environ. Sci. Technol. 2014, 48, 12723–12731. [Google Scholar] [CrossRef] [PubMed]
- Zhang, Y.F.; Yang, D.G.; Tang, H.; Liu, Y.X. Analyses of the changing process and influencing factors of water resource utilization in megalopolis of arid area. Water Resour. 2015, 42, 712–720. [Google Scholar] [CrossRef]
- Hoekstra, R.; van den Bergh, J.C.J.M. Comparing structural decomposition analysis and index. Energy Econ. 2003, 25, 39–64. [Google Scholar] [CrossRef]
- Ang, B.W. Decomposition analysis for policymaking in energy: Which is the preferred method? Energy Policy 2004, 32, 1131–1139. [Google Scholar] [CrossRef]
- Sun, J.W. Changes in energy consumption and energy intensity: A complete decomposition model. Energy Econ. 1998, 20, 85–100. [Google Scholar] [CrossRef]
- Kaya, Y. Impact of Carbon Dioxide Emission Control on GNP Growth: Interpretation of Proposed Scenarios; IPCC Energy and Industry Subgroup, Response strategies Working Group: IPCC: Paris, France, 1990. [Google Scholar]
- Tianjin Water Authority. Tianjin Water Resources Bulletin; Tianjin Water Auhtority: Tianjin, China, 2005–2015. [Google Scholar]
- Tianjin Bureau of Statistics. Tianjin Statistical Yearbook 2016; China Statistics Press: Beijing, China, 2016. [Google Scholar]


| Decoupling State | Elasticity | |||
|---|---|---|---|---|
| decoupling | Strong decoupling | <0 | >0 | e < 0 |
| Weak decoupling | >0 | >0 | 0 < e < 0.8 | |
| Recessive decoupling | <0 | <0 | e > 1.2 | |
| Negative decoupling | Expansive negative decoupling | >0 | >0 | e > 1.2 |
| Strong negative decoupling | >0 | <0 | e < 0 | |
| Weak negative decoupling | <0 | <0 | 0 < e < 0.8 | |
| coupling | Expansive coupling | >0 | >0 | 0.8 < e < 1.2 |
| Recessive coupling | <0 | <0 | 0.8 < e < 1.2 | |
| Years | Decoupling | |||
|---|---|---|---|---|
| 2005–2006 | −0.10 | 0.60 | −0.1605 | Strong decoupling |
| 2006–2007 | 0.17 | 0.73 | 0.2322 | Weak decoupling |
| 2007–2008 | −0.54 | 0.89 | −0.6109 | Strong decoupling |
| 2008–2009 | 0.18 | 1.04 | 0.1711 | Weak decoupling |
| 2009–2010 | −0.59 | 1.28 | −0.4603 | Strong decoupling |
| 2010–2011 | 0.33 | 1.44 | 0.2318 | Weak decoupling |
| 2011–2012 | −0.11 | 1.41 | −0.0780 | Strong decoupling |
| 2012–2013 | 0.54 | 1.44 | 0.3736 | Weak decoupling |
| 2013–2014 | −0.42 | 1.29 | −0.3226 | Strong decoupling |
| 2014–2015 | 0.41 | 1.32 | 0.3093 | Weak decoupling |
| Year | Primary Industry | Secondary Industry | Tertiary Industry | |||
|---|---|---|---|---|---|---|
| e1 | Decoupling | e2 | Decoupling | e3 | Decoupling | |
| 2005–2006 | −0.0338 | Strong decoupling | −0.0056 | Strong decoupling | 0.0055 | Weak decoupling |
| 2006–2007 | 0.2637 | Weak decoupling | −0.0220 | Strong decoupling | 0.0544 | Weak decoupling |
| 2007–2008 | −0.1910 | Strong decoupling | −0.0375 | Strong decoupling | 0.0439 | Weak decoupling |
| 2008–2009 | −0.0296 | Strong decoupling | 0.0588 | Weak decoupling | −0.0341 | Strong decoupling |
| 2009–2010 | −0.4075 | Strong decoupling | 0.0361 | Weak decoupling | 0.1253 | Weak decoupling |
| 2010–2011 | 0.1135 | Weak decoupling | 0.0259 | Weak decoupling | −0.0858 | Strong decoupling |
| 2011–2012 | −0.0254 | Strong decoupling | 0.0120 | Weak decoupling | −0.1305 | Strong decoupling |
| 2012–2013 | 0.1441 | Weak decoupling | 0.0463 | Weak decoupling | 0.0298 | Weak decoupling |
| 2013–2014 | −0.1930 | Strong decoupling | −0.0024 | Strong decoupling | 0.0524 | Strong decoupling |
| 2014–2015 | 0.2507 | Weak decoupling | −0.0104 | Strong decoupling | 0.0204 | Weak decoupling |
| Year | e(H,S) | e(H,T) | e(H,g) | e(H,P) | e(H,G) |
|---|---|---|---|---|---|
| 2005–2006 | −1.1045 | −1.2000 | 1.6725 | 0.4716 | −0.1605 |
| 2006–2007 | −1.1916 | −0.4454 | 1.3960 | 0.4731 | 0.2322 |
| 2007–2008 | −0.8713 | −1.3180 | 1.0277 | 0.5508 | −0.6109 |
| 2008–2009 | −0.7098 | −0.4469 | 0.9515 | 0.3763 | 0.1711 |
| 2009–2010 | −0.5578 | −1.0126 | 0.7196 | 0.3877 | −0.4630 |
| 2010–2011 | −0.4342 | −0.2674 | 0.6808 | 0.2527 | 0.2318 |
| 2011–2012 | −0.3946 | −0.5036 | 0.5554 | 0.2647 | −0.0780 |
| 2012–2013 | −0.3289 | −0.0392 | 0.4844 | 0.2573 | 0.3736 |
| 2013–2014 | −0.3010 | −0.6928 | 0.4613 | 0.2099 | −0.3226 |
| 2014–2015 | −0.2838 | −0.0188 | 0.4762 | 0.1356 | 0.3093 |
© 2018 by the authors. Licensee MDPI, Basel, Switzerland. This article is an open access article distributed under the terms and conditions of the Creative Commons Attribution (CC BY) license (http://creativecommons.org/licenses/by/4.0/).
Share and Cite
Wang, S.; Li, R. Toward the Coordinated Sustainable Development of Urban Water Resource Use and Economic Growth: An Empirical Analysis of Tianjin City, China. Sustainability 2018, 10, 1323. https://doi.org/10.3390/su10051323
Wang S, Li R. Toward the Coordinated Sustainable Development of Urban Water Resource Use and Economic Growth: An Empirical Analysis of Tianjin City, China. Sustainability. 2018; 10(5):1323. https://doi.org/10.3390/su10051323
Chicago/Turabian StyleWang, Shasha, and Rongrong Li. 2018. "Toward the Coordinated Sustainable Development of Urban Water Resource Use and Economic Growth: An Empirical Analysis of Tianjin City, China" Sustainability 10, no. 5: 1323. https://doi.org/10.3390/su10051323