Better Understanding the Characteristics and Influential Factors of Different Travel Patterns in Free-Floating Bike Sharing: Evidence from Nanjing, China

School of Transportation, Southeast University, Nanjing 211189, China
*
Author to whom correspondence should be addressed.
Sustainability 2018, 10(4), 1244; https://doi.org/10.3390/su10041244
Submission received: 21 March 2018
/
Revised: 7 April 2018
/
Accepted: 16 April 2018
/
Published: 18 April 2018
(This article belongs to the Section Sustainable Transportation)
Abstract
:In recent years, free-floating bike sharing (FFBS) has become a significant travel mode to satisfy urban residents’ travel demands in China. This paper was designed to better understand the characteristics and influential factors of different travel patterns in FFBS. Firstly, travel patterns were divided into three categories: Origin to Destination Pattern (ODP), Travel Cycle Pattern (TCP) and Transfer Pattern (TP). Then, the characteristics of these patterns were analyzed based on a survey of 4939 valid questionnaires in Nanjing, China. A multinomial logit (MNL) model was established to explore the influential factors associated with the three patterns. The results showed the following. (1) Employees and students were more inclined to choose TP and ODP, and the selection probability of employees was larger than that of students. (2) The evening peak was more significant than the morning peak. (3) Residents with short travel distances were more likely to choose TCP and ODP, and when the travel distance reached 4 km, there was a significant transfer to TP. (4) Price had an impact on residents’ travel patterns, with residents showing an inclination toward FFBS when making short distance trips, if they were quickly found. Malfunctioning bicycles were an important factor restricting FFBS development. Several policy recommendations are proposed based on these results, for government and FFBS businesses to improve their management of FFBS systems.
1. Introduction
In recent years, urban public transport policy has increased its attention toward convenience, sustainability and energy savings [1]. With the rapid development of internet technology and mobile payments, free-floating bike sharing (FFBS) began to appear in China in March 2016. FFBS is a new mode of bicycle operation, offering rapid and flexible mobility for one-way, round, or short trips. It also serves as a feeder for other modes of public transport, improving the accessibility and connectivity and reducing the travel time [2,3]. Additionally, it has other advantages, for example, FFBS bicycles can be found and parked at any available place as they have inbuilt global positioning system (GPS) devices to prevent theft. All of these factors have led to FFBS becoming particularly prevalent in China. As of July 2017, approximately 16 million FFBS bicycles have been put to market. With regard to travel demand, the quantity of users in China has reached 106 million, accounting for 14.11% of total internet users. However, owing to the fact that FFBS is a new type of travel mode, government and businesses may encounter difficulties due to the lack the corresponding management experience and policies [4]. Firstly, there is often unequal supply and demand; FFBS bicycles enter a city center in large quantities, but they are not easily found in other areas. Secondly, there are substantial numbers of disused FFBS bicycles in the city, which not only occupy urban space resources, but also affect other travel modes. Thirdly, for places with larger FFBS demand, such as subway stations, central business districts and residential areas, it is difficult for users to pick up FFBS bicycles during peak hours. Finally, a discrepant charge strategy according to travel distance or riding time is not being implemented, which reduces the usage frequency of temporary users. Given the rapid evolution of FFBS in China, it is fast becoming a sustainable and viable mode of urban public transport. Previous studies have mainly concentrated on public bicycles; however, very little work has been conducted regarding FFBS. The success of public bike systems depends on how user demand is satisfied and identifying the factors that drive this demand [5]. Compared with public bicycles, FFBS bicycles are not only different in terms of user demand, but also in terms of operating mode. The travel characteristics of FFBS and public preference for this mode of travel are still not well understood. In the face of this newly developed travel mode, corresponding policies have not yet been formulated by government and businesses.
In order to improve the user satisfaction and loyalty toward FFBS, the objective of this research was to explore the travel patterns and influential factors associated with FFBS usage in China, taking Nanjing city as an example. This research contributes to the past literature in three major ways. Primarily, we investigate the characteristics of FFBS usage across three separate travel patterns: Origin to Destination Pattern (ODP), Travel Cycle Pattern (TCP) and Transfer Pattern (TP). In a single FFBS travel episode, if the origin and destination are same, the pattern belongs to TCP; if the user uses FFBS to reach the destination directly, it belongs to ODP; and if there is a transfer between FFBS and other travel modes, it belongs to TP. Secondly, we use a multinomial logit (MNL) model to quantify the impact of various variables on travel pattern choice in the FFBS system. Lastly, we provide new evidence from Nanjing that will compensate for the limited research in this field in other cities in China. This is beneficial for the government to put forward corresponding intervention policies and strategies and will allow FFBS operators to plan their services more effectively.
The remainder of the paper is organized as follows. A literature review of public bicycles is provided in Section 2. Section 3 describes the survey data and method. The survey results and travel characteristics of different travel patterns are presented in Section 4. Section 5 describes the model results and discussion. Finally, Section 6 summarizes the study limitations and gives several policy suggestions for promoting the development of FFBS.
2. Literature Review
Because FFBS is a new travel mode combining internet technology and bicycles, relevant research is limited and focuses more on public bicycles, which are similar to FFBS. However, past studies support a future of FFBS in China. In our literature review, we concentrate predominantly on research regarding the characteristics and influential factors associated with public bicycle systems, based on three perspectives: user characteristics, travel characteristics, and user preferences.
Exploring user characteristics of public bicycles is necessary to understand their travel demands and improve their loyalty. Important attributes related to the choice to use public bicycles are gender, age, income, car ownership, and socio-economic class [6]. In the case of gender, the majority of the literature has concluded that male users are more prevalent than female users. For instance, as for the users of public bicycle, the proportion of male users in Melbourne is 76.6%, the proportion in Brisbane is 59.8% [7], the proportion in Montreal is 58% [8] and the proportion in Washington is 57% [9]. One reason for this is that men prefer cycling [10]. Another reason is that women are more likely to work close to where they live [11]. On the contrary, studies have also found that female riders are more prevalent in areas with higher levels of regular riding [12]. In terms of age and education level, FFBS users are likely to be younger and more educated. For example, Zhang [13] found that 86.5% of users were 20–50 years old in a survey of the peripheral urban area of Beijing, and that 91.2% of users had an education level greater than higher school. Vogel [10] et al. identified that the 18–49 age group represented 80% of total subscribers and active users in Vélo’v, Lyon. In Washington’s Capital Bikeshare program, 95% of users possessed a four-year college degree, with 56% holding advanced degrees [8]. As for the relationship between income and travel demand, Stinson et al. and Dill et al. [14,15] found that the people with a higher income were more willing to ride bicycles. This is consistent with research from England and Wales that has also shown people with a lower income are less likely to cycle to work [6]. In contrast, Zhang [13] and Liu [16] concluded that people with a lower income are more willing to use public bicycles in China. In addition, Moudon [17] et al. found that people who preferred using bicycles also preferred using public transport in general, and they also enjoyed sports, had strong outdoor preferences, and tended to live in urban areas, near bus stops and near shopping facilities.
The travel characteristics of public bicycles are of great importance to public bicycle travel prediction and station planning. Currently, scholars mainly focus on travel time, travel distance, and travel purpose and other dimensions [8]. Travel time characteristics associated with public bicycles vary from city to city. In general, there is a morning peak and an evening peak in passenger flow [18,19]. A Shanghai study showed that passenger flow in the morning peak was approximately two times than that of the evening peak [20]; however, research related to the BIXI public bicycle system in Montreal found the opposite to be true [21]. A Brisbane study found that the use of public bicycles reduced on weekends [22]; however, on the contrary, O’Brien et al. [23] showed that there was no remarkable difference in the passenger flow of the Washington public bike system between weekdays and weekends. Additionally, travel distance is an important characteristic associated with public bicycle travel. Studies have shown that the acceptable travel distance for public bicycle transport is between 1 km and 5 km [24], the average travel distance of bicycle users is about 3.7 km [25] and the critical travel time for cycling is 24 min [26]. The majority of travelers will choose other public transport options if their travel distance is more than 3.5 km [27]. Increased travel time results in more physical energy consumption and reduces the number of users [28]. However, when the purpose of cycling is for leisure and physical exercise, the travel distance will exceed this critical value. Dill et al. [29] concluded that the average distance when cycling for physical exercise is 14 km. Comprehending the travel purpose can help us to better understand the travel demand and the distribution of rental stations, which is crucial information when planning a public bicycle system. Several surveys have shown that commute and attending school are the main travel purpose for bike sharing users, followed by social entertainment and errands [10,30,31]. Tang et al. [32] found that approximately 45% of respondents in Beijing and more than half of the respondents in Shanghai used public bicycles for commuting; however, commuting rates in Hangzhou were only 23%, which may be because Hangzhou is a tourist city and the travel purposes of public bicycles are more diversified [33].
Studying the influence of user preferences on public bicycle usage is not only useful to evaluate bicycle rental stations, but it can also help to reduce operation costs and improve user experience. Among preference factors, convenience is considered to be the main cause of the use of public bicycles [34]. London-based investigations into the Melbourne and Brisbane public bicycle systems showed that the main benefit of public bicycles is the improvement of convenience [7]. Bachand–Marleau et al. [8] found that the probability of using a public bicycle increased threefold if the user lived within a 500 m range of a station. Research in China identified that 60~70% of respondents believed that using public bicycles was more convenient than private bicycles [32]. In addition to convenience, factors such as land use, bicycle infrastructure, and user perception also affect the use of public bicycles [35]. Manaugh et al. [1] analyzed the influence of different bike sharing stations (residential buildings, commercial buildings, parks, schools and subway stations) and identified that shared bicycle usage was greater when stations were near commercial buildings than when they were near residential buildings, and that people were three to five times more likely to use shared bicycles when stations were near parks compared to schools or subway stations. Bachand–Marleau et al. [8] explored the factors influencing bicycle use in Australia and the UK. Their results showed that private bicycles are hard to park and easily stolen, whereas the convenience and public facilities associated with bicycle sharing are the main reasons why users choose it over private bicycles. Yang et al. [36] established a binary logit model based on 520 questionnaires, to explore the factors influencing users’ willingness to adopt bike sharing. The model showed that environmental responsibility, public transport improvement, and attention-to-health had a positive impact, while consciousness of environmental crisis had a negative impact. In addition to this, temperature, humidity, wind, rain, snow and other meteorological factors also have different degrees of impact on public bicycle travel. In particular, studies have shown that there is a positive correlation between temperature and public bicycle passenger flow; whereas, humidity, rain and snow are negatively related to passenger flow [21,37,38].
As is evident from the above review, there is abundant research regarding the travel behaviors of public bicycle users, which provides the basis for research into FFBS. FFBS has only recently emerged in China and is still a relatively new travel mode. Compared with the public bicycle, there are four significant differences in FFBS: (1) FFBS is not limited by a rental station; users can easily pick up and return the bicycle from anywhere. (2) The users of FFBS are more likely to be mobile internet users, while public bicycle users are more likely to be residents with a local, registered, permanent residence, who hold public bicycle cards. (3) FFBS is a private, entrepreneurial, venture capital project, while public bicycles tend to be funded or invested in by the government, so their operational management models are not the same. (4) FFBS bicycles have a GPS device, which is convenient for seasonable redistribution and monitoring the maintenance and malfunction of the bicycles. In summary, the characteristics and management models of FFBS are inconsistent with public bicycles, and consequently, the factors influencing their usage are not necessarily the same. The development planning of FFBS cannot completely replicate the models of other public bicycle schemes. To our knowledge, there is little research available regarding FFBS. In order to provide users with better services and greater user satisfaction, it is necessary to comprehend the travel characteristics and influential factors affecting travel patterns in FFBS systems.
3. Data and Method
3.1. City Context
Nanjing, China, was chosen as an example city for this study, owing to its rapid traffic development. As an important central city in the eastern part of China, Nanjing is an important, comprehensive transportation hub, and research and education center. In addition, the development of FFBS in Nanjing is far ahead of other cities. These factors are important for providing new evidence and a greater understanding on the characteristics and influential factors of FFBS use in mainland China.
3.2. Survey Design
The survey was designed to explore the travel characteristics and influential factors associated with different FFBS travel patterns. We introduced a novel preference pivoting design that allowed for quality data collection using an online survey. When the respondent completed the questionnaire, they received a reward. There were three parts to the questionnaire: (1) User basic attributes: gender, age, level of education, occupation, and monthly income. (2) Travel information: travel purpose, riding duration, time period of travel, travel distance, frequency of FFBS use, and whether FFBS was used for transfer; and (3) User preferences: cheap fare, FFBS is easy to find, FFBS is convenient to park, FFBS is convenient for leisure and exercise, the FFBS station should be set up, FFBS can enrich travel mode, FFBS can improve bus/subway connections, the impact of malfunctioning vehicles, and so on.
3.3. Data Source
The survey was conducted in Nanjing, China (as shown in Figure 1), using online questionnaire and single-interview pen-and-paper survey methods. The online questionnaire was conducted by graduate students at the School of Transportation, Southeast University, using social software, such as WeChat and QQ, and the period of investigation lasted from 9 October 2017 to 22 October 2017. The pen-and-paper survey was mainly conducted in major metro stations, commercial areas, bus stops, residential areas, schools and parks, and the period of investigation was from 16 October 2017 to 22 October 2017. For the survey, first of all, the respondent answered whether he/she usually uses FFBS. For part one of the questionnaire, the respondent filled in personal basic information, then, in part two of the questionnaire, the respondent gave the complete travel chain for a single trip, such as home to supermarket to home, home to school, or home to subway station. It was possible to identify travel patterns indirectly from travel chains, for example, home-supermarket-home would be classed as TCP, home-school would be ODP, and home-subway station would be TP. The question, “whether to use FFBS for transfer”, was added to test the correctness of the identified travel pattern. A total of 5372 questionnaires were given to respondents (online questionnaire: 4572; pen-and-paper questionnaire: 800). A total of 4939 valid questionnaires were collected back (online questionnaire: 4180; pen-and-paper questionnaire: 759). The valid questionnaire recovery rate was 91.94%.
3.4. Method
Multinomial logit (MNL) models are often used in studies with multiple choice problems [39]. The model is based on the assumption that fixed items are independent of random items and random items obey the assumption of a Gumel distribution, with independent and identically distributed characteristics.
In this study, it was assumed that Uin was the utility value of the user, n, who chose the travel pattern, i. Cn was the set of travel patterns, Cn = {ODP, TCP, TP}, i ∈ Cn, and Uin = Vin + εin. The probability of a user, n, choosing pattern i was given as [39,40]:
where εin was the error term.
The utility function Vin was related to basic attributes, travel information, and users’ attitudes and perceptions. It was assumed that Vin was a linear function of these variables, and the utility of user, n, choosing pattern, i, was given as:
where βk was the parameter estimated by the maximum likelihood method.
4. Survey Results
The survey was conducted over a two-week period in October 2017. Some respondents declined to provide personal information about age and income. After removing samples with missing demographics and questionable information, a total of 4939 valid questionnaires were analyzed.
4.1. Respondent Attributes
As shown in Table 1, the male and female ratios of FFBS users were 53.19% and 46.81%, respectively. This indicates that FFBS usage was higher for male than for female respondents, but this difference was not large. This finding is consistent with the user characteristics of public bicycles [8]. In terms of age, the majority of participants who used FFBS were aged 19–40 (71.61%). These users were mainly college students and employees, and FFBS use was relatively prevalent among them because of the convenience of pick-up and parking and their fixed commuting and schooling demands. As for the educational level of respondents, undergraduate students were the main user group. This finding is consistent with the high level of education found among public bike users in Zhang et al. [13]. This part of the population is more aware of mobile payment systems and is more likely to accept and learn new things. With regard to occupation, the majority of respondents were students and employees, accounting for 76.29% of the total sample. This is in line with the results of a North American city survey, which found that public bicycles were mainly used for commuting to work and school [31]. At the same time, this aligns with Chinese research, which also found that the main purpose of public bicycles in Shanghai and Nanjing was to commute to work and school [32]. Furthermore, the income distribution of respondents was predominantly less than 5000CNY per month. This segment of people likely cannot afford to purchase cars in the short term.
4.2. Travel Patterns and Characteristics
4.2.1. Travel Patterns Associated with FFBS
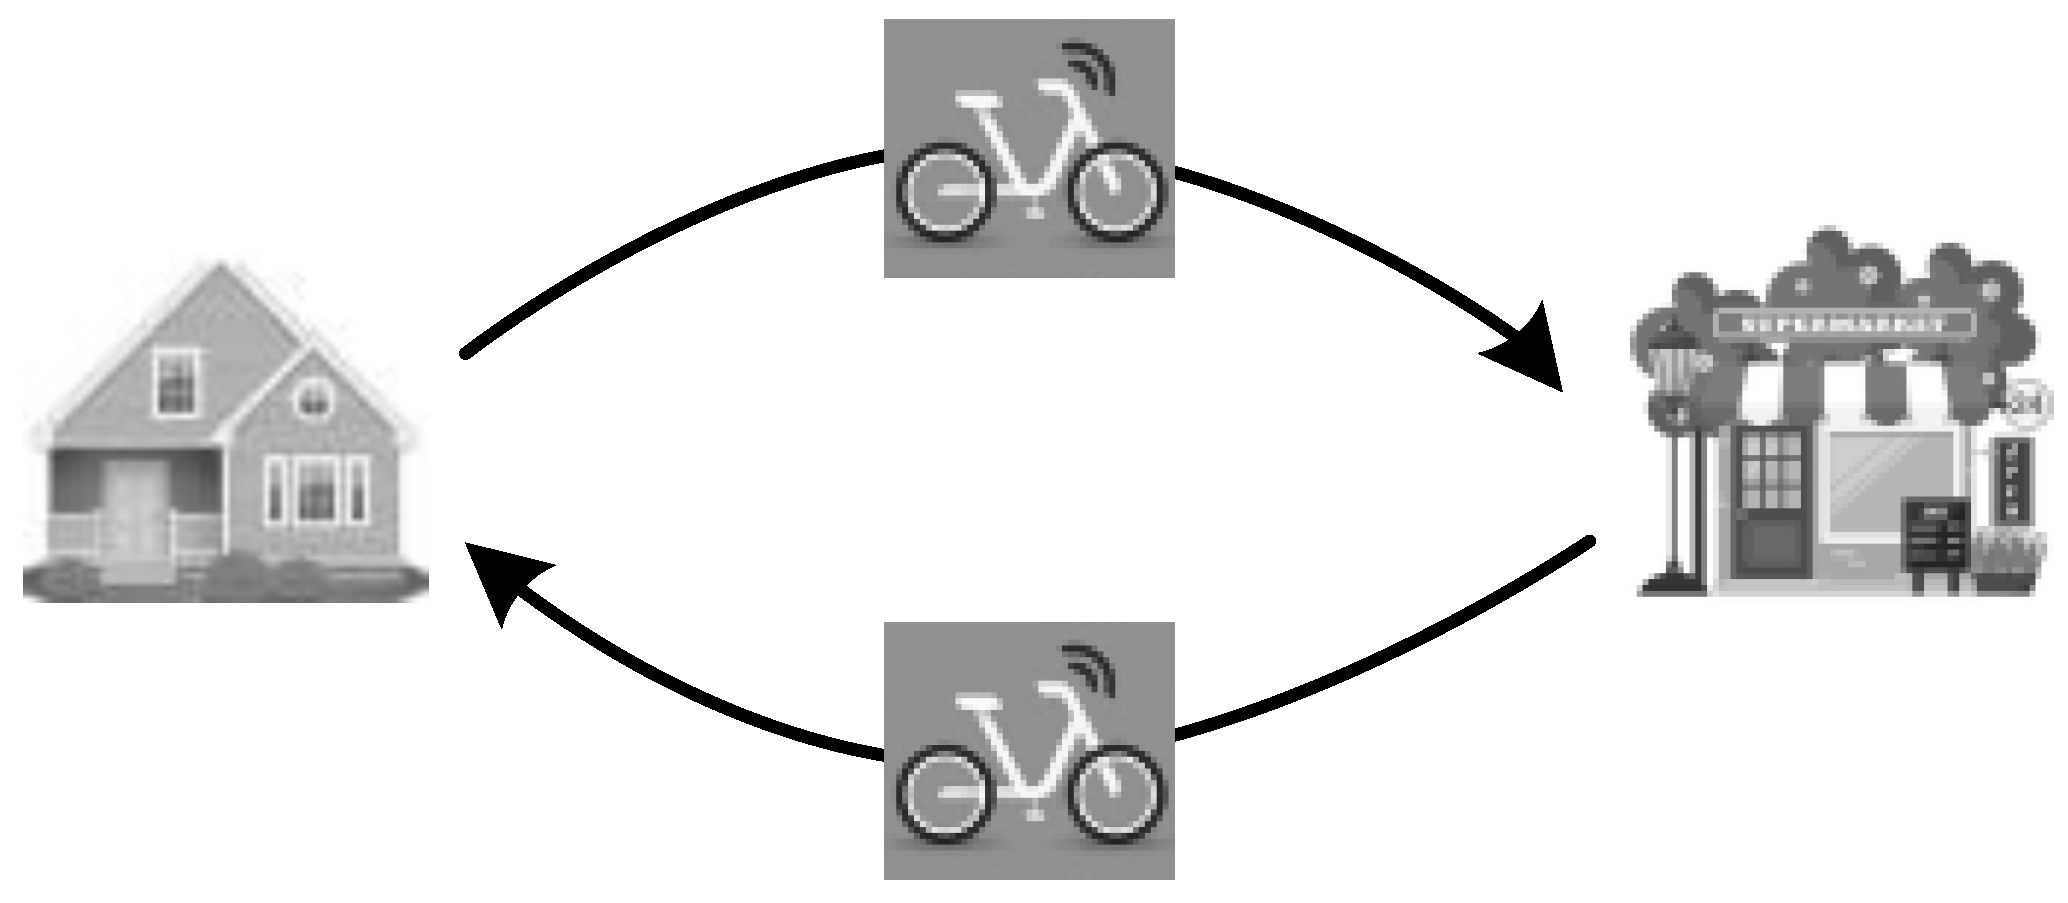
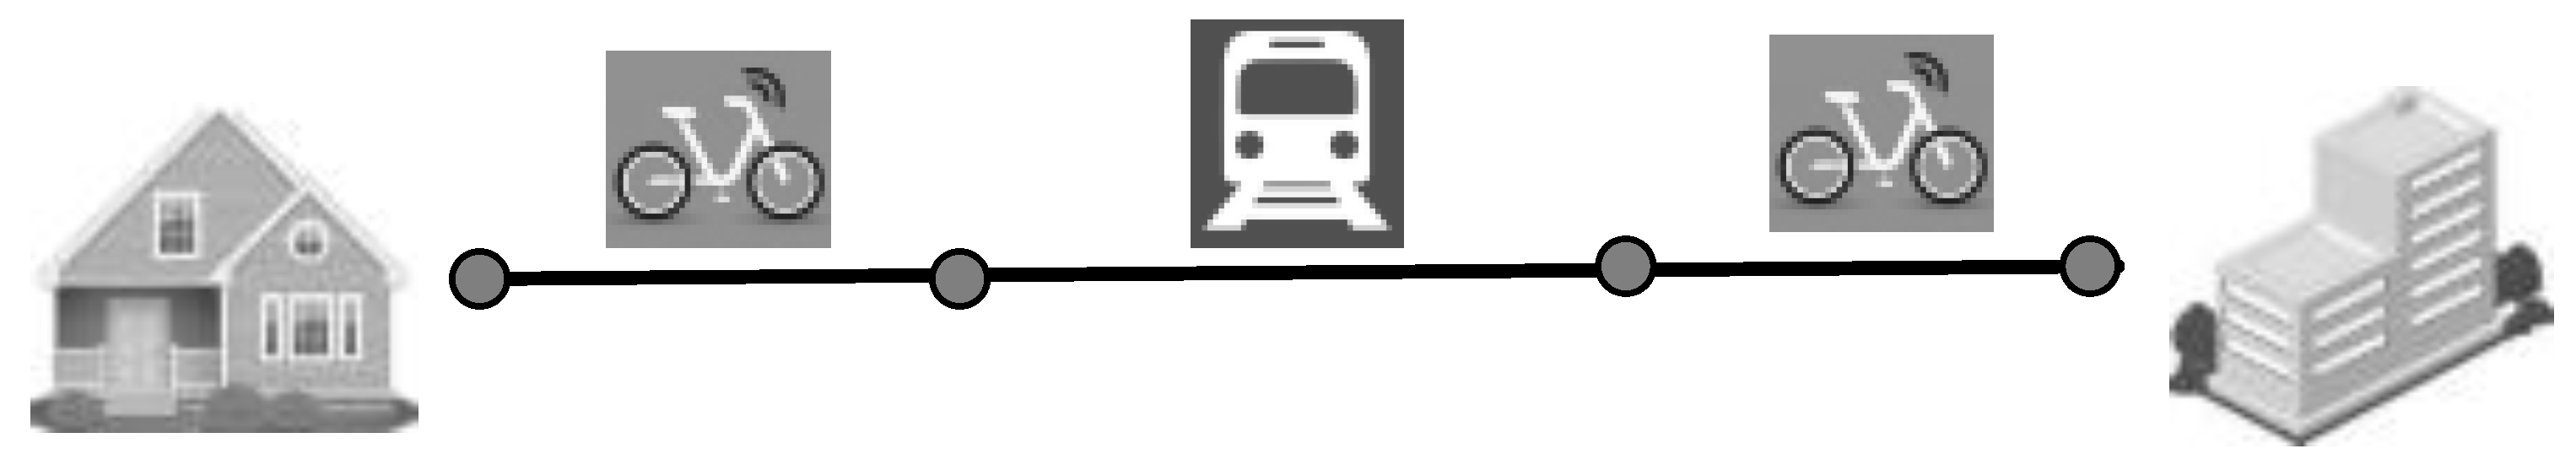
Through statistical analysis of the questionnaire, the main users of FFBS bicycles were work commuters (38.49%) and school students (37.80%). About 40% of users’ riding duration was 10–20 min. The time period of travel was mainly concentrated to morning and evening peaks, similar to the peak time of urban traffic. The origin to destination pattern (38.40%), travel cycle pattern (10.47%) and transfer pattern (51.13%) are the three main travel patterns in FFBS systems. As is shown in Figure 2, ODP is defined as the user going from a start point to their destination, directly, using FFBS. This travel pattern mainly solves the problem of the short-distance travel. As shown in Figure 3, TCP refers to the user starting from their origin, going to their destination and then returning to their origin by cycling after he/she has completed their activity. This pattern is usually associated with short-distance, quick and occasional trips, such as shopping or temporary office business. As presented in Figure 4, TP refers to travelers using FFBS to go from their origin to a transfer center, to use the subway or bus. In some instances, they may use FFBS again to reach their destination when they get off. This pattern mainly mitigates the problem of the “first kilometer” or “last kilometer”.
4.2.2. Characteristics of Different Travel Patterns
In order to comprehend the travel characteristics of the three travel patterns, the travel purpose, travel duration and time period of travel were analyzed, as reflected in Table 2.
In terms of travel purpose, ODP was mainly used for commuting to work, attending school, and shopping and entertainment. In particular, most users who enjoyed physical exercise would select ODP, which illustrates how ODP contributes to health. TCP was primarily used for shopping and entertainment, and business. This implies that FFBS is mainly used for activities where people do not need to stay at the destination for a long time. TP was mainly used to commute to work; a pattern more suitable for long distance travel.
As for riding duration, users’ riding time was mostly concentrated within the 5–30 min range for ODP, with 39.48% of riding times falling in the 10–20 min range. The cycle time for TCP was mainly within 10 min, due to this travel pattern being predominantly associated with occasional, short-trip demand. For TP, riding time was mainly concentrated within the 5–20 min range (67.33%), which was slightly shorter than for ODP, indicating that TP travelers usually ride to nearby subway stations for transfer.
For time period of travel, the travel peak for FFBS and passenger flow was higher during the morning peak than the evening peak. The time period of travel of ODP was mainly focused on the morning and evening peaks. This is in line with the results for pattern of use being mainly for commuting to work, attending school, and shopping and entertainment. The time period of travel for TCP was more scattered. For TP, the time period of travel was mainly 6:00~8:00, 8:00~11:00, and 17:00~19:00. During this period of time, commuters use FFBS for transfer purposes, which illustrates that FFBS has an important role in the “first kilometer” and “last kilometer”.
5. Model Results and Discussion
5.1. Model Results
Different travel patterns were associated with different influential factors, basic attributes, travel information and preferences. Before the multinomial logit (MNL) model was built, these variables were calibrated, as shown in Table 3.
The survey data were used to build the MNL model. ODP, TCP and TP were represented by 0, 1, and 2 and the reference category was ODP. All the independent variables were selected with an introducing probability of 0.05 and rejecting probability of 0.1. The independent variables and results of significance tests are listed in Table 4. The McFadden coefficient was 0.592 (more than 0.2), Nagelkerke R Square was 0.801, Cox and Snell was 0.435, and Chi-square was 137. These were all within an acceptable range.
5.2. Discussion
As presented in Table 4, as for the occupation variable, student or employee had a significant effect on travel pattern choice. For TCP, the utility of occupation was negative, with a high significance level. On the contrary, the utility of occupation was slightly positive for TP, compared to ODP. This suggests that commuters and students had a tendency towards TP and ODP rather than TCP, which coincides with the results in Section 4.2. Additionally, the disutility of employees was approximately twice as high as students, which indicates that employees were more likely to choose TP and ODP than students.
In terms of riding duration, positive utility for TCP and TP was observed within 10 min; however, the probability of choosing TCP decreased as riding time increased. This illustrates that users were more inclined to select TCP and TP when the riding time was short, and that TCP was suitable for short-distance travel. In addition, when the travel time was more than 10 min, the utility of riding duration for TCP was negative, while it was positive for TP, which implies that users showed a preference toward ODP and TP when riding time was within 10–20 min. This result is consistent with Section 4.2.
As for time period of travel, the coefficient was weakly significant and positive for TP during the morning peak, but not for TCP, which indicates that users showed an inclination to choose TP during the morning peak. The evening peak had a strong negative utility with a relatively high significance level for TCP, while the utility for TP was positive. This shows that residents were more inclined to choose ODP and TP during the evening peak, which also indicates that TCP was suitable for occasional events. Additionally, this indicates that the evening peak was more influential than the morning peak in distinguishing patterns choice.
When the distance was 0~4 km, distance had a significant and slightly positive utility for TCP, in contrast to TP choice, which was not significant compared to ODP. With the increase in travel distance, the utility of the distance was positive for TP, with a relatively high level of significance, and in contrast to this, TCP was not statistically significant. This illustrates that users travelling short distance trips were more likely to choose ODP and TCP, while there was a tendency toward TP for middle and long-distance travel. In particular, 4 km was an important turning point, before which we found a split between ODP and TCP, and after which, there was a significant increase in the use of TP. This is similar to the study by Keijer et al. [27], where users were found to be more likely to use a public bike when the travel distance was within 1.5–3.5 km and the majority of travelers would choose other public transports if the travel distance was more than 3.5 km. This result was perhaps because ODP and TCP were more suitable for short-distance travel, due to limitations of time and effort, and the strength of TP became more prominent with increasing travel distances [28,41,42].
Regarding preferences, cheap fares had a positive utility for TCP but were negative for TP. This indicates that users were more inclined to choose TCP, in comparison to ODP, when the fare was cheap. It also implies that high ticket prices are not suitable for connections between FFBS and other travel modes. Furthermore, when users found FFBS easily, they tended to use TCP. The results also showed evidence that when FFBS malfunctions were not handled promptly, this could be detrimental to the use of FFBS. Therefore, FFBS businesses need to engage reasonable price strategies, and at the same time, malfunctioning vehicles should be repaired promptly.
6. Conclusions
From the perspective of FFBS users, this paper was mainly designed to explore the characteristics and influential factors associated with different FFBS travel patterns. The characteristics of three travel patterns (ODP, TCP, and TP) were analyzed based on data collected in Nanjing. TP was mainly used for commuting (53.47%), TCP was used for quick and occasional activities and ODP was relatively balanced for travel purposes. The riding time of TCP was mainly within 10 min (97.49%), TP was mainly distributed within 10–20 min (45.90%) and ODP was concentrated within 5–30 min (79.86%). A MNL model was established to explore influential factors in this relationship. The results showed that occupation, travel duration, time period of travel, travel distance, cheap fare, FFBS is easy to find, and FFBS malfunction is not handled promptly, were the main factors affecting travel patterns. In particular, employees and students showed a preference for TP and ODP, and employees were more likely to choose these two patterns than students. The evening peak had a greater effect on pattern choice than the morning peak. Users of short-distance travel were more inclined to choose TCP and ODP, and when the travel distance reached 4 km, there was a significant shift to TP. Price had an impact on users’ travel patterns. Users showed a tendency toward FFBS for short-distance trips if bicycles were found quickly and handling FFBS malfunctions promptly was found to be an important factor constraining development. Combining the model and questionnaire survey results, we make several policy suggestions to enhance FFBS.
We make three predominant recommendations to improve FFBS. Firstly, as the model showed that user occupation and cheap fares had an impact on travel pattern choice, to improve the satisfaction and loyalty of users, government and businesses should engage reasonable price strategies. Prices should be set according to demand and the travel distance or riding time of users. Also, coupons and discount cards should be given to specific groups to encourage them to choose FFBS. Secondly, as the model showed, FFBS being easy to find had an impact on travel pattern choice. Parking arbitrarily will reduce usage rates and have a significant impact on other travel modes. The government should plan the number and location of parking spaces according to travel demand intensity, and in addition, timely redistribution balance should also focus on this. For the FFBS enterprise, the electronic coupon could rewarded to users in order to encourage them to carry out intelligent manual redistribution. Lastly, the model showed that not handling FFBS malfunctions promptly could seriously impede the use of FFBS; therefore, businesses are encouraged to set up maintenance stations. Users can carry out malfunctioning-bicycle feedback through mobile terminals, and businesses can further identify whether the feedback is reliable, then the location of the malfunctioning bicycles can be obtained through GPS and they can be recalled promptly by redistribution vehicles and repaired.
The present paper was subject to some limitations. Further research is needed to fill the following gaps. Firstly, the use of FFBS should be considered in relation to more weather and climate related variables, such as rainy days, snowy days, summer and winter. Secondly, the difference in travel characteristics between weekdays and weekends was not considered in this study. Therefore, weather, climate and day of the week should be considered in further research.
Acknowledgments
This work was supported financially by the National Natural Science Foundation of China (51578150).
Author Contributions
Lin Cheng and Mingyang Du conceived and designed the questionnaires; Mingyang Du performed the investigations and analyzed the data; Lin Cheng contributed materials/analysis tools; and Mingyang Du wrote the paper.
Conflicts of Interest
The authors declare no conflict of interest.
References
- Manaugh, K.; Boisjoly, G.; El-Geneidy, A. Overcoming Barriers to Cycling: Understanding Frequency of Cycling in a University Setting and the Factors Preventing Commuters from Cycling on a Regular Basis. Transportation 2016, 44, 1–14. [Google Scholar] [CrossRef]
- Jäppinen, S.; Toivonen, T.; Salonen, M. Modelling the Potential Effect of Shared Bicycles on Public Transport Travel Times in Greater Helsinki: An Open Data Approach. Appl. Geogr. 2013, 43, 13–24. [Google Scholar] [CrossRef]
- Faghih-Imani, A.; Eluru, N. Analysing Bicycle-Sharing System User Destination Choice Preferences: Chicago’s Divvy System. J. Transp. Geogr. 2015, 44, 53–64. [Google Scholar] [CrossRef]
- Pal, A.; Yu, Z. Free-Floating Bike Sharing: Solving Real-Life Large-Scale Static Rebalancing Problems. Transp. Res. Part C Emerg. Technol. 2017, 80, 92–116. [Google Scholar] [CrossRef]
- Frade, I.; Anabela, R. Bicycle Sharing Systems Demand. Procedia Soc. Behav. Sci. 2014, 111, 518–527. [Google Scholar] [CrossRef]
- Parkin, J.; Mark, W.; Matthew, P. Estimation of the Determinants of Bicycle Mode Share for the Journey to Work Using Census Data. Transportation 2008, 35, 93–109. [Google Scholar] [CrossRef]
- Fishman, E.; Simon, W.; Narelle, H.; Armando, M. Barriers to Bikesharing: An Analysis from Melbourne and Brisbane. J. Transp. Geogr. 2014, 41, 325–337. [Google Scholar] [CrossRef]
- Bachand-Marleau, J.; Lee, B.H.Y.; El-Geneidy, A.M. Better Understanding of Factors Influencing Likelihood of Using Shared Bicycle Systems and Frequency of Use. Transp. Res. Rec. J. Transp. Res. Board 2012, 2314, 66–71. [Google Scholar] [CrossRef]
- Pucher, J.; Buehler, R. City Cycling; MIT Press: Cambridge, MA, USA, 2012. [Google Scholar]
- Vogel, M.; Hamon, R.; Lozenguez, G.; Merchez, L.; Abry, P.; Barnier, J.; Borgnat, P.; Flandrin, P.; Mallon, I.; Robardet, C. From Bicycle Sharing System Movements to Users: A Typology of Vélo’v Cyclists in Lyon Based on Large-Scale Behavioural Dataset. J. Transp. Geogr. 2014, 41, 280–291. [Google Scholar] [CrossRef]
- Dickinson, J.E.; Kingham, S.; Copsey, S.; Hougie, D.J. Employer Travel Plans, Cycling and Gender: Will Travel Plan Measures Improve the Outlook for Cycling to Work in the Uk? Transp. Res. Part D Transp. Environ. 2003, 8, 53–67. [Google Scholar] [CrossRef]
- Garrard, J.; Rose, G.; Lo, S.K. Promoting Transportation Cycling for Women: The Role of Bicycle Infrastructure. Prev. Med. 2008, 46, 55–59. [Google Scholar] [CrossRef] [PubMed]
- Zhang, Y.; Liu, X.; Zhang, H. Survey on the Reorganization and Using Status of Public Bicycle System in Urban Fringe Areas: Taking Tongzhou and Daxing Districts of Beijing for Example. Urban Probl. 2015, 3, 42–46. [Google Scholar]
- Stinson, M.A.; Bhat, C.R. A Comparison of the Route Preferences of Experienced and Inexperienced Bicycle Commuters. Available online: http://www.ce.utexas.edu/prof/bhat/ABSTRACTS/Nov15_Inexperienced_Bicycle_Commuters_TRB2005.pdf (accessed on 7 April 2018).
- Dill, J.; Voros, K. Factors Affecting Bicycling Demand: Initial Survey Findings from the Portland, Oregon, Region. Transp. Res. Rec. J. Transp. Res. Board 2007, 2031, 9–17. [Google Scholar] [CrossRef]
- Liu, Q. Study on the influencing factors of the choice behavior of Public Bicycle Users in Jinhua. Shang 2016, 16, 62–63. [Google Scholar]
- Moudon, A.V.; Lee, C.; Cheadle, A.D.; Collier, C.W.; Johnson, D.; Schmid, T.L.; Weather, R.D. Cycling and the Built Environment, a US Perspective. Transp. Res. Part D 2005, 10, 245–261. [Google Scholar] [CrossRef]
- Kaltenbrunner, A.; Meza, R.; Grivolla, J.; Codina, J.; Banchs, R. Urban Cycles and Mobility Patterns: Exploring and Predicting Trends in a Bicycle-Based Public Transport System. Pervasive Mob. Comput. 2010, 6, 455–466. [Google Scholar] [CrossRef]
- Nair, R.; Miller-Hooks, E.; Hampshire, R.C.; Bušić, A. Large-Scale Vehicle Sharing Systems: Analysis of Vélib’. Int. J. Sustain. Transp. 2013, 7, 85–106. [Google Scholar] [CrossRef]
- Zhu, W.; Pang, Y.; Wang, D.; Yu, Xi. Travel Behavior Change after the Introduction of Public Bicycle System: A Case Study of Minghang District, Shanghai. Urban Plan. Forum 2012, 5, 76–81. [Google Scholar]
- Faghih-Imani, A.; Eluru, N.; El-Geneidy, A.M.; Rabbat, M.; Haq, U. How Land-Use and Urban Form Impact Bicycle Flows: Evidence from the Bicycle-Sharing System (Bixi) in Montreal. J. Transp. Geogr. 2014, 41, 306–314. [Google Scholar] [CrossRef]
- Corcoran, J.; Li, T.; Rohde, D.; Charles-Edwards, E.; Mateo-Babiano, D. Spatio-Temporal Patterns of a Public Bicycle Sharing Program: The Effect of Weather and Calendar Events. J. Transp. Geogr. 2014, 41, 292–305. [Google Scholar] [CrossRef]
- O’Brien, O.; Cheshire, J.; Batty, M. Mining Bicycle Sharing Data for Generating Insights into Sustainable Transport Systems. J. Transp. Geogr. 2014, 34, 262–273. [Google Scholar] [CrossRef]
- Rahul, T.M.; Verma, A. A Study of Acceptable Trip Distances Using Walking and Cycling in Bangalore. J. Transp. Geogr. 2014, 38, 106–113. [Google Scholar] [CrossRef]
- Aultmanhall, L.; Hall, F.; Baetz, B. Analysis of Bicycle Commuter Routes Using Geographic Information Systems: Implications for Bicycle Planning. Transp. Res. Rec. J. Transp. Res. Board 2007, 1578, 102–110. [Google Scholar] [CrossRef]
- Arasan, V.T.; Rengaraju, V.R.; Rao, K.K. Characteristics of Trips by Foot and Bicycle Modes in Indian City. J. Transp. Eng. 1994, 120, 283–294. [Google Scholar] [CrossRef]
- Keijer, M.J.N.; Rietveld, P. How Do People Get to the Railway Station? The Dutch Experience. Transp. Plan. Technol. 2000, 23, 215–235. [Google Scholar] [CrossRef] [Green Version]
- Timperio, A.; Ball, K.; Salmon, J.; Roberts, R.; Giles-Corti, B.; Simmons, D.; Baur, L.A.; Crawford, D. Personal, Family, Social, and Environmental Correlates of Active Commuting to School. Am. J. Prev. Med. 2006, 30, 45. [Google Scholar] [CrossRef] [PubMed]
- Dill, J.; Gliebe, J. Understanding and Measuring Bicycling Behavior: A Focus on Travel Time and Route Choice. Bicycl. Lanes 2008, 29. [Google Scholar] [CrossRef]
- Shaheen, S.A.; Martin, E.W.; Cohen, A.P.; Finson, R.S. Public Bikesharing in North America: Early Operator and User Understanding. Presented at the European Conference on Antennas and Propagation, Prague, Czech Republic, 26–30 March 2012. [Google Scholar]
- Shaheen, S.; Cohen, A.; Martin, E. Public Bikesharing in North America: Early Operator Understanding and Emerging Trends. Transp. Res. Rec. J. Transp. Res. Board 2013, 1568, 83–92. [Google Scholar] [CrossRef]
- Yang, T.; Pan, H.; Shen, Q. Bike-Sharing Systems in Beijing, Shanghai, and Hangzhou and Their Impact on Travel Behavior (No. 11-3862). Presented at the Transportation Research Board 90th Annual Meeting, Washington, DC, USA, 23–27 January 2011. [Google Scholar]
- Tran, T.D.; Ovtracht, N.; D’arcier, B.F. Modeling Bike Sharing System Using Built Environment Factors. Procedia CIRP 2015, 30, 293–298. [Google Scholar] [CrossRef]
- Olson, K. A Review of Recent Literature. Glob. Bus. Organ. Excell. 2010, 1, 129–132. [Google Scholar]
- Kai1i, L.I.; Xiaoshu, C.A.; Xiaoyan, H.U. Research progress on bikesharing travel based on CiteSpace. Prog. Geogr. 2017, 36, 762–773. [Google Scholar]
- Yang, R.; Long, R. Analysis of the Influencing Factors of the Public Willingness to Participate in Public Bicycle Projects and Intervention Strategies—A Case Study of Jiangsu Province, China. Sustainability 2016, 8, 349. [Google Scholar] [CrossRef]
- Gebhart, K.; Noland, R.B. The Impact of Weather Conditions on Capital Bikeshare Trips. Presented at the Transportation Research Board 92nd Annual Meeting 2013, Washington, DC, USA, 12–16 January 2013. [Google Scholar]
- El-Assi, W.; Mahmoud, M.S.; Habib, K.N. Effects of Built Environment and Weather on Bike Sharing Demand: A Station Level Analysis of Commercial Bike Sharing in Toronto. Transportation 2017, 44, 589–613. [Google Scholar] [CrossRef]
- Li, S.; Zhao, P. The Determinants of Commuting Mode Choice among School Children in Beijing. J. Transp. Geogr. 2015, 46, 112–121. [Google Scholar] [CrossRef]
- Yang, X.; Zhe, W.; Hai, J. Online Air-ticket Agent Choice Based on A Multinomal Logit Model. J. Tsinghua Univ. 2017, 57, 437–442. [Google Scholar]
- Pucher, J.; Ralph, B. Why Canadians Cycle More Than Americans: A Comparative Analysis of Bicycling Trends and Policies. Transp. Policy 2006, 13, 265–279. [Google Scholar] [CrossRef]
- Campbell, A.A.; Cherry, C.R.; Ryerson, M.S.; Yang, X. Factors Influencing the Choice of Shared Bicycles and Shared Electric Bikes in Beijing. Transp. Res. Part C 2016, 67, 399–414. [Google Scholar] [CrossRef]
Figure 1.
Surveyed area in China.

Figure 2.
Origin to Destination Pattern (ODP).

Figure 3.
Travel Cycle Pattern (TCP).

Figure 4.
Transfer Pattern (TP).


Table 1.
Statistics for respondent attributes.
| Variable | Description | Percentage (%) |
|---|---|---|
| Gender | Male | 53.19 (56.4) 1 |
| Female | 46.81 (43.6) | |
| Age | Teenagers (<19) | 23.26 |
| Adults (19–40) | 71.61 | |
| Middle-aged (41–65) | 5.05 | |
| Older (>65) | 0.08 | |
| Educational level | Junior middle school and lower | 7.45 (6.2) |
| High school | 34.07 (29.7) | |
| Undergraduate | 52.91 (52.1) | |
| Masters and higher | 5.57 (12) | |
| Occupation | Student | 37.80 |
| Teacher | 6.26 | |
| Officer | 8.93 | |
| Employee | 38.49 | |
| Retired | 0.30 | |
| Others | 8.22 | |
| Monthly income (CNY) | <5000 | 52.20 |
| 5000–10,000 | 28.00 | |
| 10,000–16,000 | 13.36 | |
| >16,000 | 6.44 |
1 Real statistics from the company, BigData-Research, in parentheses.
Table 2.
Travel characteristics of different travel patterns.
| Travel Pattern | ODP | TCP | TP | |
|---|---|---|---|---|
| Travel purpose | Attending school | 20.88% | 0.39% | 18.42% |
| Commute to work | 28.89% | 0.77% | 53.47% | |
| Business | 11.02% | 48.55% | 20.28% | |
| Shopping and entertainment | 20.93% | 50.10% | 7.37% | |
| Physical exercise | 18.29% | 0.19% | 0.48% | |
| Riding duration (min) | <5 | 10.86% | 41.20% | 11.41% |
| 5–10 | 16.97% | 56.29% | 21.43% | |
| 10–20 | 39.48% | 2.32% | 45.90% | |
| 20–30 | 23.41% | 0.19% | 13.54% | |
| >30 | 9.28% | 0.00% | 7.72% | |
| Time period of travel | <6:00 | 3.64% | 3.87% | 7.96% |
| 6:00~8:00 | 25.14% | 7.74% | 25.15% | |
| 8:00~11:00 | 18.13% | 21.28% | 16.28% | |
| 11:00~13:00 | 14.55% | 13.54% | 14.81% | |
| 13:00~17:00 | 8.17% | 19.73% | 8.67% | |
| 17:00~19:00 | 15.71% | 15.67% | 14.73% | |
| >19:00 | 14.65% | 18.18% | 12.40% | |
Table 3.
Variables chosen to analyze the factors influencing different travel patterns.
| Items | Variable | Description and Notes |
|---|---|---|
| Basic attributes | Gender | Male = 1 Female = 0 2 |
| Age | Teenager = 1 Adult = 2 Middle-Aged = 3 Older = 0 | |
| Educational level | <Junior middle school = 1 High school = 2 Undergraduate = 3 >Master = 0 | |
| Occupation | Student = 1 Teacher = 2 Officer = 3 Employee = 4 Retired = 5 Others = 0 | |
| Monthly income (CNY) | <5000 = 1 5000~10,000 = 2 10,000~16,000 = 3 >16,000 = 0 | |
| Travel information | Travel purpose | Attending school = 1 Commute = 2 Business = 3 Shopping and entertainment = 4 Physical exercise = 0 |
| Riding duration (minutes) | <5 = 1 5~10 = 2 10~20 = 3 20~30 = 4 >30 = 0 | |
| Time period of travel | <6:00 = 1 6:00~8:00 = 2 8:00~11:00 = 3 11:00~13:00 = 4 13:00~17:00 = 5 17:00~19:00 = 6 >19:00 = 0 | |
| Travel distance (km) | 0~2 = 1 2~4 = 2 4~6 = 3 6~8 = 4 >8 = 0 | |
| Frequency of FFBS use (time/day) | 1 = 1 2 = 2 3 = 3 4 = 4 5 = 5 >5 = 0 | |
| Preferences | Cheap fare | Strongly agree = 1 Relatively agree = 2 Not sure = 3 Relatively disagree = 4 Strongly disagree = 5 |
| FFBS is easy to find | Strongly agree = 1 Relatively agree = 2 Not sure = 3 Relatively disagree = 4 Strongly disagree = 0 | |
| FFBS is convenient to park | Strongly agree = 1 Relatively agree = 2 Not sure = 3 Relatively disagree = 4 Strongly disagree = 0 | |
| FFBS is convenient for leisure and exercise | Strongly agree = 1 Relatively agree = 2 Not sure = 3 Relatively disagree = 4 Strongly disagree = 0 | |
| FFBS station should be set up | Residential area = 1 Near subway or bus station = 2 Enterprise = 3 School = 4 Market = 5 Parks = 6 Others = 0 | |
| FFBS can enrich travel mode | Strongly agree = 1 Relatively agree = 2 Not sure = 3 Relatively disagree = 4 Strongly disagree = 0 | |
| Improve bus/subway connection | Strongly agree = 1 Relatively agree = 2 Not sure = 3 Relatively disagree = 4 Strongly disagree = 0 | |
| FFBS malfunction is not handled promptly | Strongly agree = 1 Relatively agree = 2 Not sure = 3 Relatively disagree = 4 Strongly disagree = 0 |
2 The reference item in the MNL model with a value of 0.
Table 4.
Estimation results of Multinomial Logit Model.
| Variable | TCP | TP | ||||
|---|---|---|---|---|---|---|
| B | sig. | exp(B) | B | sig. | exp(B) | |
| Occupation | ||||||
| Student | −1.24 | 0.002 | 0.289 | 0.385 | 0.005 | 1.470 |
| Employee | −2.375 | 0.004 | 0.093 | 0.443 | 0.005 | 1.557 |
| Riding duration (min) | ||||||
| <5 | 0.104 | 0.016 | 1.11 | 0.958 | 0.006 | 2.607 |
| 5~10 | 0.063 | 0.123 | 1.065 | 0.682 | 0.002 | 1.977 |
| 10~20 | −0.051 | 0.176 | 0.951 | 0.144 | 0.338 | 1.155 |
| 20~30 | −0.006 | 0.197 | 0.994 | 0.247 | 0.137 | 1.28 |
| Time period of travel | ||||||
| 6:00~8:00 | −1.432 | 0.113 | 0.239 | 0.281 | 0.062 | 1.325 |
| 11:00~13:00 | −2.122 | 0.028 | 0.12 | 0.427 | 0.008 | 1.532 |
| 17:00~19:00 | −2.122 | 0.033 | 0.12 | 0.173 | 0.042 | 1.189 |
| Travel distance (km) | ||||||
| 0~2 | 0.006 | 0 | 1.006 | −4.171 | 0.989 | 0.015 |
| 2~4 | −0.017 | 0 | 0.983 | −4.062 | 0.977 | 0.017 |
| 4~6 | −0.351 | 0.304 | 0.704 | 0.322 | 0.027 | 1.38 |
| 6~8 | −0.276 | 0.52 | 0.759 | 0.413 | 0.01 | 1.512 |
| Cheap fare | ||||||
| Strongly agree | 2.251 | 0 | 9.496 | −1.938 | 0.002 | 0.144 |
| Relatively agree | 2.211 | 0 | 9.128 | −1.761 | 0.005 | 0.172 |
| Not sure | 2.187 | 0 | 8.906 | −1.732 | 0.005 | 0.177 |
| FFBS is easy to find | ||||||
| Strongly agree | 1.978 | 0 | 7.228 | −0.556 | 0.609 | 0.573 |
| Relatively agree | 1.927 | 0 | 6.871 | −0.734 | 0.499 | 0.48 |
| Not sure | 1.868 | 0 | 6.475 | −0.604 | 0.58 | 0.547 |
| FFBS malfunction is not handled promptly | ||||||
| Strongly agree | −0.639 | 0.142 | 0.528 | −0.567 | 0.028 | 0.567 |
| Constant | 8.086 | 0.042 | 6.006 | 0.036 | ||
| Cox and Snell | 0.435 | Nagelkerke | 0.801 | McFadden | 0.592 | |
| Chi-square | 137 | |||||
© 2018 by the authors. Licensee MDPI, Basel, Switzerland. This article is an open access article distributed under the terms and conditions of the Creative Commons Attribution (CC BY) license (http://creativecommons.org/licenses/by/4.0/).
Share and Cite
MDPI and ACS Style
Du, M.; Cheng, L. Better Understanding the Characteristics and Influential Factors of Different Travel Patterns in Free-Floating Bike Sharing: Evidence from Nanjing, China. Sustainability 2018, 10, 1244. https://doi.org/10.3390/su10041244
AMA Style
Du M, Cheng L. Better Understanding the Characteristics and Influential Factors of Different Travel Patterns in Free-Floating Bike Sharing: Evidence from Nanjing, China. Sustainability. 2018; 10(4):1244. https://doi.org/10.3390/su10041244
Chicago/Turabian StyleDu, Mingyang, and Lin Cheng. 2018. "Better Understanding the Characteristics and Influential Factors of Different Travel Patterns in Free-Floating Bike Sharing: Evidence from Nanjing, China" Sustainability 10, no. 4: 1244. https://doi.org/10.3390/su10041244
Note that from the first issue of 2016, this journal uses article numbers instead of page numbers. See further details here.