1. Introduction
Currently, 54% of the world’s population live in urban areas and 60% of the population are expected to become urban by 2030 [
1]. In Brazil, 85% of the population live in urban areas, and it is expected that this will rise to 91.1% by 2030 [
1,
2]. This growth in the urban population has resulted in a significant increase in freight transport demand levels in order to meet the population’s needs [
3]. Additionally, the growth in e-commerce sales has generated demand for home deliveries [
4,
5].
Due to inadequate (or non-existent) urban and transport planning, combined with a lack of attention given to urban freight transport, Brazilian cities experience problems of urban freight mobility. Those issues are even more relevant for logistics operators and retailers located in regions of higher demand [
6]. Usually, restrictive measures are implemented by the government to limit the circulation of freight vehicles in some areas of the cities [
7], either due to a lack of awareness or even negligence from public managers [
8]. Hence, the scarcity of urban and transportation planning has negative impacts on access to goods in urban areas, and on the citizens’ quality of life.
Considering that urban freight transport (UFT) is crucial for the economic development of cities and for ensuring the population’s quality of life, the externalities caused by this activity need to be known, monitored and reduced to obtain an adequate planning process that would ensure an efficient operation of the sector. Unfortunately, urban freight transportation planning is not widely discussed, in contrast to passenger transport planning [
9]. In Brazil, since 2012, a Federal Law has determined that municipalities with a population above 20,000 inhabitants have structured mobility plans. However, there is limited knowledge to support the structuring of urban freight transport policies or solutions to reduce the externalities caused by this activity—thus increasing its social, environmental, and economic impacts. To worsen the situation, in Brazil, public managers usually do not have the technical knowledge to elaborate, implement, and evaluate public policies, since they are generally chosen essentially by political criteria. This process undermines the decision-making process, reduces the quality of federal programs, and aggravates the issues previously outlined.
In addition to the scarcity of information to support urban freight transportation planning, the difficulty of finding a balance between the different groups that operate in the distribution of goods is one of the problems faced by public administrators. The main actors involved in urban logistics are shippers, transporters, retailers, residents, and the public administration, and each of them has different goals and interests, which makes it challenging to choose solutions that are suitable to all stakeholders [
10]. Among these stakeholders, retailers play an important role, since their behaviour affects the UFT results [
11]. The participation of retailers in the discussion of urban logistics solutions is fundamental in order to reduce failures in these initiatives [
12]. Furthermore, the retailers are more resistant to any urban logistics solution than other actors in the delivery of goods [
13].
Some scholars have analysed the behaviour of goods receivers, considering the impact of the Christmas period on the freight transport demand in Szczecin (Poland) [
14,
15], the influence of deliveries on urban environment analyzing environments in Szczecin (Poland) [
16] and Oslo [
15,
16], the willingness of receivers of supplies to accept unassisted off-hour deliveries [
17], and the off-hour delivery policy and urban distribution centres as a new goods distribution practise in Santander and Barcelona, using a stated preference survey and a mixed logit model [
18].
In this context, we present an analysis of urban freight transportation in Brazilian cities. We collected data in 1882 commercial establishments in nine cities (Betim, Caruaru, Contagem, Joinville, Niteroi, Palmas, Quixada, Recife, and Sorocaba) from different regions of Brazil. They each have different demographic, economic, and morphological characteristics. Through the analysis of these data, our aim is to discuss problems and solutions for urban freight transport from the retailers’ point of view.
The main contribution of this paper is to identify possible patterns, in a national context, for problems and solutions related to urban freight transportation in the analysed cities from the retailers’ point of view. To achieve this, we present an overview of urban freight transport in Brazilian cities, classifying the relevance of different problems and solutions using the method of successive intervals. Furthermore, we analysed the similarities and differences among the main characteristics of each city to identify clusters that make possible the comparison of the retailers’ perceptions of UFT. In this way, we intend to contribute to transportation planning, providing information on how to approach problems in the urban freight mobility planning process. Hence, this paper seeks to answer the following question: considering the different economic sectors in Brazilian cities, are the problems and solutions for the distribution of urban goods similar from the retailer’s point of view?
2. Materials and Methods
We developed a questionnaire, based on the literature review and on preliminary research, focused on the perceptions of retailers and logistics operators regarding problems and solutions for freight transportation in Sorocaba [
19]. The intent was to characterise UFT in the central areas of Brazilian cities and to identify, from the retailers’ point of view, the importance of these problems and solutions. For that, a survey was carried out among decision-makers from different retail sectors.
2.1. Questionnaire Development
The questionnaire was divided in three sections. The main information is presented in
Table 1. In
Section 1, information about the company’s characteristics were collected. Information regarding the delivery processes was obtained in
Section 2. Finally, in
Section 3, the respondents were asked to express their agreement with some proposed “solutions” using a 0–10 scale (0 = totally disagree; 10 = totally agree) and how much they believed the “problems” impacted on their operations, also using a 0–10 scale (0 = no impact; 10 = high impact).
2.2. Sample and Procedures
The cities surveyed (Betim, Caruaru, Contagem, Joinville, Niteroi, Palmas, Quixada, Recife and Sorocaba) were selected according to convenience and availability of researchers to perform data collection in the area.
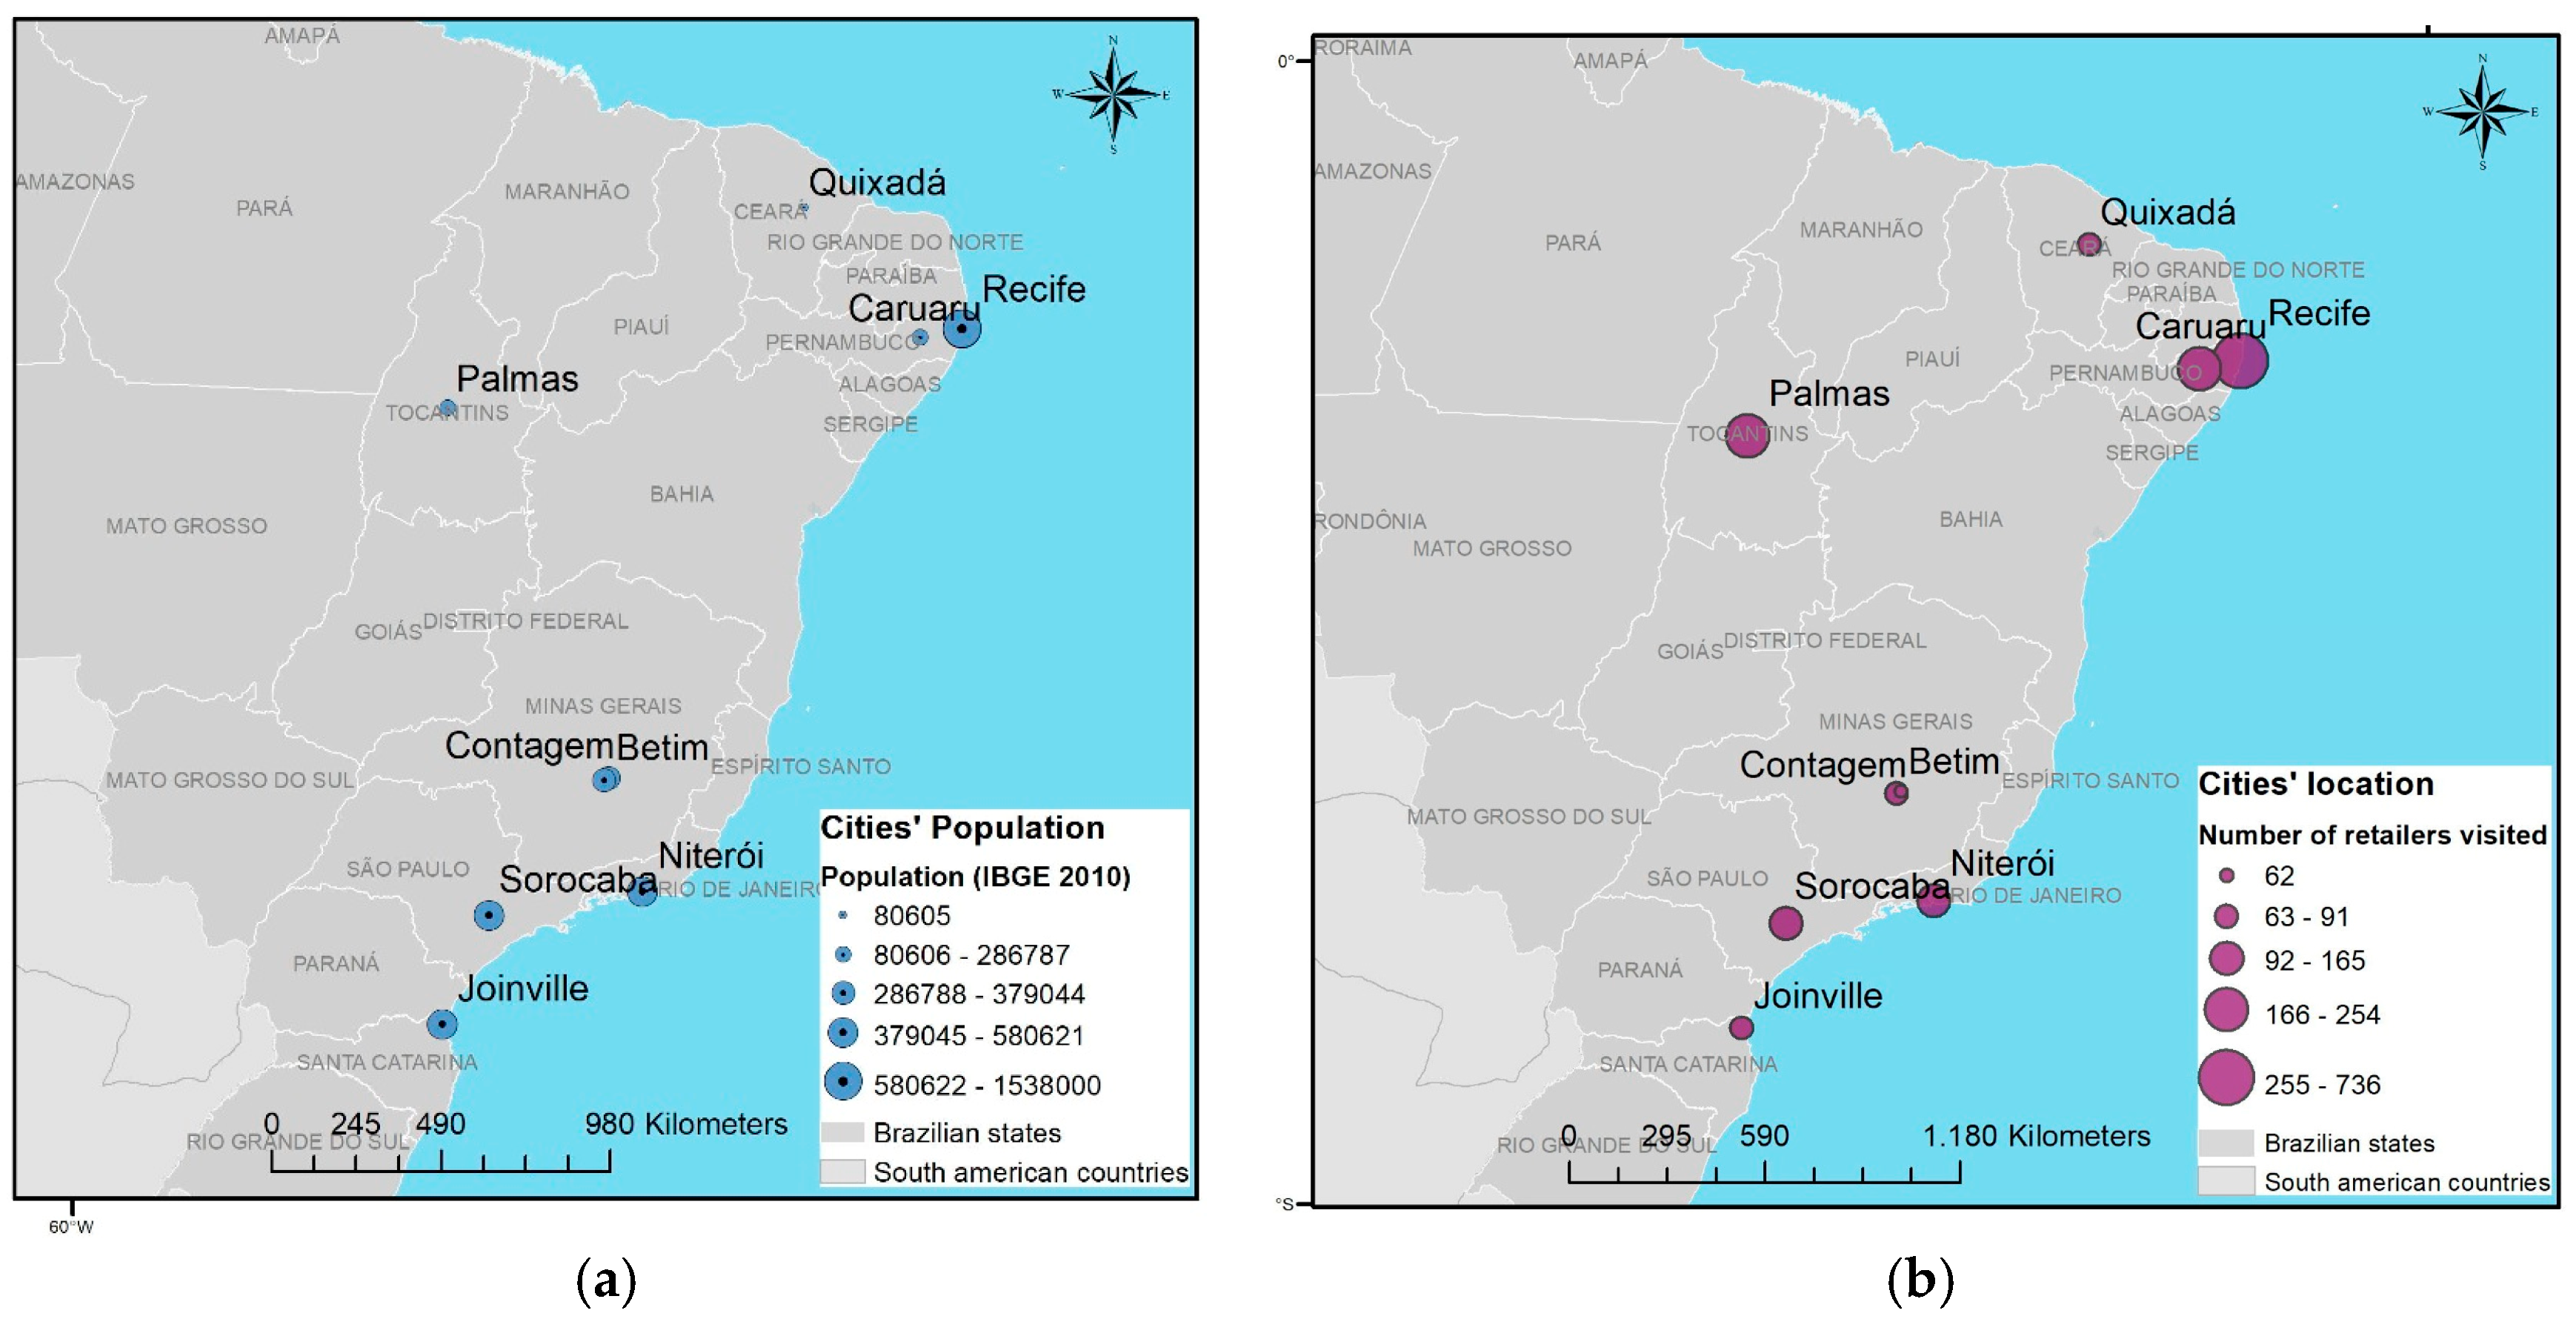
Figure 1 shows the geographical location of the cities surveyed.
Table 2 presents the socioeconomic and demographic characteristics of the cities that were surveyed. We considered the socioeconomic, demographic, and spatial interaction characteristics to describe the municipalities analysed, namely population, area, population density, human development index, agribusinesses’ added value, industry and services, hierarchy in the urban network, and average monthly income compared to the Brazilian minimum wage. It is important to emphasise that Recife, Contagem, and Niteroi have the highest population density. Joinville and Niteroi have the highest human development index (HDI). Niteroi, Recife, and Sorocaba experience the highest added value to retail and services. Joinville, Niteroi, Recife, and Sorocaba have the highest added value in industry, and Joinville and Quixada have the highest value added to agriculture. Hence, we are confident that the service and industry sector is essential for Niteroi, Recife, and Sorocaba. The industry and agriculture sector are important in Joinville, and the agricultural sector is relevant in Quixada.
Table 3 presents the hierarchical classification, indicating that most of the cities are regional capitals. Palmas has population and interaction levels that more closely resemble the classifying definitions of the second category of regional capitals, despite being a state capital. Sorocaba has enough structure to be characterised as a B-level regional capital, but it was classified in the third level because of its geographical proximity to São Paulo (the largest Brazilian metropolis) and Campinas (the A-level regional capital), which reduces the intensity of its centrality. Regarding Niteroi, despite the strong centrality of the city of Rio de Janeiro, Niteroi has an important region of influence and is therefore considered a B-level regional capital. We highlight the fact that these cities have different socioeconomic profiles, despite having a similar hierarchy. Quixada is the one municipality classified as a regional sub-centre, which describes centres with few management activities and a smaller area of influence. Recife is the unique metropolis from among the analysed cities, and is characterised by its large population and strong connections with other municipalities [
21].
The survey was conducted between March and November of 2017. The study area comprised the cities’ central areas or regions with the highest concentrations of commercial establishments. The researchers conducted interviews with the employees responsible for the follow up of deliveries, and who knew the problems involved in the process of receiving goods.
Table 4 presents the number of commercial establishments participating in the survey and the sampling error.
2.3. Steps for the Data Analysis
First, we carried out the descriptive analysis to summarise the information collected. We used measures of central tendency (median and mode) and quartiles. Descriptive analyses were performed using software R.
We used the method of successive intervals to rank the problems and solutions for each analysed city. The method of successive intervals (MSI) is a type of behavioural model, based on a psychometric scale, which estimates the relative importance of the individual characteristics of the respondents’ opinions [
22,
23]. Health and psychology researchers often use this method; however, there have been few applications of it in urban and transport planning [
24,
25,
26]. We did not identify any applications of the method in urban freight transport. It is important to emphasise that behavioural research allows us to understand the behaviour of the interviewee concerning the investigated phenomena and transportation policies. For this purpose, the MSI is a sequence of steps, detailed in research by Providelo and Sanches [
24], that calculates
- (1)
Relative frequency;
- (2)
Cumulative relative frequency;
- (3)
The category’s lower and upper limits;
- (4)
The definitions of the category’s lower and upper limits;
- (5)
The estimated category value;
- (6)
Distances between categories;
- (7)
The cumulative reference scale;
- (8)
The differences between each cumulative reference scale and category values; and
- (9)
A scale of 0–1.
Finally, we conducted a cluster analysis to identify groups that could allow a comparative study to be undertaken, considering social, economic, and demographic variables, as well as the hierarchy within the urban network. Cluster analysis is a method used to group entities into clusters, so that each group contains more similar observations than the observations in other groups. The goal is to maximize the variables’ homogeneity within the clusters and to maximise heterogeneity among the clusters.
We performed two techniques for the cluster analysis: (i) hierarchical clustering, single-linkage and (ii) non-hierarchical clustering, k-means. The iterative algorithm of the hierarchical clustering method first considers each observation as one cluster (minimal internal dispersion), and in the end finds only one cluster with all the observations (highest internal dispersion). In each step, the groups are compared through a similarity measure. Regarding the single-linkage method, also known as the nearest-neighbour method, the similarity measure is defined as “the shortest distance from any object in one cluster to any object in the other” [
27] (p. 586). The hierarchical clustering process results in a treelike diagram that shows the combination of clusters. The k-means method is a non-hierarchical procedure that “assigns objects into clusters once the number of clusters to be formed is specified” [
27] (p. 589). Hair et al. [
27] and Everitt and Hothorn [
28] detail the processing steps. We used the software R and Ninna to implement the cluster methods.
3. Results
We identified each city’s profile regarding the retailers’ perceptions on merchandise receipt using the data collected in the survey.
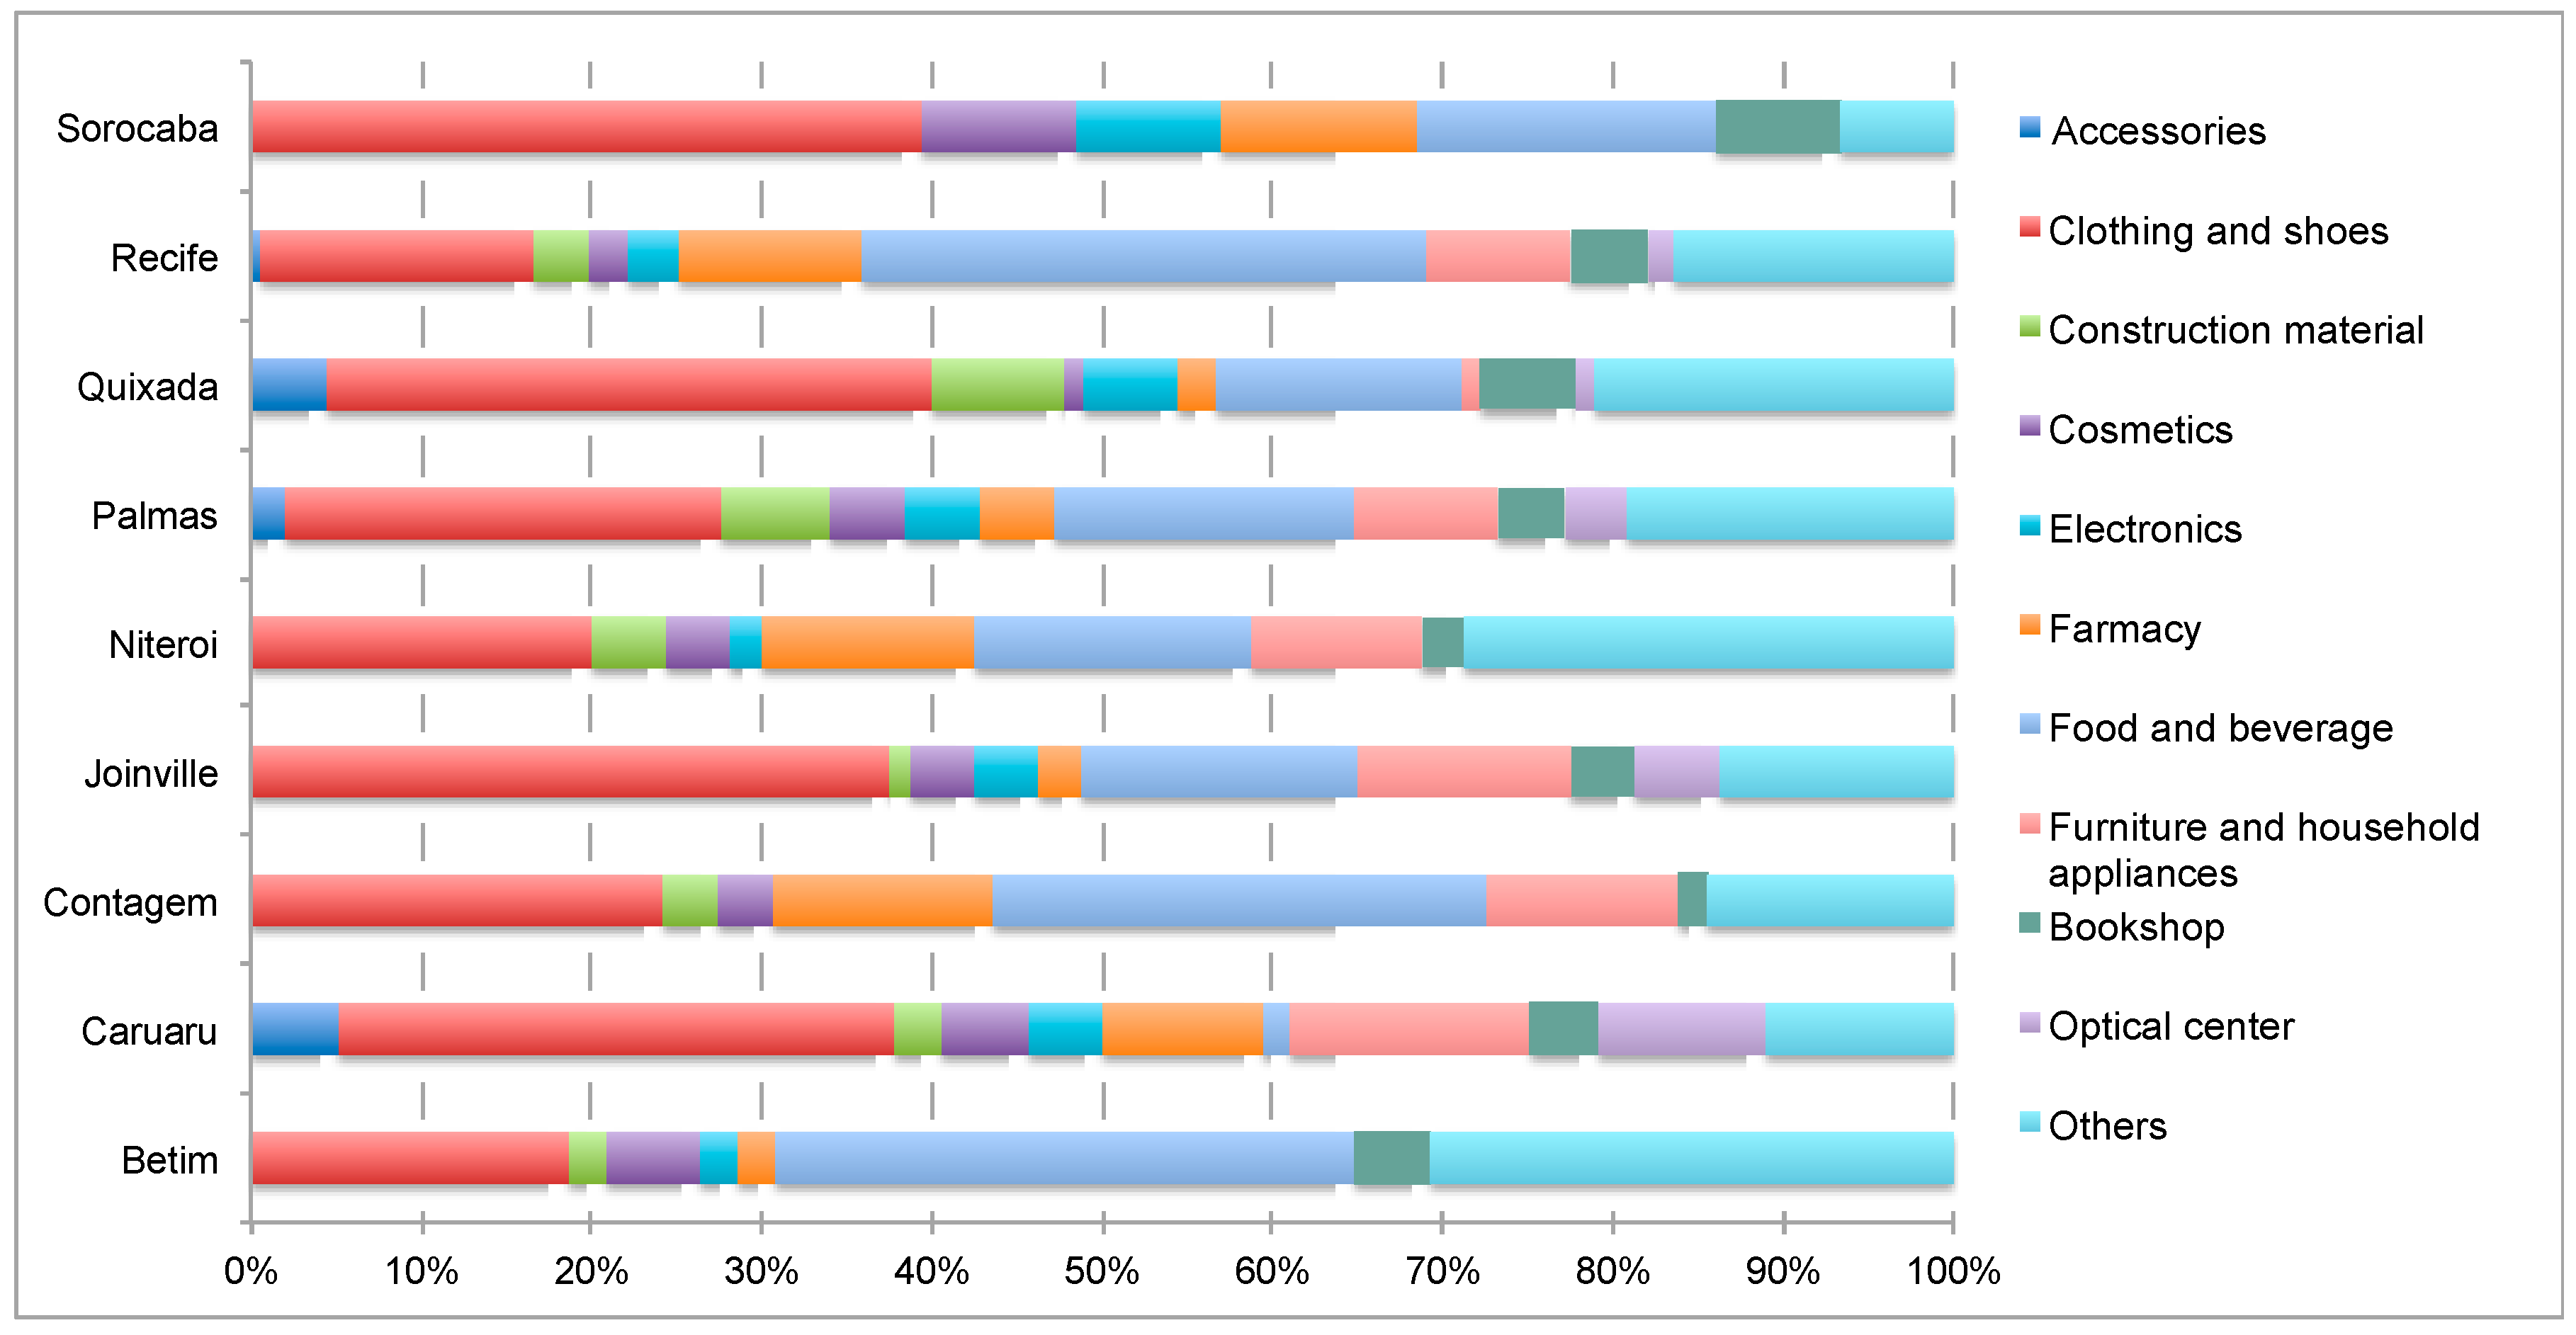
Figure 2 presents the most representative economic sectors of the study areas in each city. Here, we highlight the number of optical retailing centres in Caruaru (considerably higher than the number observed in the other cities) and cosmetics and electronics retailers in Sorocaba. The results indicate a predominance of commercial establishments marketing clothes and footwear, and food and beverages (bars, restaurants, and supermarkets).
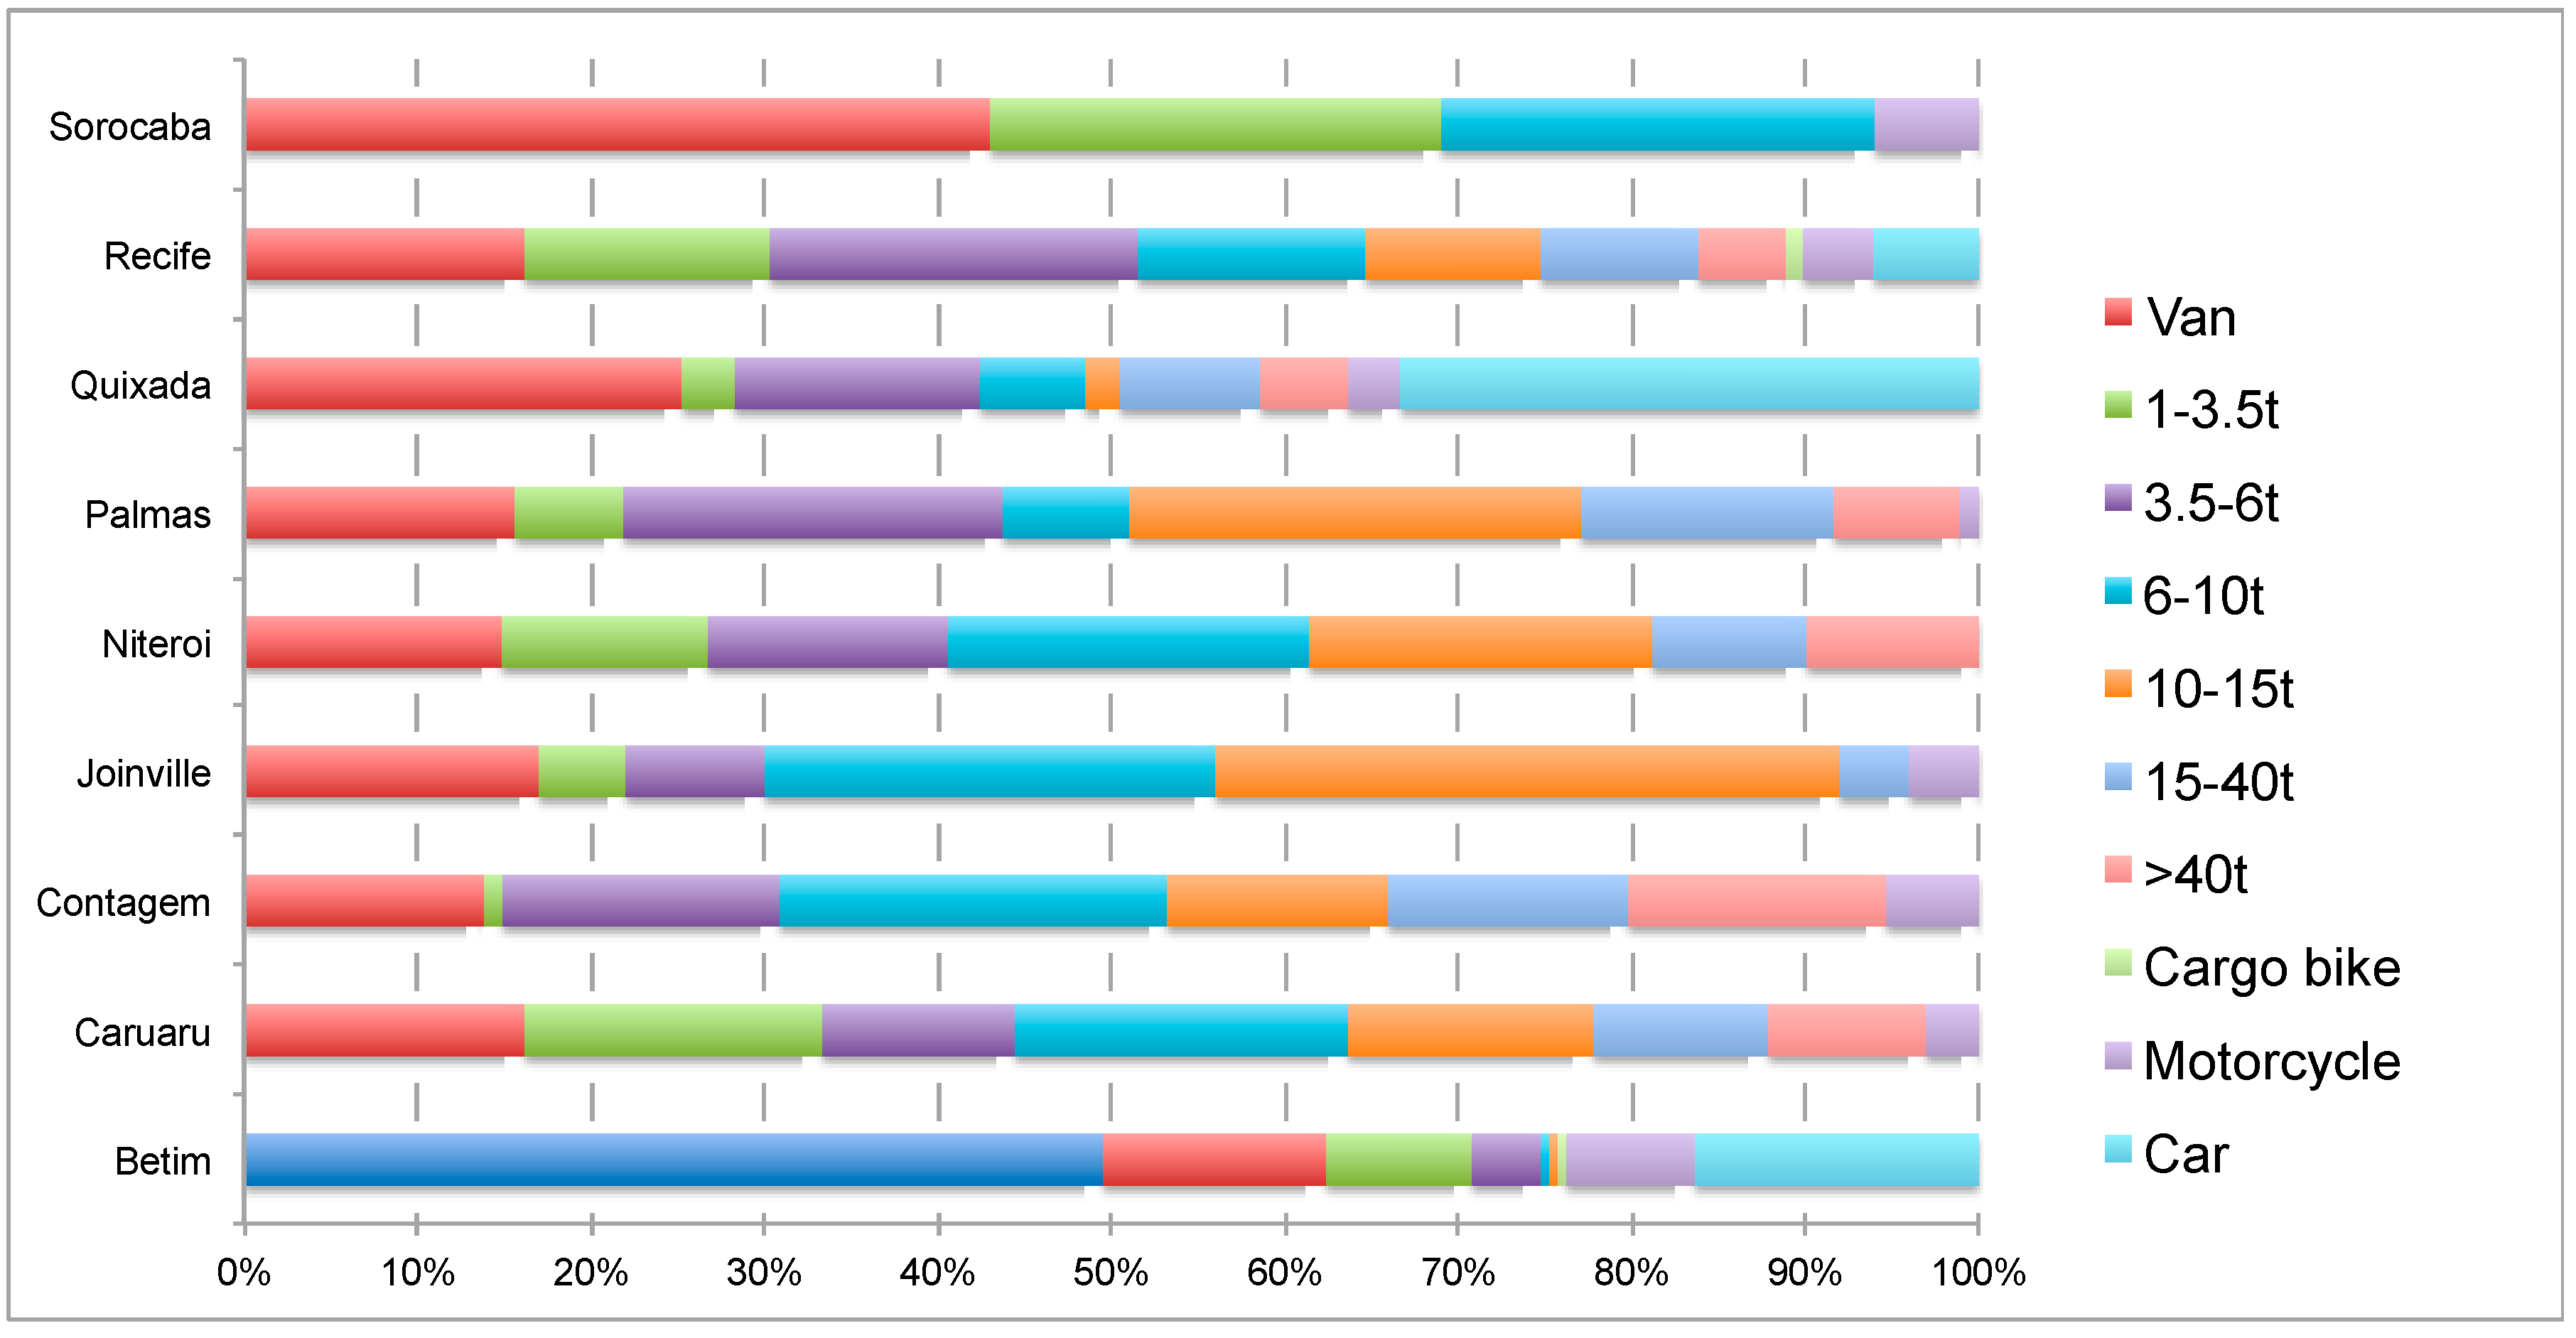
Figure 3 shows the frequencies of different types of vehicles used in goods distribution in the analysed cities. Of note is the use of vans, which is generally associated with restrictions on larger freight vehicles in downtown areas or better accessibility in narrow streets. In Betim and Quixada, most deliveries are done in automobiles. We also highlight the infrequent use of cargo-bikes, despite these being a sustainable alternative for freight deliveries in congested areas. The results indicate that vehicles with up to 15 tons of capacity are generally the most utilised for goods distribution, especially vans.
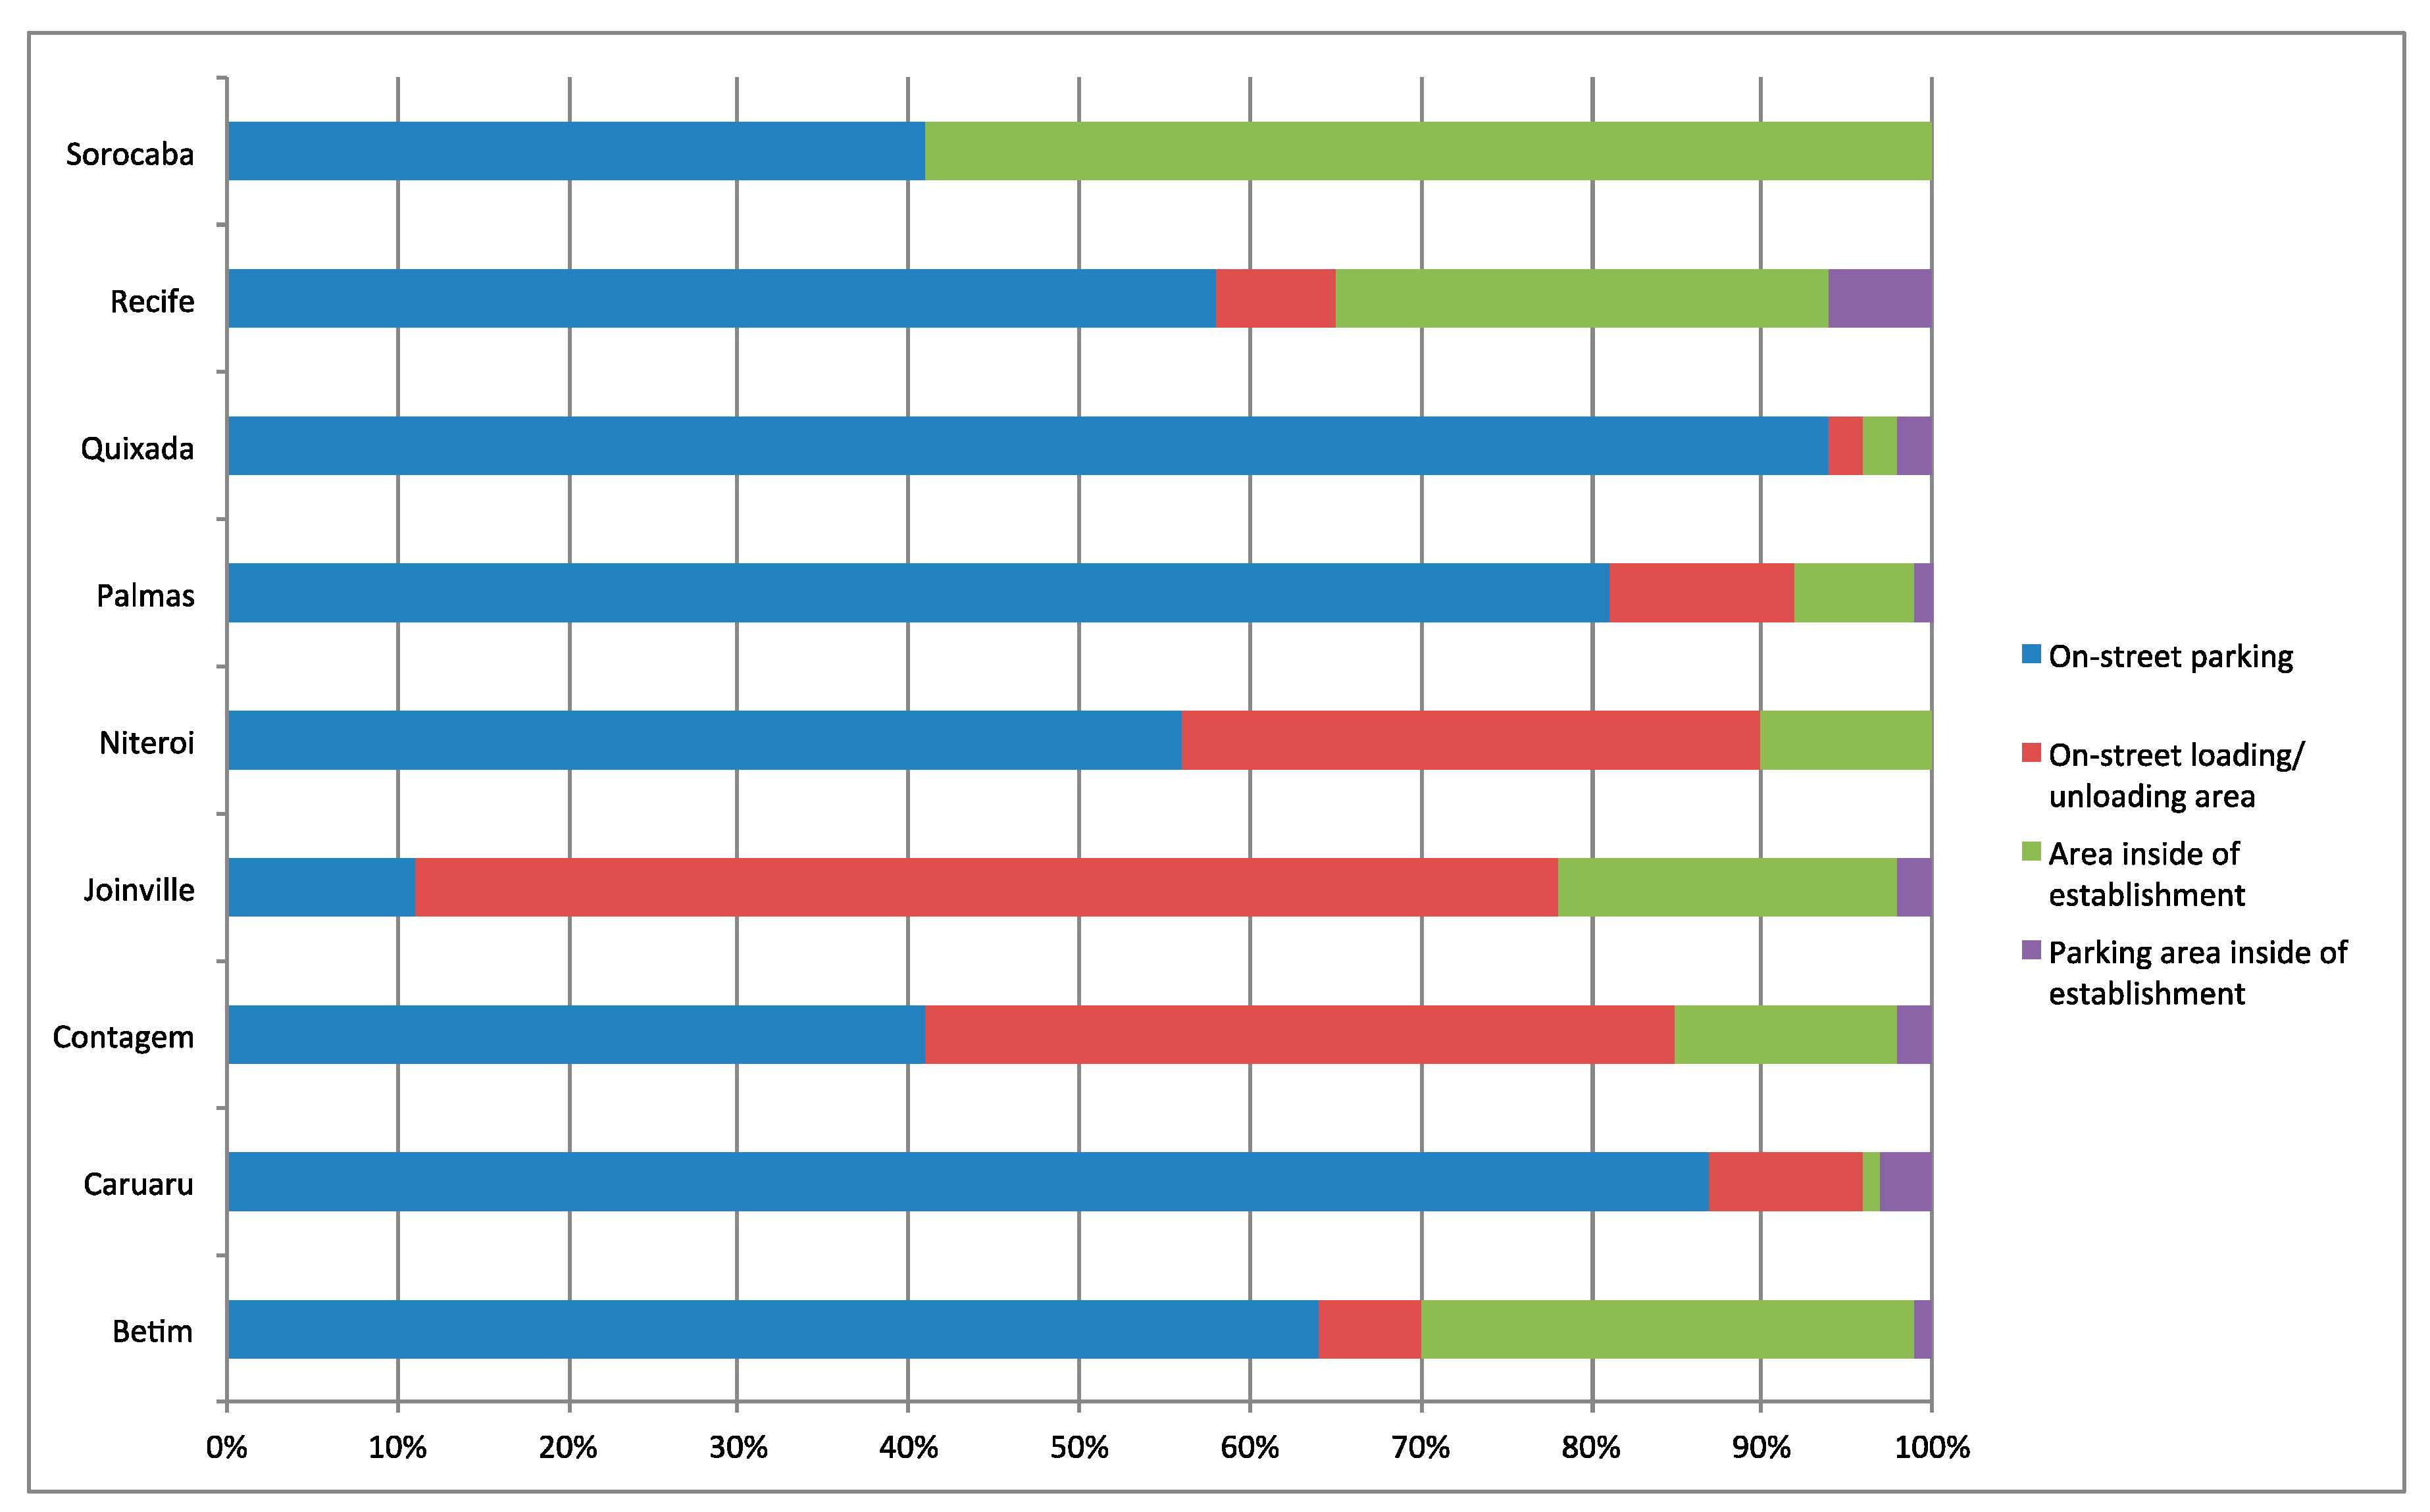
Generally, freight vehicles park on-street (
Figure 4) to load/unload. Parking in loading/unloading areas is more usual in Contagem and Joinville, and this is explained by the greater availability of these areas and their proximity to the commercial establishments. In Sorocaba, parking occurs predominantly in areas within the establishments. In other cities, on-street parking is the main option, with few establishments providing a specific area for loading/unloading operations.
3.1. Problems related to Urban Freight Transport
We analysed the following problems related to urban freight transport: (i) availability of loading/unloading areas; (ii) movement of goods; (iii) vehicle traffic; and (iv) flexibility to receive goods at other times.
Table 5 presents the results of the descriptive statistics.
The availability of parking areas for loading/unloading is considered a higher impact problem in Caruaru (median = 9), Sorocaba (median = 8); Quixada (median = 8), and Niteroi (median = 10). In these four cities, at least 50% of respondents graded the impact intensity of the availability of loading/unloading areas with values above seven. However, in Niteroi (Q1 = 0 and median = 10) and Sorocaba (Q1 = 2 and median = 8) there is a significant dispersion of responses; therefore, there is no consensus among retailers about this attribute’s impact.
At least 50% of the retailers in Betim, Quixada, and Sorocaba (medians of 6, 6 and 7, respectively) highlight a higher impact of goods movement in the areas of study. The retailers from Recife and Palmas do not consider this attribute as relevant. The respondents from the other cities appointed impartial importance to this attribute, with medians of 5. In Niteroi, at least 50% of the retailers rated this attribute as zero, but there was high dispersion among the interviewees’ observations for this city.
Concerning vehicle traffic, Sorocaba retailers (median = 3) do not face problems in this area. On the other hand, vehicle traffic is a big issue in Betim, Caruaru, and Quixada. In Betim (Q1 = 5 and Q3 = 8) and Quixada (Q1 = 5 and Q3 = 9), the responses represent a low dispersion of data, indicating that the impact of this attribute is commonly experienced by retailers. The retailers in other cities report that the traffic is of medium importance.
Regarding flexibility to receive goods at other times, at least 50% of the retailers in Niteroi (median = 0), Joinville (median = 0), Recife (median = 2), Sorocaba (median = 0), and Palmas (median = 0) do not consider this a high impact problem. The retailers in other cities consider it a medium impact issue.
We analysed problem perception by the method of successive intervals, and the results are shown in
Table 6. This method ranks the problems from the most important to the least important. The results indicate the availability of loading/unloading areas is the main problem in urban freight transportation (scale = 1.00), according to retailers from Betim, Caruaru, Contagem, Palmas, Recife, and Sorocaba. There is a notable discrepancy between the number of loading/unloading spaces in Joinville (
Figure 3) and the retailers’ perceptions about their availability (
Table 6). In Joinville and Niteroi, the movement of goods is considered the most critical problem. In Palmas, on the other hand, the movement of goods is the least relevant problem. In other cities, the flexibility to receive goods at other times is considered the least critical problem.
These results reinforce the idea that each city’s particularities affect the perception of the problems related to urban freight transport. Thus, UFT solutions cannot be generic and based on experiences from other cities, since the problems are perceived differently in each city based on their particularities.
3.2. Solutions Related to UFT
We analysed the following solutions related to urban freight transport: (i) off-hour delivery (OHD); (ii) monetary incentives for OHD; (iii) regulation of loading/unloading areas; and (iv) restriction of freight vehicles.
Table 7 shows the descriptive statistics for these solutions.
Off-peak delivery (OHD) is considered a negative solution for most cities. Contagem and Recife (median = 1), and Caruaru, Joinville, Sorocaba, Niteroi, and Palmas scored medians equal to zero. This result indicates that at least 50% of retailers from these cities registered a minimum value for off-peak delivery. At least 75% of the retailers from Palmas and Niteroi scored OHD as lower than 1. One exception is the perception from retailers in Betim; at least 75% of these retailers consider this an interesting solution, indicating values above 8 (median = 10).
Regarding monetary incentives to stimulate off-peak deliveries, there is a consensus regarding the non-acceptance of delivery at different times in Contagem (median = 0.25), and Joinville, Niteroi and Palmas (median = 0), for which at least 50% of retailers gave a zero rating for this solution. However, among retailers from Caruaru, Joinville, Recife, Sorocaba, and Quixada, the idea of a monetary incentive scored a medium degree of agreement for OHD. In Betim at least 50% of retailers agreed on this alternative, indicating values above nine.
The retailers from Betim and Sorocaba accepted the solution of regulation of loading and unloading areas. In Palmas (median = 0), Niteroi (median = 0), and Caruaru (median = 1), at least 50% of retailers completely disagree with this solution. The retailers from Contagem, Recife, Quixada, and Joinville generally agree on this solution.
The retailers from Contagem, Betim, Caruaru, Quixada, and Palmas agree with the restriction of vehicle circulation as a UFT solution. A high dispersion of scores regarding this solution occurred in Palmas, and indicates there is no convergence of retailers’ opinions on this matter. Retailers from Joinville and Recife demonstrated medium scores for this solution. Niteroi was the only city where at least 50% of the retailers’ scores for this solution were equal to zero.
Analysing the ranking of the solutions using the method of successive intervals (
Table 8), we highlight that, contrary to what the descriptive statistics show, off-hour delivery is considered a very positive solution in most cities. A monetary incentive for OHD is also considered a positive solution for Betim, Quixada, and Sorocaba. The results indicate that the regulation of loading/unloading areas—a measure commonly adopted in Brazilian cities—is not considered an essential solution in Betim, Contagem, Sorocaba, and Quixada. However, the retailers from Niteroi, Joinville, Caruaru, and Palmas consider the regulation of loading/unloading areas relevant, taking priority over the idea of a monetary incentive for overnight delivery. In Niteroi, the regulation of loading/unloading areas is considered the most favourable solution. Thus, new parking areas could be implemented to reduce double parking in loading/unloading areas. The retailers from Joinville, Quixada, and Palmas consider the restriction of freight vehicles as irrelevant, although the retailers of these cities also indicated that vehicle traffic is a significant problem. This result may indicate a dissociative perception between the restriction of freight vehicles and vehicle traffic improvement from the perspective of the retailers.
The results indicate notably different perceptions of the UFT solutions. Because of this, it is essential to analyse the local context and the stakeholders involved in the urban freight transport planning process. When a solution impacts on daily life, such as night delivery, its implementation becomes a significant challenge due to issues involving labour legislation and public safety, as well as environmental issues—such as noise levels—that should be properly evaluated. Public policies must consider the particularities, customs, and perceptions of each city, as well as the locations and types of commercial establishments.
3.3. Comparability between the Cities
We performed a cluster analysis, using the k-means method and considering four classes, regarding (i) characterization attributes of the cities (presented in
Table 2) and each city’s hierarchical class within its urban network (presented in
Table 3); (ii) UFT problems; and (iii) UFT solutions.
Table 9 presents the groups resulting from cluster analysis for each analysis.
This characterisation allows us to reach the conclusion that, for example, Betim, Joinville, and Niteroi have notable similarities in the structure of the variables considered in the cities’ characteristic and hierarchical class analysis, despite the different socioeconomic, demographic, and spatial interaction attributes in their urban networks. The results from cluster analysis indicate little similarity between classes. The cities grouped both by characteristics and problem perception were (i) Betim and Niteroi and (ii) Palmas and Quixada. The cities grouped by characteristics and solutions were Caruaru and Palmas. This result shows the municipalities analysed in this paper are different in their economic and demographic aspects, although they may have similar characteristics; for example, the number of inhabitants.
4. Discussion
The results indicate that public policies for urban freight mobility need to be defined locally, and that there is no single recipe for success. Public policies can be understood as directive guiding principles for the public administration; they are rules and procedures for the relationship between the public administration and society, or between the actors of society and the state. The public policies are, in this case, explicit policies systematised or formulated in documents (laws, programs, and lines of financing) that guide actions, usually involving the application of public resources. However, compatibility between interventions, declarations of intention, and real actions is not always obvious. Additionally, non-actions or omissions must be considered, since they represent additional options and orientations of those who occupy managing positions [
29] (p. 2).
In Brazil, public managers may feel discouraged from adopting measures to organise and restrict freight movements as those actions are considered unpopular. They may feel discouraged because those who are “disadvantaged” due to the restrictions on freight vehicles are the carriers and retailers, and these groups are strong opinion influencers and political actors. Occupants of elected positions, who are chosen by popular approval, may find it unappealing to contradict the interests of such an important portion of voters (even though they are a minority).
On the other hand, the performance of active political actors in Brazilian civil society is still going through a consolidation process. Representative entities from different segments do not seem to fully exercise their role in promoting widespread support (or pressure) for any particular subject under discussion. This relative lack of societal organisation can mean that groups that are more organised and/or have better access to decision-makers will make their positions preponderate, even when this does not necessarily represent the opinion or desire of the majority [
30] (p.143).
In this context, it seems to be of fundamental importance to carry out studies such as the one presented in this paper in order to increase the knowledge of stakeholders on these matters. Asking about and discussing the problems of urban freight transport can eventually open stakeholders’ minds and eyes, so that they might become active in the discussion and development of public policies that influence the decision-making process. In this way, the problems arising from most Brazilian public managers’ lack of technical knowledge could be minimized.
Additionally, it is necessary to consider off-peak delivery and regulation of loading and unloading areas as solutions for urban transportation in the elaboration of public policies. Such measures are commonly adopted, but if they are not well discussed and planned can bring problems for retailers at the time of implementation.
The results of this study identified that the city of Betim stands out as the only studied city with a convergence of retailers’ opinions about OHD. In general, the respondents in Betim believe that off-peak delivery and the use of financial incentives for the same could be a satisfactory solution. This perception is antagonistic to that of retailers from other cities. It would be interesting to investigate in more detail the characteristics of the establishments surveyed in Betim and its surrounding areas to identify possible elements that operationally enable night delivery.
In order to understand freight system distribution, it is necessary to understand its role and its complexity, and the participants involved in this distribution process are all elements that contribute to this complexity. The actors involved in the urban distribution of goods have different objectives, generating conflicts in the interests and behaviour of those involved [
31]. The conflicts of interest between the actors are evident, but are initially not important because they are dependent on each other; the carrier focuses its efforts to maintain the level of service adequate for the retailer with an understanding of the requirements for the service, and in turn the local authorities work within a promise of keeping the city clean, safe, and attractive. It is due to this promise that citizens can enjoy a habitable environment in which the consumption of goods can be practiced without causing any disturbance that is detrimental to the environment [
32].
It is from the understanding of the complexity of these relationships and interests that logistics services should start to offer increasingly efficient transportation operations. Thus, although it is recognized that the multiple actors involved in the process of urban freight distribution should participate in the transportation system planning process, the Brazilian reality currently limits decisions to the delivery service providers and public authority, both in terms of scientific research and practical applications. At least in Brazil, retailers are usually neglected in terms of participation in the broad planning process, although the measures proposed by local authorities have a direct impact on services. Given this, this research has sought a more in-depth analysis of retailer groups—a key part of the process, but ultimately neglected in planning and scientific research in Brazil.
Finally, reinforcing the impact of localisation and local characteristics on the effectiveness of urban logistics measures, it should be noted that the municipalities with most similar features are (i) Betim and Niterói; (ii) Palmas and Quixada; and (iii) Palmas and Caruaru. The two last pairs of cities are located in the North and Northeast regions. Thus, the investigation of urban and regional attributes is justified in order to identify possible patterns concerning UFT, as well as relevant problems and solutions. This local approach could allow modelling that is closer to reality and, therefore, achieves greater effectiveness in the implemented solutions.
5. Conclusions
This paper presents an analysis of urban freight transportation in Brazilian cities. We collected data in 1882 commercial establishments in nine Brazilian cities from different regions, with different demographic, economic, and morphological characteristics. We identified the problems and solutions related to urban freight transport from the retailers’ point of view.
Results indicate that the availability of appropriate spaces for loading/unloading operations is the main problem perceived by the retailers in Betim, Caruaru, Contagem, Palmas, Recife, and Sorocaba. In Joinville and Niteroi, the movement of goods is the main problem. In Quixada, the main problem is the transit of vehicles.
Regarding possible solutions, off-peak delivery is considered a good solution for the retailers of Caruaru, Joinville, Palmas, and Recife. If there is a financial incentive, the retailers of Betim, Quixada, and Sorocaba consider this solution important. In Niteroi, the best solution is the regulation of parking spaces and, for the retailers of Contagem, restriction on freight vehicles is the preferred solution.
Different perceptions are noted in different cities, so we highlight the importance of studying the local context and promoting the involvement of stakeholders in urban freight transport planning. Public policies should consider the particularities, customs, and perceptions of each city, as well as establishments’ locations.
Furthermore, Caruaru and Palmas present similar characteristics and similar perceptions of solutions. This result indicates that generalisations are not possible unless the different attributes that are relevant to the effectiveness of urban delivery are considered.
For future analysis, we suggest comparing cities with public policies addressing urban freight transport with the cities surveyed in this paper. It would be interesting to identify if the results obtained in this paper differ from reality in municipalities that have already implemented public policies regarding urban freight transport.

 ,
, 


