Evaluation and Utilization of Thermal Environment Associated with Policy: A Case Study of Daegu Metropolitan City in South Korea


1
Department of Landscape Architecture, Keimyung University, 1095 Dalgubeol-daero, Daegu 42601, Korea
2
Department of Architecture, Graduate School, Keimyung University, 1095 Dalgubeol-daero, Daegu 42601, Korea
3
Department of Environmental Planning, Keimyung University, 1095 Dalgubeol-daero, Daegu 42601, Korea
*
Author to whom correspondence should be addressed.
Sustainability 2018, 10(4), 1179; https://doi.org/10.3390/su10041179
Submission received: 28 February 2018
/
Revised: 2 April 2018
/
Accepted: 10 April 2018
/
Published: 13 April 2018
Abstract
:This study aimed to propose a way to utilize vulnerability assessment effectively in policy-making by conducting policy-related assessment of the thermal environment. For this purpose, a variety of indices concerning thermal vulnerability assessment were reviewed, and finally, 15 indices were selected. In addition, adaptation policies for climate change applied to Korean cities were synthesized and examined to establish policies for improving thermal environments which correspond to 15 indices. Finally, a framework consisting of five areas (improvement of the atmospheric environment, expansion of eco-friendly buildings, management of the surface, cool spot creation and revitalization of communities), 15 indices and 25 policies was proposed. As a result, 15 vulnerability maps based on the standardized indices and a comprehensive map with four classes were established for Daegu Metropolitan City in South Korea. Based on the maps, Guji-myeon and Ansim-1-dong were found to be the most vulnerable areas. Hence, the causes of the thermal environment vulnerability and the policies for improving urban thermal environment were analyzed in these two areas using the proposed framework. Guji-myeon was necessary to more actively implement policies regarding the improvement of the atmospheric environment, management of the surface, and revitalization of communities. To improve the thermal environment of Ansim-1-dong, active policy implementation was required in all five areas. The results of this study are expected to contribute to the effective establishment of thermal environment policies by policy-makers.
1. Introduction
Various environmental problems, such as deterioration of the thermal environment, flood occurrence, and air pollution have intensified in urban areas owing to the effects of global warming resulting from climate change. Solar radiation is the main cause of the increase in air temperature. Heat transfer from the surface to the atmosphere has increased because of the change in thermal properties of surface materials [1,2,3]. Exhaust airflow and radiant heat have increased from increased air conditioner use and exhaust heat from factories and automobiles, thereby raising the temperatures of city atmospheres. In addition, the total area that reflects and absorbs sunlight has expanded owing to the high heat capacity of building materials, such as concrete. Higher heat absorption of buildings and lower radiation cooling have led to high building temperatures, which then increases air conditioning usage and artificial exhaust airflow [4,5,6,7,8,9]. As the pavement surface area has expanded because of artificial materials such as asphalt, the green belt and water surface areas have shrunk. Consequently, evapotranspiration from the surface has decreased, causing the surface and atmospheric temperatures to rise [10,11,12]. Therefore, it is necessary to locate areas vulnerable to thermal environment intensification due to climate change, identify the causes of the vulnerability, and establish policies to improve the situation.
The Intergovernmental Panel on Climate Change (IPCC) defined vulnerability as a function of the character, magnitude, and rate of climate change and variation to which a system is exposed as well as its sensitivity and adaptive capacity [13]. Hence, vulnerability to the thermal environment should be evaluated by considering exposure, sensitivity and adaptive capacity. Globally, studies have been conducted to assess climate change vulnerability according to this definition for using the results in policy establishment and institutionalization [14]. However, the lack of information on how to reduce the vulnerability based on this assessment limits its use by policy-decision makers [15].
Daegu Metropolitan city is one of most vulnerable cities to excessive heat events in South Korea. Hence, studies on effective policies as well as analysis and assessment methods of the urban thermal environment have been conducted. These studies have included an evaluation method of the spatial characteristics for creating wind ventilation paths in Daegu region [16], the expansion and operation of the policy ‘clean-road system’ for spraying water on roads [17] and an analysis of the thermal environment based on satellite images and Automatic Weather System (AWS) data [18]. In addition to efforts by vulnerable local governments to reduce excessive heat events and to manage the impacts of climate change, the Korean government has established the ‘comprehensive basic plan for climate change response’ and the ‘comprehensive national adaptation plan for climate change’ to respond and adapt to climate change at the legal level. In particular, since 2010, the government has made legal efforts by enacting the ‘Low-carbon Green Growth Act’ which obliges local governments to establish a detailed implementation plan for climate change adaptation measures. To establish this plan, local governments classify climate change vulnerability into seven categories, including health, disasters, agriculture, and forests. In addition, the Ministry of Environment and the Korea Adaptation Center for Climate Change operate the ‘vulnerability assessment tool to build climate change adaptation plan (VESTAP)’ which contains basic data on climate change vulnerability and vulnerability assessment function to indirectly help local governments establish a detailed adaptation plan for climate change [19]. However, as the specific improvement policy has not been presented according to the results of vulnerability assessments, policy decision-makers are limited in their utilization of the results. Hence, a policy-related assessment on thermal environment vulnerability is necessary to allow effective consideration of the thermal environment in policy-making.
In this study, we aimed to propose a way to utilize vulnerability assessment effectively in policy-making by conducting policy-related assessment of the thermal environment. For this purpose, we selected assessment indices by examining previous studies involving the assessment of thermal environment vulnerability in Korea and other countries. We also reviewed the thermal environment improvement policies implemented and planned in Korea to select applicable policies for Korea. Based on the results of this review, we suggested an assessment index-policy linking framework and applied it to Daegu Metropolitan City. Based on the assessment results, we determined the areas that are most vulnerable to the thermal environment and suggested improvement policies for parameters that were the cause of vulnerability. This study shows a method for the strategic application of climate change adaptation policies through policy-related assessment of thermal environment vulnerability, and it is expected to contribute to the effective establishment of thermal environment policies by policy-makers.
2. Materials and Methods
2.1. Study Area
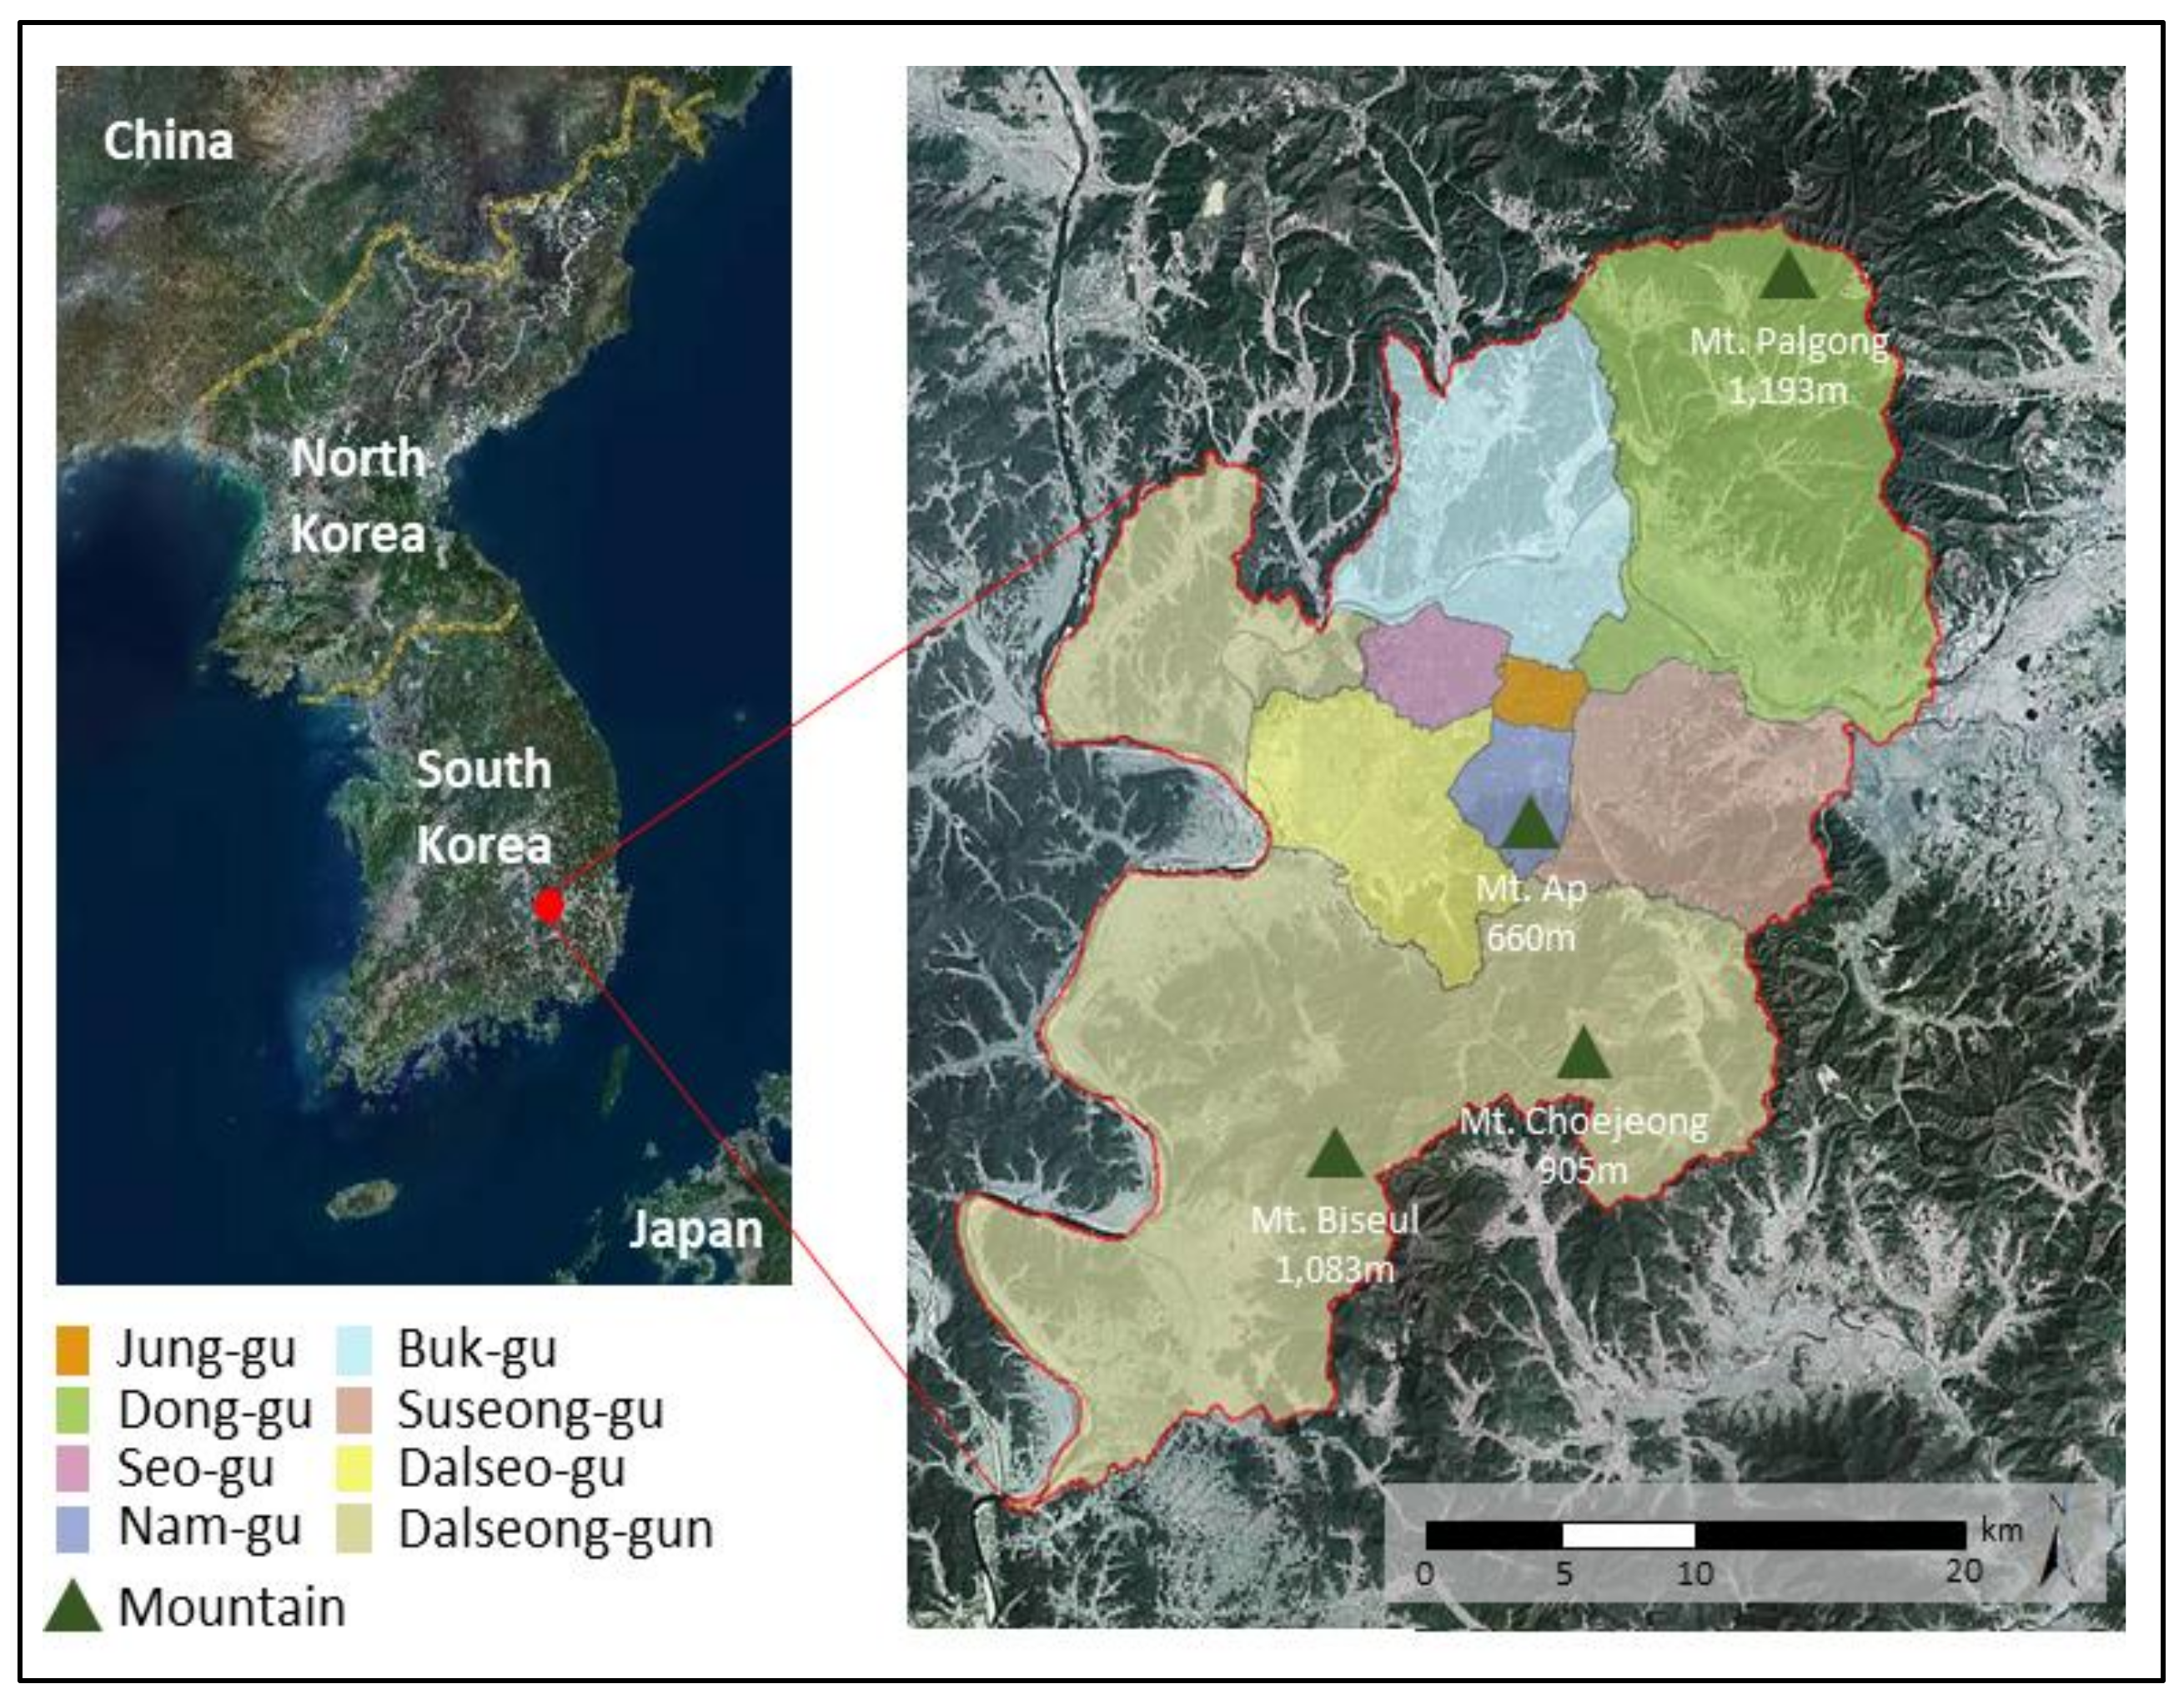
Daegu Metropolitan City in Korea was selected as the study area to investigate the utility of the policy-linked thermal vulnerability assessment. Daegu Metropolitan City is one of the six metropolitan cities in Korea and is located on the Southeastern Korean peninsula (Figure 1). It is a basin structure surrounded by mountains—Mt. Palgong to the Northeast, Mt. Biseul and Mt. Apsan to the south. The total area is 884.1 km2, of which 798.0 km2 (90.3%) is urban and 85.6 km2 (9.7%) is non-urban (Table 1). About 2.5 million people live in Daegu Metropolitan City, which is divided into 8 districts and 139 counties. Six of the districts are 100% urban. Only Dalseong and Donggu include non-urban areas.
Among the 17 cities and provinces in Korea, Daegu Metropolitan City is known to be the most vulnerable to heat waves, and its death rate per 100,000 people due to heat is the highest. This city has five automatic climate observation sites that are operated by the Korea Meteorological Administration as infrastructure for measuring the thermal environment. The number of meteorological observation stations is low relative to the area of Daegu Metropolitan City; thus, the thermal vulnerability of Daegu Metropolitan City cannot be identified sufficiently.
2.2. Establishment and Application of an Assessment Index-Policy Linking Framework
The establishment of an assessment index-policy linking framework and its application were conducted in three steps (Figure 2). The first step was to select the assessment indices for thermal environment vulnerability and link them with the thermal environment improvement policy through a literature review. The second step was to evaluate the thermal environment vulnerability of the study area based on the selected indices. The third step was to select vulnerable areas based on the vulnerability assessment results and propose improvement policies based on the causes of the vulnerability.
2.3. Thermal Environment Vulnerability Assessment
The vulnerability analysis method specified in the “Urban Climate Change Vulnerability Analysis and Usage Guidelines” from the administrative regulation of the Ministry of Land, Infrastructure and Transport was used to assess the thermal environment vulnerability. Local governments in Korea commonly use this method to assess vulnerability owing to climate change. To assess the vulnerability of spatial data established by ArcGIS v.10.2., the following methods were utilized: the Z-score standardization method to directly compare different indices with different measurement units; Jenks optimization method to classify indices using natural breaks in Z-score values; and a simple matrix approach to derive four grades of thermal environment vulnerability based on exposure-related indices (including adaptation-related) and sensitivity-related ones.
2.3.1. Z-Score Standardization
To analyze vulnerability, a standardization process is required that enables direct comparison between different analysis indices with different measurement units. For this purpose, the calculated values utilizing the commonly used Z-score method [20] (Equation (1)) were converted to standardized indices (Equations (2)–(4)), and the values were computed for each grid. Z-scores range from negative to positive values, and the degree of deviation from the mean can be derived from the measured values by setting the standard deviation in units. The standardized index is a value obtained by converting the Z-score to a value between 0 and 1.
where, is the for each zone (), is the measured value of the analysis index () for each zone (), is the mean of the analysis index () for the entire zone, and is the standard deviation of the analysis index () for the entire zone.
where is the standardized index for each zone (), and a and b were calculated as follows:
In this case, is the maximum value of the entire zone, and is the minimum value of the entire zone.
2.3.2. Matrix Method
To derive a grade using the matrix method, the standardized indices calculated for each analysis were classified into climate exposure and sensitivity categories according to the IPCC vulnerability concept. The standardized indices for all categories were averaged. The indices corresponding to adaptability were included in the climate exposure category. The natural classification method (Jenks’ optimization method) was used to classify the grading section for each category. The analyzed values were classified into grades 1–4. Grade 1 indicates the most vulnerable area. Lastly, the results of the thermal environment vulnerability assessment were derived by the matrix method using the grades in both the climate exposure and sensitivity categories.
3. Results and Discussions
3.1. Policy-Related Vulnerability Assessment of the Thermal Environment
3.1.1. Thermal Environment Improvement Policy
To present the applicable policies in Korea, we reviewed the thermal environment improvement policies presented in the First Implementation Plan for Climate Change Adaptation Measures (2012–2016), which was established in 16 Korean cities. The examined policies were classified into five areas related to the improvement of the thermal environment: improvement of the atmospheric environment, expansion of eco-friendly buildings, management of the surface, creation of cool spots, and revitalization of communities (Table 2). The policies for improvement of the atmospheric environment included securement of a database (such as an expansion of heat wave monitoring systems [21,22,23,24,25,26], establishment of heat wave and ultraviolet ray research institutes [22], and determination of vulnerable classes to heat waves [27]) and wind path plans [27,28]. To increase the number of eco-friendly buildings, policies for residential environment improvement projects [25,26], cool loops [27,29], green walls [22], etc., were proposed. Management policies for surfaces included expansion into surfaces where evaporation is possible and the amount of heat absorption is low (such as artificial mulching greening projects [25] and the ecological river restoration policy [27,30]). The policies for the creation of cool spots mainly related to the expansion of green areas, such as roadside tree planting [26,27,28], biotope formation [28], urban forest creation [26,27,28], ecological park construction [26,27], and rooftop greening [27,31,32]. Lastly, concerning the revitalization of communities, there are support services for vulnerable classes (management of patients with cardiovascular diseases [21,27,33], establishment of monitoring systems for classes vulnerable to the thermal environment [23], help services for the elderly living alone [28,29], and operation of heat wave shelters [25,26,27]) and policies related to building medical support systems, such as emergency medical support systems and emergency medical service improvement [23,26,34].
3.1.2. Selection of Indices for Vulnerability Assessment
To select vulnerability assessment indices, we reviewed 35 domestic and foreign studies on the assessment of thermal environment vulnerability. To link the examined assessment indices with policies, they were divided into five areas: improvement of the atmospheric environment, expansion of eco-friendly buildings, management of the surface, creation of cool spots, and revitalization of communities (Table 3). Improvement of the atmospheric environment included many indices that are directly affected by rising temperatures. In particular, the indices of temperature such as daily maximum temperature and daily minimum temperature have been utilized the most [38,39,40,41,42,43,44,45,46,47,48,49,50,51,52,53]. Thermal comfort felt by people living in cities has been utilized as an assessment index for evaluating the thermal environment [44,46,47]. Air pollution factors, such as fine dust and ozone, also were considered as indices [44]. Additionally, the expansion of eco-friendly buildings included indices of buildings that are more sensitive to a deteriorated thermal environment, such as older housing [45,51,54], poor residential areas [14,45,51], and indices of classes that are not actively engaged in economic measures. In the management of the surface, the surface temperature was used as an assessment index [54,55,56,57]. The indices regarding ground coverage that increased the temperature of the surface [58,59,60], such as road ratio, were also utilized. The cool spot creation included measures to reduce temperature or avoid the deteriorated thermal environment in the short and long terms, such as expansion of water and green zones [39,56,61] and wind paths [14], and installations of heat wave shelters [14,53,54] and air conditioners [54,57,60]. Lastly, indices related to age [38,39,40,41,42,43,44], poverty [60,61,62], isolation [38,54,61], disease [54,55,61], health and medical systems [42,43,44], and municipal finances [42,43,46] were included in community revitalization.
The assessment index–policy linking framework is shown in Table 4. Fifteen indices were selected based on their feasibility as space planning policies. The selected indices were divided into five areas related to the improvement of the thermal environment. The improvement of the atmospheric environment included four indices: daily maximum temperature, daily minimum temperature, thermal comfort (heat index) index, and the air pollution index. In addition, the expansion of eco-friendly buildings had three indices: building surface area, buildings constructed before 1980 when insulation was not legally required, and the number of basic livelihood security recipients. Management of the surface included two indices: road ratio and surface temperature. The creation of cool spots involved one index: the water to green zone ratio. Lastly, the revitalization of communities included five indices: the number of elderly living alone, the number of people aged 65 and over, the number of people aged 5 and under, the number of agricultural workers exposed to harsh outdoor conditions, and the number of cardiovascular disease deaths.
The policies in response to these vulnerability indices included the acquisition of thermal environment observation equipment for improving the air quality, the implementation of alternative-day-no-driving systems during heat waves, the creation of wind paths, the activation of renewable energy, and the supply of electric vehicles. The expansion of eco-friendly buildings included the provision of cool roofs, maintenance of old buildings, wall greening, expansion and maintenance of heat wave shelters, and encouragement to use finishing materials for reducing heat. In addition, the management of the surface included clean-road implementation, concrete pavement block replacement, shade canopy installation, expansion of shade trees, and construction of city water circulation systems using the Low Impact Development (LID) technique. The creation of cool spots included the creation of pocket parks, restoration of rivers, development of road-side strip green belts, expansion of school forest projects, and support for rooftop greening. Lastly, the revitalization of communities included heat wave awareness promotion and educational activities, care for the elderly, maintenance of rural areas, construction of hyperthermia patient monitoring systems, and citizen empowerment. The proposed policies may be supplemented or modified according to the characteristics and circumstances of each local government.
3.2. Thermal Environment Vulnerability of Daegu Metropolitan City
3.2.1. Establishment of Spatial Data for Daegu
A detailed description of the database for each index is shown in Table 5. The data for the assessment was collected through Korean governmental agencies and the US Geological Survey. The spatial resolution of the data for each index was finalized based on a 30 × 30 m grid. The number of days with a daily maximum temperature above 33 °C, the number of days with a daily minimum temperature above 25 °C, and thermal comfort (heat index) were established utilizing the results of the local forecasting model of the Korea Meteorological Administration (LDAPS). Although thermal comfort is a very consolidated topic [63], the choice of a reliable metric for its assessment in urban areas is not an easy issue, due to the need for easy calculation and a reduced number of measurements [64,65]. Not secondarily, most common indices are formulated for specific climatic areas [64]. For the purpose of this investigation, we used the heat index (HI) (°C), a temperature–humidity index formulated by Steadman (Equation (5)) that has been used in previous studies carried out in Korea [66,67] and has been adopted by US National Oceanic and Atmospheric Administration.
The concentrations of PM10 (Particulate Matter) were obtained by using the data from 12 observation sites operated by Air Korean in the Daegu area. The area of water and green zones was extracted from a Ministry of Environment land cover map. The surface areas of buildings and buildings constructed before 1980 were obtained by using the Korea National Spatial Data Infrastructure Portal’s GIS building integrated information data. Statistics Korea provided data on the number of basic livelihood security recipients and the number of cardiovascular disease deaths. The road ratio was extracted using the National Geographic Information Institute’s continuous topographic map, and the thermal band of Landsat 8 was utilized for surface temperature. The number of elderly living alone, the number of people aged 65 and over, the number of people aged 5 and under, and the number of agricultural workers were obtained through the Soil Groundwater Information System (SGIS).
3.2.2. Assessment of Thermal Environment Vulnerability for Daegu
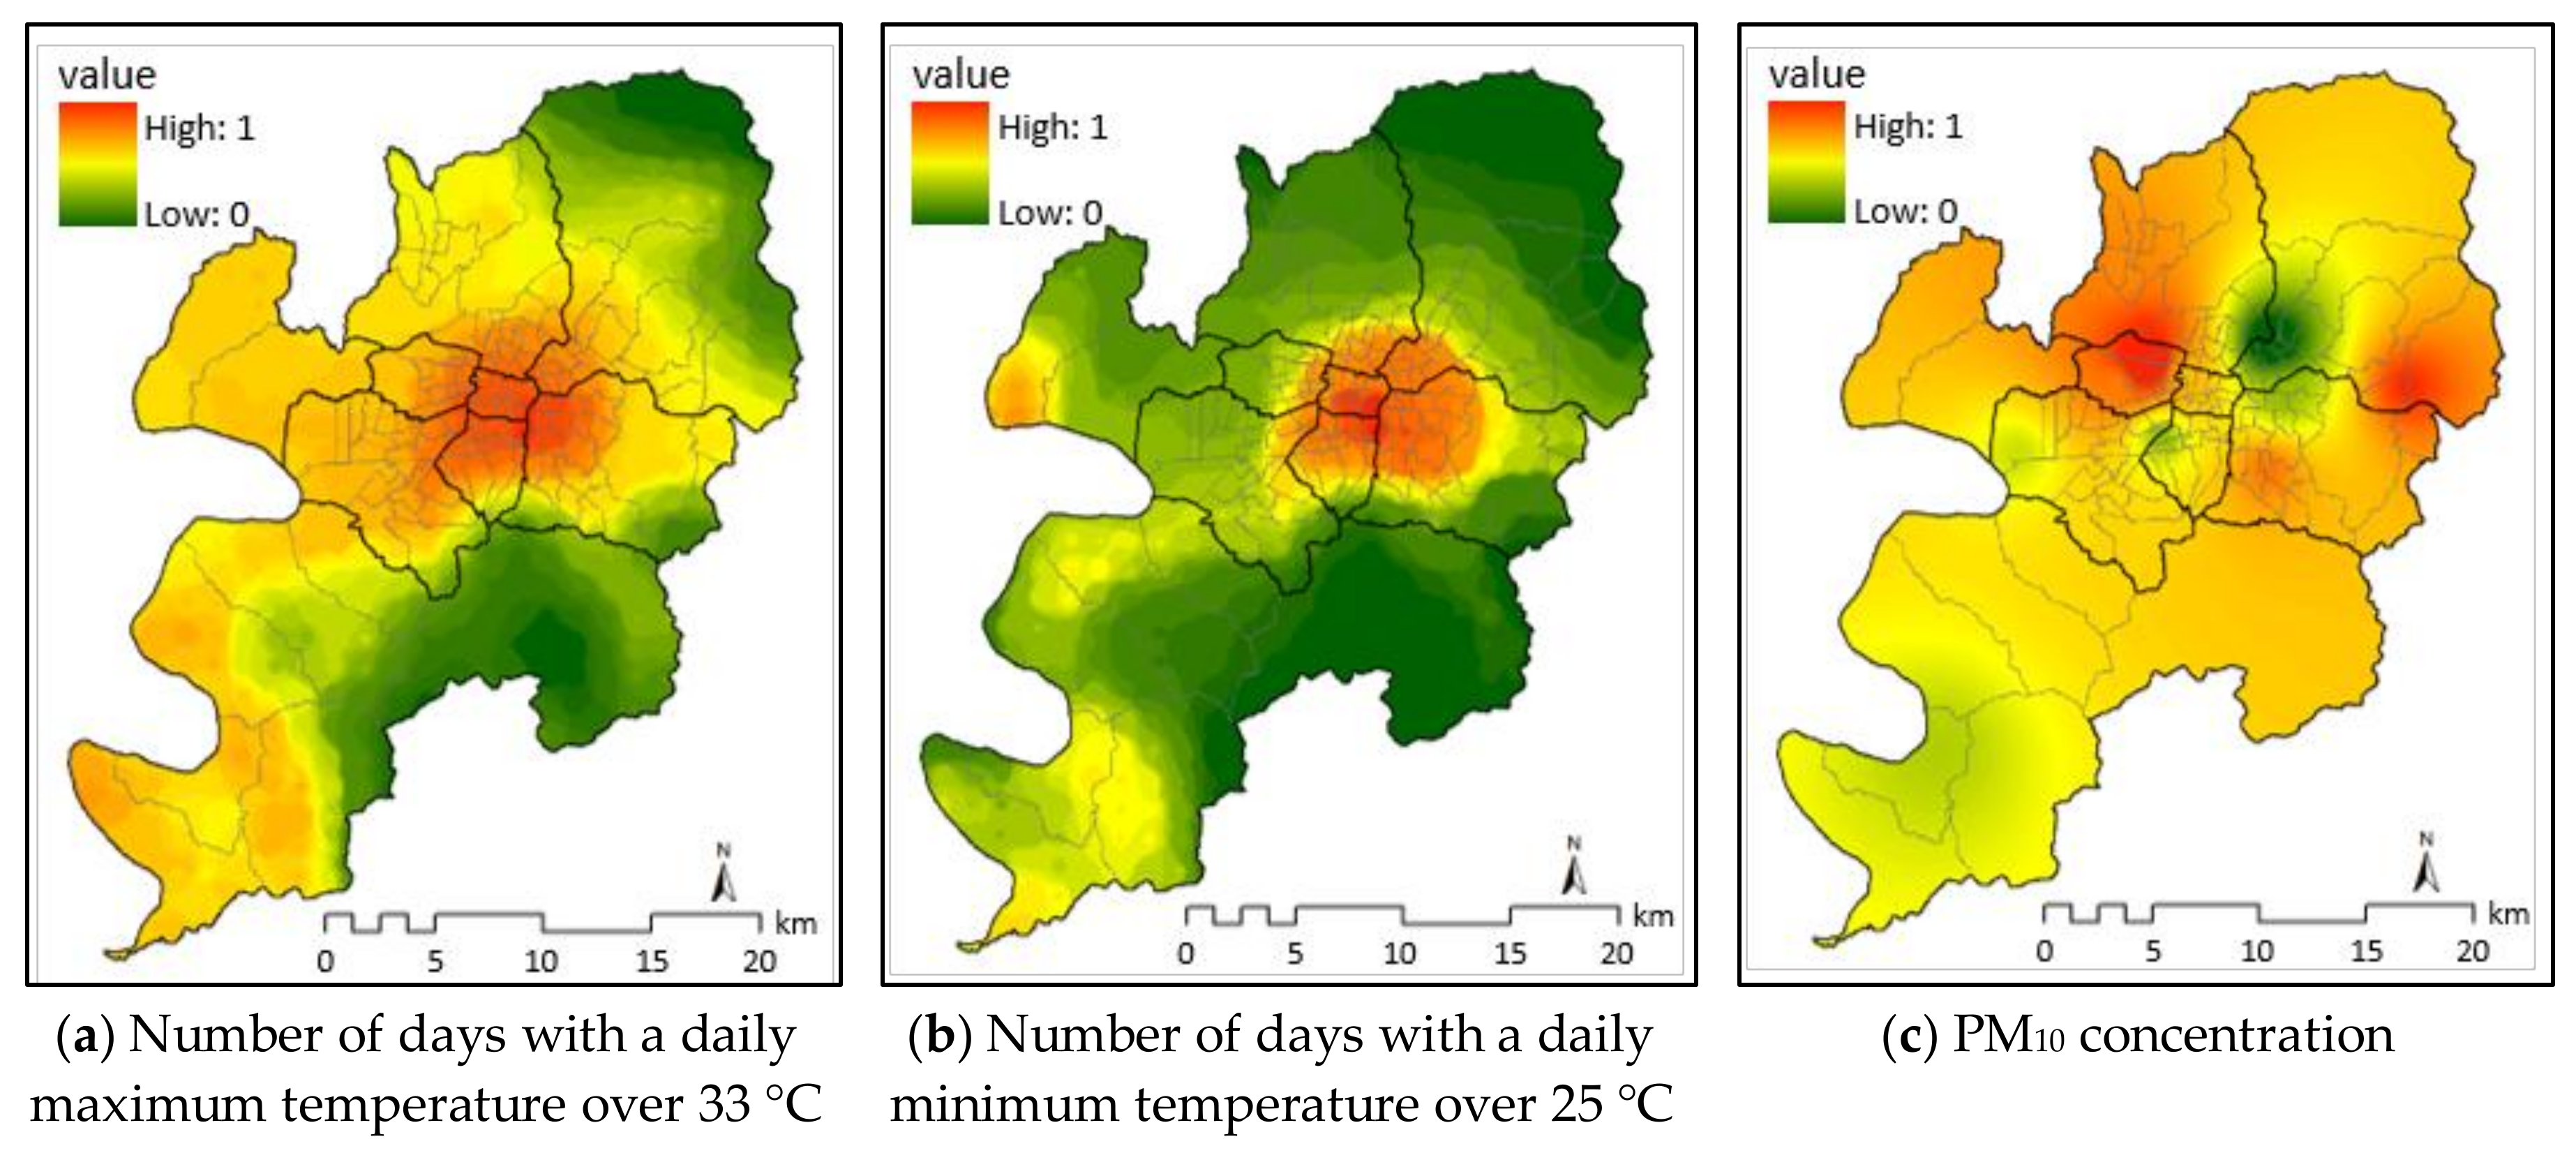
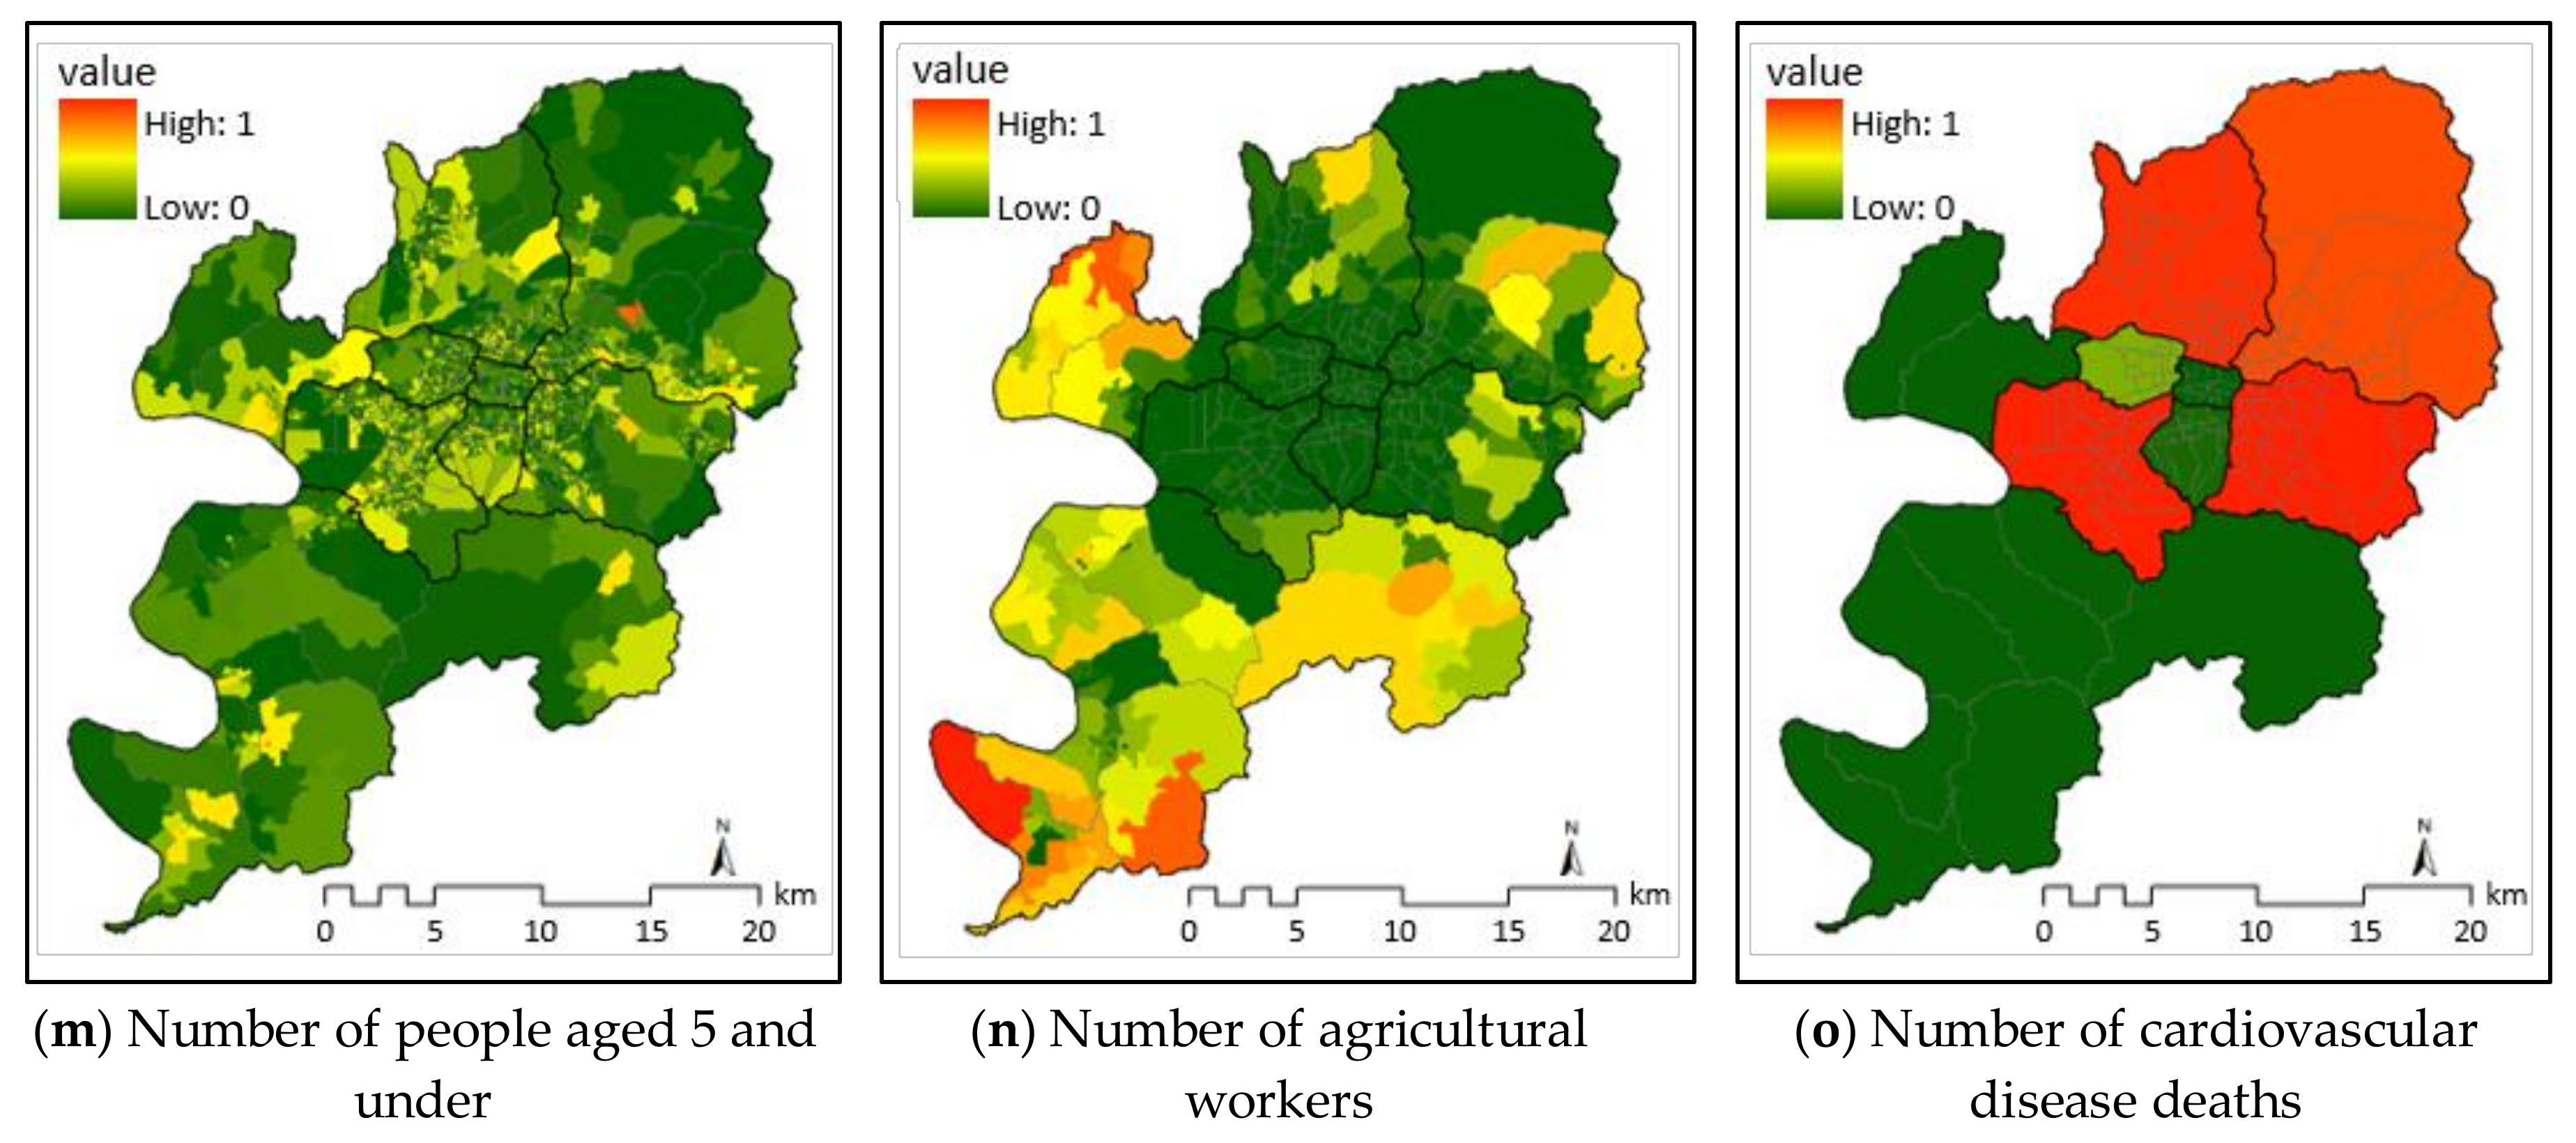
To directly compare different analysis indices with different measurement units, 15 indices were converted to standardized indices using the Z-score method (Figure 3). The standardized indices regarding the number of days with a daily maximum temperature above 33 °C, the number of days with a daily minimum temperature above 25 °C, and buildings constructed before the 1980s were high in Jung-gu, the center of Daegu Metropolitan City. The PM10 concentration was high in Northwestern Seo-gu and Southeastern Dong-gu. It was considered that the general industrial complex located in Seo-gu and the Daegu fuel industrial complex in Dong-gu generated significant amounts of PM10. The surface temperature, road ratio, and water to green zone ratio showed high values in the urban areas of Daegu Metropolitan City. The number of agricultural workers was high in Dalseong-gun, which is in the Western part of Daegu Metropolitan City. On the other hand, the number of basic livelihood security recipients, the number of people aged 65 and over, the number of people aged 5 and under, the number of elderly living alone, and the number of cardiovascular disease deaths are demographic and social factors and were distributed throughout Daegu Metropolitan City.
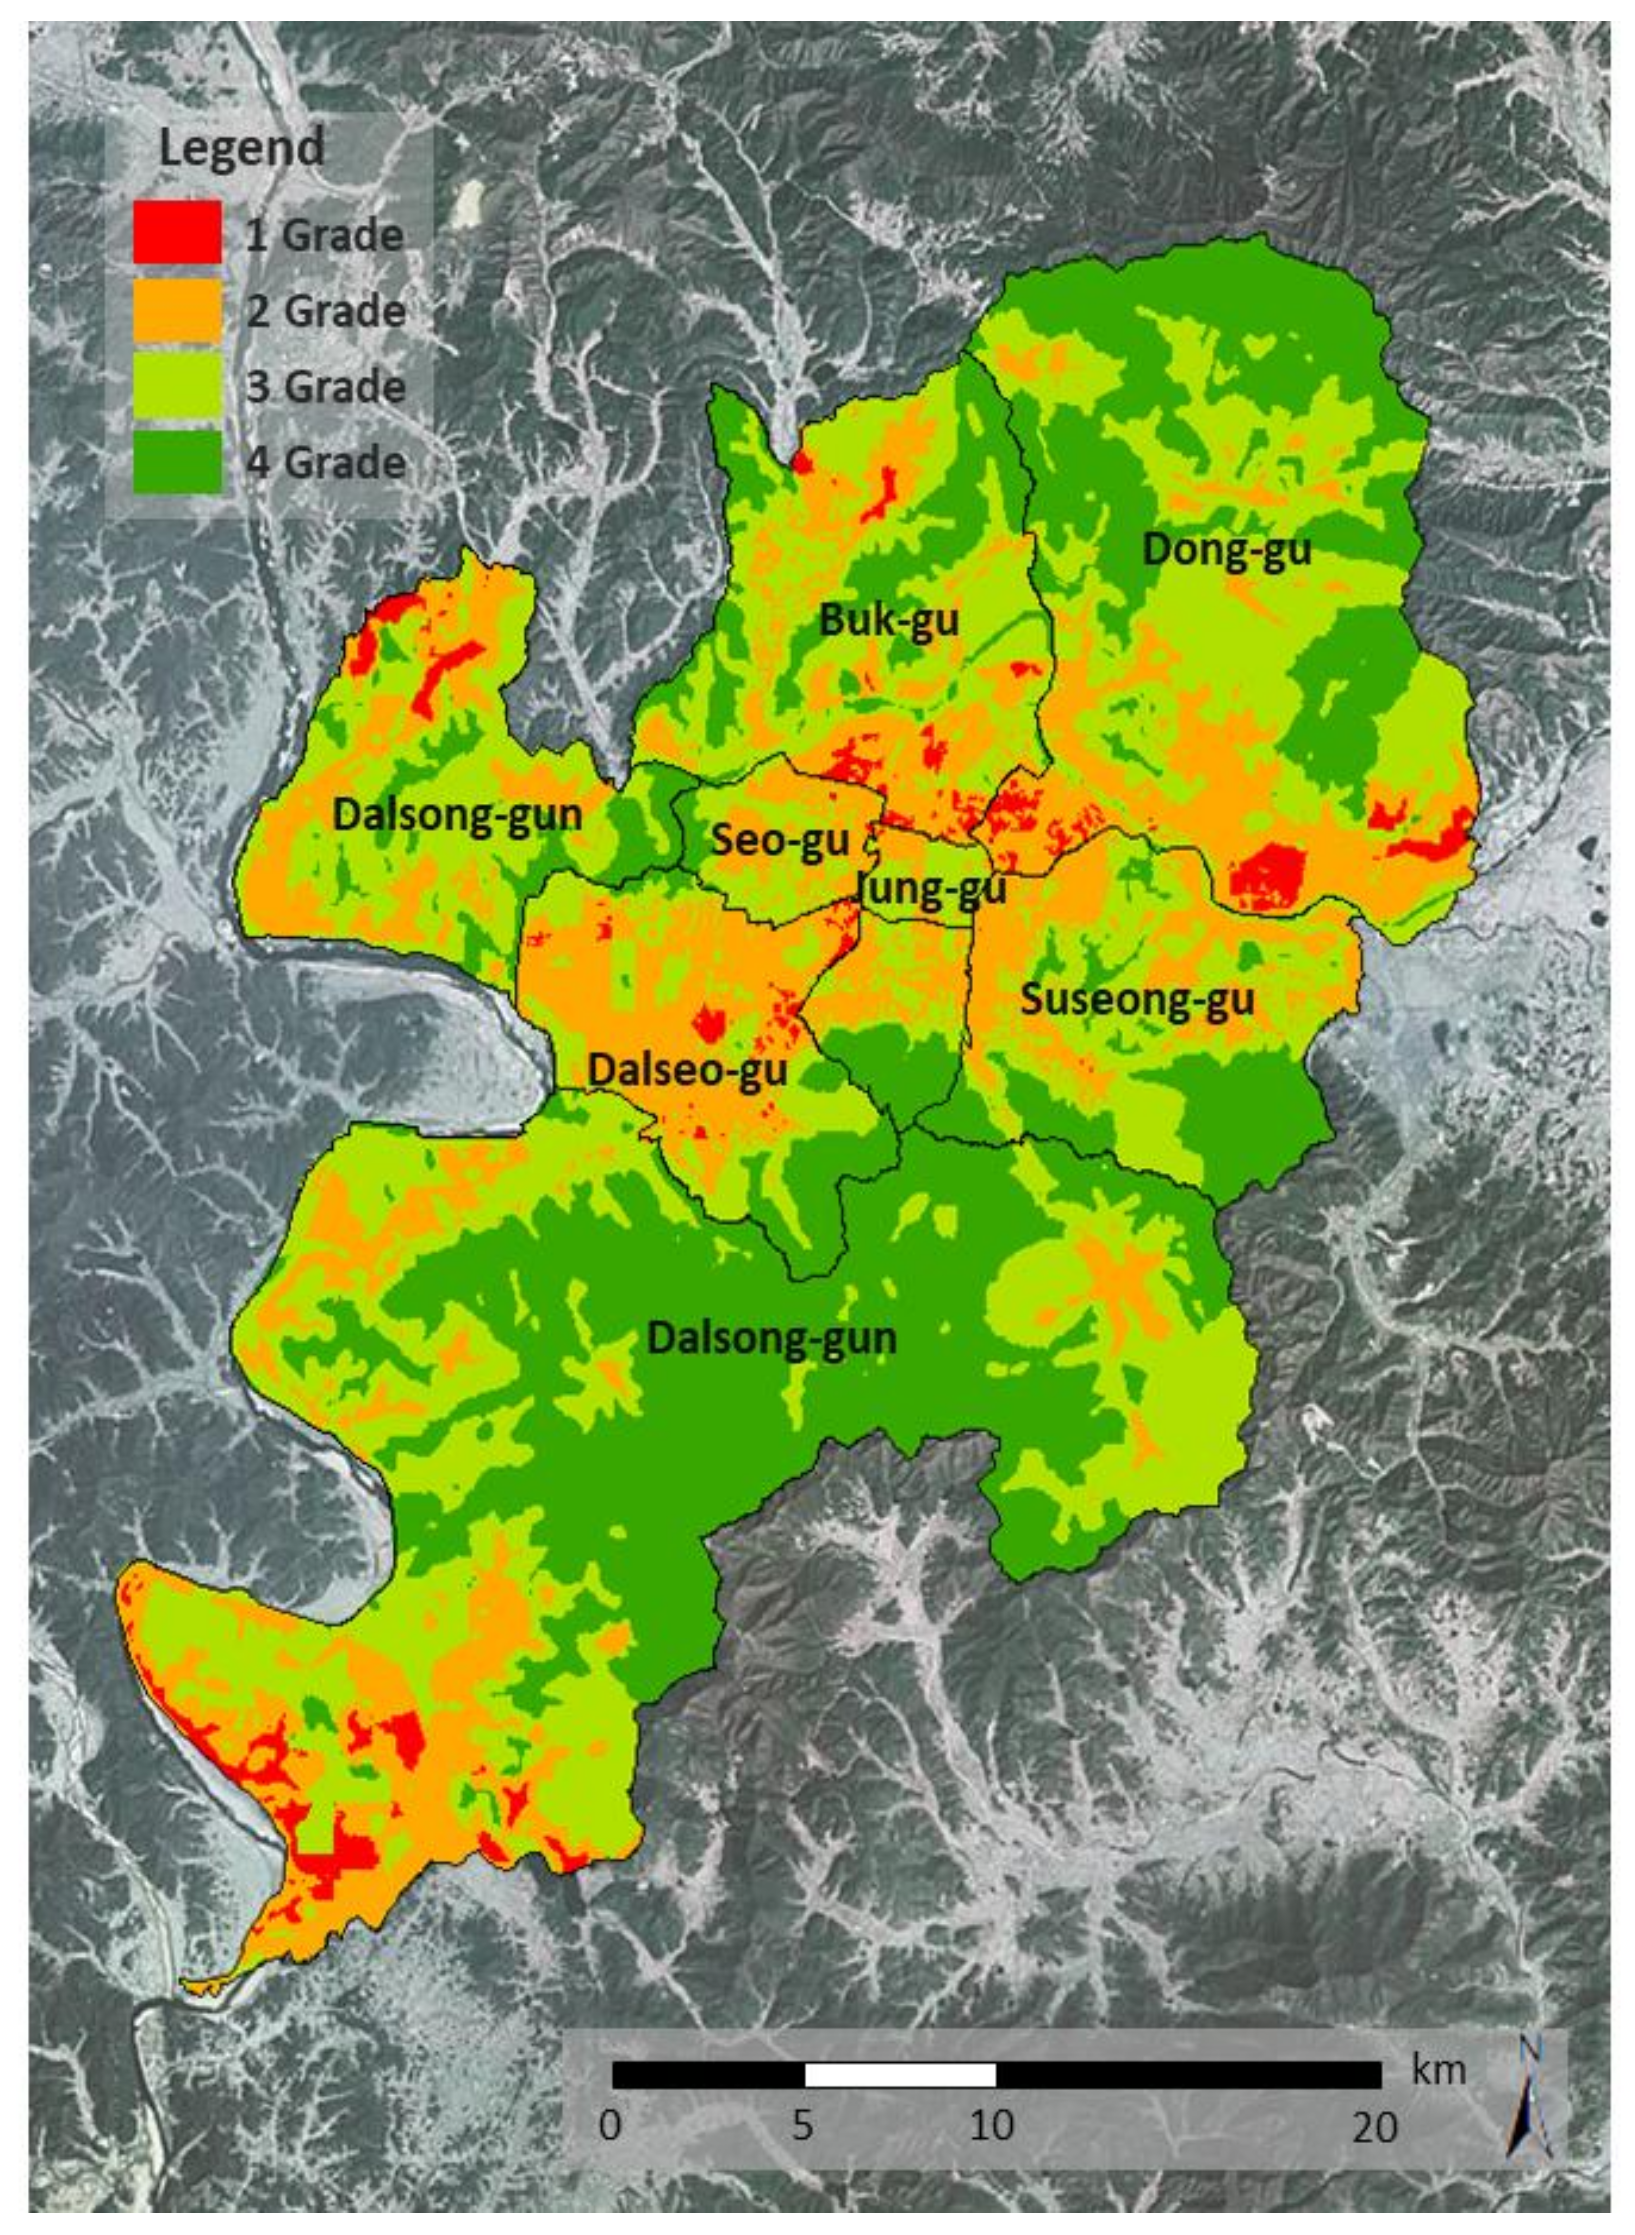
The thermal environment vulnerability of Daegu Metropolitan City was classified as grades 1–4 by integrating the individual indices converted into the standardized indices (Figure 4). The distribution of grades for the eight districts in areas and ratios are shown in Table 6. The area with the highest area ratio in the first grade (most vulnerable to heat) was Dong-gu (3.29%), followed by Dalseo-gu (3.28%) and Buk-gu (3.18%). The first-grade regions are located in Southern Dong-gu and in Northern and Southeastern Buk-gu. The first-grade region with the greatest area is Dalseong-gun (10.6 km2), followed by Dong-gu (5.95 km2). The reason why Dalseong-gun has a low ratio of first-grade regions relative to its area is that it has a greater non-urban area. The area with the greatest area of fourth-grade regions is Dalseong-gun (40.03%), followed by Dong-gu (37.72%) and Nam-gu (34.29%). The reason why Dalseong-gun and Dong-gu have the greatest area of fourth-grade regions may be that Mt. Biseul and Mt. Palgong occupy a large proportion of the total area. Mt. Apsan accounts for a large percentage of Nam-gu, which is the reason for its high area ratio of fourth-grade regions.
3.3. Suggestion for Utilizing Thermal Vulnerability Assessment Linked with Policy
3.3.1. Selection of Vulnerable Areas
The vulnerable areas were selected to identify the causes of thermal environment vulnerability and to suggest policies to mitigate these causes. The area and area ratios of the first-grade regions of the 139 counties in Daegu Metropolitan City were analyzed to select vulnerable areas (Figure 5). The area of the first-grade regions was less than 50 ha in 130 out of 139 counties (93.5%), of which 87 (62.6%) did not include any first-grade regions at all. On the other hand, three counties had more than 200 ha of first-grade regions: Guji-myeon in Dalseong-gun (552.69 ha), Habin-myeon in Dalseong-gun (249.75 ha), and Ansim-1-dong in Dong-gu (242.91 ha) (Figure 5a). Three counties had first-grade area ratios of 50% or more: Ansim-1-dong (70.35%), Sinam-1-dong (63.1%), and Sinam-3-dong (52.23%) (Figure 5b).
Guji-myeon (includes the greatest area of first-grade regions) and Ansim-1-dong (includes the highest area ratio of first-grade regions) were selected as the vulnerable areas. The general characteristics of these areas are shown in Table 7. Ansim-1-dong (D in Figure 6) is 3.5 km2 in area and has a population of 45,608 (as of 2018), and the Kumho River passes through its Southern section. It is divided into existing housing areas and areas for preparation of new housing sites, and the number of households is increasing according to movement into the new areas. Moreover, a low-income class is concentrated in this area. Guji-myeon (E in Figure 6) is 39.6 km2 in area and has 6571 inhabitants (as of 2018). In terms of natural environment, Mt. Danni is located in the Northwestern part, and the Nakdong River runs about 15.5 km along the Western boundary. Therefore, it is appropriate land for suburban agriculture.
3.3.2. Analysis of the Vulnerability Causes and Policy Recommendations
The standardized index for each index of the two areas was calculated to identify the thermal vulnerability causes (Table 8). In the case of Guji-myeon, the standardized index showed the highest value for thermal comfort (0.85), followed by the number of agricultural workers (0.76), temperature of the surface (0.68), and the number of days with a daily maximum temperature above 33 °C. In the case of Ansim-1-dong, the standardized index, from highest to lowest, was as follows: the number of basic livelihood security recipients (0.99), the number of cardiovascular disease deaths (0.79), thermal comfort (0.78), surface temperature (0.75), PM10 concentration (0.70), and water to green zone ratio (0.70).
Based on the results of this assessment, it is necessary to more actively implement policies regarding the improvement of the atmospheric environment, management of the surface, and revitalization of communities in Guji-myeon. Maintenance of rural areas, such as through heat wave promotion and educational activities and medical system improvement, should be carried out first for agricultural workers. To improve the surface temperature, policies such as shade installation, expansion of shade trees, and construction of water circulation through the city using the LID technique should be introduced. To cope with the number of days with a daily maximum temperature above 33 °C, policies such as the acquisition of thermal environment observation equipment for monitoring a detailed thermal environment and implementation of alternative-day-no-driving systems during heat waves should be given priority.
To improve the thermal environment vulnerability of Ansim-1-dong, active policy implementation is required in all areas. For basic livelihood security recipients with the highest scores, expansion and maintenance of heat wave shelters is necessary. These individuals face limitations in actively utilizing air-conditioning equipment, such as air conditioners, in a poor thermal environment. Therefore, heat wave shelters installed for the public should be expanded to regions where the population is concentrated. In addition, the equipment in existing heat wave shelters should be maintained. In terms of patients, publicity and educational activities on preventive measures against heat diseases are required. Furthermore, a database for the population with diseases susceptible to high temperature environments should be constructed to establish a hyperthermia patient monitoring system. To lower the surface temperature, concrete pavement blocks should be replaced with heat-reduced pavement blocks. Policies such as “clean-road” in which water is sprinkled on the road during heat waves, shade installation, and expansion of shade trees should be implemented first. To improve the PM10 concentration, it is necessary to determine the cause of fine dust. Renewable energy should be activated, and electric vehicle supply should be increased. To increase the water to green zone ratio, it is necessary to expand the green zone. However, it is difficult to secure a large green zone owing to the nature of Ansim-1-dong. Therefore, the creation of pocket parks utilizing leftover space, the development of striped green belts by the wayside, the expansion of school forest projects, and support for rooftop greening should be considered first. Ansim-1-dong has a high level of vulnerability in terms of thermal comfort, so restoration of rivers that may increase humidity should be avoided.
4. Conclusions
In this study, we aimed to propose a way to utilize vulnerability assessment effectively in policymaking by conducting policy-related assessment of the thermal environment regarding worsening urban environmental issues due to climate change. For this purpose, we examined previous studies on the assessment of the thermal environment vulnerability of Korea and other countries. We also reviewed the thermal environment improvement policies that have been implemented and planned in Korea to select applicable policies for Korea. Lastly, we presented a framework consisting of 15 indices in five thermal environment improvement areas (improvement of the atmospheric environment, expansion of eco-friendly buildings, management of the surface, creation of cool spots, and revitalization of communities) and 25 policies.
We analyzed the thermal environment vulnerability in Daegu Metropolitan City. Of the city’s eight districts, the region with the highest area of first-grade regions was Dalseong-gun, followed by Dong-gu. The area ratio of first-grade regions was highest in Dong-gu, followed by Dalseo-gu. The area with the greatest area and area ratio of fourth-grade regions was Dalseong-gun, because its non-urban area is greater than its urban area. Additionally, vulnerable areas were selected for identifying the cause of the thermal environment vulnerability and for suggesting policies. Of the 139 counties in Daegu Metropolitan City, Guji-myeon (the greatest area of the first-grade regions) and Ansim-1-dong (the highest area ratio of the first-grade regions) were selected as the vulnerable areas to investigate. Based on the standardized indices of 15 indices, the causes of the thermal environment vulnerability in the two areas were analyzed. The results showed that Guji-myeon was most vulnerable in terms of thermal comfort, number of agricultural workers, temperature of the surface, and number of days with a daily maximum temperature above 33 °C. Policies such as maintenance of agricultural areas, shade installation, expansion of shade trees, and acquisition of thermal environment observation equipment should be carried out first. Ansim-1-dong showed high thermal environmental vulnerability in the number of basic livelihood security recipients, the number of cardiovascular disease deaths, the thermal comfort, the temperature of surfaces, the PM10 concentration, and the water to green zone ratio. Therefore, policies such as the expansion and maintenance of heat wave shelters, establishment of a hyperthermia patient monitoring system, replacement with heat-reduced pavement blocks, shade installation, expansion of shade trees, promotion and provision of electric vehicles, and creation of pocket parks should be implemented first.
This study showed a method for strategic application of climate change adaptation policies using policy-related assessment on thermal environment vulnerability. An economic and institutional feasibility analysis of the results is planned in further study, and it is expected to contribute to the effective establishment of thermal environment policies by-policy makers.
Acknowledgments
This study was supported by National Research Foundation of Korea (NRF; Grant No. 2015R1C1A2A01052513) and Korea Agency for Infrastructure Technology Advancement (KAIA; Grant No. 18AUDP-B102560-04).
Author Contributions
Jeong-Hee Eum developed the research framework and wrote the manuscript. Kwon Kim performed research processes. Eung-Ho Jung and Paikho Rho consulted on the data analysis and manuscript development.
Conflicts of Interest
The authors declare no conflict of interest.
References
- Kim, Y.; An, S.M.; Eum, J.-H.; Woo, J.-H. Analysis of thermal environment over a small-scale landscape in a densely built-up Asian megacity. Sustainability 2016, 8, 358. [Google Scholar] [CrossRef]
- Lundgren, K.; Kjellstrom, T. Sustainability challenges from climate change and air conditioning use in urban areas. Sustainability 2013, 5, 3116–3128. [Google Scholar] [CrossRef]
- Eum, J.-H.; Scherer, D.; Fehrenbach, U.; Woo, J.-H. Development of an urban landcover classification scheme suitable for representing climatic conditions in a densely built-up Asian megacity. Landsc. Urban Plan. 2011, 103, 362–371. [Google Scholar] [CrossRef]
- Liu, W.; Feddema, J.; Hu, L.; Zung, A.; Brunsell, N. Seasonal and diurnal characteristics of land surface temperature and major explanatory factors in Harris County, Texas. Sustainability 2017, 9, 2324. [Google Scholar] [CrossRef]
- Morini, E.; Castellani, B.; Presciutti, A.; Anderini, E.; Filipponi, M.; Nicolini, A.; Rossi, F. Experimental analysis of the effect of geometry and façade materials on urban district’s equivalent albedo. Sustainability 2017, 9, 1245. [Google Scholar] [CrossRef]
- Tseng, Y.-C.; Lee, D.; Lin, C.-F.; Chang, C.-Y. The energy savings and environmental benefits for small and medium enterprises by cloud energy management system. Sustainability 2016, 8, 531. [Google Scholar] [CrossRef]
- Caruso, G.; Kämpf, J.H. Building shape optimisation to reduce air-conditioning needs using constrained evolutionary algorithms. Sol. Energy 2015, 118, 186–196. [Google Scholar] [CrossRef]
- Caruso, G.; Fantozzi, F.; Leccese, F. Optimal theoretical building form to minimize direct solar irradiation. Sol. Energy 2013, 97, 128–137. [Google Scholar] [CrossRef]
- Fantozzi, F.; Leccese, F.; Salvadori, G.; Tuoni, G. Energy demand analysis and energy labelling of new residential buildings in Tuscany (Italy). WIT Trans. Ecol. Environ. 2009, 122, 217–229. [Google Scholar]
- Alavipanah, S.; Wegmann, M.; Qureshi, S.; Weng, Q.; Koellner, T. The role of vegetation in mitigating urban land surface temperatures: A case study of Munich, Germany during the warm season. Sustainability 2015, 7, 4689–4706. [Google Scholar] [CrossRef]
- Lee, S.; Moon, H.; Choi, Y.; Yoon, D.K. Analyzing thermal characteristics of urban streets using a thermal imaging camera: A case study on commercial streets in Seoul, Korea. Sustainability 2018, 10, 519. [Google Scholar] [CrossRef]
- Wang, H.; Zhang, Y.; Tsou, J.Y.; Li, Y. Surface urban heat island analysis of Shanghai (China) based on the change of land use and land cover. Sustainability 2017, 9, 1538. [Google Scholar] [CrossRef]
- Intergovernmental Panel on Climate Change. Climate Change 2007: Impacts, Adaptation and Vulnerability; Contribution of Working Group II to the Fourth Assessment Report of the Intergovernmental Panel on Climate Change; Parry, M., Canziani, O., Palutikof, J., van der Linden, P., Hanson, C., Eds.; Cambridge University Press: Cambridge, UK, 2007; p. 976. [Google Scholar]
- Eum, J.H. Vulnerability assessment to urban thermal environment for spatial planning: A case study of Seoul, Korea. J. Korean Inst. Landsc. Archit. 2016, 44, 109–120. [Google Scholar] [CrossRef]
- Grothmann, T.; Petzold, M.; Ndaki, P.; Kakembo, V.; Siebenhüner, B.; Kleyer, M.; Yanda, P.; Ndou, N. Vulnerability assessment in African villages under conditions of land use and climate change: Case studies from Mkomazi and Keiskamma. Sustainability 2017, 9, 976. [Google Scholar] [CrossRef]
- Jung, E.H.; Kim, D.W.; Ryu, J.W.; Cha, J.G.; Son, K.S. Evaluation of spatial characteristic of wind corridor formation in Daegu area using satellite data. J. Korean Assoc. Geogr. Inf. Stud. 2008, 11, 73–84. [Google Scholar]
- Jung, E.H.; Rho, P.H.; Kim, H.D. Managerial plan of extended operation of the clean-road system for the improvement of the urban thermal environment in Daegu. J. Environ. Sci. Int. 2016, 25, 1589–1595. [Google Scholar] [CrossRef]
- Ahn, J.S.; Kim, H.D.; Kim, S.W. Effect of difference of land cover conditions on urban thermal environment in Daegu using satellite and AWS data. J. Environ. Sci. Int. 2010, 19, 281–293. [Google Scholar] [CrossRef]
- Oh, K.-Y.; Lee, M.-J.; Jeon, S.-W. Development of the Korean climate change vulnerability assessment tool (VESTAP)—Centered on health vulnerability to heat waves. Sustainability 2017, 9, 1103. [Google Scholar] [CrossRef]
- Chung, J.W.; Lee, W.K.; Cui, G.S.; Lee, S.C.; Choi, S.H.; Choi, H.A. Application study of vulnerability assessment models for water resources to climate change by spatial and watershed scales. J. Clim. Chang. Res. 2010, 1, 21–30. [Google Scholar]
- Busan metropolitan city. Climate Change Adaptation Plan of Busan Metropolitan City (2012–2016); Busan metropolitan city: Busan, Korea, 2012. [Google Scholar]
- Daegu metropolitan city. Climate Change Adaptation Plan of Daegu Metropolitan City (2012–2016); Daegu metropolitan city: Daegu, Korea, 2012. [Google Scholar]
- Gwangju metropolitan city. Climate Change Adaptation Plan of Gwangju Metropolitan City (2012–2016); Gwangju metropolitan city: Gwangju, Korea, 2012. [Google Scholar]
- Province of Gyeonggido. Climate Change Adaptation Plan of Gyeonggido (2012–2016); Province of Gyeonggido: Gyeonggido, Korea, 2012. [Google Scholar]
- Province of Jeollanamdo. Climate Change Adaptation Plan of Jeollanamdo (2012–2016); Province of Jeollanamdo: Jeollanamdo, Korea, 2012. [Google Scholar]
- Sejong metropolitan city. Climate Change Adaptation Plan of Sejong Metropolitan City (2012–2016); Sejong metropolitan city: Sejong, Korea, 2012. [Google Scholar]
- Province of Gyeongsangbukdo. Climate Change Adaptation Plan of Gyeongsangbukdo (2012–2016); Province of Gyeongsangbukdo: Gyeongsangbukdo, Korea, 2012. [Google Scholar]
- Province of Chungcheongnamdo. Climate Change Adaptation Plan of Chungcheongnamdo (2012–2016); Province of Chungcheongnamdo: Chungcheongnamdo, Korea, 2012. [Google Scholar]
- Seoul metropolitan city. Climate Change Adaptation Plan of Seoul Metropolitan City (2012–2016); Seoul metropolitan city: Seoul, Korea, 2012. [Google Scholar]
- Ulsan metropolitan city. Climate Change Adaptation Plan of Ulsan Metropolitan City (2012–2016); Ulsan metropolitan city: Ulsan, Korea, 2012. [Google Scholar]
- Daejeon metropolitan city. Climate Change Adaptation Plan of Daejeon Metropolitan City (2012–2016); Daejeon metropolitan city: Daejeon, Korea, 2012. [Google Scholar]
- Province of Gyeongsangnamdo. Climate Change Adaptation Plan of Gyeongsangnamdo (2012–2016); Province of Gyeongsangnamdo: Gyeongsangnamdo, Korea, 2012. [Google Scholar]
- Incheon metropolitan city. Climate Change Adaptation Plan of Incheon Metropolitan City (2012–2016); Incheon metropolitan city: Incheon, Korea, 2012. [Google Scholar]
- Province of Jeju. Climate Change Adaptation Plan of Jeju (2012–2016); Province of Jeju: Jeju, Korea, 2012. [Google Scholar]
- Province of Chungcheongbukdo. Climate Change Adaptation Plan of Chungcheongbukdo (2012–2016); Province of Chungcheongbukdo: Chungcheongbukdo, Korea, 2012. [Google Scholar]
- Province of Jeollabukdo. Climate Change Adaptation Plan of Jeollabukdo (2012–2016); Province of Jeollabukdo: Jeollabukdo, Korea, 2012. [Google Scholar]
- Province of Gangwondo. Climate Change Adaptation Plan of Gangwondo (2012–2016); Province of Gangwondo: Gangwondo, Korea, 2012. [Google Scholar]
- Vescovi, L.; Rebetez, M.; Rong, F. Assessing public health risk due to extremely high temperature events: Climate and social parameters. Clim. Res. 2005, 30, 71–78. [Google Scholar] [CrossRef]
- Chow, W.T.; Chuang, W.-C.; Gober, P. Vulnerability to extreme heat in metropolitan phoenix: Spatial, temporal, and demographic dimensions. Prof. Geogr. 2012, 64, 286–302. [Google Scholar] [CrossRef]
- Aubrecht, C.; Özceylan, D. Identification of heat risk patterns in the US national capital region by integrating heat stress and related vulnerability. Environ. Int. 2013, 56, 65–77. [Google Scholar] [CrossRef] [PubMed]
- Dong, W.; Liu, Z.; Zhang, L.; Tang, Q.; Liao, H.; Li, X.E. Assessing heat health risk for sustainability in Beijing’s urban heat island. Sustainability 2014, 6, 7334–7357. [Google Scholar] [CrossRef]
- Zhu, Q.; Liu, T.; Lin, H.; Xiao, J.; Luo, Y.; Zeng, W.; Zeng, S.; Wei, Y.; Chu, C.; Baum, S. The spatial distribution of health vulnerability to heat waves in Guangdong province, China. Glob. Health Action 2014, 7, 25051. [Google Scholar] [CrossRef] [PubMed]
- El-Zein, A.; Tonmoy, F.N. Assessment of vulnerability to climate change using a multi-criteria outranking approach with application to heat stress in Sydney. Ecol. Indic. 2015, 48, 207–217. [Google Scholar] [CrossRef]
- Christenson, M.; Geiger, S.D.; Phillips, J.; Anderson, B.; Losurdo, G.; Anderson, H.A. Heat vulnerability index mapping for Milwaukee and Wisconsin. J. Public Health Manag. Pract. 2017, 23, 396–403. [Google Scholar] [CrossRef] [PubMed]
- Ministry of land, Infrastructure and Transport. Guideline for Analysis of Climate Change Driven Disaster Vulnerability in Urban Area; Ministry of Land, Infrastructure and Transport: Sejong metropolitan city, Korea, 2017.
- Park, I.K. A Study on Climate Change Vulnerability Assessment of Ulsan Local Government Using VESTAP. Master Thesis, Graduate School of Sejong University, Seoul, Korea, 2016. [Google Scholar]
- Jung, H.C.; Lee, W.K.; Cho, J.G. A Study on Climate Change Vulnerability for Supporting Pilot Project of Local Government Adaptation Implementation Planning; National institute of environmental research: Incheon metropolitan city, Korea, 2012.
- Koo, Y.S.; Kim, J.E.; Kim, J.S.; Lee, S.H. Study on the improvement of adaptation ability by vulnerability anlysis of heat wave: The case of Busan metropolitan city. J. Korean Reg. Dev. Assoc. 2015, 27, 331–347. [Google Scholar]
- Ahn, Y.J.; Kang, Y.E.; Park, C.S. Developing indexes for analyzing severe heat hot spot under climate change. J. Korea Plan. Assoc. 2016, 51, 199–209. [Google Scholar] [CrossRef]
- Lee, S.S.; Jeong, Y.A.; Yoon, J.J.; Pyo, J.G.; Yoon, S.H.; Kim, T.K.; Ahn, J.Y. Prototype Development of Climate Change Evaluation in Province of Chungcheongnamdo; ChungNam Institue: Daejeon, Korea, 2015. [Google Scholar]
- Lee, W.J.; Kang, J.E.; Kim, Y.K. The impact of environmental health factors on extreme-heat vulnerability assessment in a metropolitan city. Korean J. Environ. Health 2013, 39, 492–504. [Google Scholar] [CrossRef]
- Yoo, S.J.; Lee, W.K.; Oh, S.H.; Byun, J.Y. Vulnerability assessment for public health to climate change using spatio-temporal information based on GIS. J. Korea Spat. Inf. Soc. 2012, 20, 13–24. [Google Scholar] [CrossRef]
- Shin, H.S.; Lee, S.H. Development of a climate change vulnerability index on the health care sector. J. Environ. Policy 2014, 13, 69–93. [Google Scholar]
- Rinner, C.; Patychuk, D.; Bassil, K.; Nasr, S.; Gower, S.; Campbell, M. The role of maps in neighborhood-level heat vulnerability assessment for the city of Toronto. Cartogr. Geogr. Inf. Sci. 2010, 37, 31–44. [Google Scholar] [CrossRef]
- Tomlinson, C.J.; Chapman, L.; Thornes, J.E.; Baker, C.J. Including the urban heat island in spatial heat health risk assessment strategies: A case study for Birmingham, UK. Int. J. Health Geogr. 2011, 10, 42. [Google Scholar] [CrossRef] [PubMed] [Green Version]
- Johnson, D.P.; Stanforth, A.; Lulla, V.; Luber, G. Developing an applied extreme heat vulnerability index utilizing socioeconomic and environmental data. Appl. Geogr. 2012, 35, 23–31. [Google Scholar] [CrossRef]
- Wolf, T.; McGregor, G. The development of a heat wave vulnerability index for London, United Kingdom. Weather Clim. Extremes 2013, 1, 59–68. [Google Scholar] [CrossRef] [Green Version]
- Hondula, D.M.; Davis, R.E.; Leisten, M.J.; Saha, M.V.; Veazey, L.M.; Wegner, C.R. Fine-scale spatial variability of heat-related mortality in Philadelphia County, USA, from 1983–2008: A case-series analysis. Environ. Health 2012, 11, 16. [Google Scholar] [CrossRef] [PubMed]
- Loughnan, M.; Nicholls, N.; Tapper, N.J. Mapping heat health risks in urban areas. Int. J. Popul. Res. 2012, 2012. [Google Scholar] [CrossRef]
- Harlan, S.L.; Declet-Barreto, J.H.; Stefanov, W.L.; Petitti, D.B. Neighborhood effects on heat deaths: Social and environmental predictors of vulnerability in Maricopa County, Arizona. Environ. Health Perspect. 2013, 121, 197. [Google Scholar] [PubMed]
- Reid, C.E.; O’neill, M.S.; Gronlund, C.J.; Brines, S.J.; Brown, D.G.; Diez-Roux, A.V.; Schwartz, J. Mapping community determinants of heat vulnerability. Environ. Health Perspect. 2009, 117, 1730. [Google Scholar] [CrossRef] [PubMed] [Green Version]
- Maier, G.; Grundstein, A.; Jang, W.; Li, C.; Naeher, L.P.; Shepherd, M. Assessing the performance of a vulnerability index during oppressive heat across Georgia, United States. Weather Clim. Soc. 2014, 6, 253–263. [Google Scholar] [CrossRef]
- Alfano, F.R.D.A.; Olesen, B.W.; Palella, B.I. Povl ole fanger’s impact ten years later. Energy Build. 2017, 152, 243–249. [Google Scholar] [CrossRef]
- Alfano, F.R.D.A.; Palella, B.I.; Riccio, G. Thermal environment assessment reliability using temperature—Humidity indices. Ind. Health 2011, 49, 95–106. [Google Scholar] [CrossRef]
- Santos Nouri, A.; Costa, J.P.; Santamouris, M.; Matzarakis, A. Approaches to outdoor thermal comfort thresholds through public space design: A review. Atmosphere 2018, 9, 108. [Google Scholar] [CrossRef]
- Rothfusz, L.P. The Heat Index Equation (or, More Than You ever Wanted to Know about Heat Index); Technical attachment, SR 90-23; Scientific Services Division NWS: Fort Worth, TX, USA, 1990.
- Kim, Y.J.; Kim, H.S.; Kim, Y.K.; Kim, J.K.; Kim, Y.M. Valuation of thermal environments during the heat waves of summer 2013 in Busan metropolitan area. J. Environ. Sci. Int. 2014, 23, 1929–1941. [Google Scholar] [CrossRef]
Figure 1.
Map of the study area.

Figure 2.
Research process.

Figure 3.
Thermal vulnerability of each index converted into a standardized index.


Figure 4.
Thermal environment vulnerability assessment results for Daegu Metropolitan City.

Figure 5.
Area and area ratios of the first-grade regions in each county.

Figure 6.
Vulnerability distribution and satellite picture of the sample areas.


Table 1.
Urban/non-urban areas in each district of Daegu Metropolitan City.
| Category | Urban Area | Non-Urban Area | Sum | |||
|---|---|---|---|---|---|---|
| Area (km2) | Ratio (%) | Area (km2) | Ratio (km2) | Area (km2) | Ratio (%) | |
| Jung-gu | 7.1 | 100.0 | 0.0 | 0.0 | 7.1 | 100 |
| Dong-gu | 146.9 | 80.6 | 35.3 | 19.4 | 182.2 | 100 |
| Seo-gu | 17.3 | 100.0 | 0.0 | 0.0 | 17.3 | 100 |
| Nam-gu | 17.4 | 100.0 | 0.0 | 0.0 | 17.4 | 100 |
| Buk-gu | 94.1 | 100.0 | 0.0 | 0.0 | 94.1 | 100 |
| Suseong-gu | 76.5 | 100.0 | 0.0 | 0.0 | 76.5 | 100 |
| Dalseo-gu | 62.3 | 100.0 | 0.0 | 0.0 | 62.3 | 100 |
| Dalseong-gun | 376.4 | 88.2 | 50.3 | 11.8 | 426.6 | 100 |
| Daegu Metropolitan City | 798.0 | 90.3 | 85.6 | 9.7 | 883.6 | 100 |
Table 2.
Policies of Korean local governments aimed at improving the thermal environment based on the Detailed Implementation Plan for Climate Change Adaptation Measures (2012–2016).
Table 2.
Policies of Korean local governments aimed at improving the thermal environment based on the Detailed Implementation Plan for Climate Change Adaptation Measures (2012–2016).
| Division | Policy | Source |
|---|---|---|
| Improvement of the atmospheric environment | Establishment of heat wave warning and alarm systems and monitoring systems | [21,22,23,24,25,26] |
| Establishment of heat wave and UV research institutes | [22] | |
| Establishment of database on heat wave periods, vulnerable areas, heat wave diseases, and vulnerable classes | [27] | |
| Wind path creation | [27,28] | |
| Cool spot creation | Urban greening, such as roadside planting | [22,26,27,28,30] |
| Restoration of urban ecosystems, including biotope creation | [28] | |
| Urban forest creation | [22,26,27,28,30] | |
| Ecological park creation | [22,26,27,30,31] | |
| Rooftop greening projects | [22,26,27,28,31,32] | |
| Projects for response of the traditional market to heat waves (cooling fog) | [26] | |
| Expansion of eco-friendly buildings | Improvement of farmhouses, such as attachment of stable ceiling insulators and ventilation facility inspection | [27] |
| Housing improvement projects and vacant house maintenance projects | [25,26] | |
| Cool loop installation | [27,29] | |
| Wall greening projects | [22] | |
| Prioritized building greening projects in vulnerable areas | [22] | |
| Management of the surface | Artificial ground greening | [25] |
| Ecological river restoration | [27,30] | |
| Revitalization of communities | Improvement of rural medical services | [27] |
| Establishment of regional emergency medical care plans and systems | [26,27,33,34] | |
| Prevention and management of cerebrovascular diseases | [21,27,33] | |
| Establishment of monitoring systems for health management of vulnerable classes | [23] | |
| Development of management plans and manuals for each class vulnerable to heat waves | [21,22,25,29,31,33,35] | |
| Survey of vulnerable classes (preschool children, elderly aged 65 or over, elderly living alone, and other health-vulnerable classes) | [21,23,24,36] | |
| Management and support for home visits and care | [22,27,28,29,33] | |
| Training of helpers for classes vulnerable to heat waves | [22,26,29,36] | |
| Healthcare services for the elderly in vulnerable classes | [28,29] | |
| Establishment of an emergency care service system for the elderly living alone | [23,26,27,29,31,35,36] | |
| Establishment of database on heat wave shelters and selection management | [21,22,23,25,26,27, 29,31,35] | |
| Establishment and operation of a task force to manage the situation against prolonged heat waves | [21,26] | |
| Establishment and promotion of emergency medical support systems | [23,26] | |
| Customized promotional and educational activities in response to heat waves | [21,24,26,29,31,33] | |
| Measures for health management in preparation for heat waves | [37] |
Table 3.
Previous studies on thermal environment vulnerability indices.
| Division | Index | Foreign | Domestic (Korea) | ||||||||||||||||||||||||||||||||||
|---|---|---|---|---|---|---|---|---|---|---|---|---|---|---|---|---|---|---|---|---|---|---|---|---|---|---|---|---|---|---|---|---|---|---|---|---|---|
| Vescovi et al. [38] | Reid et al. [61] | Rinner et al. [54] | Hondula et al. [58] | Chow et al. [39] | Tomlinson et al. [55] | Loughnan et al. [59] | Johnson et al. [56] | Wolf et al. [57] | Aubrecht et al. [40] | Harlan et al. [60] | Maier et al. [62] | Dong et al. [41] | Zhu et al. [42] | El-Zein et al. [43] | Christenson et al. [44] | Seoul Metropolitan City [29] | Daegu Metropolitan City [22] | Province of Chungcheongbukdo [35] | Province of Gyeongsangnamdo [32] | Province of Jeollanamdo [25] | Gwangju Metropolitan City [23] | Province of Gyeongsangbukdo [27] | Province of Jeollabukdo [36] | Ulsan Metropolitan City [30] | Ministry of Land, Infrastructure and Transport [45] | Park [46] | Jung et al. [47] | Koo et al. [48] | Ahn et al. [49] | Lee et al. [50] | Lee et al. [51] | Yoo et. al. [52] | Shin et al. [53] | Eum [14] | |||
| Improvement of the atmospheric environment | Temperature | O | O | O | O | O | O | O | √ | √ | √ | √ | √ | √ | √ | √ | √ | √ | √ | √ | √ | √ | √ | √ | √ | √ | √ | ||||||||||
| Fine dust | O | ||||||||||||||||||||||||||||||||||||
| Ozone | O | ||||||||||||||||||||||||||||||||||||
| Thermal comfort | O | √ | √ | √ | √ | √ | √ | √ | √ | √ | √ | √ | |||||||||||||||||||||||||
| Cool spot creation | Water and green zones | O | O | O | √ | √ | √ | √ | √ | √ | √ | ||||||||||||||||||||||||||
| Wind path | √ | ||||||||||||||||||||||||||||||||||||
| Heat wave shelter | O | √ | √ | √ | |||||||||||||||||||||||||||||||||
| Air conditioners | O | O | O | O | √ | √ | √ | √ | |||||||||||||||||||||||||||||
| Expansion of eco-friendly buildings | Buildings | O | √ | √ | √ | √ | √ | ||||||||||||||||||||||||||||||
| Financial factors | √ | √ | √ | √ | √ | ||||||||||||||||||||||||||||||||
| Management of the surface | Surface temperature | O | O | O | O | O | |||||||||||||||||||||||||||||||
| Land use and coverage | O | O | O | O | O | O | √ | √ | √ | √ | √ | √ | √ | √ | √ | √ | √ | ||||||||||||||||||||
| Revitalization of communities | Activity space | O | √ | ||||||||||||||||||||||||||||||||||
| Poverty | O | O | O | O | O | O | O | O | O | O | O | O | O | O | √ | √ | √ | √ | √ | √ | √ | √ | √ | √ | √ | √ | √ | ||||||||||
| Age | O | O | O | O | O | O | O | O | O | O | O | O | O | O | O | O | √ | √ | √ | √ | √ | √ | √ | √ | √ | √ | √ | √ | √ | √ | √ | ||||||
| Isolation | O | O | O | O | O | O | O | O | O | O | O | √ | √ | √ | √ | √ | √ | √ | √ | √ | √ | √ | √ | ||||||||||||||
| Disease | O | O | O | O | O | O | √ | √ | √ | √ | √ | √ | √ | √ | √ | √ | √ | √ | √ | √ | |||||||||||||||||
| Communication (language) | O | O | O | O | O | O | O | O | O | O | O | O | O | O | √ | ||||||||||||||||||||||
| Housing/population density | O | O | O | O | O | O | √ | √ | √ | √ | √ | √ | |||||||||||||||||||||||||
| Health and medical | O | O | O | √ | √ | √ | √ | √ | √ | √ | √ | √ | √ | √ | √ | ||||||||||||||||||||||
| Public officials | √ | √ | √ | ||||||||||||||||||||||||||||||||||
| Local government finance | O | O | √ | √ | √ | √ | √ | √ | √ | √ | √ | √ | √ | √ | √ | ||||||||||||||||||||||
| Population less sensitive to heat | O | √ | |||||||||||||||||||||||||||||||||||
| Senior welfare | O | O | |||||||||||||||||||||||||||||||||||
O: foreign studies, √: Korean studies.
Table 4.
Assessment index–policy linking framework.
| Category | Vulnerability Assessment Index | Unit | Policy for Improved Thermal Environment |
|---|---|---|---|
| Improvement of the atmospheric environment | Number of days with a daily maximum temperature over 33 °C a | Day | Acquisition of thermal environment observation equipment Implementation of alternative-day-no-driving systems during heat waves Creation of wind paths Activation of renewable energy Supply of electric vehicles |
| Number of days with a daily minimum temperature over 25 °C a | Day | ||
| PM10 (Particuate Matter) concentration a | μg/m2 | ||
| Thermal comfort (heat index) a | Degree | ||
| Creation of cool spots | Water to green zone ratio c | % | Creation of pocket parks Restoration of rivers Development of striped green belts by the wayside Expansion of school forest projects Support for rooftop greening |
| Expansion of eco-friendly buildings | Building surface area a | m2 | Provision of cool roofs Maintenance of old buildings Wall greening Expansion and maintenance of heat wave shelters Encouragement to use finish for reducing heat |
| Buildings constructed before the 1980s b | m2 | ||
| Number of basic livelihood security recipients b | Person | ||
| Management of the surface | Road ratio a | % | Clean-road implementation Concrete pavement block replacement Shade installation Expansion of shade trees Construction of water circulation city using the Low Impact Development (LID) technique |
| surface temperature a | °C | ||
| Revitalization of communities | Number of elderly living alone b | Person | Heat wave promotion and educational activities Care for the elderly Maintenance of rural areas Construction of hyperthermia patient monitoring systems Citizen empowerment |
| Number of people aged 65 and over b | |||
| Number of people aged 5 and under b | |||
| Number of agricultural workers b | |||
| Number of cardiovascular disease deaths b |
a Exposure-related index, b Sensitivity-related index, c Adaptability-related index.
Table 5.
Method for constructing data for analysis indices.
| Classification | Resources | Measurement Method and Unit | |
|---|---|---|---|
| Strategy | Index | ||
| Improvement of the atmospheric environment | Number of days with a daily maximum temperature above 33 °C (day) | Local forecasting model from the Korea Meteorological Administration (LDAPS) (July–August 2016, 15:00) | Resampling (30 m) after Raster data extraction (2 km) |
| Number of days with a daily minimum temperature above 25 °C (day) | Local forecasting model from the Korea Meteorological Administration (LDAPS) (July–August 2016, 06:00) | Resampling (30 m) after Raster data extraction (2 km) | |
| Thermal comfort: Heat Index (degree) | Local forecasting model from the Korea Meteorological Administration (LDAPS) (July–August 2016, 15:00) | Resampling (30 m) after Raster data extraction (2 km) | |
| PM10 concentration (μg/m2) | Air Korea Database (12 stations in the Daegu area) | Interpolation of Geographic Information System (GIS) (Point) | |
| Creation of cool spots | Water to green zone ratio (%) | Land cover map from the Ministry of Environment (2007) | Focal statics of GIS 300 × 300 m (30 × 30 m) |
| Expansion of eco-friendly buildings | Surface area of buildings (m2) | Building data from the Korea National Spatial Data Infrastructure Portal | Focal statics of GIS 300 × 300 m (30 × 30 m) |
| Buildings constructed before the 1980s (m2) | Building year data from building integrated information (Korea National Spatial Data Infrastructure Portal) | Focal statics of GIS 300 × 300 m (30 × 30 m) | |
| Number of basic livelihood security recipients (person) | Data on each district from Statistics Korea | Counties | |
| Management of the surface | Road ratio (%) | Continuous topographic map (National Geographic Information Institute) road boundary data | Focal statics of GIS 300 × 300 m (30 × 30 m) |
| Surface temperature (°C) | Landsat 8 thermal band (13.09.05,14.09.14,14.09.21) | Analysis of thermal band | |
| Revitalization of communities | Number of elderly living alone (persons) | Statistical Geographic Information Service (SGIS) output area unit data | Output area unit (30 × 30 m) |
| Number of people aged 65 and over (persons) | Output area unit on people aged 65 and over in 2015 Population Census | Output area unit (30 × 30 m) | |
| Number of people aged 5 and under (persons) | Output area unit on people aged 5 and under in 2015 Population Census | Output area unit (30 × 30 m) | |
| Number of agricultural workers (persons) | SGIS output area unit data | Output area unit (30 × 30 m) | |
| Number of cardiovascular disease deaths (persons) | Statistical data on causes of death from Statistics Korea | Districts and provinces | |
Table 6.
Area and area ratio for each thermal environment vulnerability grade in each district.
| Category | First Grade | Second Grade | Third Grade | Fourth Grade | Total | |||||
|---|---|---|---|---|---|---|---|---|---|---|
| km2 | % | km2 | % | km2 | % | km2 | % | km2 | % | |
| Jung-gu | 0.03 | 0.44 | 2.15 | 30.57 | 4.86 | 68.99 | 0.00 | 0.00 | 7.04 | 100 |
| Dong-gu | 5.95 | 3.29 | 35.98 | 19.91 | 70.64 | 39.08 | 68.17 | 37.72 | 180.74 | 100 |
| Seo-gu | 0.06 | 0.37 | 7.76 | 45.12 | 7.71 | 44.87 | 1.66 | 9.64 | 17.19 | 100 |
| Nam-gu | 0.00 | 0.02 | 6.22 | 35.53 | 5.28 | 30.16 | 6.00 | 34.29 | 17.49 | 100 |
| Buk-gu | 2.96 | 3.18 | 24.09 | 25.88 | 42.99 | 46.17 | 23.06 | 24.77 | 93.11 | 100 |
| Suseong-gu | 0.03 | 0.03 | 22.04 | 28.91 | 32.68 | 42.87 | 21.48 | 28.18 | 76.23 | 100 |
| Dalseo-gu | 2.08 | 3.28 | 32.11 | 50.63 | 19.05 | 30.04 | 10.18 | 16.05 | 63.42 | 100 |
| Dalseong-gun | 10.60 | 2.55 | 77.25 | 18.57 | 161.61 | 38.85 | 166.55 | 40.03 | 416.00 | 100 |
Table 7.
Characteristics of the sample areas.
| Category | Ansim-1-Dong | Guji-Myeon |
|---|---|---|
| Total area (km2) | 3.45 | 39.63 |
| Population (person) | 45,608 | 6571 |
| Area of first class regions (km2) | 2.42 | 5.53 |
| Ratio [(total area/area of the first class regions) × 100%] (%) | 70.6 | 13.9 |
Table 8.
Standardized index for each index in vulnerable areas (a high score represents a high level of vulnerability.).
Table 8.
Standardized index for each index in vulnerable areas (a high score represents a high level of vulnerability.).
| Divison | Guji-Myeon | Ansim-1-Dong | |
|---|---|---|---|
| Improvement of the atmospheric environment | Number of days with a daily maximum temperature above 33 °C | 0.63 | 0.53 |
| Number of days with a daily minimum temperature above 25 °C | 0.39 | 0.32 | |
| Thermal comfort | 0.85 | 0.78 | |
| PM10 concentration | 0.44 | 0.70 | |
| Creation of cool spots | Water to green zone ratio | 0.22 | 0.70 |
| Expansion of eco-friendly buildings | Surface area of buildings | 0.00 | 0.04 |
| Buildings constructed before the 1980s | 0.01 | 0.06 | |
| Number of basic livelihood security recipients | 0.05 | 0.99 | |
| Management of the surface | Road ratio | 0.13 | 0.51 |
| Surface temperature | 0.68 | 0.75 | |
| Revitalization of communities | Number of elderly living alone | 0.40 | 0.11 |
| Number of people aged 65 and over | 0.51 | 0.15 | |
| Number of people aged 5 and under | 0.12 | 0.29 | |
| Number of agricultural workers | 0.76 | 0.02 | |
| Number of cardiovascular disease deaths | 0.26 | 0.79 | |
© 2018 by the authors. Licensee MDPI, Basel, Switzerland. This article is an open access article distributed under the terms and conditions of the Creative Commons Attribution (CC BY) license (http://creativecommons.org/licenses/by/4.0/).
Share and Cite
MDPI and ACS Style
Eum, J.-H.; Kim, K.; Jung, E.-H.; Rho, P. Evaluation and Utilization of Thermal Environment Associated with Policy: A Case Study of Daegu Metropolitan City in South Korea. Sustainability 2018, 10, 1179. https://doi.org/10.3390/su10041179
AMA Style
Eum J-H, Kim K, Jung E-H, Rho P. Evaluation and Utilization of Thermal Environment Associated with Policy: A Case Study of Daegu Metropolitan City in South Korea. Sustainability. 2018; 10(4):1179. https://doi.org/10.3390/su10041179
Chicago/Turabian StyleEum, Jeong-Hee, Kwon Kim, Eung-Ho Jung, and Paikho Rho. 2018. "Evaluation and Utilization of Thermal Environment Associated with Policy: A Case Study of Daegu Metropolitan City in South Korea" Sustainability 10, no. 4: 1179. https://doi.org/10.3390/su10041179
Note that from the first issue of 2016, this journal uses article numbers instead of page numbers. See further details here.