Fertilizer Effect of Phosphorus Recycling Products

Department of Crop Sciences, Section Plant Nutrition and Crop Physiology, Georg-August-University Göttingen, Carl-Sprengel-Weg 1, 37075 Göttingen, Germany
*
Author to whom correspondence should be addressed.
Sustainability 2018, 10(4), 1166; https://doi.org/10.3390/su10041166
Submission received: 19 December 2017
/
Revised: 26 March 2018
/
Accepted: 27 March 2018
/
Published: 13 April 2018
(This article belongs to the Special Issue Phosphorus Circular Economy: Closing Loops through Sustainable Innovation)
Abstract
:Between 2004 and 2011 the German Government funded 17 different projects to develop techniques of phosphorus recycling from wastewater, sewage sludges, and sewage sludge ashes. Several procedures had been tested, such as precipitation, adsorption, crystallization, nano-filtration, electro-dialysis, wet oxidation, pyrolysis, ion exchange, or bioleaching. From these techniques, 32 recycling products were tested by five different institutes for their agronomic efficiency, that is, their plant availability, mainly in pot experiments. This manuscript summarizes and compares these results to evaluate the suitability of different technical approaches to recycle P from wastes into applicable fertilizers. In total, 17 products of recycled sewage sludge ashes (SSA), one meat and bone meal ash, one sinter product of meat and bone meal, one cupola furnace slag, nine Ca phosphates from crystallization or from precipitation, Seaborne-Ca-phosphates, Seaborne-Mg-phosphate, and 3 different struvites were tested in comparison to controls with water soluble P, that is, either single super phosphate (SSP) or triple super phosphate (TSP). Sandy and loamy soils (pH: 4.7–6.8; CAL-P: 33–49 ppm) were used. The dominant test plant was maize. Phosphorus uptake from fertilizer was calculated by the P content of fertilized plants minus P content of unfertilized plants. Calculated uptake from all products was set in relation to uptake from water soluble P fertilizers (SSP or TSP) as a reference value (=100%). The following results were found: (1) plants took up less than 25% P in 65% of all SSA (15 products); (2) 6 products (26%) resulted in P uptake of 25 and 50% relatively to water soluble P. Only one Mg-P product resulted in an uptake of 67%. With cupola furnace slag, 24% P uptake was reached on sandy soil and nearly the same value as TSP on loamy soil. The uptake results of Ca phosphates were between 0 and 50%. Mg-P products from precipitation processes consistently showed a better P supply in relation to comparable Ca-P compounds. With struvite the same P uptake as for water soluble P was reached. The fertilizer effect of the tested P recycling products can clearly be differentiated: TSP = struvite > Mg-P = sinter-P > Ca-P, cupola-slag > thermally treated sewage sludge ashes > meat-and-bone meal ash = Fe-P.
1. Introduction and Outline
Price fluctuations of phosphorus fertilizers since about 2005 indicate that the market for P has become volatile. During 2007/8, prices increased by 300%. Some reasons were the closing of two phosphate rock mines in the USA and the export stop for P in the USA and China. At the same time, P markets in India and Southeast Asia increased. Soils in sub-saharan Africa are still poor in plant available P; thus, new markets will also develop in future. Although prices had dropped again after this tremendous increase, they never reached their old level and a steady increase can be expected as already outlined in the CRU-report ‘Phosphate rock: ten year outlook (2011)’ (refer to scope newsletter No. 81, November 2011, https://phosphorusplatform.eu/images/download/ScopeNewsletter81.pdf).
Of course, dynamics of the P market depend also on the sources of phosphate rock (PR). Phosphorus is the eleventh most abundant element worldwide. According to [1] global P can be divided into three groups due to its accessibility. The largest amount of P most probably belongs to the global potential; however, these natural deposits are not known or mining is economically or technically not feasible. For instance, P in submarine sediments belongs to this group. Phosphorus resources are known deposits, but mining would be not economic, for example, deposits in Siberia far away from any infrastructure. Potential deposits deduced from geological formations but still unexplored also belong to the resources. Reserves are deposits undergoing mining or known deposits where mining would be technically and economically feasible. The development of phosphate rock reserves in recent years is shown in Table 1 [2]. The quotient between reserves and worldwide production results in the static lifetime of phosphate rock. In the early 2000s static lifetime was about one hundred years, pointing to the scarcity of phosphate rock. In 2010, Morocco announced another 50 billion tons of PR reserves, extending static lifetime to nearly 400 years. In recent years, production in China has increased dramatically, reducing static lifetime down to 250–300 years. Hence, as seen from the figures, PR reserves are limited but there will be no scarcity over the next centuries. Furthermore, world resources of PR are more than 300 billion tons.
However, PR reserves are not evenly distributed worldwide (Table 2). In Europe, only Finland runs a small mine; hence, Europe has to import PR. Worldwide, the largest reserves are located in countries south and east of the Mediterranean Sea ranging from Morocco to Jordan and Syria, in China, and in the USA. The largest worldwide producers are China, USA, and Morocco, but China and the USA have stopped exporting PR. Importing from countries around the Mediterranean Sea contains uncertainties for different reasons. (I) Quite a few of these countries are politically unstable, for example, Syria. The largest producer in this region, Morocco, shows a comparatively good political stability. However, the PR mines are mainly located in Western Sahara, which is only annexed by Morocco and this annexation is not recognised by the UN; (II) Moroccan PR contains also high concentrations of cadmium and uranium. The removal of these pollutants makes the fertilizer production more expensive; (III) Production of PR is very water demanding, in these arid regions there is strong competition for water between the human population, agriculture, and PR production. Europe should reduce its dependency on PR imports.
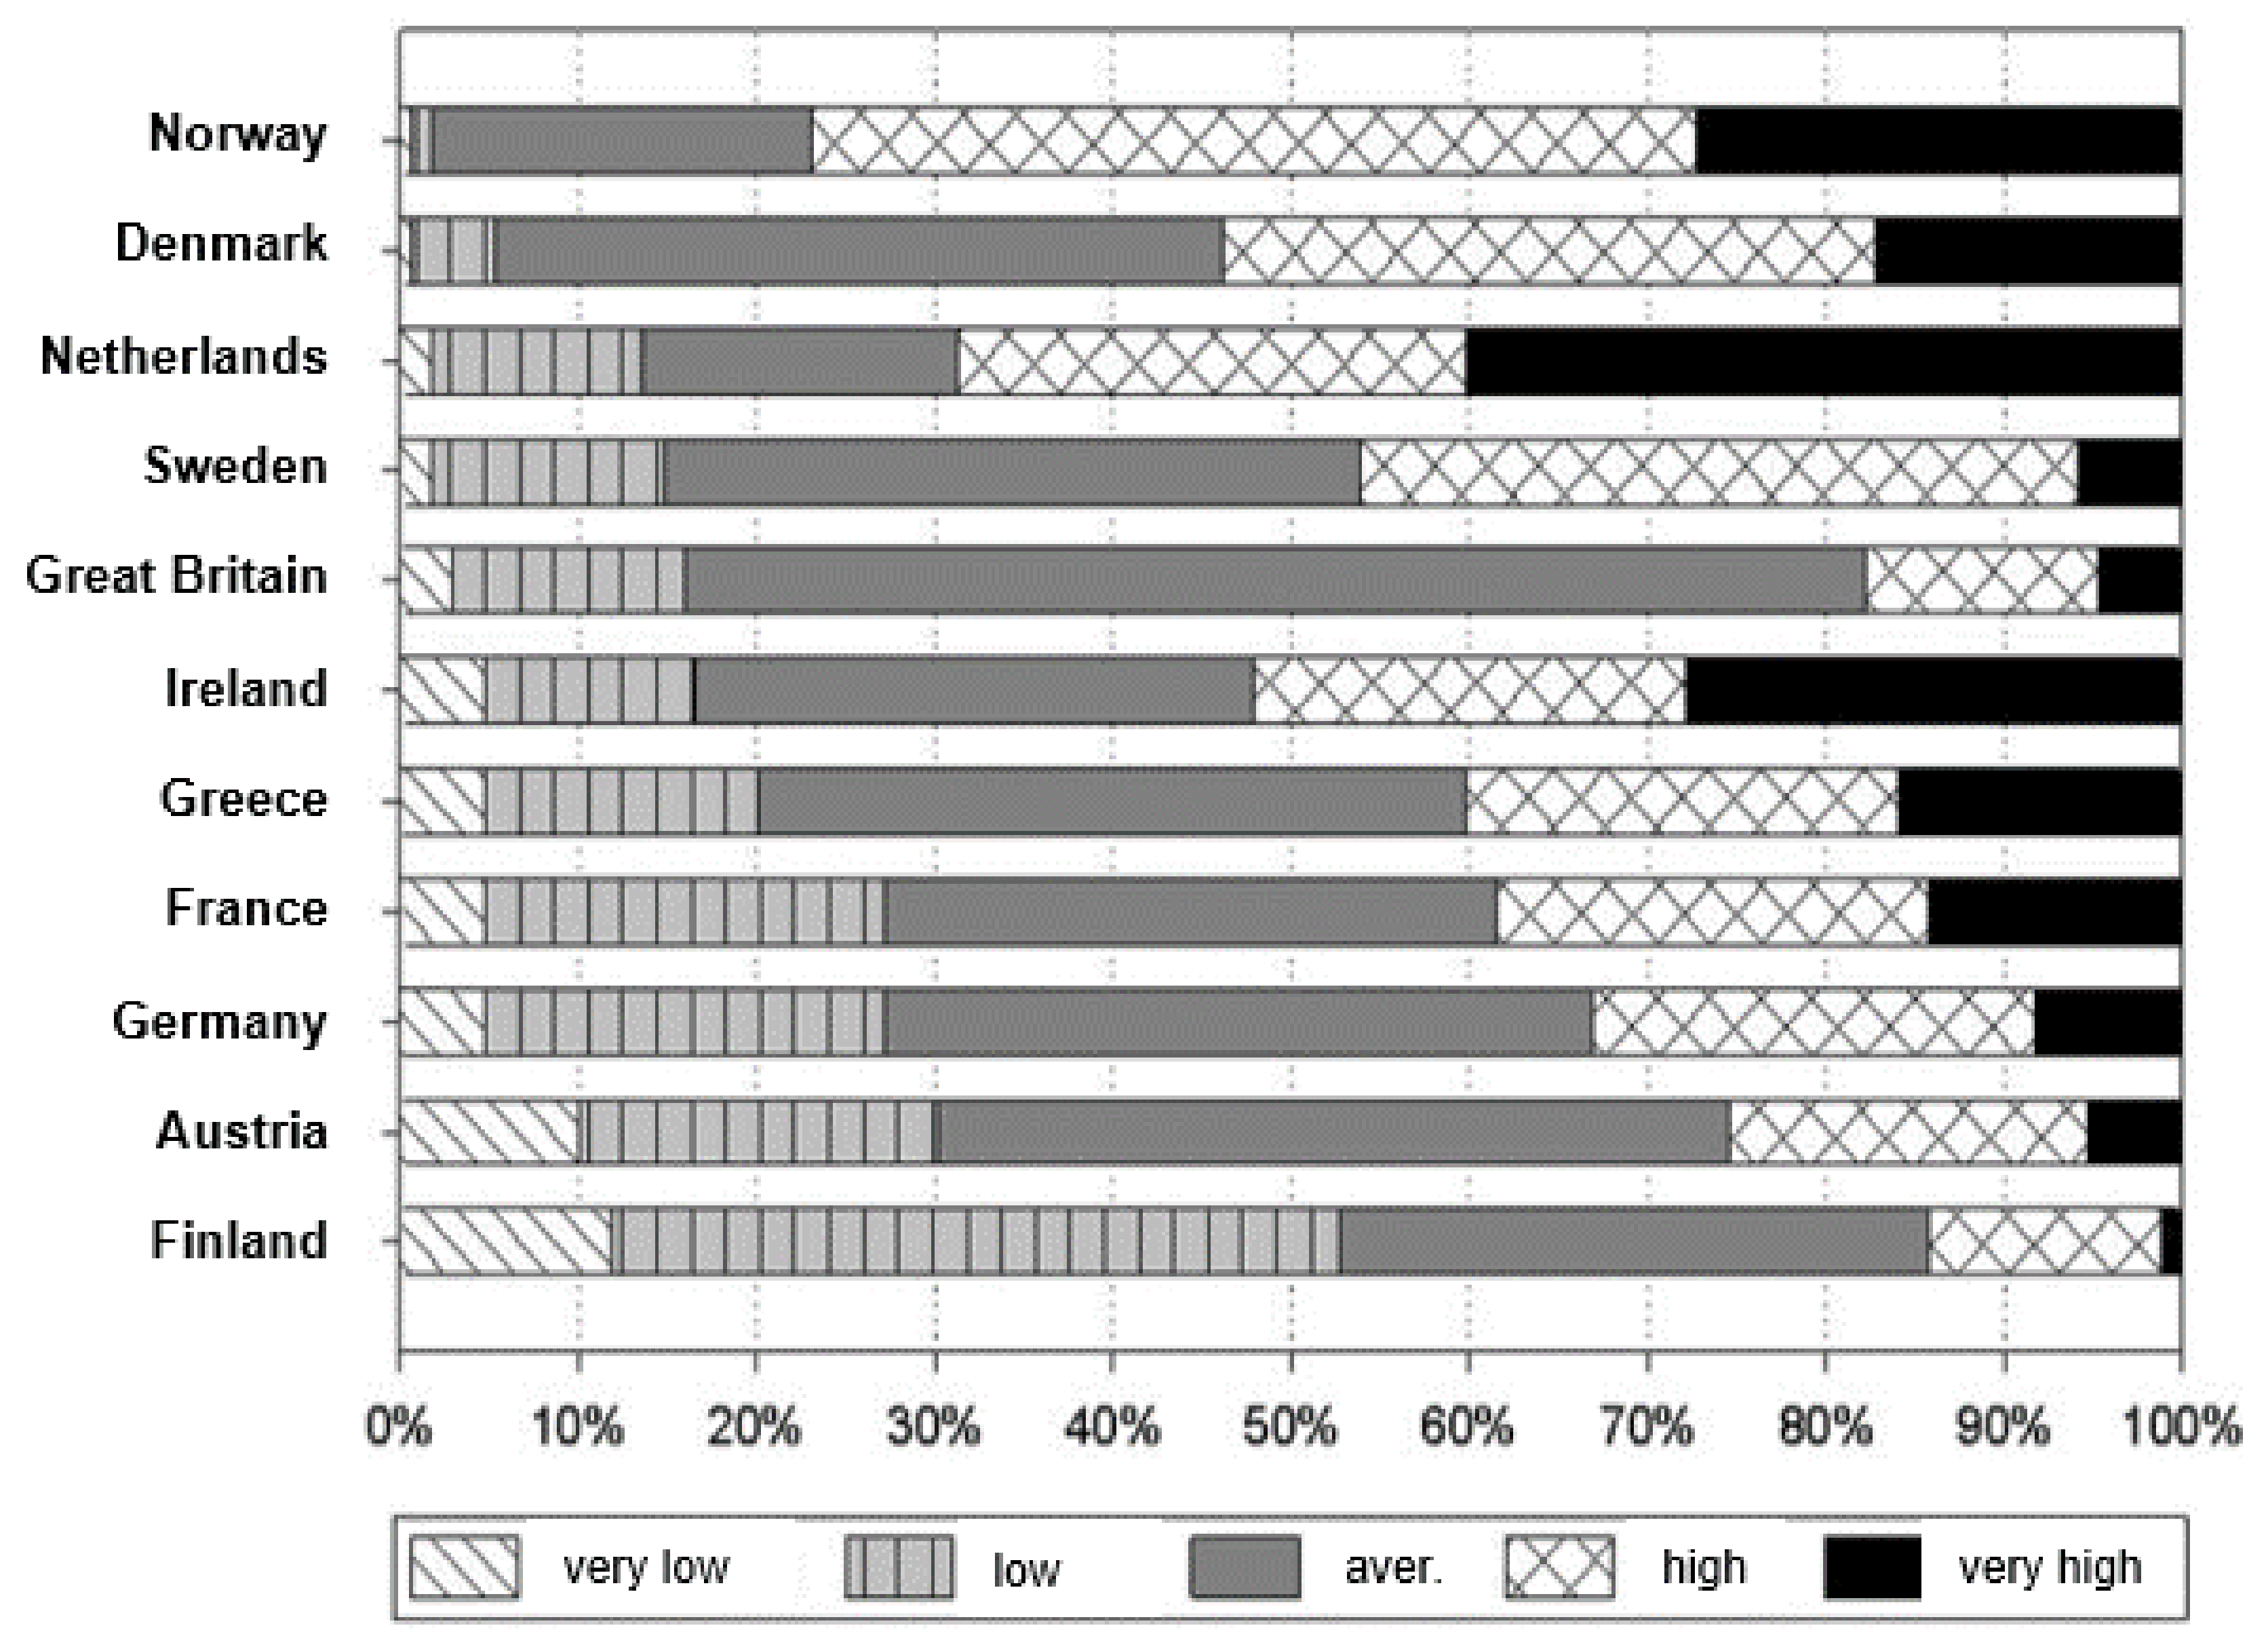
Figure 1 shows the soil P status in some European countries based on the particular national soil P extraction methods and advisory services, as such, data are not directly comparable [3]. However, it is obvious that most soils are well or even highly supplied with P; hence, there is no reason for alarmism when PR imports drop. In Germany, only about 3% of soils are in a very low supply level (class A, Table 3), whereas more than 40% of the soils are in a high or very high supply level (class D, E) [4]. Of course, there are regional differences. In areas with intense animal production like north western Germany, soils are extremely over-supplied with P, meaning there is no need for P fertilization for the next 200 years (refer to [5]). Even in 85 cm soil depth, P concentrations can be as high as 90 mg P/kg soil, which would be equivalent to the well supply level in the plow layer (class C). In areas with mainly plant production, the P supply status of soils is less but is usually still sufficient.
The increasing prices for P fertilizer and the necessity to become independent from PR imports draw attention to a reduction of P fertilization. In Germany, soils are classified according to their P supply level (class A–E) and recommended fertilization is double the removal (class A), removal (class C), or nil (class E). However, the threshold values of these classes, as set by the Association of German Agricultural Analytic and Research Institutes (VDLUFA) in 1997 [6], are relatively high. This resulted in high soil P concentrations and concomitantly eutrophication of water bodies. Therefore, recent discussions stress the necessity to reduce these threshold values (e.g., the 121. VDLUFA congress 2009 in Karlsruhe [7]). Another attempt to reduce PR imports would be the recycling of phosphorus from organic wastes. This will be the topic of this manuscript.
The potential of P recycling in Germany is given in Table 4. The yearly production of sewage sludge is about 2.4 million tons of dry matter. Assuming an average P concentration of 2% results in about 48,000 t of P. Another 20,000 t are in meat-and-bone meal. The consumption of mineral P fertilizer ranged between 100 and 130 thousand tons in recent years. Hence, about 50–70% of mineral fertilizer P could theoretically be replaced by organic wastes. The direct use of sewage sludge and meat-and-bone meal as fertilizer is restricted or forbidden. The new German sewage sludge ordinance (2017) stipulates the recycling of P for larger wastewater treatment plants, however, with a transition period of 12–15 years. Hence, the necessity for developing recycling techniques is given.
In 2004, the German government represented by three ministries (research, environment, and agriculture) started an initiative to support 17 different research and industrial projects for developing techniques of P recycling and assessing their practicability [10]. These projects covered a wide range of technical approaches like precipitation of P, adsorption, crystallization, nano-filtration, electro-dialyses, elution, wet oxidation, pyrolysis, ion exchange, or bioleaching. This resulted in 32 different recycling products which were tested by five institutes for their agronomic efficiency, that is, plant availability. This has been done mainly in pot experiments on different soils. Measured P uptake was evaluated in comparison to water soluble P fertilizer like single super phosphate (SSP) or triple super phosphate (TSP). The objective of these projects was to identify promising techniques and products for future developments. Similar projects are supported by the EU (e.g., “SUSAN” [11] or ‘P-REX’ [12]) or by other institutions like Fachagentur für Nachwachsende Rohstoffe (FNR, [13]).
In this manuscript, we will summarize and compare the results of these projects. We start with a short introduction to some recycling techniques. This might be of help to understand the differences in the agronomic efficiency. Furthermore, it gives valuable information for farmers because some management systems restrict the use of certain fertilizers, for instance, water soluble P fertilizers are not allowed in organic farming. More emphasis should be on published results about the fertilizer effect of different recycling products.
2. Techniques of Phosphorus Recycling
2.1. Thermo-Chemical Procedures
2.1.1. P Recycling from Sewage Sludge Ashes (SSA)
The first step is the mono-incineration of sewage sludge. Combined incineration with other wastes will reduce the P concentration in the ash too much. The benefit of an incineration is the complete removal of organic chemicals and pharmaceuticals as well as microbes. The drawback is the increased concentration of heavy metals. A technique for reducing the heavy metal concentration was developed in the SUSAN project (Sustainable and Safe Re-use of Municipal Sewage Sludge for Nutrient Recovery [11]). The SSA are reheated in a rotary kiln to about 800–1000 °C together with a chlorine donator (CaCl2 or MgCl2). At these temperatures the chlorides of heavy metals become volatile and can be separated in a gas stream. The decontaminated ashes have a P concentration of about 6–11% and can be used directly as P fertilizer or as raw material for the production of mineral P fertilizers [14]. The fertilizer effect of such ashes had been tested by [15,16,17].
2.1.2. Metallurgic Phosphate Recycling (Mephrec)
Sewage sludge, meat-and-bone meal, or the ashes of both can be used for this process [18]. The material is compressed in briquettes and melted in a cupola furnace at about 2000 °C. The melted heavy metals can be tapped and collected separately. The addition of limestone to the melt forms a slag which contains the phosphate and can be used as fertilizer. The procedure is similar to the production of Thomas slag. The slag contains about 2–6% P. The fertilizer effect was tested by [17].
2.1.3. Phosphate Recycling from Meat-and-Bone Meals
Since the use of meat-and-bone meal as animal feed is no longer allowed, it is burned and used as an energy source. The remaining ashes are poor in heavy metals, but P is mainly given in the form of apatites, hence, plant availability is limited. The meal or ash can be alkaline digested in a rotary kiln at 1000 °C together with soda (Na2CO3) and quartz sand. The product is a sintered phosphate (Rhenania-phosphate) with CaNa-phosphates and a better solubility than apatite. One such sinter-phosphate is ULO-Phos (VTS Koop Schiefer, Unterloquitz) which has been tested by [17].
2.1.4. Plant Ashes
Burning plant material is one way to produce bio-energy. This can be done either from waste material like straw or coarse colza meal, or by growing energy plants like wheat or fast growing woody plants. The ashes could also be used as a direct P fertilizer [13].
2.2. Chemical Procedures
2.2.1. P Recycling from Sewage Sludge (SS)
During the treatment in sewage works P concentration in the wastewater is relatively low. Highest concentrations are given in the sewage sludge or the sewage sludge ashes, that is, P recycling is most efficient after the digesting. The sludge is treated with concentrated acids for solving phosphates, but unfortunately heavy metals will be solved, too. After separating the solid and liquid phase, the heavy metals are precipitated either by addition of sulfides (Na2S or H2S) or organic acid anions. Afterwards phosphate can be precipitated by increasing the pH-value and the addition of Ca-, Mg-, or Fe-salts (Seaborne procedure [19]). By addition of ammonium and magnesium a stoichiometric relation of 1:1:1 between NH4, Mg, and P can be adjusted and P precipitates in form of magnesium-ammonium-phosphate (MgAP), that is, struvite. Struvite can also precipitate spontaneously in pipes and valves of the sewage sludge works, resulting in a blockade of the wastewater stream. Therefore, the sewage sludge works of Berlin have developed a similar procedure as described above for struvite precipitation (AirPrex) to protect their plant [20].
Phosphate can also be precipitated in the wastewater stream by addition of Ca(OH)2. Precipitates can be primary, secondary, or tertiary phosphates or even apatites. The fertilizer effect of such precipitates will be investigated also.
2.2.2. P Crystallization in Wastewater Streams
3. Results of Experiments to Test the Fertilizer Effect of Products with Recycled Phosphate
The data presented here are a compilation of different publications. Often the data are taken out of graphs without knowing the exact values, meaning there might be slight differences to the original data of the authors but this will not influence the general conclusions.
3.1. Sewage Sludge Ashes (SSA)
Different SSA have been tested by [15], the results are presented in Table 5 and Table 6. The first ash (SSA1) originates from Sindlingen (Germany) and is poor in Fe (2 percent) and rich in Al (13 percent); SSA2 is from Slibverwerking, Noord-Brabant (NL) and has an average concentration of Fe (11 percent) and Al (5 percent). To remove heavy metals, the ashes were treated with CaCl2 or MgCl2 as Cl-donator and reheated to 1000 °C. The heating was either by electricity (indirect) or by a gas flame (direct). Furthermore, in one treatment, the ash was partly digested by addition of sulfuric acid. These products had been tested in a pot experiment with single superphosphate (SSP) addition or without P fertilization as control.
Table 5 displays the P uptake of ten weeks old maize plants grown on a soil mixture poor in P. Phosphate uptake from the ashes reached 0–40 percent of the P uptake in the SSP control, and MgCl2 treatments performed better than CaCl2 treatments. Phosphate uptake of winter wheat showed similar results (Table 6). Relative uptake from the ashes was 5–67 percent compared to uptake of SSP and again the MgCl2 treatment performed better than CaCl2 treatments.
A similar product, SSA treated with CaCl2 at 900 °C in a rotary kiln, was tested by [17] in a two-year pot experiment (2007, 2008) with maize on three different soils (Table 7) to also test a long term effect of the SSA. Table 8 shows the absolute and relative P uptakes in comparison to triple-superphosphate (TSP). Summarized uptake from the ash over both years was reduced to 17–46 percent of TSP uptake. On the acid soils (Düshorn pH 4.4, Sattenhausen pH 5.6), relative uptake from SSA was a bit higher in the second than in the first year, however, absolute uptake was still much less than for TSP.
Other ashes treated in a similar way with heat and CaCl2 (Ash-08, Ash-09 and a product of the Bundesanstalt für Materialforschung, BAM) had been tested by [16] in several pot experiments with maize. On sand (Table 9) as well as on loam (Table 10), P uptake from ashes reached only 24–40 percent of the TSP control. On sand, this was in the range of phosphate rock. On loam, the ashes performed slightly better than phosphate rock, but reached also only 40 percent of uptake from TSP.
The BAM product was heated together MgCl2. The effect was slightly better than the CaCl2 ashes with a relative uptake of 45 and 49 percent on a sandy soil (Table 11) and loamy soil (Table 12), respectively. Better results were obtained by [23] who tested a MgCl2 treated ash (Ash-Dec, Outotec) on two silt loams each adjusted to alkaline pH values of 7.2 and 7.8. Accumulated P uptake over 4 cuts of Lolium perenne resulted in 74–106 percent of the uptake from TSP (Table 13).
These results indicate that ashes reheated to about 1000 °C together with CaCl2 to remove heavy metals are much less available to plants than SSP or TSP. The use of MgCl2 can result in a higher availability.
3.2. Meat-and-Bone Meal Ash, Ulo-Phos, Cupola Slag
All these materials had been tested by [17] over two years on three different soils (refer to Table 7) in comparison to TSP and phosphate rock (Table 14). Phosphate uptake from the meat-and-bone meal ash (mb-ash) was only 9–30 percent (Düshorn and Gieboldehausen, respectively) of the uptake from TSP. Hence, relative uptake was in the range of phosphate rock, but behaved differently on different soils. Phosphate rock only became available on the acid soil (pH 4.4), but failed on the other soils (pH 5.6 and 6.8), whereas availability of mb-ash was the other way round. Ulo-phos which is produced in an alkaline digestion in a rotary kiln, together with soda and quartz sand, led to a relatively high uptake in comparison to TSP (65–87 percent). Cupola slag was only tested by [17] and only on two of the three soils, as such, the data basis is scarce. The production of cupola slag is similar to Thomas slag, therefore the low availability on the acid soil (24 percent of TSP) is astonishing, as well as the good performance on Gieboldehausen soil with a neutral pH-value (121 percent of TSP).
3.3. Plant Ashes
Two different plant ashes, coarse colza meal ash (cma) and cereals ash (ca), had been tested by [13] in a field experiment on a loamy sand close to Rostock (Germany). The results of the straw ash also used are not shown because the amount of fertilized P was by far not comparable to the other treatments. The results shown in Table 15 must be evaluated with care. The control (no P) also achieved no K and Mg fertilization, whereas the ash treatments not only achieved 52 kg P/ha but also about 50 kg K and 17 to 35 kg Mg. Furthermore, the ashes were very alkaline (pH 12.6 and 12.9) and it can be expected that soil pH was raised due to the large amount of ashes used (650 kg/ha for cma and 500 kg/ha for ca). Hence, Table 15 shows a combined effect of P, K, and Mg fertilization and different pH-values. Under these conditions, P uptake of spring barley and maize was increased by 9–13 percent and 3–15 percent compared to the unfertilized control, respectively. A relative effectiveness of the ashes in comparison to SSP or TSP cannot be given because there were no SSP or TSP treatments.
3.4. Phosphate Crystallized on Ca-Si-Surfaces (CSH Products)
This product is different to phosphate precipitated with limestone (CaCO3, Ca(OH)2, CaO). The structure of the P crystals which bind to surfaces of Ca-Si-hydrate is still not exactly known. One of these substances [21] has been tested by [17]. The experimental conditions are described in the context to Table 7 and Table 8. The relative effectiveness depended heavily on soil respectively soil pH (Table 16). Under acid conditions (Düshorn, pH 4.4), relative P uptake was 87 percent of TSP and much better than phosphate rock. This indicates that the P binding form is different to apatite. On the other hand, relative P availability decreased down to 25 and 15 percent on the neutral and slightly acid soil, respectively. This is the same behavior as for hardly soluble calcium phosphates.
The availability of seven other calcium phosphates had been examined by [16] in several pot experiments (Table 17). P-Roc 08 and 09 are crystallizations of P on Ca-Si-hydrate surfaces in the wastewater stream; Fix-Phos in sludge recyclates. SESAL is a precipitate of phosphate with CaCl2 after a wet digestion of sewage sludge ash. Pasch is gained by a similar procedure, however, precipitation is with Ca(OH)2. It is remarkable that all Ca-Si-hydrate bound products as well as SESAL failed on the loamy soil although it had an acid pH of 5.4. On the sand, P-Roc 08 showed a relative P uptake of only 34 percent in comparison to TSP, whereas PASCH II and III achieved about 50 percent on both soils. These are results of the first year of maize growth, however, uptake in the second year was not different, that is, there was no long term effect of the materials.
3.5. Precipitates with Ca, Mg, Fe
Table 18 shows the results of an experiment with rye seedlings and three P-precipitates with Ca, Mg, and Fe supplied from Seaborne (Owschlag, Germany) and pure P chemicals [29]. During the Seaborne process, sewage sludge is acidified to solve phosphorus, the liquid phase is separated, and, after addition of Ca-, Mg- or Fe-salts, pH is increased to start precipitation. In comparison to water-soluble mono-calcium-phosphate, relative uptake of rye seedlings from Mg-P reached 110 percent, whereas uptake from Ca-P was about 63 percent and Fe-P failed with 13 percent. Nothing is known about the relative amounts of primary, secondary, and tertiary Mg or Ca phosphates in the precipitates. However, relative uptake from tertiary calcium phosphate given as a pure chemical product was about 60 percent. This indicates that tertiary calcium phosphate is the dominant form in the precipitate.
Relative uptake from pure FePO4 was in the same order as from the Fe precipitate, that is, close to nil, indicating that iron phosphates are inacceptable as P fertilizer. On the other hand, Mg phosphates, the pure chemical as well as the precipitate, showed an availability comparable to water-soluble P. This confirms the findings with Mg-treated ashes (Table 11, Table 12 and Table 13), which performed better than the Ca-treated ones. Also, [16] reported the same availability of Mg-precipitated phosphate (Seaborne procedure) like TSP (107 percent uptake, Table 20).
3.6. Magnesium-Ammonium-Phosphate (MgAP = Struvite)
Three different MgAPs supplied by Seaborne (Sb); the sewage works in Gifhorn (Gf); and the Institute for Sanitary Engineering, Water Quality, and Solid Waste Management in Stuttgart (St) had been tested by [17]. The test procedure was according to Table 7 and Table 8. Average phosphate uptake from the three MgAPs in relation to TSP was 91, 100, and 71 percent for the soils Düshorn (sand pH 4.4), Gieboldehausen (loam, pH 6.8), and Sattenhausen (loam pH 5.6), respectively (Table 19). However, the three MgAPs differed in their availability; MgAP-Gf led to lower uptake on all soils compared to the other two MgAPs, which were not much different in their fertilizer effect. The reasons will be discussed below.
4. Discussion
Plant growth depends, besides the uptake of nutrients, on many other soil and environmental factors. In contrast, P uptake depends mainly on P availability in soil and accordingly on solubility of P fertilizers and their impact with soil chemistry. Therefore, the cited experiments were mainly evaluated by measured P uptake. Biomass production would also be influenced by the growth parameter mentioned above and the internal utilization efficiency of different crops or varieties. Hence, the amount of P taken up is a good measure in pot experiments to assess the availability of fertilizers and P recycling products. In previous decades, mainly water soluble P fertilizers like ammoniumphosphate, single superphosphate (SSP), or triple superphosphate (TSP) have been used in conventional farming, for example, in Germany 94 percent of P fertilizers used were water soluble. Therefore, SSP or TSP was used as control in the described experiments; in both fertilizers Ca(H2PO4)2·H2O is the dominating P form.
Table 21 tries to summarize all results by comparing the uptake from P recycling products relative to SSP or TSP in four ‘efficiency groups’, these are 0–25, 26–50, 51–75, and 76–100 percent. This would mean the products are categorized as completely unsuitable as fertilizer, widely unsuitable, limitedly suitable, or suitable, respectively.
Most results (from three institutions) are available for thermo-chemically digested products, that is, sewage sludge ashes reheated to about 800–1000 °C together with chloride to reduce heavy metal concentration. In 23 experiments only one product reached the group of 51–75 percent (54%) uptake on sand. For this product, the digestion was with MgCl2 (Table 6). The second positive result on loam is not reliable, because uptake of fertilized plants was only 5 to 7 mg higher than in the unfertilized control (101 mg P) and this was statistically not different.
Altogether, in 10 experiments out of 23 (43 percent), plant uptake (mainly by maize) was less than 25 percent of uptake from TSP, and in another 11 experiments (48 percent) it was less than 50 percent. Hence, in over 90 percent of all experiments availability was not or hardly given and the products have to be categorized as completely or widely unsuitable, independently of soil texture or soil pH. The reason is most probably the formation of chloride apatites during the second heating when CaCl2 has been used as chloride donator; reference [33] identified chloride apatite minerals in such products. People should also be warned to use these products for NPK fertilizers as long as their chemical structure is not altered by producing these NPKs. Farmers will purchase a fertilizer with a good N and K availability but without any P availability leading to an unlevelled plant nutrition.
Meat-and-bone meal ashes failed on sandy and loamy soils, too. This is most probably also due to apatites as the main binding form of P in ashes. However, sintering of meat-and-bone meal together with soda and quartz sand results in a product (Ulo-Phos) which reached a relative availability of 87 percent on sand and 65–74 percent on loam in comparison to TSP, that is, the product is suitable as fertilizer independently of the soil. A similar alkaline digestion, but based on sewage sludge ashes, was used to produce Ash-Dec. It also showed a good availability of 74–100% of TSP even at high soil pH values. Both products are similar to Rhenania phosphate or alkaline sinter phosphates from decades ago. However, using meat-and-bone meal instead of phosphate rock as substrate results in a product low in heavy metals. Furthermore, the production process doesn’t need harmful chemicals and is less accident-sensitive than a chemical wet digestion.
The results of the experiments with plant ashes cannot be discussed because SSP or TSP controls were lacking as well as a balancing fertilization with potassium and magnesium. However, by using plant ashes it has to be considered that their pH value is about 11 to 13, that is, similar to hydrated lime [13,33]. Consequently, soil pH will rise by using plant ashes as K or P fertilizer. This pH rise was from 6.9 to 7.5, that is, 0.6 pH units, on a highly pH buffered clay soil [33]. On less buffered sandy soils, a much higher rise of soil pH can be expected with the risk of micronutrient fixation, while on acid sandy soils the ash application could have an additional liming effect.
The cupola slag (Mephrec) failed on the acid sandy soil and performed very well on the neutral loamy soil. This is in contrast to most of the other P fertilizers and leads to the question about the P binding form in this product, which is still not known and needs further investigation. However, the slag also had a relatively high Al concentration. Therefore, phosphate might have been bound to Al, which would explain the relation between soil pH and solubility.
For the tested Ca-phosphates the results are heterogeneous, regardless if precipitated with Ca(OH)2 or crystallized on calcium-silicate-hydrate surfaces (Table 21). P-Roc 09, Fix-P, SESAL and a further Ca-phosphate failed completely on the loamy soil; they showed a relative availability of 0–25 percent of TSP. The Pasch products reached 26–50 percent on sand and once 51–75 percent each on sand and loam. The experiment with rye seedlings (Table 18) indicated that the solubility of Ca phosphates steadily decreased with an increasing Ca content in the binding forms up to apatites. All tested products might have a mixture of primary, secondary, and tertiary phosphates and apatites. The composition defines the fertilizer efficiency. With the technologies used it seems impossible to influence the precipitation or sorption conditions in a way that mainly primary and secondary phosphates occur which would be desirable. An exception might be the PASCH process, where P is first leached out of the sewage sludge ash and afterwards precipitated by increasing the pH value of the leachate. This allows a better control of the precipitation process compared to the other procedures and might be the reason for the better availability on loamy soils. In general, Ca-phosphates are better soluble at low pH values. This is confirmed in the described pot experiments, because availability on the strongly acid sands was higher than on the slightly acid loamy soils. It is rather astonishing that even at pH values as low as 4.4–4.7 availability remains less than 75% of TSP. Therefore, these products are unsuitable for most soils. However, the products can be used as substrate for digestion with sulfuric or phosphoric acids, as is done for production of SSP or TSP. Another possibility would be the production of elemental P under reductive conditions with coke [34]. Elemental P can be used for further industrial processes.
The good fertilizer effect of the tested Mg-phosphates produced by the Seaborn procedure is remarkable. They performed as well as the pure Mg3(PO4)·4H2O. All Mg-phosphates had a better availability than the recycled Ca-phosphates, which is also given for the Mg-treated ashes (Table 6 and Table 13). Magnesium-ammonium-phosphates (MgAP), that is, struvite, showed the best availability of all tested substances and can be recommended as P fertilizer. The MgAP from Stuttgart (MgAP St) was tested on four soils by two institutes and led to a relative P uptake of 81–103 percent, MgAP Seaborne (MgAP Sb) reached 64–129 percent, and only uptake from MgAP Gifhorn (MgAP Gf) was a bit lower with 45–92 percent (Table 19). The good availability of MgAPs was also shown by [29] in an experiment with rye seedlings. The comparably low availability of the MgAP Gf is probably due to a relative high Fe concentration. It was, with 5.5 percent, much higher than for the other two tested MgAPs, with 0.4–1 percent [35]. The availability of Fe-phosphates is lower than for Ca- or Mg-phosphates (Table 18). It is possible that during the production of the MgAP product in the sewage works part of the phosphate is already precipitated as Fe-phosphate, or that this happens in the soil after solving of the MgAP in close vicinity to Fe. In a first attempt, the good availability of MgAPs is surprising, because water solubility is regarded as very low. With the method of VDLUFA [36] only 0.5–2 percent of MgAPs is water soluble [29,35], whereas water solubility of SSP or TSP is 84 and 93 percent, respectively. However, the VDLUFA method measures water solubility with a narrow relation of fertilizer to water (10g in 500 mL). At this relation, the equilibrium concentration of MgAP is easily reached and no further MgAP can be solved. In [37], it was shown that the equilibrium concentration of MgAP is higher than an average soil solution concentration. In soils, the P buffer capacity keeps the soil solution concentration relatively stable and below the equilibrium concentration of MgAP, resulting in a steady state equilibrium by which all MgAP can be solved.
Therefore, and also according to [35] the parameter ‘water solubility’ as well as ‘citrate solubility’ are not good measures to describe plant availability of P fertilizer. A much better correlation to plant uptake was given for soil solution concentration (CL) or the isotopically exchangeable phosphate (IEP). Both parameters had been measured in soil samples without plants and three weeks after fertilization. For MgAPs the values of CL and IEP were in the same order than for TSP. For cupola slag, IEP was much higher in the neutral loam compared to the acid sand which is in accordance to plant availability. The same relation between IEP and availability was found for Ca-phosphates, however with a different relation to soil pH, higher IEP values on the acid sands and lower ones for neutral loam. The conclusion of the authors was that isotopically exchangeable phosphate would be a good method for assessing the plant availability of phosphate in P recycling products.
Most of the described experiments had been performed as pot experiments; thus, for a final conclusion about the suitability of the recycling products as fertilizers, field experiments are necessary, at least with the most promising products like MgAP or Sinter-P. However, a number of field experiments are still relatively scarce and a P fertilizer effect is often not visible due to the high P supply level of most soils. In parallel to the pot experiments, [17] also tested some of the products in field experiments on three different sites in a 3 year crop rotation with winter barley, rapeseed, and winter wheat. Despite the fact that all sites were in a ‘very poor’ P supply level according to VDLUFA [6] (CAL-P: 18–21 mg/kg) there was no fertilizer effect. All fertilized treatments achieved the same biomass production, grain yield, and P uptake as the unfertilized control.
5. Conclusions
The fertilizer effect of the tested P recycling products can clearly be differentiated: TSP = MgAP > Mg-P = sinter-P > Ca-P, cupola-slag > thermally treated sewage sludge ashes > meat-and-bone meal ash = Fe-P.
A phosphate availability comparable to TSP or SSP was only given for struvite, that is, magnesium-ammonium-phosphate, if it was poor in Fe impurities. An unacceptable low availability was found for Fe-phosphates, meat-and-bone meal ashes, and sewage sludge ashes, even though they were thermally treated together with CaCl2. All other products, precipitates or slags, are grouped in between these two extremes. Magnesium phosphates, either precipitates or treated ashes, had a higher availability than Ca-phosphates. The tested Ca-phosphates are most probably tertiary phosphates or apatites which are unsuitable as fertilizers. However, they can be used as substrate for further chemical digestions to produce fertilizers like SSP or TSP. Also, a reduction, together with coke, to elemental P is possible. An acceptable availability was achieved with alkaline sintered meat-and-bone meal (Ulo-Phos) and at least on neutral soil for cupola slag. Further developments in P recycling processes should take these findings into account.
Most of the described results were obtained in pot experiments, and need a confirmation in field experiments. Field experiments need a longer time scale, because soil processes for P are much slower compared to, for instance, nitrogen. Relatively quick and probably good information about expected availability can be achieved by the isotopically exchangeable P (IEP) method. Hence, this method can be used to select promising products for field experiments.
Acknowledgments
We acknowledge support by the German Research Foundation and the Open Access Publication Funds of the Georg-August University, Göttingen.
Author Contributions
This review was prepared by W. Römer, revised and translated by B. Steingrobe.
Conflicts of Interest
The authors declare no conflict of interest.
References
- Scholz, R.W.; Wellmer, F.-W. Approaching a dynamic view on the availability of mineral resources: What we may learn from the case of phosphorus? Glob. Environ. Chang. 2013, 23, 11–27. [Google Scholar] [CrossRef]
- US Geological Survey. Available online: https://minerals.usgs.gov/minerals/pubs/commodity/phosphate_rock/mcs-2017-phosp.pdf (accessed on 10 November 2017).
- Anonymus Understanding Phosphorus and Its Use in Agriculture. European Fertilizer Manufactures Association (EFMA). Available online: www.efma.org/publications/phosphorus/understanding%20phosphorus/Final%20phosphorus.pdf (accessed on 20 March 2017).
- Werner, W. Düngung von Böden. In Handbuch der Bodenkunde; John Wiley & Sons, Inc.: Hoboken, NJ, USA, 2006; pp. 1–63. [Google Scholar]
- Leinweber, P.; Geyer-Wedell, K.; Jordan, E. Phosphorversorgung der Böden im agrarischen Intensivgebiet Südoldenburg; Vechtaer Druckerei und Verlag GmbH: Vechta, Germany, 1993; pp. 1–67. [Google Scholar]
- Kerschberger, M.; Hege, U.; Jungk, A. Phosphordüngung nach Bodenuntersuchung und Pflanzenbedarf. In VDLUFA-Standpunkt; Eigenverlag: Darmstadt, Germany, 1997. [Google Scholar]
- Römer, W. Ansätze für eine effizientere Nutzung des Phosphors auf der Basis experimenteller Befunde. Berichte über Landwirtschaft. Zeitschrift für Agrarpolitik und Landwirtschaft 2009, 87, 5–30. [Google Scholar]
- DWA. Stand der Klärschlammbehandlung und Entsorgung in Deutschland. Deutsche Vereinigung für Wasserwirtschaft; Deutsche Vereinigung für Wasserwirtschaft: Hennef, Germany, 2005; ISBN 3-937758-29-1. [Google Scholar]
- STN (Servicegesellschaft Tierische Nebenprodukte) 2007. Available online: www.stn-vvtn.de/fakten_zahlen.php (accessed on 1 December 2012).
- Dohmann, M. Entstehung und Begleitung der Förderinitiative P-Recycling. Gewässerschutz Wasser Abwasser GWA 2011, 228, 1–7. [Google Scholar]
- Adam, C.; Peplinsk, B.; Kley, G.; Kratz, S.; Schick, J.; Schnug, E. Phosphorrückgewinnung aus Klärschlammaschen—Ergebnisse aus dem EU-Projekt SUSAN. Österreichische Wasser- und Abfallwirtschaft 2008, 60, 55–64. [Google Scholar] [CrossRef]
- Kabbe, C. Sustainable Sewage Sludge Management Fostering Phosphorus Recovery. Bluefacts 2013. Available online: http://www.kompetenz-wasser.de/wp-content/uploads/2017/05/kabbe_bluefacts_2013_36-41.pdf (accessed on 10 April 2018).
- Schiemenz, K.; Eichler-Löbermann, B. Nutzung von Biomasseaschen für die Phosphorversorgung im Pflanzenbau (Schlussbericht für die Fachagentur für Nachwachsende Rohstoffe e.V. in Gülzow (Mecklenburg-Vorpommern). Available online: http://www.fnr-server.de/ftp/paf/berichte/22016206.pdf (accessed on 1 December 2012).
- Schick, J.; Kratz, S.; Adam, C.; Herrmann, L.; Kley, G.; Schnug, E. Agronomical Potential of P fertilisers made from sewage sludge ashes—The EU-Project SUSAN. In Proceedings of the EUROSOIL-Congress, Wien, Germany, 25–29 August 2008. [Google Scholar]
- Schick, J. Untersuchungen zur P-Düngerwirkung und Schwermetallgehalten Thermochemisch Behandelter Klärschlammaschen. Ph.D. Thesis, TU Braunschweig, Braunschweig, Germany, 2010. [Google Scholar]
- Waida, C.; Weinfurtner, K.-H. Untersuchung der in der Förderinitiative erzeugten Produkte. In Abschlussbericht: Phosphorrecycling—Ökologische und wirtschaftliche Bewertung verschiedener Verfahren und Entwicklung eines strategischen Verwertungskonzeptes für Deutschland (PhoBe); Institut für Siedlungswasserwirtschaft, RWTH: Aachen, Germany, 2011; pp. 97–162. [Google Scholar]
- Cabeza, R.A. Phosphorus Dynamics in Soil and Plant Availability of Fertilizers from Phosphorus Recycling Evaluated in Field and Pot Experiments. Ph.D. Thesis, Georg-August-University, Göttingen, Germany, 2010. [Google Scholar]
- Scheidig, K.; Schaaf, M.; Mallon, J. Profitable recovery of phosphorus from sewage sludge and meat & bone meal by the Mephrec process—A new means of thermal sludge and ash treatment. In International Conference on Nutrient Recovery from Waste Water Streams; IWA Publishing: London, UK, 2009; pp. 563–566. [Google Scholar]
- Vesterager, N.O. Erfahrungen zur Phosphorrückgewinnung mit dem Seaborne-Verfahren. In Tagungsband zum Symposium, Rückgewinnung von Phosphor in der Landwirtschaft und aus Abwasser und Abfall; des UBA: Berlin, Germany, 2003. [Google Scholar]
- Heinzmann, B.; Engel, G. Phosphor-Recycling bei Kläranlagen mit biologischer Phosphorelimination. In Tagungsband zum Symposium „Rückgewinnung von Phosphor in der Landwirtschaft und aus Abwasser und Abfall; des UBA: Berlin, Germany, 2003. [Google Scholar]
- Berg, U.; Knoll, G.; Kaschka, E.; Kreutzer, V.; Weidler, P.; Nüesch, R. P-ROC-phosphorus recovery from waste water by crystallisation of Ca phosphate compounds. J. Resid. Sci. Technol. 2007, 4, 121–126. [Google Scholar]
- Ehbrecht, A.; Patzig, D.; Schönauer, S.; Schwotzer, M.; Schuhmann, R. Crystallisation of calcium phosphate from sewage: Efficiency of batch mode technology and quality of the generated products. In International Conference on Nutrient Recovery from Waste Water Streams; IWA Publishing: London, UK, 2009; pp. 521–530. [Google Scholar]
- Rummel, P. Plant Availability of Fertilizers from Phosphorus Recycling in a Pot Experiment with High Soil pH. Master’s Thesis, Georg-August-University, Göttingen, Germany, 2015. [Google Scholar]
- Berg, U. P-Roc—Ein Verfahren zur P-Rückgewinnung aus Abwässern durch Abscheidung von Calciumphosphat-Mineralphasen an Tobermorit; Institut WAR: Darmstadt, Germany, 2005. [Google Scholar]
- Petzelt, S.; Cornel, P. Neue Wege des Phosphorrecyclings aus Klärschammaschen. Korrespondenz Abwasser 2010, 57, 4. [Google Scholar]
- Petzelt, S.; Peplinski, B.; Cornel, P. Phosphorus and Aluminum recovery from sewage sludge ash by a novel two step wet chemical elution process (SESAL-Phos-Recovery Process). In Proceedings of the WEF/IWA Conference, Xi’an, China, 20–22 September 2011. [Google Scholar]
- Montag, D. Phosphorrückgewinnung bei der Abwasserreinigung. Entwicklung eines Verfahrens zur Integration in Kommunalen Kläranlagen. Ph.D. Thesis, RWTH, Aachen, Germany, 2008. [Google Scholar]
- Montag, D.; Gethke, K.; Pinnekamp, J. Different strategies for recovering phosphorus: Technologies and costs. In International Conference on Nutrient Recovery from Waste Water Streams; IWA Publishing: London, UK, 2009; pp. 159–167. [Google Scholar]
- Römer, W. Vergleichende Untersuchungen zur Pflanzenverfügbarkeit von Phosphat aus verschiedenen P-Recycling-Produkten im Keimpflanzenversuch. J. Plant Nutr. Soil Sci. 2006, 169, 826–832. [Google Scholar] [CrossRef]
- Seaborne-EPM-AG, Seaborne Umwelttechnik. 2010. Available online: http://www.seaborne-erl.de/englisch/index.html (accessed on 1 December 2012).
- Günther, L.; Dockhorn, T.; Dichtl, N.; Müller, J.; Urban, I.; Phan, L.; Weichgrebe, D.; Rosenwinkel, K.; Bayerle, N. Technical and scientific monitoring of the large-scale seaborne technology at the WWTP Gifhorn. Water Pract. Technol. 2008. [Google Scholar] [CrossRef]
- Weidelener, A. Phosphorrückgewinnung aus Kommunalem Klärschlamm als Magnesium-Ammonium-Phosphat (MAP). Ph.D. Thesis, University of Stuttgart, Stuttgart, Germany, 2010. [Google Scholar]
- Biertümpfel, A.; Heydrich, R.; Graf, T.; Vetter, A. Düngung mit Presskuchen und Strohasche—Auswertung 14jähriger Versuchsergebnisse. Thüringische Landesanstalt für Landwirtschaft 2010. Available online: http://www.tll.de/ainfo/pdf/asch0210.pdf (accessed on 10 April 2018).
- Schipper, W.J.; Klapwijk, A.; Potjer, B.; Rulkens, W.H.; Temmink, B.G.; Kiestra, F.D.G.; Lijmbah, A.C.M. Phosphate recycling in the phosphorus industry. Environ. Technol. 2001, 22, 1337–1346. [Google Scholar] [CrossRef] [PubMed]
- Cabeza, R.A.; Steingrobe, B.; Römer, W.; Claassen, N. Effectiveness of recycled P products as P fertilizers, as evaluated in pot experiments. Nutr. Cycl. Agroecosyst. 2011, 91, 173–184. [Google Scholar] [CrossRef]
- VDLUFA. Methodenbuch Band II: Untersuchung von Düngemitteln; VDLUFA-Verlag: Darmstadt, Germany, 1995. [Google Scholar]
- Steingrobe, B.; Cabeza, R. Magnesium-Ammonium-Phosphate—Why is it Plant Available Despite a Low Water Solubility? In Proceedings of the XVII. International Plant Nutrition Colloquium, Istanbul, Turkey, 19–22 August 2013; pp. 905–906. [Google Scholar]
Figure 1.
Phosphorus supply level of soils in Europe as measured and evaluated by the particular national methods (redrawn, data taken from [3]).
Figure 1.
Phosphorus supply level of soils in Europe as measured and evaluated by the particular national methods (redrawn, data taken from [3]).

Table 1.
Development of resources, world production, and static lifetime of phosphate rock ores [2].
Table 1.
Development of resources, world production, and static lifetime of phosphate rock ores [2].
| Year | Production | Reserve | Lifetime |
|---|---|---|---|
| 106 t | 106 t | Years | |
| 2006 | 142 | 18,000 | 127 |
| 2007 | 156 | 18,000 | 115 |
| 2008 | 161 | 15,000 | 93 |
| 2009 | 166 | 16,000 | 96 |
| 2010 | 181 | 65,000 | 359 |
| 2011 | 198 | 71,000 | 359 |
| 2012 | 217 | 67,000 | 309 |
| 2013 | 225 | 67,000 | 298 |
| 2014 | 218 | 67,000 | 307 |
| 2015 | 241 | 69,000 | 286 |
| 2016 | 261 1 | 68,000 | 260 |
1 expected.
Table 2.
Regional distribution of resources and production of phosphate rock ore in 2016 [2].
Table 2.
Regional distribution of resources and production of phosphate rock ore in 2016 [2].
| Country | Mine Production 1 | Reserves |
|---|---|---|
| 106 t ore | 106 t ore | |
| World total | 261.0 | 68,000 |
| Algeria | 1.5 | 2200 |
| Australia | 2.5 | 1100 |
| Brazil | 6.5 | 20 |
| China 2 | 138.0 | 3100 |
| Egypt | 5.5 | 1200 |
| India | 1.5 | 65 |
| Israel | 3.5 | 130 |
| Jordan | 8.3 | 1200 |
| Kazakhstan | 1.8 | 260 |
| Mexico | 1.7 | 30 |
| Morocco and Western Sahara | 30.0 | 50,000 |
| Peru | 4.0 | 820 |
| Russia | 11.6 | 1300 |
| Saudi Arabia | 4.0 | 680 |
| South Africa | 1.7 | 1500 |
| Syria | - | 1800 |
| Togo | 0.9 | 30 |
| Tunisia | 3.5 | 100 |
| United States | 27.8 | 1100 |
| Vietnam | 2.8 | 30 |
| Other Countries | 2.4 | 810 |
1 estimated; 2 Production data for large mines only.
Table 3.
Relative distribution of P supply level classes on arable land in Germany (12 mill. ha) [4].
Table 3.
Relative distribution of P supply level classes on arable land in Germany (12 mill. ha) [4].
| Class 1 | Arable Land in Germany, 2006 | |
|---|---|---|
| (Supply Level) | mg P/kg Soil 2 | % |
| E (very high) | >151 | 12 |
| D (high) | 91–150 | 29 |
| C (recommended) | 45–90 | 38 |
| B (low) | 21–44 | 18 |
| A (very low) | <20 | 3 |
1 according to VDLUFA (1997) [6]; 2 calcium-acetate-lactate extraction (CAL).
| P-Containing Waste | DM/Year | P-Concentration | H | P-Amount | ||
|---|---|---|---|---|---|---|
| t | % | t | ||||
| Sewage sludge | 2,400,000 | × | 2 | = | 48,000 | |
| Milled animal residues | 400,000 | × | ca. 3 | = | 12,000 | |
| Meat-and-bone meal | 160,000 | × | ca. 6 | = | 9600 | |
| Sum | ca. 70,000 | |||||
| Consumption of mineral P fertilizer | 2003/2004 1 | 124,000 | ||||
| 2006/2007 1 | 116,000 | |||||
| 2008/2009 1 | 76,000 | |||||
| 2009/2010 1 | 103,000 | |||||
1 according to official statistics for Germany (Statistisches Jahrbuch 2011, https://www.destatis.de/DE/Publikationen/StatistischesJahrbuch/StatistischesJahrbuch2011.pdf?__blob=publicationFile).
Table 5.
P uptake of maize (cultivar “Prinz”) in 10 weeks in a pot experiment. Substrate was a 1:1 mixture of a sandy soil and a muck (CAL-P: 21 mg/kg soil) with a P application of 500 mg P/pot (8 kg). P was applied in the form of two sewage sludge ashes (SSA) and single superphosphate (SSP). ([15] values are taken from Figure 4.13).
| No. | P-Form | Sludge Treatment | Uptake mg P/Pot | From Fertilizer mg P/Pot | Uptake Relative to SSP (%) |
|---|---|---|---|---|---|
| 1 | without | - | 78 a | - | - |
| 2 | SSP | - | 98 b | 20 | 100 |
| 3 | SSA 1 | CaCl2 (direct) | 77 a | 0 | 0 |
| 4 | SSA 1 | CaCl2 (indirect) | 80 a | 2 | 10 |
| 5 | SSA 1 | MgCl2 (indirect) | 86 ab | 8 | 40 |
| 6 | SSA 2 | CaCl2 (direct) | 82 a | 4 | 20 |
| 7 | SSA 2 | CaCl2 (indirect) | 78 a | 0 | 0 |
| 8 | SSA 2 | MgCl2 (indirect) | 82 a | 4 | 20 |
| 9 | SSA 2 | CaCl2 (direct) | 82 a | 4 | 20 |
| 10 | SSA 2 | CaCl2 (indirect) | 84 ab | 6 | 30 |
Different letters indicate statistical differences.
Table 6.
P uptake of winter wheat (cultivars “Disponent” = D, “Monopol” = M) in 12 weeks in a pot experiment. Substrate was a 1:1 mixture of a sandy soil and a muck (CAL-P: 21 mg/kg soil) with a P application of 500 mg P/pot (8 kg). P was applied in the form of two sewage sludge ashes (SSA) and single superphosphate (SSP). ([15] values are taken from Figure 4.15b).
| No. | P-Form | Sludge Treatment | Uptake mg P/Pot | From Fertilizer mg P/Pot | Uptake Relative to SSP (%) | |||
|---|---|---|---|---|---|---|---|---|
| D | M | D | M | D | M | |||
| 1 | without P | - | 66 a | 58 a | - | - | - | - |
| 2 | SSP | - | 108 e | 98 d | 42 | 40 | 100 | 100 |
| 3 | SSA 1 | CaCl2 (indirect) | 82 bc | 67 a | 16 | 9 | 38 | 23 |
| 4 | SSA 1 | MgCl2 (indirect) | 89 c | 85 bc | 23 | 27 | 54 | 67 |
| 5 | SSA 2 | CaCl2 (indirect) | 82 bc | 60 a | 16 | 2 | 38 | 5 |
| 6 | SSA 2 | CaCl2, H2SO4 (indirect) | 87 bc | 79 b | 21 | 19 | 50 | 48 |
Different letters indicate statistical differences.
Table 7.
Characteristics of the soils used by [17] to test plant availability of different recycling products in a two years pot experiment with maize.
Table 7.
Characteristics of the soils used by [17] to test plant availability of different recycling products in a two years pot experiment with maize.
| Location | Clay | Silt | Sand | Org. Substance | pH | CAL-P |
|---|---|---|---|---|---|---|
| % | (CaCl2) | mg/kg | ||||
| Düshorn | 2 | 5 | 93 | 5.3 | 4.4 | 24 |
| Gieboldehausen | 25 | 70 | 5 | 2.8 | 6.8 | 20 |
| Sattenhausen | 11 | 87 | 2 | 1.7 | 5.6 | 19 |
CAL-P = Calcium-acetate-lactate extraction.
Table 8.
P-uptake after fertilization with triple superphosphate (TSP) and a SSA decontaminated from heavy metals by Cl addition (SSA dec.). P-addition: 360 mg P/pot (6 kg) [17].
Table 8.
P-uptake after fertilization with triple superphosphate (TSP) and a SSA decontaminated from heavy metals by Cl addition (SSA dec.). P-addition: 360 mg P/pot (6 kg) [17].
| Treatment | Düshorn | Gieboldehausen | Sattenhausen | ||||||
|---|---|---|---|---|---|---|---|---|---|
| 2007 | 2008 | Sum | 2007 | 2008 | Sum | 2007 | 2008 | Sum | |
| P uptake mg/pot | |||||||||
| without P | 73 | 74 | 147 | 58 | 49 | 107 | 98 | 101 | 199 |
| TSP | 132 | 91 | 223 | 123 | 105 | 228 | 157 | 108 | 265 |
| SSA dec. | 81 | 79 | 160 | 92 | 71 | 163 | 117 | 106 | 223 |
| P uptake from fertilizer mg/pot 1 | |||||||||
| TSP | 59 | 17 | 76 | 65 | 56 | 121 | 59 | 7 | 66 |
| SSA dec. | 8 | 5 | 13 | 34 | 22 | 56 | 19 | 5 | 24 |
| P uptake from SSA relative to TSP (%) | |||||||||
| TSP | 100 | 100 | 100 | 100 | 100 | 100 | 100 | 100 | 100 |
| SSA dec. | 14 | 29 | 17 | 52 | 39 | 46 | 32 | 71 | 36 |
1 = P uptake minus P uptake of unfertilized control.
Table 9.
P uptake of maize (cultivar “KX-5011”) in a pot experiment (growth chamber) growing on a sandy soil (pH: 4.7 (CaCl2), CAL-P: 57 mg/kg) after application of 360 mg P/pot (6 kg) as decontaminated Ash, TSP, or phosphate rock (PR). ([16] Figure 5.27, 1. experiment).
Table 9.
P uptake of maize (cultivar “KX-5011”) in a pot experiment (growth chamber) growing on a sandy soil (pH: 4.7 (CaCl2), CAL-P: 57 mg/kg) after application of 360 mg P/pot (6 kg) as decontaminated Ash, TSP, or phosphate rock (PR). ([16] Figure 5.27, 1. experiment).
| Treatment | 1. Crop | 2. Crop | ||||
|---|---|---|---|---|---|---|
| P-Uptake | Uptake from Fertilizer | P-Uptake | Uptake From Fertilizer | |||
| mg P/Pot | mg P/Pot | Relative (%) | mg P/Pot | mg P/Pot | Relative (%) | |
| without P | 165 | 0 | - | 144 | - | - |
| TSP | 252 | 87 | 100 | 180 | 36 | 100 |
| PR | 183 | 18 | 21 | 156 | 12 | 33 |
| Ash-08 | 186 | 21 | 24 | 156 | 12 | 33 |
Table 10.
Pot experiment according to Table 9 with a silt loam (pH: 5.4 (CaCl2), CAL-P: 33 mg/kg) ([16] Figure 5.30, 2. experiment).
| Treatment | P Uptake | P Uptake from Fertilizer | |
|---|---|---|---|
| mg P/Pot | mg P/Pot | Relative (%) | |
| without P | 217 | 0 | - |
| TSP | 259 | 42 | 100 |
| PR | 217 | 0 | 0 |
| Ash-09 | 234 | 17 | 40 |
Table 11.
Pot experiment according to Table 9 with maize grown on a sandy soil testing a product of the Bundesanstalt für Materialforschung (BAM) ([16] Figure 5.31 3. experiment).
| Treatment | P Uptake | P Uptake from Fertilizer | |
|---|---|---|---|
| mg P/Pot | mg P/Pot | Relative (%) | |
| without P | 129 | 0 | - |
| TSP | 200 | 71 | 100 |
| PR | 129 | 0 | 0 |
| BAM | 161 | 32 | 45 |
Table 12.
Pot experiment according to Table 9 with maize grown on a loamy silt (pH: 5.4 (CaCl2), CAL-P: 33 mg/kg) testing a product of the Bundesanstalt für Materialforschung (BAM) ([16] 2011, Figure 5.32).
| Treatment | P Uptake | Uptake from Fertilizer | |||
|---|---|---|---|---|---|
| mg P/Pot | mg P/Pot | Relative (%) | |||
| 1. crop | 2. crop | sum | - | - | |
| without P | 143 | 183 | 326 | 0 | - |
| TSP | 194 | 200 | 394 | 68 | 100 |
| PR | 133 | 202 | 335 | 9 | 13 |
| BAM | 172 | 187 | 359 | 33 | 49 |
Table 13.
P-uptake of Lolium perenne (sum of four cuts) grown on two loamy soils at different pH-values after a fertilization (30 mg P/kg soil, 2.8 kg soil/pot) with TSP and a SSA decontaminated from heavy metals by addition of MgCl2 (Ash-Dec, Outotec) [23].
Table 13.
P-uptake of Lolium perenne (sum of four cuts) grown on two loamy soils at different pH-values after a fertilization (30 mg P/kg soil, 2.8 kg soil/pot) with TSP and a SSA decontaminated from heavy metals by addition of MgCl2 (Ash-Dec, Outotec) [23].
| Treatment | Soil A | Soil B | ||
|---|---|---|---|---|
| pH 7.2 | pH 7.8 | pH 7.2 | pH 7.8 | |
| P uptake mg/pot | ||||
| without P | 43 | 43 | 43 | 46 |
| TSP | 72 | 74 | 75 | 69 |
| Ash-Dec | 70 | 66 | 77 | 64 |
| Uptake from fertilizer mg/pot | ||||
| TSP | 29 | 31 | 32 | 23 |
| Ash-Dec | 27 | 23 | 34 | 18 |
| relative uptake % | ||||
| TSP | 100 | 100 | 100 | 100 |
| Ash-Dec | 76 | 74 | 106 | 78 |
Table 14.
P uptake of maize (culivar “Atletico”) from three different recycling products (meat-and-bone meal ash (mb-ash), meat-and-bone meal sintered with soda and quartz sand (Ulo-Phos) and cupola-slag (Mephrec)) in comparison to triple superphosphate (TSP) and phosphate rock (PR). Experimental design like in Table 7 and Table 8 [17].
| Treatment | Düshorn (pH 4.4) | Gieboldehausen (pH 6.8) | Sattenhausen (pH 5.6) | |||
|---|---|---|---|---|---|---|
| 2007 | 2008 | 2007 | 2008 | 2007 | 2008 | |
| uptake mg P/pot | ||||||
| without P | 73 | 74 | 58 | 49 | 98 | 101 |
| TSP | 132 | 91 | 124 | 105 | 157 | 108 |
| PR | 89 | 92 | 50 | 61 | 100 | 99 |
| mb-ash | 81 | 73 | 78 | 65 | 95 | 117 |
| ULO-Phos | 115 | 98 | 101 | 85 | 125 | 123 |
| Mephrec | 79 | 86 | 130 | 125 | not determined. | |
| Summarized uptake of both years | ||||||
| mg P/pot | relative (%) | mg P/pot | relative(%) | mg P/pot | relative (%) | |
| TSP | 76 | (100) | 122 | (100) | 66 | (100) |
| PR | 34 | (45) | 4 | (3) | 0 | (0) |
| mb-ash | 7 | (9) | 36 | (30) | 13 | (20) |
| ULO-Phos | 66 | (87) | 79 | (65) | 49 | (74) |
| Mephrec | 18 | (24) | 148 | (121) | not determined | |
Table 15.
Effect of plant ashes (coarse colza meal ash (cma) and cereals ash (ca)) on yield and P uptake in a field experiment with spring-barley (2007) and maize (2008) grown on a loamy sand (pH: 5.7, DL-P: 67 mg/kg). Fertilization was 52 kg P/ha [13].
Table 15.
Effect of plant ashes (coarse colza meal ash (cma) and cereals ash (ca)) on yield and P uptake in a field experiment with spring-barley (2007) and maize (2008) grown on a loamy sand (pH: 5.7, DL-P: 67 mg/kg). Fertilization was 52 kg P/ha [13].
| Nr. | Treatment | Spring Barley (Grains) | Maize (Total Shoot) | ||
|---|---|---|---|---|---|
| P Uptake | Yield | P Uptake | Yield | ||
| kg/ha | dt/ha | kg/ha | dt/ha | ||
| (1) | without P, K, Mg | 11.6 a | 30 a | 32 a | 162 a |
| (2) | cma | 13.1 b | 35 b | 33 ab | 165 a |
| (3) | ca | 12.7 b | 33 ab | 37 bc | 178 b |
| relative (%) | |||||
| (1) | without P, K, Mg | 100 | 100 | 100 | 100 |
| (2) | cma | 113 | 116 | 103 | 102 |
| (3) | ca | 109 | 110 | 115 | 110 |
Different letters indicate statistical differences.
Table 16.
Net P uptake of maize (P uptake of fertilized treatment minus P uptake in unfertilized control) after fertilization of a crystalized Ca-phosphate (crystalized at a Ca-Si-hydrate surface) in comparison to triple superphosphate (TSP) and phosphate rock (PR). Experimental design like in Table 7 and Table 8 [17].
| Treatment | Düshorn (pH 4.4) | Gieboldehausen (pH 6.8) | Sattenhausen (pH 5.6) | |||
|---|---|---|---|---|---|---|
| mg P/pot | % | mg P/pot | % | mg P/pot | % | |
| TSP | 76 | 100 | 122 | 100 | 66 | 100 |
| PR | 34 | 45 | 4 | 3 | 0 | 0 |
| Ca-P 1 | 66 | 87 | 31 | 25 | 10 | 15 |
1 The Ca-phosphate was delivered from and is described in [21].
Table 17.
Pot experiment according to Table 9 and Table 10. Relative P uptake from Ca-phosphates in relation to uptake from TSP on a sandy and loamy soil. ([16] 2011. Figures 5.27, 5.30, 5.31 and 5.32).
| Treatment | Sand | Loam | ||
|---|---|---|---|---|
| Experiment 1 | Experiment 3 | Experiment 2 | Experiment 3 | |
| 1. crop 1 | 1. crop 2 | 1. crop | 1. crop | |
| TSP | 100% | 100% | 100% | 100% |
| PR | 21% | 0% | 0% | 0% |
| P-Roc 08 3 | 34% | - | - | - |
| P-Roc 09 3 | - | - | 0% | - |
| Fix-Phos 4 | - | - | 0% | - |
| SESAL 5 | - | - | 0% | - |
| Pasch I 6 | 34% | - | - | - |
| Pasch II 6 | - | 55% | - | 51% |
| Pasch III 6 | - | 45% | - | 51% |
Table 18.
Pot experiments with rye seedlings (21 days old) grown in sand. Net P uptake (uptake of fertilized minus unfertilized treatment) from 12 different P salts [29].
Table 18.
Pot experiments with rye seedlings (21 days old) grown in sand. Net P uptake (uptake of fertilized minus unfertilized treatment) from 12 different P salts [29].
| P Treatment | Origin of Material | Net P Uptake 1 | |
|---|---|---|---|
| mg P/Pot | Relative (%) | ||
| Ca(H2PO4)2·H2O | Fluka | 13.6 | 100 |
| Ca(HPO4)2·H2O | Merck | 12.7 | 93 |
| Ca3(PO4)2·H2O | Budenheim 2 | 8.2 | 60 |
| Apatite | Kola-Peninsula, Russia | 1.4 | 10 |
| Mg(H2PO4)2 | Budenheim 2 | 13.2 | 97 |
| MgHPO4·3H2O | Budenheim 2 | 16.0 | 117 |
| Mg3(PO4)2·4H2O | Budenheim 2 | 13.8 | 101 |
| FePO4 | Budenheim 2 | 0.1 | <1 |
| AlPO4·H2O | Budenheim 2 | 6.8 | 47 |
| Mg-phosphate | Seaborne 3 | 15.9 | 110 |
| Ca-phosphate | Seaborne 3 | 9.0 | 63 |
| Fe-phosphate | Seaborne 3 | 1.8 | 13 |
| lsd, Tukey (p = 0.05) | - | 3.3 | 24 |
1 Uptake of fertilized minus unfertilized treatment; 2 Chemische Fabrik Budenheim; 3 Seaborne/Owschlag (Schleswig-Holstein).
Table 19.
P uptake of maize (culivar “Atletico”) from three different magnesium-ammonium-phosphates (MgAP) in comparison to triple superphosphate (TSP) and phosphate rock (PR). Experimental design like in Table 7 and Table 8 [17].
| Treatment | Düshorn | Gieboldehausen | Sattenhausen | ||||||
|---|---|---|---|---|---|---|---|---|---|
| P Uptake, mg | Relative | P Uptake, mg | Relative | P Uptake, mg | Relative | ||||
| Per Pot | From Fertilizer | (%) | Per Pot | From Fer-Tilizer | (%) | Per Pot | From Fer-Tilizer | (%) | |
| without P | 73 a | - | - | 58 a | - | - | 98 a | - | - |
| TSP | 132 b | 59 | (100) | 123 b | 65 | (100) | 157 c | 59 | (100) |
| MgAP-Sb 1 | 149 c | 76 | (129) | 124 b | 66 | (102) | 136 b | 38 | (64) |
| MgAP-Gf 2 | 111 b | 38 | (64) | 118 b | 60 | (92) | 128 b | 30 | (51) |
| MgAP-St 3 | 121 b | 48 | (81) | 127 b | 69 | (106) | 157 c | 59 | (100) |
| Average of the three MgAP | (91) | - | - | (100) | - | - | (71) | ||
| Average of MgAP Sb and St | (105) | - | - | (104) | - | - | (82) | ||
Different letters indicate statistical differences. 1 MgAP-Sb supplied by sewage works Owschlag, Schleswig-Holstein [30]; 2 MgAP-Gf supplied by sewage works Gifhorn (Lower Saxony) [31]; 3 MgAP-St supplied by the Institute for Sanitary Engineering, Water Quality and Solid Waste Management, University Stuttgart [32].
Table 20.
P uptake of maize (variety “KX 5011”) in a pot experiment on sand (refer to Table 9) ([16] 2011. Figure 5.27).
| Treatment | P Uptake, mg | ||
|---|---|---|---|
| Per Pot | From Fertilizer | Relative | |
| without P | 165 a | - | - |
| TSP | 252 b | 87 | 100 |
| MgAP-St 1 | 255 b | 90 | 103 |
| MgAP-Gf 2 | 204 ab | 39 | 45 |
| Mg-phosphate (Seaborne) | 258 b | 93 | 107 |
Table 21.
Arrangement of the tested P recycling products in “efficiency groups” according to their availability in comparison to single or triple superphosphate (=100%).
Table 21.
Arrangement of the tested P recycling products in “efficiency groups” according to their availability in comparison to single or triple superphosphate (=100%).
| Product | Sandy Soils (pH 4.4–4.7) | Loamy Soils (pH 5.4–6.8) | |||||||
|---|---|---|---|---|---|---|---|---|---|
| Efficiency Groups (%) | |||||||||
| 0–25 | 26–50 | 51–75 | 76–100 | 0–25 | 26–50 | 51–75 | 76–100 | ||
| Thermo-Chemical Products | |||||||||
| Table 5 | 8 Therm. Prod. | 6 | 2 | - | - | - | - | - | - |
| Table 6 | 4 Therm. Prod. | 2 | 1 | 1 (Mg-P) | - | - | - | - | - |
| Table 8 | SSA dec. | 1 | 1 | - | - | - | 3 | 1 | - |
| Table 9 | Ash-08 | 1 | 1 | - | - | - | - | - | - |
| Table 10 | Ash-09 | - | - | - | - | - | 1 | - | - |
| Table 11 | BAM | - | 1 | - | - | - | - | - | - |
| Table 12 | BAM | - | - | - | - | - | 1 | - | - |
| Sum | 10 | 6 | 1 | 5 | 1 | ||||
| Table 14 | mb-ash | 1 | - | - | - | 1 | 1 | - | - |
| Table 14 | Ulo-Phos | - | - | - | 1 | - | - | 2 | - |
| Table 13 | Ash-Dec | - | - | - | - | - | - | 1 | 3 (pH > 7) |
| Table 14 | Mephrec | 1 | - | - | - | - | - | - | 1 |
| Ca-phosphates (precipitates, crystalizations) | |||||||||
| Table 16 | Ca-phosphate | - | - | - | 1 | 2 | - | - | - |
| Table 17 | P-Roc 08 | - | 1 | - | - | - | - | - | |
| P-Roc 09 | - | - | - | - | 1 | - | - | - | |
| Fix-Phos | - | - | - | - | 1 | - | - | - | |
| SESAL | - | - | - | - | 1 | - | - | - | |
| Pasch I | - | 1 | - | - | - | - | - | - | |
| Pasch II | - | - | 1 | - | - | - | 1 | - | |
| Pasch III | - | 1 | - | - | - | - | 1 | - | |
| Table 181 | Seaborne Ca-P | - | - | 1 | - | - | - | - | - |
| Ca3(PO4)2·H2O | - | - | 1 | - | - | - | - | - | |
| Mg-phosphates | |||||||||
| Table 181 | Seaborne Mg-P | - | - | - | 1 | - | - | - | - |
| Mg3(PO4)2·H2O | - | - | - | 1 | - | - | - | - | |
| Table 20 | Seaborne Mg-P | - | - | - | 1 | - | - | - | - |
| Table 19 | MgAP, 9 Tests | - | - | 1 | 2 | - | - | 2 | 4 |
| Table 20 | MgAP, 2 Tests | - | 1 | - | 1 | - | - | - | - |
| Fe-phosphates | |||||||||
| Table 181 | Seaborne Fe-P | 1 | - | - | - | - | - | - | - |
| FePO4 | 1 | - | - | - | - | - | - | - | |
1 pure quartz sand.
© 2018 by the authors. Licensee MDPI, Basel, Switzerland. This article is an open access article distributed under the terms and conditions of the Creative Commons Attribution (CC BY) license (http://creativecommons.org/licenses/by/4.0/).
Share and Cite
MDPI and ACS Style
Römer, W.; Steingrobe, B. Fertilizer Effect of Phosphorus Recycling Products. Sustainability 2018, 10, 1166. https://doi.org/10.3390/su10041166
AMA Style
Römer W, Steingrobe B. Fertilizer Effect of Phosphorus Recycling Products. Sustainability. 2018; 10(4):1166. https://doi.org/10.3390/su10041166
Chicago/Turabian StyleRömer, Wilhelm, and Bernd Steingrobe. 2018. "Fertilizer Effect of Phosphorus Recycling Products" Sustainability 10, no. 4: 1166. https://doi.org/10.3390/su10041166
Note that from the first issue of 2016, this journal uses article numbers instead of page numbers. See further details here.