Sustainable Municipal Solid Waste Disposal in the Belt and Road Initiative: A Preliminary Proposal for Chengdu City


1
Faculty of Geosciences and Environmental Engineering, Southwest Jiaotong University, Chengdu 611756, China
2
Sichuan Province Cyclic Economy Research Centre, Southwest University of Science and Technology, Mianyang 621010, China
3
Institute of Innovation and Circular Economy, Asia University, Taiwan 413, China
*
Author to whom correspondence should be addressed.
Sustainability 2018, 10(4), 1147; https://doi.org/10.3390/su10041147
Submission received: 14 March 2018
/
Revised: 4 April 2018
/
Accepted: 9 April 2018
/
Published: 11 April 2018
(This article belongs to the Special Issue Sustainable Agribusiness Decision making model in Belt and Road Green Development)
Abstract
:The Chinese green Belt and Road initiative is promoted. This study takes Chengdu as a key hub under the Belt and Road initiative. The municipal solid waste disposal is the point to control pollution and move toward sustainability. Hence, sustainable municipal solid waste disposal needs to be studied. The prior studies are absent in the planning scenarios analysis. This study proposes a case study to propose three planning scenarios for waste disposal to enhance its sustainability. Scenario 1 represents the current waste disposal mode in Chengdu; Scenario 2 considers all the wastes being incinerated; and Scenario 3 focuses on the incorporation of three disposal methods, i.e., anaerobic digestion, incineration, and landfilling. These three scenarios are assessed based on their greenhouse gas emissions, costs, and public acceptance, to determine the optimality for future managerial practice. Results indicated that Scenario 3 has the highest overall efficiency, yet is challenging in terms of economic feasibility. The limitations of the study are also discussed.
1. Introduction
The Belt and Road Initiative is a proposition of China for strengthening partnerships among countries along the land-based “Silk Road Economic Belt” and the oceangoing “Maritime Silk Road”, through which 65 countries with about 16.0% of the world’s GDP, as well as a population of 4.4 billion are bound together [1,2]. Under the Belt and Road Initiative, emphasis has been placed on economic collaboration between countries in building an open, encompassing, green and shared economic mode [3]. The green economic growth calls for urban transition in response to the crisis of climate change [4]. Currently, the greenhouse gas emissions (GHGs) generated from municipal waste disposal accounts for 3% of worldwide emissions [5]. While striving for economic development and urbanization, countries also face the urgent issues of designing proper municipal solid waste (MSW) disposal plans and uncovering potential ways to reduce emissions [6]. Landfilling, incineration, and biological treatment (anaerobic digestion) are currently the most common ways of MSW disposal [7,8,9]. As conditions vary among countries, a dilemma usually occurs in the selection of disposal ways [10]. For example, the investment and operational costs of incineration and anaerobic digestion are generally higher than that of landfilling, but the latter contributes abundant landfill gases (LFGs) and leachate, which makes it difficult with respect to the reduction of GHGs and may even cause secondary environmental pollutions [11,12,13]. Therefore, it is essential to preferentially consider coordination among the economy, environment, and society when formulating an MSW disposal plan to increase its sustainability.
Legislation is a requisite to guide MSW management. For example, “The Law of the People’s Republic of China on the Prevention and Control of Environmental Pollution Caused by Solid Waste” is the key legislation in China on solid waste management [14], which stipulates that local government should formulate and promulgate specific measures for waste supervision and administration, including the establishment of collection, transport and treatment facilities [15,16]. This ensures the importance of analyzing the possible status quo of waste disposal to build appropriate planning scenarios for future management practices.
This study proposes three scenarios and assesses their GHGs, costs, and public acceptance, to select the optimal planning scenario for the promotion of sustainable waste disposal. A case study of Chengdu, a megacity in China and a key hub under the Belt and Road Initiative, was conducted to verify the scenario analysis. Chengdu, due to its economic, logistic, and technological advances, has been indicated as the best-performing city in Southwest China, which has immense potential to add value to the Belt and Road Initiative [17,18]. Due to its rapid urbanization, the amount of municipal solid wastes being generated rises by 5% each year [19], which brings intense challenges on the waste disposal and its associated GHGs reduction. Urban Management Bureau of Chengdu (UMBC) is responsible for the MSW collection and transportation, but there is neither meticulous source separation nor sorting for the waste before landfilling or incineration. The MSW is distinguished by the chemical properties of the involved constituent components, which is divided into organics and inorganics [20]. According to the investigation by UMBC, the organics reaches up to 76.5% of the total MSW, including food residue, wood waste, paper, textiles, plastics, and rubber [21]. Especially, food residue from households accounts for 59.7% of the organics, which shows great potential in energy recovery by using anaerobic digestion (AD) [22]. This study aims not only to provide insight into the design of MSW disposal plans for Chengdu city, but also gives a template of MSW disposal for countries under the Belt and Road Initiative to combat against climate change.
2. Literature Review
Recent studies on MSW disposal have mainly focused on its optimization, with most of the studies centered on the optimization of its economic performance. For example, Li et al. [23] developed an interval-based possibilistic programming (IBPP) model by taking uncertainties in costs of MSW collection, transportation, and disposal into account, to minimize the total cost of MSW disposal systems and the associated environmental impacts. By considering the economic uncertainties, including waste transportation and operational cost, Zhu and Huang [24] constructed a waste management privatization model to compare the service efficiency of different contract-out plans. Dai et al. [25] developed a two-stage support-vector-regression model to optimize the MSW disposal system in the city of Beijing by minimizing the net system cost. Economopoulou et al. [26] established restricted conditions based on the study area (the Attica Region in Greece) and constructed an optimized model with the aim of capital investment minimization of waste management. Similarly, Asefi and Lim [27] utilized a geographic information system (GIS) to optimize a MSW disposal system with consideration of its operations cost minimization. Das and Bhattacharyya [28] constructed a mixed integer program to optimize MSW collection and transportation routes, to increase its economic efficiency. On the same basis, Yadav et al. [29] developed an interval-valued facility location model with the aim of minimizing MSW transportation cost.
With the crisis of climate change looming, sustainable development has gained increasing attention. Reduction of GHGs is a significant indicator that drives sustainable waste management [30]. From such a perspective, many studies have been conducted to optimize MSW disposal systems by taking GHGs assessment into account. Wittmaier et al. [31] took Northern Germany as a case area and analyzed the GHGs generated from waste incineration and the associated energy recovery by using life cycle assessment (LCA). Similar research methods were applied in studies by Liamsanguan and Gheewala [32] and Cifrian et al. [33]. In the former study, the environmental benefits of MSW disposal combined landfilling with incineration were assessed in terms of GHGs and energy consumption, whereas the latter evaluated the potential emissions reductions, including recycling, composting, incineration, and landfilling. Based on this, Zhao et al. [34] used a combined LCA and life cycle costing (LCC) method to analyze the GHGs and economic performance of the MSW disposal of Tianjin City, ultimately to develop an eco-efficiency indicator evaluation system. Lu et al. [35] developed an inexact dynamic optimization model (IDOM) and obtained a trade-off solution between MSW disposal cost and GHGs. Similarly, Mavrotas et al. [36] constructed a planning model with the aim of minimizing GHGs and economic cost to optimize the capacity expansion of treatment units and the involved waste flows. Hanandeh et al. [37] designed different scenarios based on various waste management ways, including landfilling, composting, recycling, and anaerobic digestion, to assess the potential reduction of GHGs in each scenario. Pin et al. [38] further integrated the aforementioned MSW disposal scenarios into three scenarios, namely recycling, composting, and incineration, to select the best scenario based upon the greatest potential reduction of GHGs.
Prior studies have focused on the optimization of sequential MSW disposal systems, indicated from waste generation to the final disposal [39,40]. This study deliberately narrows down the systems boundary by only taking the disposal design into account, since countries under the Belt and Road Initiative have not formulated the appropriate plan to reduce the stocks of waste [41]. Moreover, the facilities for waste disposal are generally operated independently, without developing possible linkages among them [11,42]. This may result in inefficiency of energy recovery in waste disposal. This study takes Chengdu as a typical case area, to propose three possible waste disposal planning scenarios based upon interactions among the AD plant, incineration plant, and landfill disposal center. The three scenarios were then assessed and compared based on their GHGs, operational costs, and public acceptance, and the optimum scenario was selected to provide a template for waste management in developing countries covered by the Belt and Road Initiative.
3. Method and Data
3.1. Scenario Development
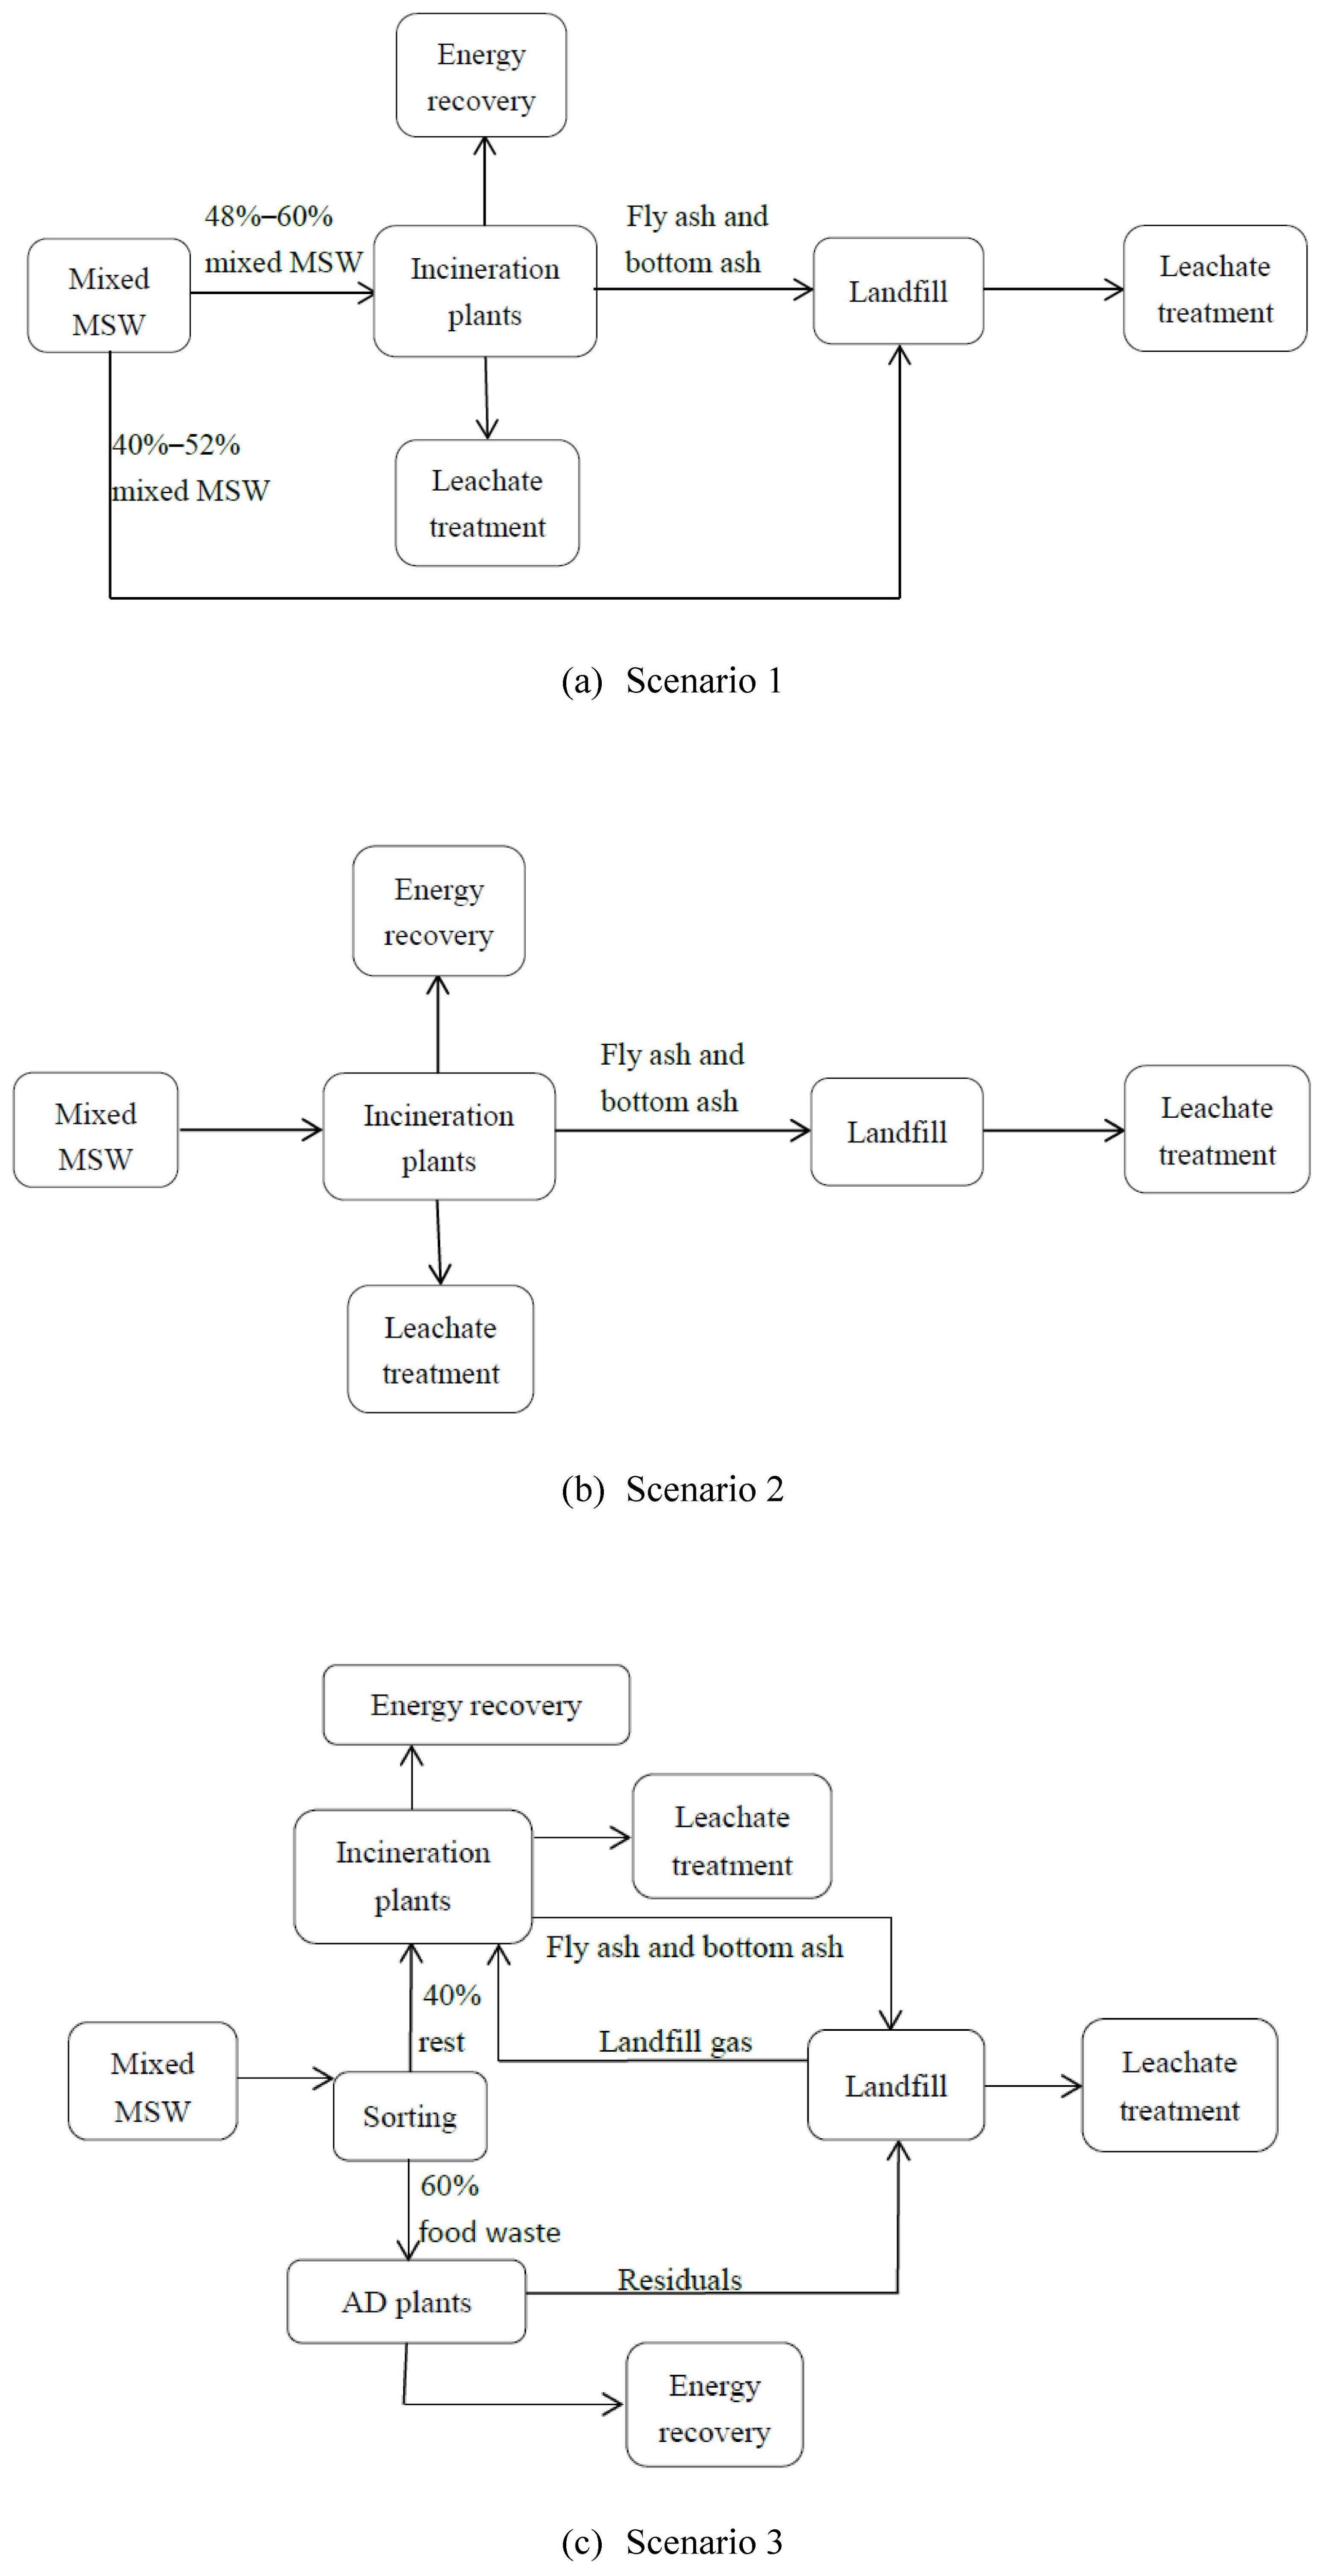
Three scenarios were proposed in the study, of which Scenario 1 is the benchmark scenario indicating the current waste disposal in the city of Chengdu, which involves a maximum of 52% of the wastes sent for landfill disposal, and the rest for incineration [19], as shown in Figure 1a. Since Chengdu has not implemented a system of waste classification and collection, the waste is in a mixed composition [43]. In this case, there is no difference on the composition between the waste for landfill disposal and the waste for incineration. The data indicated that 52% of the wastes were sent for landfill disposal is actually determined by the disposal capacity.
Scenario 2 considers all the MSW to be incinerated, because of its efficient waste reduction, with the residuals (fly and bottom ash) disposed via landfilling, as shown in Figure 1b. It is a planning scenario which reflects Chengdu’s governmental policy-making on waste treatment. Since landfill disposal is limited by the site selection, the local government has decided to establish more incineration plants to reinforce the performance of waste reduction [44]. According to the “Urban Planning of Chengdu City (2016–2035)”, all the MSW is preferred treatment by incineration instead of landfilling during the planning period [19]. Thus, Scenario 2 is proposed by taking an extreme condition into account, i.e., all the wastes sent for incineration are assumed as not being sorted, but remained as a mixed composition. Meanwhile, due to the high moisture content and low calorific value, the MSW cannot be incinerated completely without adding combustion improvers [42]. In such a case, MSW is piled up 3–7 days in storage bunkers for drying before incineration, through which a large amount of fresh leachate (20% by MSW weight) is produced [45]. Table 1 shows the variation of waste composition before and after stacking, in terms of the investigation by UMBC. It is clear that the mass proportion of food waste decreases significantly from 66.53% to 59.72%, whilst others fluctuate slightly. This further verifies that food waste contributes the most of fresh leachate because of dewatering during the period of stacking in the bunkers. The growth of the proportions of other compositions, i.e., paper, textiles, and wood, results from reduction of the total mass of mixed wastes after leachate discharging.
In Scenario 3, the MSW is classified into organic and inorganic. The organic part, e.g., food waste, is subjected to AD for biogas generation in order for further energy recovery. The inorganic MSW is handled through incineration, with the residuals disposed via landfilling. The LFGs is recovered and transported to the incineration plant where it is used to evaporate the waste leachate.
The study applies the inventory of greenhouse gases emissions proposed by the Intergovernmental Panel on Climate Change (IPCC) to assess the GHGs in different scenarios of waste disposal. Moreover, the study has incorporated ‘triple bottom line’ (economic, environmental, and social) into the selection of waste disposal plans to enhance its sustainability, instead of only taking GHGs reduction into account. The triple bottom line is a concept developed by Elkington, which offers a framework that simultaneously considers balances between economic, environmental, and social issues in business operations [46]. It has been widely used to evaluate sustainability performance in various fields, such as supply chain optimization, green buildings design, location of waste disposal facilities, etc. [47,48,49]. In this context, the marginal cost of per unit GHGs reduction by using the cost-benefit analysis is to analyze the economic sustainability among the three proposed scenarios. The social sustainability is indicated by the public acceptance to the facilities of waste disposal. As the three perspectives may have their inherent importance on the selection of disposal plan, a multi-attribute decision-making approach specifically by using a ‘binary dominant matrix’ is conducted to determine the optimal scenario for managerial practice with the best economic, environmental, and social performance.
3.2. GHG Emissions Assessment
In this study, the direct GHGs from MSW incineration, AD, and landfill disposal were assessed, as illustrated by the CO2 equivalents.
3.2.1. GHG Emissions from Incineration
CO2, CH4, and N2O are considered as the major components of the GHGs generated by waste incineration, which are given as follows [50]:
where is the annual GHGs in CO2 equivalents from MSW incineration, tons; is the annual CO2 emissions from MSW incineration, tons; is the annual CH4 emissions from MSW incineration, tons; is the annual N2O emissions from MSW incineration, tons; is the waste incinerated annually, tons; is the carbon content of the MSW, in %; is the oxidation efficiency of the MSW, in %; is the emissions factor of CH4, kg CH4∙kg−1 MSW; and is the emissions factor of N2O, kg N2O∙kg−1 MSW.
MSW incineration provides power through energy recovery, which may decrease the GHG emissions compared to conventional power generation, i.e., thermal power [51]. Thus, can be expressed as follows:
where is the power recovered per amount of waste incinerated, MWh ton−1; and is the emissions factor of the power generation, tons of CO2 equivalent∙MWh−1.
Fly ash and bottom ash are the typical by-products of incineration, which may contribute to GHGs, calculated as follows:
where is the annual GHGs in CO2 equivalents from the incineration residuals per annum, tons; is the ratio of bottom ash produced, in %; and is the emissions factor of the residuals treatment.
3.2.2. GHG Emissions from Landfill Disposal
GHG emissions from landfill disposal may be composed of the LFGs and emissions from the leachate treatment. The main components of LFGs are CH4 and CO2, which account for over 90% of the total LFGs [52]. Only the GHGs based on the CH4 levels are focused in this study and given as follows [50]:
where is the CH4 emissions from annual waste landfill disposal, tons of CO2 equivalents; is the amount of waste disposed in landfills annually, tons; is the CH4 generation potential; is the amount of CH4 recovered, tons; is the oxidation factor; is the CH4 correction factor; is the component of degradable organic carbon, in %; is the ith waste component in MSW, in %; is the degradable organic carbon, in %; and is the proportion of CH4 in LFG, in %.
Leachate treatment is a significant source of CH4 and N2O emissions, and the associated GHGs are measured as follows [53]:
where is the annual GHGs from the leachate treatment, tons of CO2 equivalents; is the amount of leachate treated per annum, m3; is the emissions factor; Ec is the energy consumption of leachate treatment, MWh/m3; and is the emissions factor of the electricity consumption, t CO2∙MWh−1.
3.2.3. GHG Emissions from Anaerobic Digestion
AD is commonly applied in organic waste treatment and may contribute to biogases, including CH4 and CO2, which is determined as follows:
where is the annual GHG emissions from AD, tons; is the amount of waste treated via AD per annum, tons; is the biogas produced, m3∙t−1; and is the proportion of CH4 in the biogas, in %.
3.3. Economic Assessment
Economic feasibility is estimated by the cost-benefit analysis (CBA) to inspect the construction costs, operational costs, and revenues in the different scenarios. CBA is an analytical approach that measures the economic value of a project through the quantification of costs and possible benefits caused by investment decisions [54]. It has been widely employed to evaluate the economic feasibility of waste to energy projects [55]. As Scenario 1 is an actual operating management system, the construction cost has been excluded, and only the operational cost is considered. For Scenarios 2 and 3, construction costs for the incineration plant and AD plant are considered. Revenue for all three scenarios is defined as the revenue from electricity generation through energy recovery. The costs of the scenarios are measured as follows [56]:
where is the annual cost, yuan; is the annual investment, yuan; is the annual operations and maintenance cost, yuan; is the annual revenue, yuan; r is the discount rate (%); and t is the lifespan of the facility, years.
3.4. Data Source
The city of Chengdu was the study area in this investigation. The active data were mainly provided by the UMBC. The emissions factors were obtained from the Intergovernmental Panel on Climate Change (IPCC) [50] and the Guidelines for Provincial Level Greenhouse Gas Inventory [57], as shown in Table 2.
4. Results and Discussion
4.1. Results
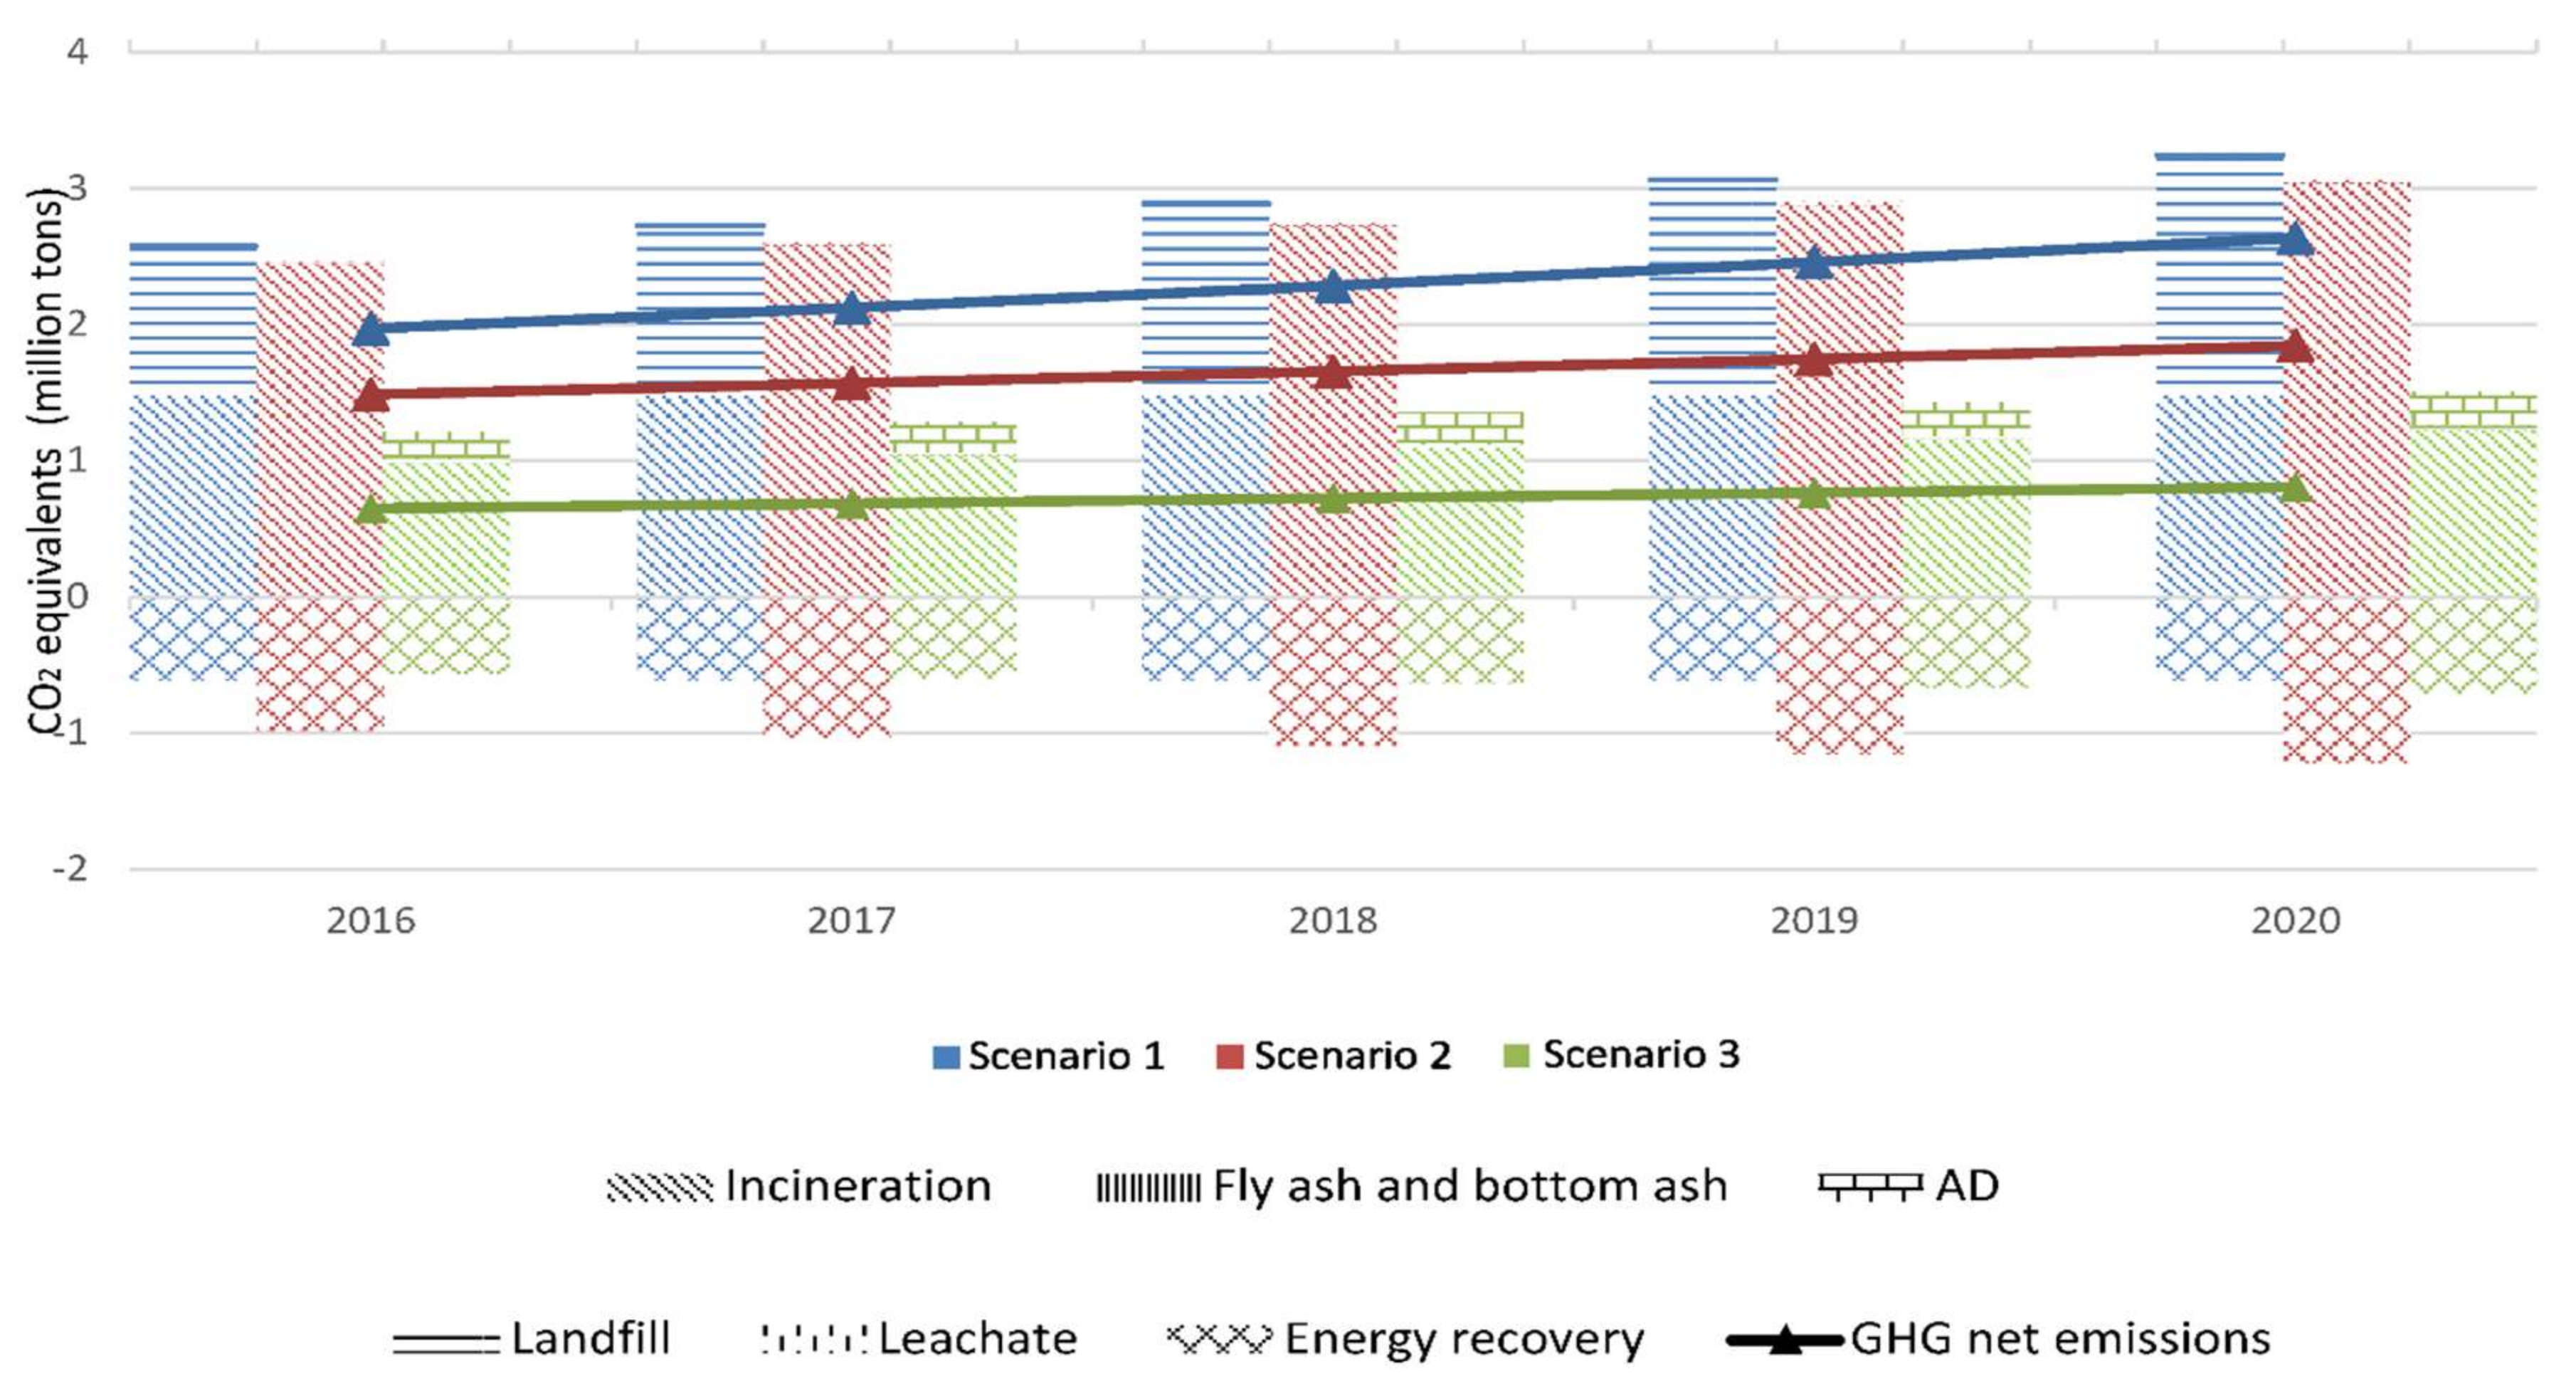
GHGs continuously increase during the period of 2016–2020 in all three scenarios shown in Figure 2. Among them, the most rapid increase in GHGs is observed in Scenario 1, with 33.76% more in 2020 than in 2016. This is possibly due to the limited capacity of the incineration plant in Scenario 1, thus, the newly-generated MSW may only be treated via direct landfilling, which leads to the excessively rapid increase in GHGs. In contrast, Scenario 3 has the smallest increase of GHGs. This result indicates that the incorporation of AD and the interaction of different treatment facilities may have potential in GHGs reduction. This postulation is also supported in a study by Rajaeifar et al. [65], who utilized LCA in the analysis of the MSW disposal system in Iran and discovered that the introduction of AD treatment could effectively reduce GHGs.
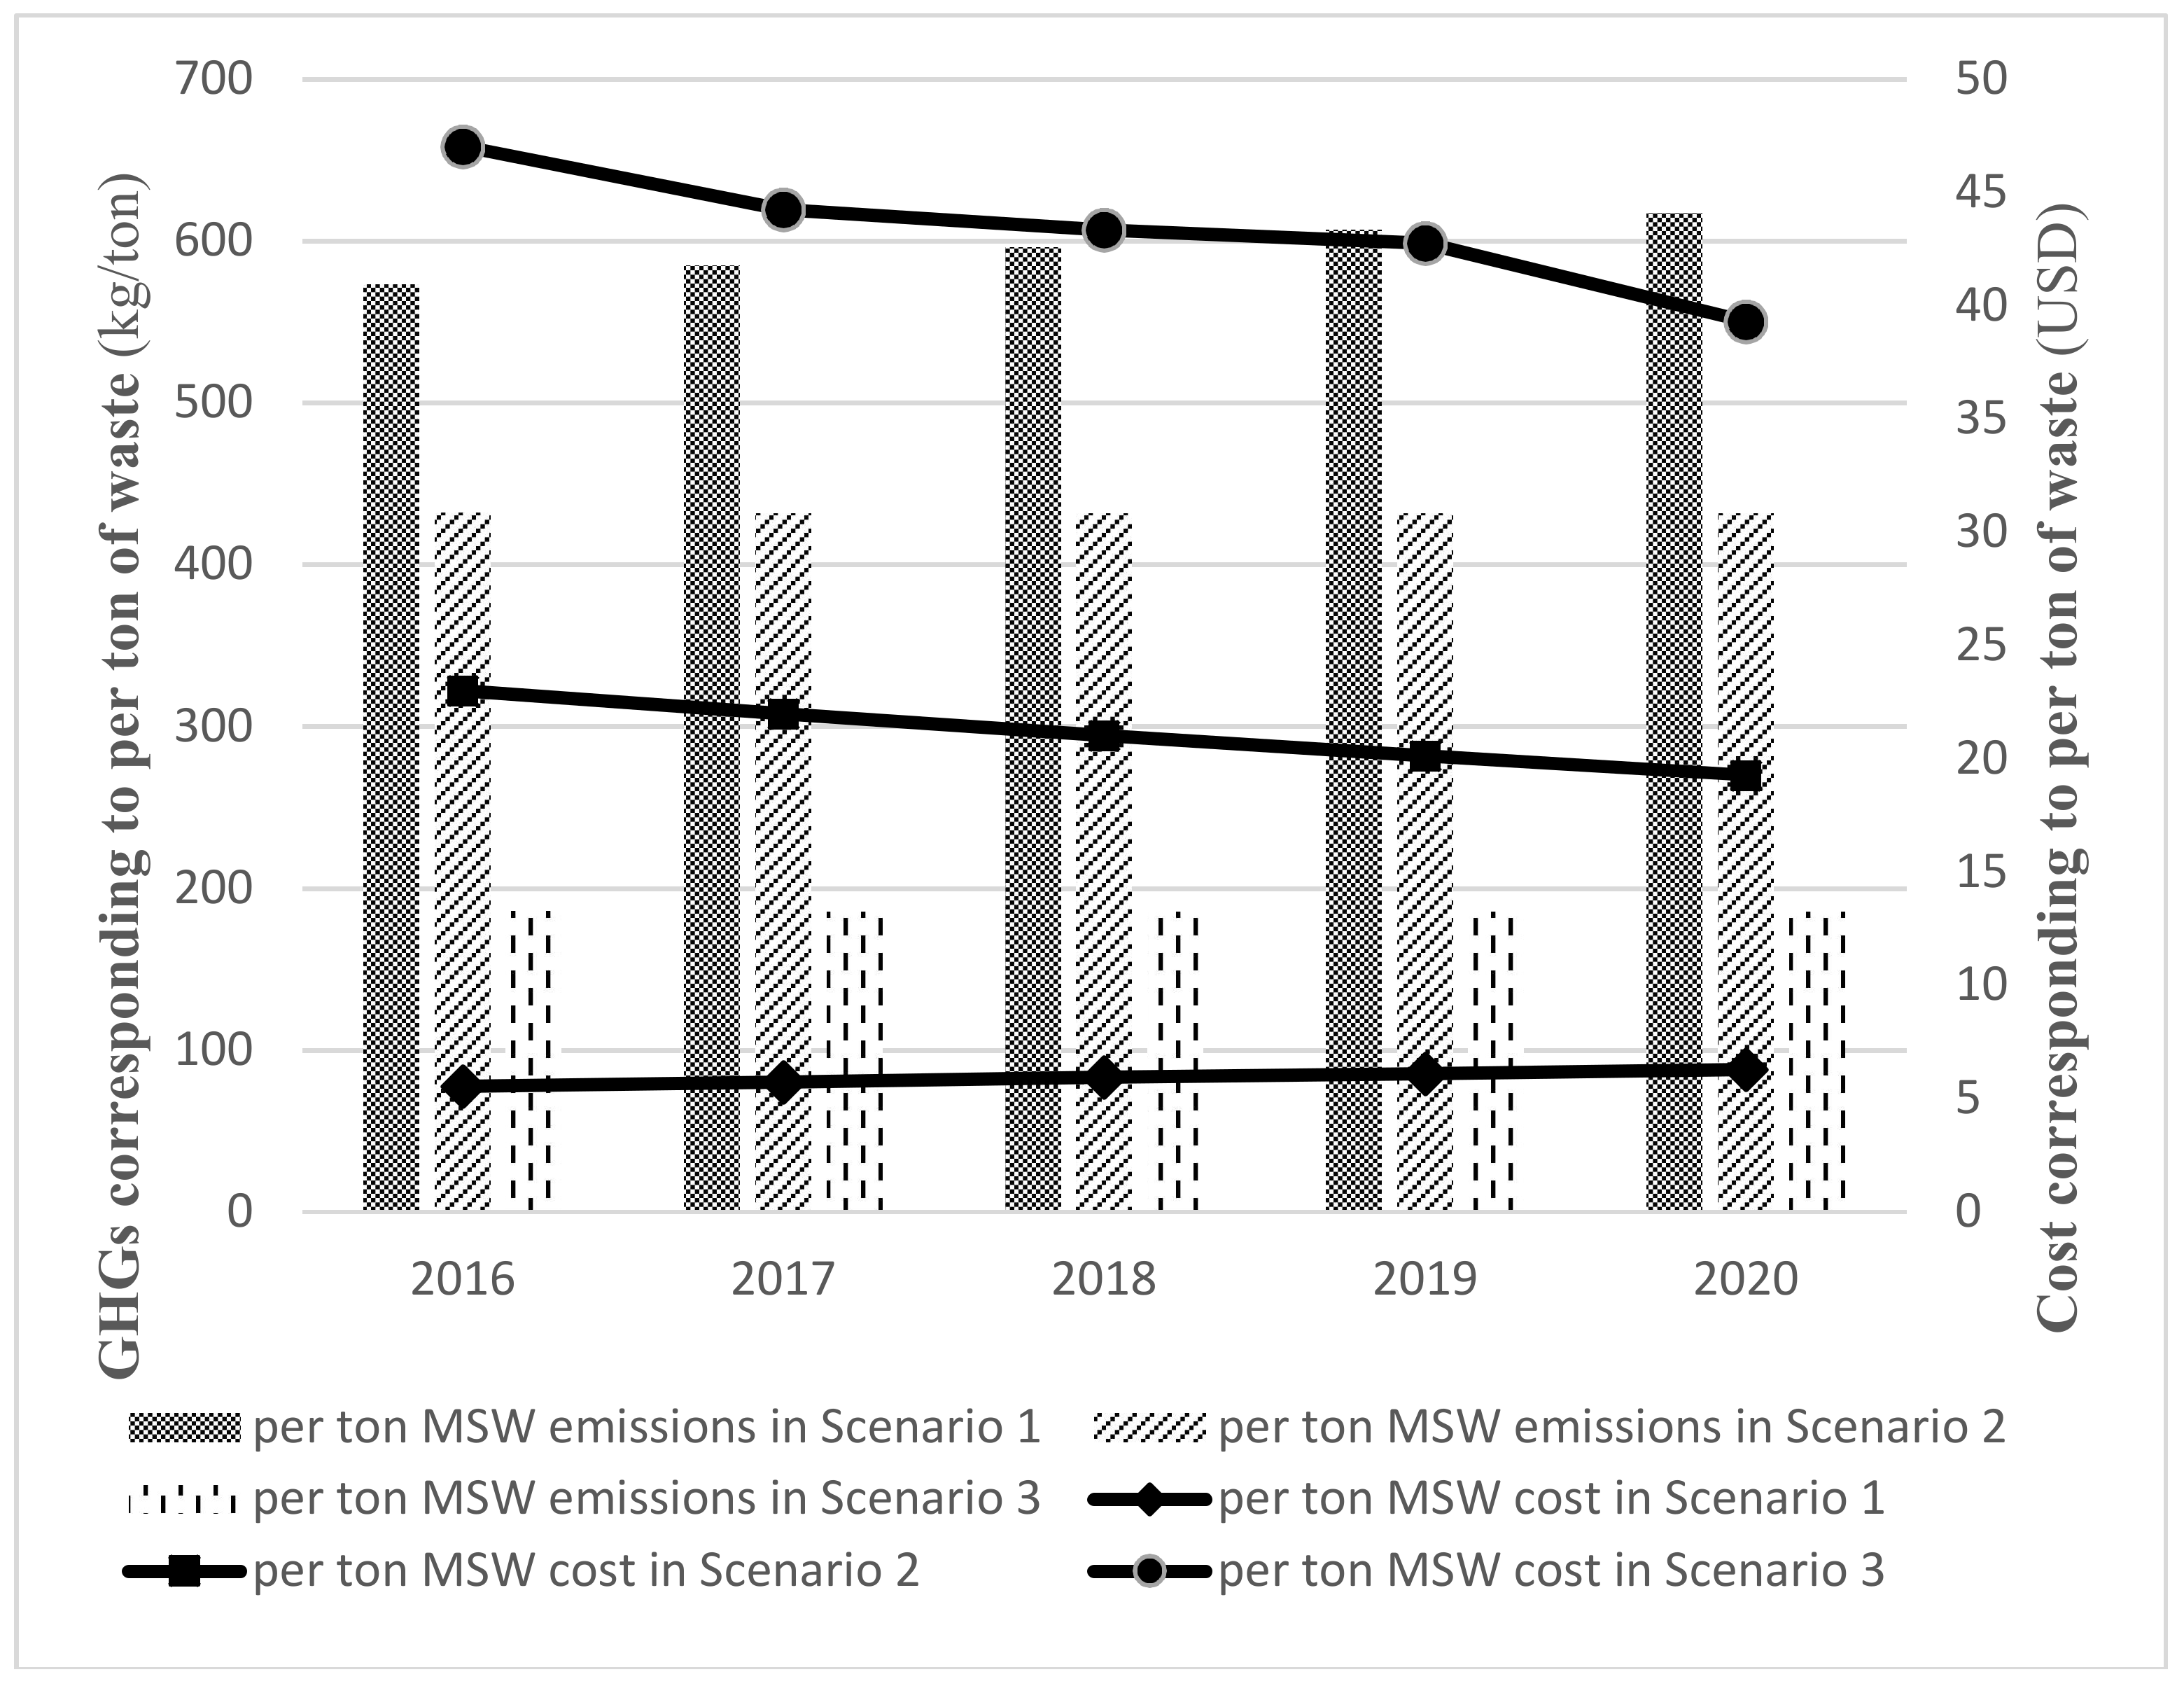
While comparing the GHGs and the cost per ton of waste treatment, it is obvious that Scenario 1 has the highest emissions level but the lowest cost, as shown in Figure 3. The performance of Scenario 1 is mainly affected by the comparatively high emissions levels. However, the cost of landfilling is the lowest. Scenario 3 enables substantial reduction of GHGs, but the cost would be higher by up to eightfold. The higher cost is due to high construction investment and operational costs. This indicates that Scenario 3 is economically infeasible for management practice.
4.2. Discussion
The results clearly reflect that there might be a conflict between the GHGs reduction and cost consideration in implementation of the waste disposal plan. Public acceptance is also a significant factor that influences decision-making in the design of waste disposal systems [66,67,68]. For instance, there is widespread controversy regarding incineration in China, in terms of potential health and environmental risks [69]. A number of incineration projects have been postponed, or even cancelled, because of strong social resistance [70]. To select the optimal scenario for the management practice, normalization is conducted to ensure a common scale for comparison, as follows [30]:
where Aij is the normalized attributive value of objective i in scenario j; OBJij is the actual value of objective i in scenario j; OBJimin is the minimum value of objective i among the three scenarios; and OBJimax is the maximum value of objective i among the three scenarios.
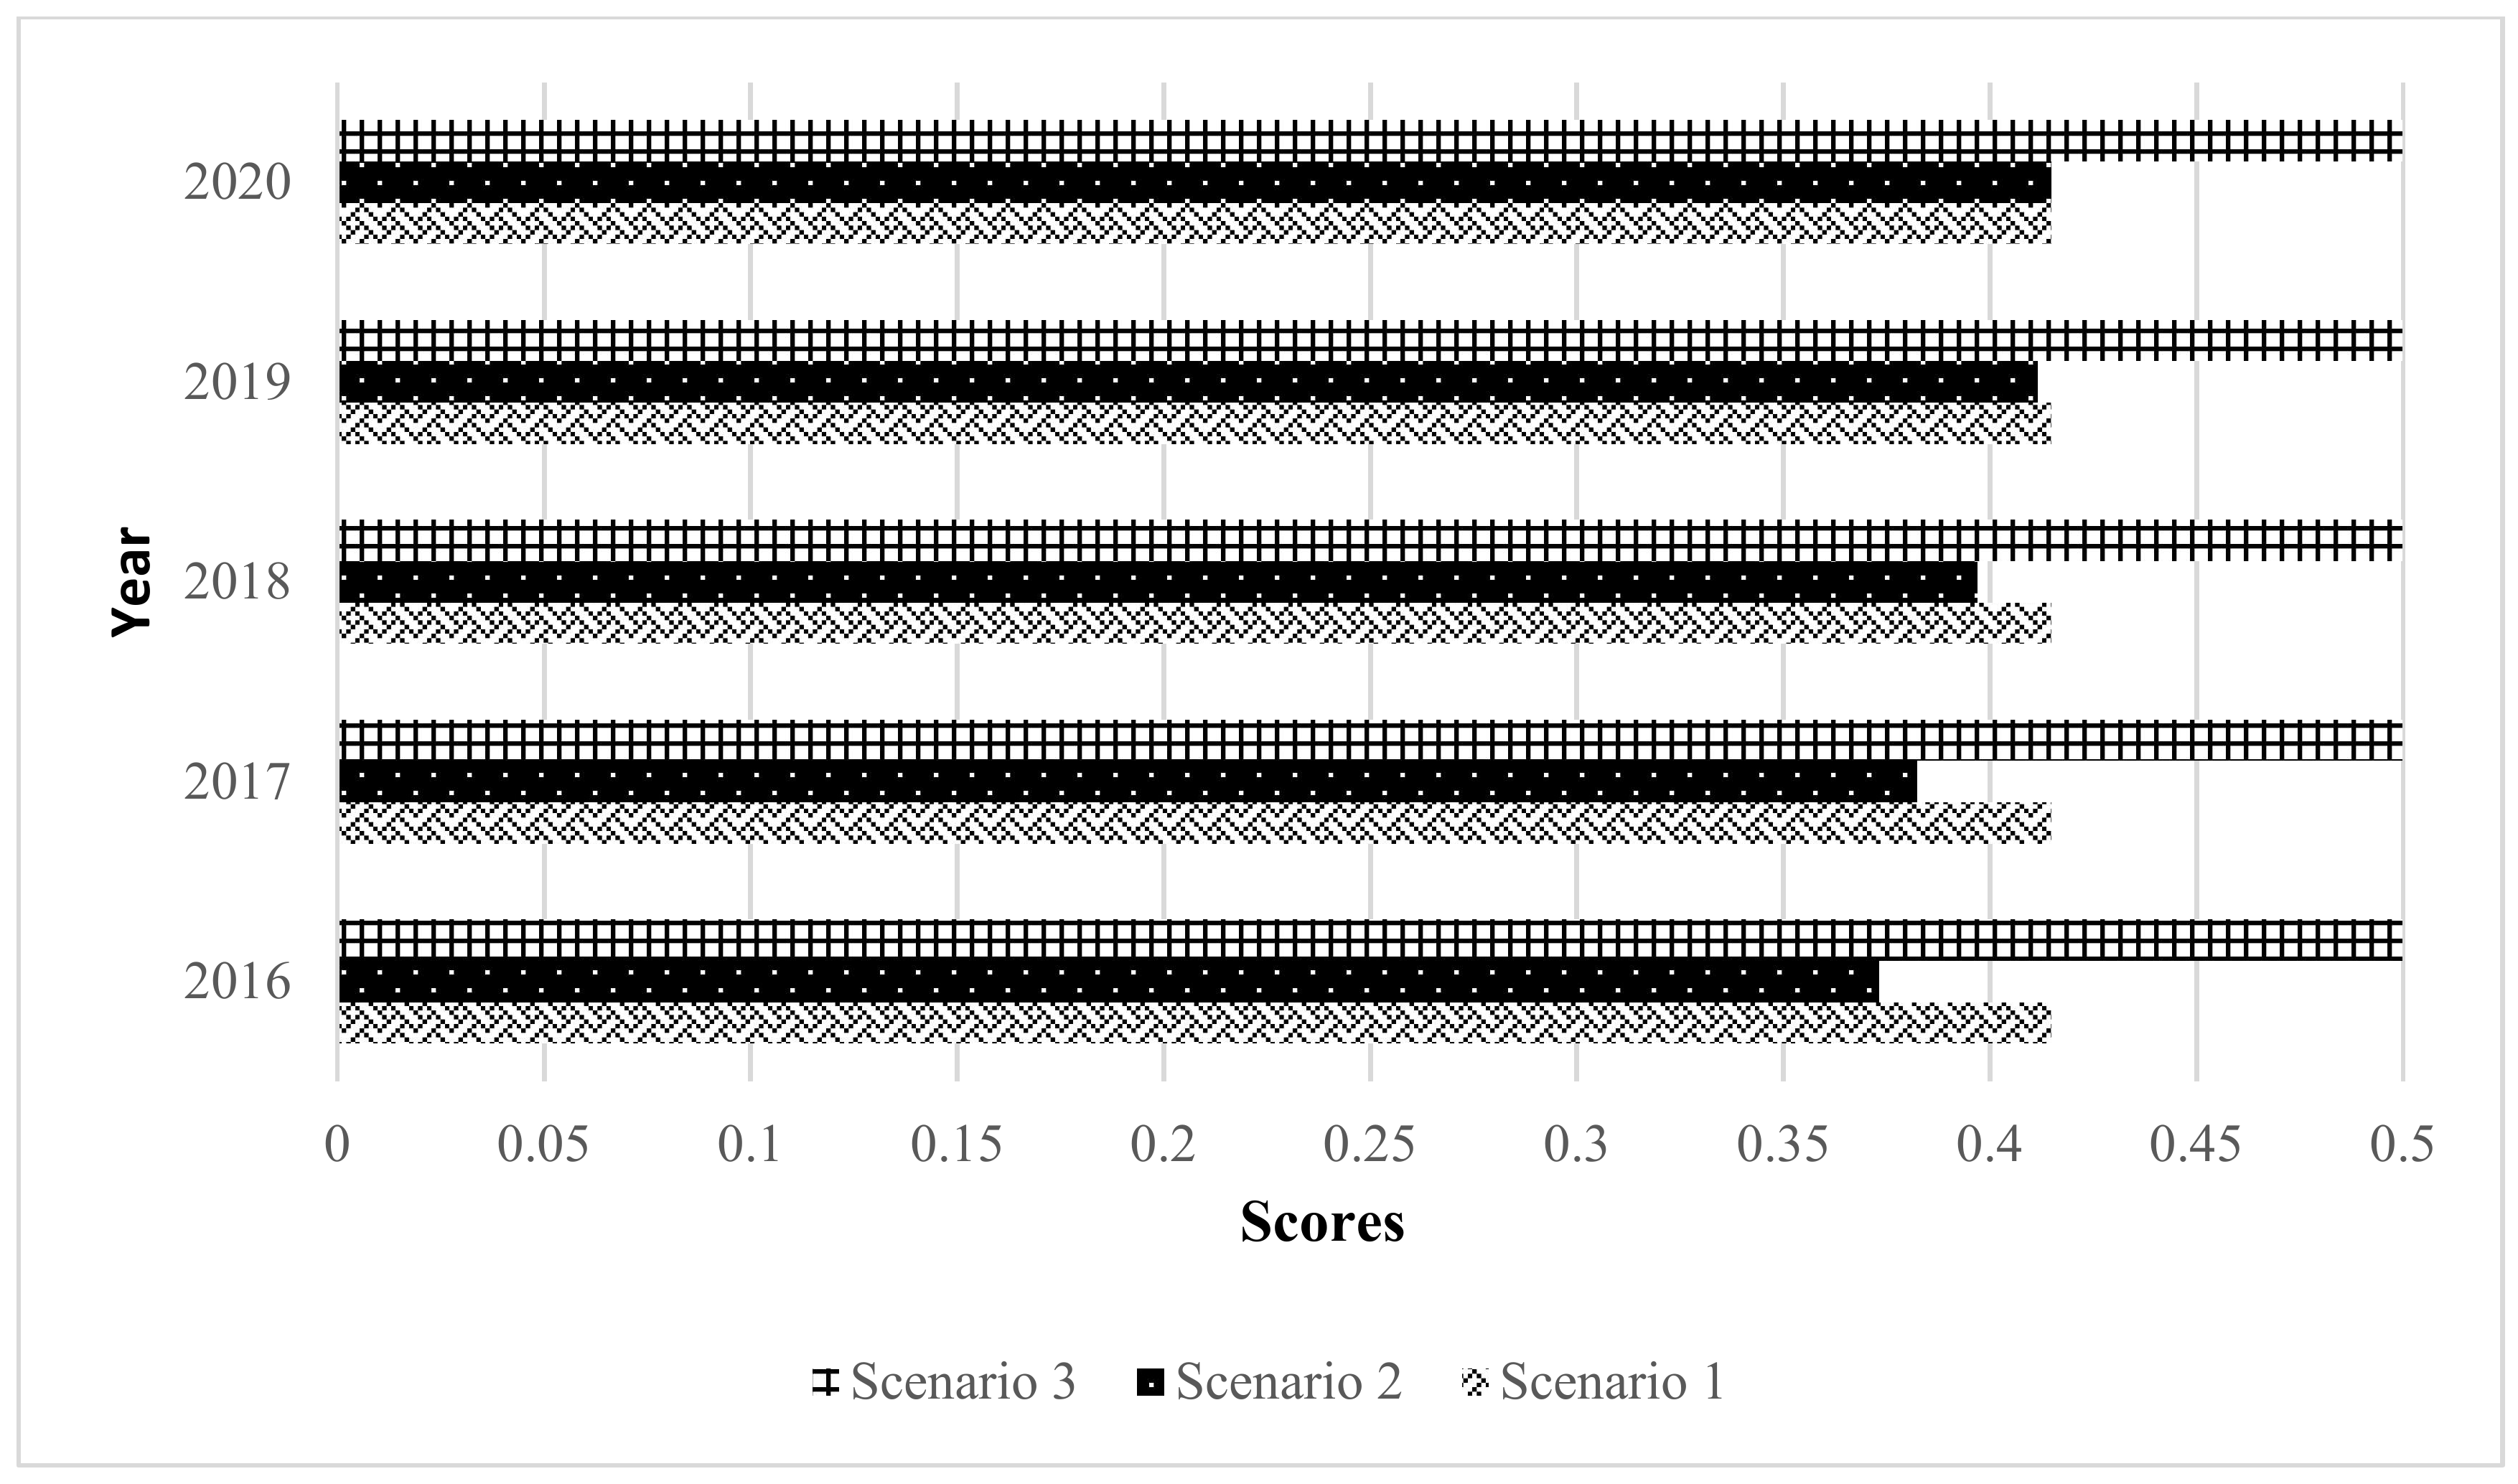
The objectives in this study are GHGs, operational costs, and public acceptance. A binary dominance matrix (BDM) is applied to assess the importance of the three objectives, which is a subjective weighting approach that lists all the criteria on both the vertical and horizontal axes in a matrix, and a value of 1 or 0 is assigned to each column generated by the intersection of the axes, in terms of the relative importance of a pair of criteria [71]. Compliance with green development proposed by the Belt and Road Initiative, it is assumed that the order of importance is ranked as GHGs, cost, and public acceptance, and the corresponding weights are given in Table 3.
Figure 4 shows that Scenario 3 obtains the highest score, due to its advantages in GHGs reduction and the high degree of public acceptance. Scenario 3 can be an optimal alternative system for solid waste disposal in the city of Chengdu. However, there are a number of uncertainties in its implementation. First, it is supposed that all the organic wastes are handled by AD in Scenario 3. In fact, complete separation between organic and inorganic waste has not been implemented in Chengdu, which may significantly impact the AD performance [19]. Second, the economic feasibility is also a challenge, owing to the large investment input for the AD plant, LFGs recovery, and leachate evaporation systems. Moreover, a network needs to be set up for the coordinative interactions among the involved facilities, e.g., the landfills may not be willing to provide the recovered LFGs to the incineration plant for further utilization.
To resolve the economic dilemma in Scenario 3, motivations may be adopted by the local government. For instance, the government may consider subsidies for investment in the key treatment facilities within the scenario, including the AD and incineration plants, as well as research and development subsidies to partially cover the external costs. However, the financial burden on the government owing to overreliance on subsidies must be avoided. Marketization mechanisms such as build-operate-transfer and public-private partnership may be introduced to attract social capital for investment in waste reuse and recycling to increase the back-end disposal efficiency.
5. Conclusions
Chengdu City in China is used to form the three different management planning scenarios for MSW disposal. Scenario 1 represents the current mode of MSW disposal in Chengdu City; Scenario 2 represents the planning of MSW disposal in the period of 2016–2035; and Scenario 3 represents an MSW disposal system that incorporates three treatment methods, i.e., AD, incineration, and landfilling. The three scenarios are compared in terms of their GHGs, costs, and public acceptance. The results indicate that Scenario 1 has the highest level of GHGs and the lowest cost, whereas Scenario 3 has the lowest GHGs and the highest cost. After taking public acceptance into account, Scenario 3 could be considered as the optimum system for MSW disposal.
However, there are still some limitations: (1) Uncertainty in systems boundary demarcations. The scenario design only considers the direct emissions of GHGs during the disposal stage, and indirect emissions during waste generation, collection, and transportation have not been included. (2) Uncertainty in the establishment of model parameters. For example, components of the landfilling waste and properties of the leachate may have impacts on GHGs. However, these factors have been omitted in this study. (3) Subjectivity in the weightings of GHGs, cost, and public acceptance. The emissions reduction target, level of economic development, and public awareness vary among different countries, which lead to differences in the weightings. The weightings used in this study serve only as a reference for the validation of the binary dominance matrix being used. Further studies are required to determine the method with which the weightings can be decided in a scientific manner according to varying conditions in different regions under the Belt and Road initiative.
Acknowledgments
This study was sponsored by the National Natural Science Foundation of China (no. 41571520; no. 71701029), the Sichuan Provincial Key Technology Support (no. 2016HH0084; 18RKX0986), the Sichuan Province Circular Economy Research Center Fund (no. XHJJ01), the Fundamental Research Funds for the Central Universities (no. A0920502051408; DUT16RC(3)038), and the Liaoning Province Philosophy and Social Science Planning Fund (no. L17BGL019).
Author Contributions
Junhan Huang conducted the case study and proposed the scenario analysis. Rui Zhao was involved in conceptualizing the whole study and writing the whole study. Tao Huang collected the data. Xiaoqian Wang implemented the calculation process. Ming-Lang Tseng improved the whole structure of the study.
Conflicts of Interest
The authors declare no conflict of interest.
References
- Du, M.M. China’s “One Belt, One Road” Initiative: Context, Focus, Institutions, and Implications. Chin. J. Glob. Govern. 2016, 2, 30–43. [Google Scholar] [CrossRef] [Green Version]
- Cheng, L.K. Three questions on China’s “Belt and Road Initiative”. China Econ. Rev. 2016, 40, 309–313. [Google Scholar] [CrossRef]
- Xu, L.; Fan, X.; Wang, W.; Xu, L.; Duan, Y.; Shi, R. Renewable and sustainable energy of Xinjiang and development strategy of node areas in the “Silk Road Economic Belt”. Renew. Sustain. Energy Rev. 2017, 79, 274–285. [Google Scholar] [CrossRef]
- Voytenko, Y.; McCormick, K.; Evans, J.; Schliwa, G. Urban living labs for sustainability and low carbon cities in Europe: Towards a research Agenda. J. Clean. Prod. 2016, 123, 45–54. [Google Scholar] [CrossRef]
- Mutizwa-Mangiza, N.D.; Arimah, B.C.; Jensen, I.; Yemeru, E.A.; Kinyanjui, M.K. Global Report on Human Settlements 2011. Cities and Climate Change; UN-HABITAT: Nairobi, Kenia, 2011. [Google Scholar]
- Ho, W.S.; Hashim, H.; Lim, J.S.; Lee, C.T.; Sam, K.C.; Tan, S.T. Waste Management Pinch Analysis (WAMPA): Application of Pinch Analysis for greenhouse gas (GHG) emission reduction in municipal solid waste management. Appl. Energy 2017, 185, 1481–1489. [Google Scholar] [CrossRef]
- Cocarta, D.M.; Rada, E.C.; Ragazzi, M.; Badea, A.; Apostol, T. A contribution for a correct vision of health impact from municipal solid waste treatments. Environ. Technol. 2009, 30, 963–968. [Google Scholar] [CrossRef] [PubMed]
- Jha, A.K.; Singh, S.K.; Singh, G.P.; Gupta, P.K. Sustainable municipal solid waste management in low income group of cities: A review. Trop. Ecol. 2011, 52, 123–131. [Google Scholar]
- Zulkepli, N.E.; Muis, Z.A.; Mahmood, N.A.N.; Hashim, H.; Ho, W.S. Cost benefit analysis of composting and anaerobic digestion in a community: A review. Chem. Eng. Trans. 2017, 56, 1777–1782. [Google Scholar]
- Ionescu, G.; Rada, E.C.; Cioca, L.I. Municipal solid waste sorting and treatment schemes for the maximization of material and energy recovery in a latest EU member. Environ. Eng. Manag. J. 2015, 14, 2537–2544. [Google Scholar]
- Zhao, R.; Huang, T.; McGuire, M. From a Literature Review to an Alternative Treatment System for Landfill Gas and Leachate. Challenges 2012, 3, 278–289. [Google Scholar] [CrossRef]
- Bosmans, A.; Vanderreydt, I.; Geysen, D.; Helsen, L. The crucial role of Waste-to-Energy technologies in enhanced landfill mining: A technology review. J. Clean. Prod. 2013, 55, 10–23. [Google Scholar] [CrossRef]
- Beyene, H.D.; Werkneh, A.A.; Ambaye, T.G. Current updates on waste to energy (WtE) technologies: A review. Renew. Energy Focus 2018, 24, 1–11. [Google Scholar] [CrossRef]
- Ministry of Commerce People’s Republic of China. Law of the People’s Republic of China on Prevention and Control of Environmental Pollution by Solid Waste. Available online: http://english.mofcom.gov.cn/aarticle/policyrelease/internationalpolicy/200703/20070304471567.html (accessed on 6 February 2018).
- Zhang, D.Q.; Tan, S.K.; Gersberg, R.M. Municipal solid waste management in China: Status, problems and challenges. J. Environ. Manag. 2010, 91, 1623–1633. [Google Scholar] [CrossRef] [PubMed]
- Zeng, C.; Niu, D.; Zhao, Y. A comprehensive overview of rural solid waste management in China. Front. Environ. Sci. Eng. 2015, 9, 949–961. [Google Scholar] [CrossRef]
- Qin, B. City profile: Chengdu. Cities 2015, 43, 18–27. [Google Scholar] [CrossRef]
- Li, Y.; Zhan, J.; Zhang, F.; Zhang, M.; Chen, D. The study on ecological sustainable development in Chengdu. Phys. Chem. Earth Parts A/B/C 2017, 101, 112–120. [Google Scholar] [CrossRef]
- Chengdu Planning and Management Bureau. Overall City Plan of Chengdu (2016–2035). Available online: http://www.cdgh.gov.cn/gsgg/lbgggb/6053.htm (accessed on 5 March 2018).
- Zhou, H.; Meng, A.; Long, Y.; Li, Q.; Zhang, Y. An overview of characteristics of municipal solid waste fuel in China: Physical, chemical composition and heating value. Renew. Sustain. Energy Rev. 2014, 36, 107–122. [Google Scholar] [CrossRef]
- Fu, Y.; Qiu, Z.; Fu, C.; Zhu, D.; Yin, Y. Analysis of Municipal Solid Waste Composition and Physicochemical Properties in Urban Areas of Chengdu. Sichuan Environ. 2015, 33, 126–129, (In Chinese with English Abstract). [Google Scholar]
- Kibler, K.M.; Reinhart, D.; Hawkins, C.; Motlagh, A.M.; Wright, J. Food waste and the food-energy-water nexus: A review of food waste management alternatives. Waste Manag. 2018, 74, 52–62. [Google Scholar] [CrossRef] [PubMed]
- Li, Y.P.; Huang, G.H. An interval-based possibilistic programming method for waste management with cost minimization and environmental-impact abatement under uncertainty. Sci. Total Environ. 2010, 408, 4296–4308. [Google Scholar] [CrossRef] [PubMed]
- Zhu, J.; Huang, G. Contract-out planning of solid waste management system under uncertainty: Case study on Toronto, Ontario, Canada. J. Clean. Prod. 2017, 168, 1370–1380. [Google Scholar] [CrossRef]
- Dai, C.; Li, Y.P.; Huang, G.H. A two-stage support-vector-regression optimization model for municipal solid waste management—A case study of Beijing, China. J. Environ. Manag. 2011, 92, 3023–3037. [Google Scholar] [CrossRef] [PubMed]
- Economopoulou, M.A.; Economopoulou, A.A.; Economopoulos, A.P. A methodology for optimal MSW management, with an application in the waste transportation of Attica Region, Greece. Waste Manag. 2013, 33, 2177–2187. [Google Scholar] [CrossRef] [PubMed]
- Asefi, H.; Lim, S. A novel multi-dimensional modeling approach to integrated municipal solid waste management. J. Clean. Prod. 2017, 166, 1131–1143. [Google Scholar] [CrossRef]
- Das, S.; Bhattacharyya, B.K. Optimization of municipal solid waste collection and transportation routes. Waste Manag. 2015, 43, 9–18. [Google Scholar] [CrossRef] [PubMed]
- Yadav, V.; Karmakar, S.; Dikshit, A.K.; Bhurjee, A.K. Interval-valued facility location model: An appraisal of municipal solid waste management system. J. Clean. Prod. 2018, 171, 250–263. [Google Scholar] [CrossRef]
- Zhao, R.; Liu, Y.; Zhang, N.; Huang, T. An optimization model for green supply chain management by using a big data analytic approach. J. Clean. Prod. 2017, 142, 1085–1097. [Google Scholar] [CrossRef]
- Wittmaier, M.; Langer, S.; Sawilla, B. Possibilities and limitations of life cycle assessment (LCA) in the development of waste utilization systems—Applied examples for a region in Northern Germany. Waste Manag. 2009, 29, 1732–1738. [Google Scholar] [CrossRef] [PubMed]
- Liamsanguan, C.; Gheewala, S.H. LCA: A decision support tool for environmental assessment of MSW management systems. J. Environ. Manag. 2008, 87, 132–138. [Google Scholar] [CrossRef] [PubMed]
- Cifrian, E.; Galan, B.; Andres, A.; Viguri, J.R. Material flow indicators and carbon footprint for MSW management systems: Analysis and application at regional level, CantaB & Ra, Spain. Resour. Conserv. Recycl. 2012, 68, 54–66. [Google Scholar]
- Zhao, W.; Huppes, G.; van der Voet, E. Eco-efficiency for greenhouse gas emissions mitigation of municipal solid waste management: A case study of Tianjin, China. Waste Manag. 2011, 31, 1407–1415. [Google Scholar] [CrossRef] [PubMed]
- Lu, H.W.; Huang, G.H.; He, L.; Zeng, G.M. An inexact dynamic optimization model for municipal solid waste management in association with greenhouse gas emission control. J. Environ. Manag. 2009, 90, 396–409. [Google Scholar] [CrossRef] [PubMed]
- Mavrotas, G.; Gakis, N.; Skoulaxinou, S.; Katsouros, V.; Georgopoulou, E. Municipal solid waste management and energy production: Consideration of external cost through multi-objective optimization and its effect on waste-to-energy solutions. Renew. Sustain. Energy Rev. 2015, 51, 1205–1222. [Google Scholar] [CrossRef]
- Hanandeh, A.E.; Zein, A.E. Are the aims of increasing the share of green electricity generation and reducing GHG emissions always compatible? Renew. Energy 2011, 36, 3031–3036. [Google Scholar] [CrossRef]
- Pin, B.V.R.; Barros, R.M.; Silva Lora, E.E.; dos Santos, I.F.S. Waste management studies in a Brazilian microregion: GHG emissions balance and LFG energy project economic feasibility analysis. Energy Strateg. Rev. 2018, 19, 31–43. [Google Scholar] [CrossRef]
- Demirbas, A. Waste management, waste resource facilities and waste conversion processes. Energy Convers. Manag. 2011, 52, 1280–1287. [Google Scholar] [CrossRef]
- Jia, X.; Wang, S.; Li, Z.; Wang, F.; Tan, R.R.; Qian, Y. Pinch analysis of GHG mitigation strategies for municipal solid waste management: A case study on Qingdao City. J. Clean. Prod. 2018, 174, 933–944. [Google Scholar] [CrossRef]
- Zhao, R.; Liu, Y.; Zhang, Z.; Guo, S.; Tseng, M.L.; Wu, K.J. Enhancing Eco-Efficiency of Agro-Products’ Closed-Loop Supply Chain under the Belt and Road Initiatives: A System Dynamics Approach. Sustainability 2018, 10, 668. [Google Scholar] [CrossRef]
- Zhao, R.; Xi, B.; Liu, Y.; Su, J.; Liu, S. Economic potential of leachate evaporation by using landfill gas: A system dynamics approach. Resour. Conserv. Recycl. 2017, 124, 74–84. [Google Scholar] [CrossRef]
- Xu, Y.; Chan, A.P.; Xia, B.; Qian, Q.K.; Liu, Y.; Peng, Y. Critical risk factors affecting the implementation of PPP waste-to-energy projects in China. Appl. Energy 2015, 158, 403–411. [Google Scholar] [CrossRef]
- Johnson, T. The politics of waste incineration in Beijing: The limits of a top-down approach? J. Environ. Policy Plan. 2013, 15, 109–128. [Google Scholar] [CrossRef]
- Zhang, W.; Zhang, L.; Li, A. Anaerobic co-digestion of food waste with MSW incineration plant fresh leachate: Process performance and synergistic effects. Chem. Eng. J. 2015, 259, 795–805. [Google Scholar] [CrossRef]
- Gimenez, C.; Sierra, V.; Rodon, J. Sustainable operations: Their impact on the triple bottom line. Int. J. Prod. Econ. 2012, 140, 149–159. [Google Scholar] [CrossRef]
- Nikolaou, I.E.; Evangelinos, K.I.; Allan, S. A reverse logistics social responsibility evaluation framework based on the triple bottom line approach. J. Clean. Prod. 2013, 56, 173–184. [Google Scholar] [CrossRef]
- Chauhan, A.; Singh, A. A hybrid multi-criteria decision making method approach for selecting a sustainable location of healthcare waste disposal facility. J. Clean. Prod. 2016, 139, 1001–1010. [Google Scholar] [CrossRef]
- Gou, Z.; Xie, X. Evolving green building: Triple bottom line or regenerative design? J. Clean. Prod. 2017, 153, 600–607. [Google Scholar] [CrossRef]
- Eggleston, S.; Buendia, L.; Miwa, K.; Ngara, T. 2006 IPCC Guidelines for National Greenhouse Gas Inventories; IPCC: Geneva, Switzerland, 2006. [Google Scholar]
- Woon, K.S.; Lo, I.M.C. Greenhouse gas accounting of the proposed landfill extension and advanced incineration facility for municipal solid waste management in Hong Kong. Sci. Total Environ. 2013, 458–460, 499–507. [Google Scholar] [CrossRef] [PubMed]
- Gaur, A.; Park, J.-W.; Maken, S.; Song, H.-J.; Park, J.-J. Landfill gas (LFG) processing via adsorption and alkanolamine absorption. Fuel Process. Technol. 2010, 91, 635–640. [Google Scholar] [CrossRef]
- Wang, X.; Jia, M.; Zhang, C.; Chen, S.; Cai, Z. Leachate treatment in landfills is a significant N2O source. Sci. Total Environ. 2017, 596–597, 18–25. [Google Scholar] [CrossRef] [PubMed]
- De Menna, F.; Dietershagen, J.; Loubiere, M.; Vittuari, M. Life cycle costing of food waste: A review of methodological approaches. Waste Manag. 2018, 73, 1–13. [Google Scholar] [CrossRef] [PubMed]
- You, S.; Wang, W.; Dai, Y.; Tong, Y.W.; Wang, C.-H. Comparison of the co-gasification of sewage sludge and food wastes and cost-benefit analysis of gasification- and incineration-based waste treatment schemes. Bioresour. Technol. 2016, 218, 595–605. [Google Scholar] [CrossRef] [PubMed]
- Schneider, D.R.; Kirac, M.; Hublin, A. Cost-effectiveness of GHG emission reduction measures and energy recovery from municipal waste in Croatia. Energy 2012, 48, 203–211. [Google Scholar] [CrossRef]
- National Development and Reform Commission. Guidelines for Provincial Level Greenhouse Gas Inventory. Available online: http://qhs.ndrc.gov.cn/dtjj/201403/W020140328413051841999.pdf (accessed on 6 January 2018).
- National Development and Reform Commission. Baseline Emission Factors for Regional Power Grids in China. Available online: http://www.ndrc.gov.cn/yjzq/201704/t20170414_847850.html (accessed on 6 January 2018).
- Wang, X.; Jia, M.; Chen, X.; Xu, Y.; Lin, X.; Kao, C.M.; Chen, S. Greenhouse gas emissions from landfill leachate treatment plants: A comparison of young and aged landfill. Waste Manag. 2014, 34, 1156–1164. [Google Scholar] [CrossRef] [PubMed]
- Wu, Z.; Zheng, D. Generation regularities and application of LFG from Chengdu Chang’an waste landfill site. Environ. Sanit. Eng. 2012, 20, 46–48. [Google Scholar]
- Yang, N.; Zhang, H.; Shao, L.-M.; Lü, F.; He, P.-J. Greenhouse gas emissions during MSW landfilling in China: Influence of waste characteristics and LFG treatment measures. J. Environ. Manag. 2013, 129, 510–521. [Google Scholar] [CrossRef] [PubMed]
- Deng, L.; Liu, Y.; Zheng, D.; Wang, L.; Pu, X.; Song, L.; Wang, Z.; Lei, Y.; Chen, Z.; Long, Y. Application and development of biogas technology for the treatment of waste in China. Renew. Sustain. Energy Rev. 2017, 70, 845–851. [Google Scholar] [CrossRef]
- Chen, T.; Shen, D.; Jin, Y.; Li, H.; Yu, Z.; Feng, H.; Long, Y.; Yin, J. Comprehensive evaluation of environ-economic bene fi ts of anaerobic digestion technology in an integrated food waste-based methane plant using a fuzzy mathematical model. Appl. Energy 2017, 208, 666–677. [Google Scholar] [CrossRef]
- Zhao, X.; Jiang, G.; Li, A.; Li, Y. Technology, cost, a performance of waste-to-energy incineration industry in China. Renew. Sustain. Energy Rev. 2016, 55, 115–130. [Google Scholar]
- Rajaeifar, M.A.; Ghanavati, H.; Dashti, B.B.; Heijungs, R.; Aghbashlo, M.; Tabatabaei, M. Electricity generation and GHG emission reduction potentials through different municipal solid waste management technologies: A comparative review. Renew. Sustain. Energy Rev. 2017, 79, 414–439. [Google Scholar] [CrossRef]
- Ren, X.; Che, Y.; Yang, K.; Tao, Y. Risk perception and public acceptance toward a highly protested Waste-to-Energy facility. Waste Manag. 2016, 48, 528–539. [Google Scholar] [CrossRef] [PubMed]
- Wan, C.; Shen, G.Q.; Choi, S. Differential public support for waste management policy: The case of Hong Kong. J. Clean. Prod. 2018, 175, 477–488. [Google Scholar] [CrossRef]
- De Feo, G.; De Gisi, S.; Williams, I.D. Public perception of odour and environmental pollution attributed to MSW treatment and disposal facilities: A case study. Waste Manag. 2013, 33, 974–987. [Google Scholar] [CrossRef] [PubMed]
- Huang, Y.; Ning, Y.; Zhang, T.; Fei, Y. Public acceptance of waste incineration power plants in China: Comparative case studies. Habitat Int. 2015, 47, 11–19. [Google Scholar] [CrossRef]
- Lang, G.; Xu, Y. Anti-incinerator campaigns and the evolution of protest politics in China. Environ. Polit. 2013, 22, 832–848. [Google Scholar] [CrossRef]
- Zhao, R.; Neighbour, G.; Deutz, P.; McGuire, M. Materials selection for cleaner production: An environmental evaluation approach. Mater. Des. 2012, 37, 429–434. [Google Scholar] [CrossRef]
Figure 1.
Setups of the three defined scenarios.

Figure 2.
Trends in GHG emissions for the different scenarios.

Figure 3.
GHGs and costs per ton of waste for the different scenarios.

Figure 4.
Evaluation results of the different scenarios.


Table 1.
Variation of waste composition before and after stacking.
| Composition (%) | |||||
|---|---|---|---|---|---|
| Paper | Textile | Food | Wood | Rest | |
| Waste before stacking | 8.516 | 2.983 | 66.533 | 3.015 | 18.953 |
| Waste stacking for 3–7 days | 10.140 | 3.406 | 59.722 | 3.262 | 23.500 |
Table 2.
Data for the parameters of the GHGs assessment and their sources.
| Parameters | Data | Source |
|---|---|---|
| Incineration capacity (2016–2020; million tons) | 2.08, 2.86, 2.96, 2.96, and 4.27, respectively | [19] |
| CCW (%) | 20 | [57] |
| EF (%) | 95 | [57] |
| EFCH4 | 0.2 | [50] |
| EFN2O | 47 | [50] |
| EMSW in Scenario 1 (2016–2020; MWh) | 661,977 | UMBC |
| EMSW in Scenario 2 (2016–2020; MWh) | 1,064,071, 1,123,169, 1,185,671, 1,251,885, and 1,321,503, respectively | [19] |
| EMSW in Scenario 3 (2016–2020; MWh) | 428,055, 451,829, 476,972, 503,608, and 531,614, respectively | Field investigation |
| EFep (t CO2∙MWh−1) | 0.9229 | [58] |
| MSWQ in Scenario 1 (2016–2020; million tons) | 1.359, 1.55, 1.752, 1.966, and 2.191, respectively | [19] |
| MSWQ in Scenario 3 (2016–2020; million tons) | 0.020, 0.021, 0.022, 0.024, and 0.025, respectively | [19] |
| MCF | 1 | [50] |
| DOCF | 0.5 | [59] |
| F | 0.35 | [60] |
| R | 0 | Field investigation |
| OX | 0.1 | [57] |
| Ql,y (2016–2020; million tons) | 0.5175, 0.705, 0.883, 0.885, and 0.885, respectively | Field investigation |
| Etp (kg/m3) | 0.059 | [59] |
| Ec (MWh/m3) | 0.014 | [61] |
| PRgas (m3/t) | 76.71 | [62] |
| RCH4 (%) | 61 | Experiment |
| Construction investment for AD plants | 90,644 USD/t | [63] |
| r | 8% | [56] |
| Operating cost | 9.35 USD/t (landfill), 26.82 USD/t (incineration), 45.03 USD/t (AD) | [42,63,64], respectively |
| Subsidy | 12.64 USD/t (landfill), 28.44 USD/t (incineration), 27.46 USD/t (AD) | Field investigation [42,63], respectively |
| Wi (Paper, Textile, Food, Wood; %) | 10.14, 3.406, 59.722, and 3.262, respectively | UMBC |
| DOCi default value (Paper, Textile, Food, Wood; %) | 40, 24, 15, and 43, respectively | [57] |
Table 3.
Weights by using the binary dominance matrix.
| Indicator | GHGs | Cost | Public Acceptance | Score | Weight |
|---|---|---|---|---|---|
| GHGs | - | 1 | 1 | 3 | 0.5 |
| Cost | 0 | - | 1 | 2 | 0.33 |
| Public acceptance | 0 | 0 | - | 1 | 0.17 |
© 2018 by the authors. Licensee MDPI, Basel, Switzerland. This article is an open access article distributed under the terms and conditions of the Creative Commons Attribution (CC BY) license (http://creativecommons.org/licenses/by/4.0/).
Share and Cite
MDPI and ACS Style
Huang, J.; Zhao, R.; Huang, T.; Wang, X.; Tseng, M.-L. Sustainable Municipal Solid Waste Disposal in the Belt and Road Initiative: A Preliminary Proposal for Chengdu City. Sustainability 2018, 10, 1147. https://doi.org/10.3390/su10041147
AMA Style
Huang J, Zhao R, Huang T, Wang X, Tseng M-L. Sustainable Municipal Solid Waste Disposal in the Belt and Road Initiative: A Preliminary Proposal for Chengdu City. Sustainability. 2018; 10(4):1147. https://doi.org/10.3390/su10041147
Chicago/Turabian StyleHuang, Junhan, Rui Zhao, Tao Huang, Xiaoqian Wang, and Ming-Lang Tseng. 2018. "Sustainable Municipal Solid Waste Disposal in the Belt and Road Initiative: A Preliminary Proposal for Chengdu City" Sustainability 10, no. 4: 1147. https://doi.org/10.3390/su10041147
Note that from the first issue of 2016, this journal uses article numbers instead of page numbers. See further details here.