Article

Characterization of Fine Particulate Matter in Sharjah, United Arab Emirates Using Complementary Experimental Techniques

1
Physics Department, American University of Sharjah, Sharjah 26666, UAE
2
Center for Advanced Materials Research, Research Institute of Sciences and Engineering, University of Sharjah, Sharjah 27272, UAE
*
Author to whom correspondence should be addressed.
Sustainability 2018, 10(4), 1088; https://doi.org/10.3390/su10041088
Submission received: 13 March 2018 / Revised: 31 March 2018 / Accepted: 2 April 2018 / Published: 5 April 2018
(This article belongs to the Special Issue Dust Events in the Environment)

Abstract

:
Airborne particulate matter (PM) pollutants were sampled from an urban background site in Sharjah, United Arab Emirates. The fine fraction (PM2.5) (particulates with aerodynamic diameters of less than 2.5 μm) was collected on 47-mm Teflon filters and analyzed using a combined set of non-destructive techniques in order to provide better understanding of the sources of pollutants and their interaction during transport in the atmosphere. These techniques included gravimetric analysis, equivalent black carbon (EBC), X-ray fluorescence, scanning electron microscopy, and X-ray diffraction. Generally, the PM2.5 concentrations are within the limits set by the World Health Organization (WHO) and the United States (US) Environmental Protection Agency. The EBC content is in the range of 10–12% of the total PM concentration (2–4 µg m−3), while S (as ammonium sulfate), Ca (as calcite, gypsum, and calcium carbonate), Si (as quartz), Fe, and Al were the major sources of PM pollution. EBC, ammonium sulfate, Zn, V, and Mn originate from anthropogenic sources such as fossil fuel burning, traffic, and industrial emissions. Natural elements such as Ca, Fe, Al, Si, and Ti are due to natural sources such as crustal materials (enhanced during dust episodes) and sea salts. The average contribution of natural sources in the total PM2.5 mass concentration over the sampling period is about 40%, and the contribution of the secondary inorganic compounds is about 27% (mainly ammonium sulfate in our case). The remaining 22% is assumed to be secondary organic compounds.

1. Introduction

The United Arab Emirates (UAE) climate is part of the arid East Mediterranean/North African climate, with less than 5 cm of annual rain [1]. The region is characterized by large expanses of desert and frequent dust storms, and is in close proximity to the Arabian Gulf with its oil extraction and shipping activities. Furthermore, the UAE continues to undergo rapid development with mega construction, renewable energy, oil, and petrochemical projects, and heavy shipping, and air and ground transport, all resulting in an increase in anthropogenic pollutants. Heavy traffic is a major source of pollution. In the gulf region, poor air quality is apparent from ambient measurements and degraded visibility [2,3,4]. Sundvor et al. [5] reported that the average contribution of traffic to particulate matter (PM)2.5 concentrations in European cities ranges from 6 to 66%. Diesel engines that have widespread use in trucks in the UAE construction projects contribute to the emissions of large amounts of fine particles, which are suspected of causing adverse health effects [6]. These fine particles are known to be mostly soot, in addition to the semi-volatile sulfuric acid [7]. Sulfuric acid is converted to ammonium sulfate upon reaction with ammonia (NH3).
PM pollution in the region is of major concern because of its adverse health and environmental effects [4,8,9,10,11,12,13,14]. Ambient air pollution is thought to be the leading environmental risk for disease and premature mortality in the UAE, followed by indoor pollution [10,15]. The WHO reported that seven million annual deaths in 2012 were directly linked to air pollution worldwide, accounting for one eighth of the total global deaths for that year [16,17]. Of those, 3.7 million premature deaths annually were attributed to outdoor air pollution, particularly to PM2.5. About 80% of those deaths are due to heart diseases and strokes, while 20% are due to respiratory diseases and cancer. In a recent study, Wong et al. [18] reported a direct association between PM2.5 concentrations and increased risk of mortality for all cases of cancer.
Even though both natural and anthropogenic pollutants contribute to the PM concentration in the atmosphere, natural sources such as dust storms contribute more to the coarse part of the PM, while anthropogenic sources increase the fraction of fine pollutants known as PM2.5. Other natural sources of pollution, such as salts originating from sea breeze and crustal materials, contribute to both the coarse PM10 (particulates with aerodynamic diameters between 2.5–10 μm) and the fine fractions of PM [19]. The smaller PM2.5 are potentially of greater concern for human health because they can penetrate more deeply into the lungs, causing extensive damage; alternatively, they get into the bloodstream increasing the risk of cancer and respiratory, cardiovascular, and ischemic heart diseases [8,9,12].
The health consequences of air pollution in the UAE were investigated in a study by Y. Li et al. [20]. They attributed about 545 deaths in 2007 in the UAE to PM pollutants. Despite uncertainty in PM background levels in the UAE, they concluded that anthropogenic pollutants are a considerable public health risk in terms of premature deaths. Nevertheless, their study did not investigate size-resolved elemental distributions in PM. They only used PM10 data from Abu Dhabi and interpolated ambient concentrations at locations and times for which monitored concentrations were unavailable. Bener et al. [9] also reported a systematic annual increase in the PM10 levels between 2002–2005. They recommended the immediate investigation and monitoring of PM.
As noted above, there have been only a few quantitative studies on the health effects of particulate matter pollutants in the UAE (mainly PM10 and PM2.5). Only a few publications investigated the elemental composition of PM in the region. Engelbrecht et al. [21], for example, conducted a study for the United States (US) Department of Defense on the chemical and physical properties of dust collected from five deployment countries at 15 military sites in the Middle East including Iraq, Kuwait, Afghanistan, Qatar, and the UAE. Although their study is one of the major works performed in this field in the region, it investigated samples collected from only one site in Qatar, and one in the UAE. These two sites were at military bases in the desert far from urban residential areas in both countries. Urban and residential areas are more susceptible to industrial and traffic pollution. Furthermore, the study was conducted over a period of one year in 2006–2007, more than 10 years ago. Major development in the region, especially in the UAE, took place during the last 10 years, with mega construction, energy, and industrial projects that have considerable environmental impacts. An important result of the study of Engelbrecht et al. [21] is that PM10 and PM2.5 levels are considerably higher than the accepted standards. This result requires follow-up and extension to residential and industrial areas in order to make precise evaluation of PM levels. More importantly, this study focuses on the understanding of the chemistry of PM during transport in the atmosphere.
Tsiouri et al. [22] summarized the available information on the health impact and source apportionment of atmospheric PM pollution in the Middle East region. They recognized the existence of a significant problem on the quantification of PM emissions. They concluded that there is a need for more systematic data collection, source apportionment, and the assessment of PM levels to help prepare and minimize adverse health effects.
To address some of these issues, preliminary results from a recent study showed that a major constituent of the fine and ultrafine fraction of PM pollutants is ammonium sulfate [19,23,24]. Elements such as V, Ni, Cu, Zn, Cr, and Pb, which usually originate from traffic emissions, were observed in the fine and ultrafine fractions of PM. Elements from natural sources such as Si, Ca, Fe, Al, Sr, Ti, Na, Mg, K, Cl, and Br were also observed both indoors and outdoors in urban environments. In this work, we report on the results of a detailed sampling campaign to collect PM2.5 from an urban background site in Sharjah. The characteristics of this site are detailed below. The project involved gravimetric measurements, elemental distribution, and chemical analysis of the constituents of PM2.5 samples using multiple complementary techniques such as X-ray fluorescence (XRF), scanning electron microscopy (SEM/EDS), and X-ray diffraction (XRD). The rest of this paper is organized as follows: the experimental details of gravimetric, XRF, XRD, and microscopy measurements are followed by detailed results, an analysis of each, and then conclusions and acknowledgements.

2. Experimental

Sampling was performed using a low-volume double-stage station (model ISAP-1050e). The coarse fraction of PM10 was collected on 30-mm inner diameter ring films, while the PM2.5 was collected on standard 47-mm Teflon filters. PM samples were collected for 24 h once every six days, using the European standard (EN12341 2.3 m3 h−1) [25,26]. Sampling was performed between 15 October 2014 and 16 August 2015 at an urban background site, as defined by Guidelines for the Air Quality Monitoring Network [27]. The site is located at the rooftop of the main building at the American University of Sharjah, which is a secured site far enough from direct pollution sources and major highways. Local traffic is at least 200 m away from the building. The sampling station was also far away from any obstacles. Results for the analysis of 30 samples of PM2.5 are presented in this article. Sampling dates and weather conditions are detailed in the Supplementary Table S1. The samples were collected as part of an ongoing regional project on synchronized aerosol mapping in six Middle Eastern countries: Jordan, Iraq, Lebanon, Syria, the United Arab Emirates, and Yemen. The project is sponsored by International Atomic Energy Agency (IAEA).

2.1. Gravimetric and Smoke Stain Measurements

Airborne PM2.5 mass concentrations were determined gravimetrically following a standard operating procedure [26,28].
Smoke stain measurements were performed using an EEL 43M model Smoke-stain Reflectometer (M43D EEL; Diffusion Systems Ltd., London, UK). The reflectometer was calibrated before every measurement using two reference samples provided by the manufacturer.

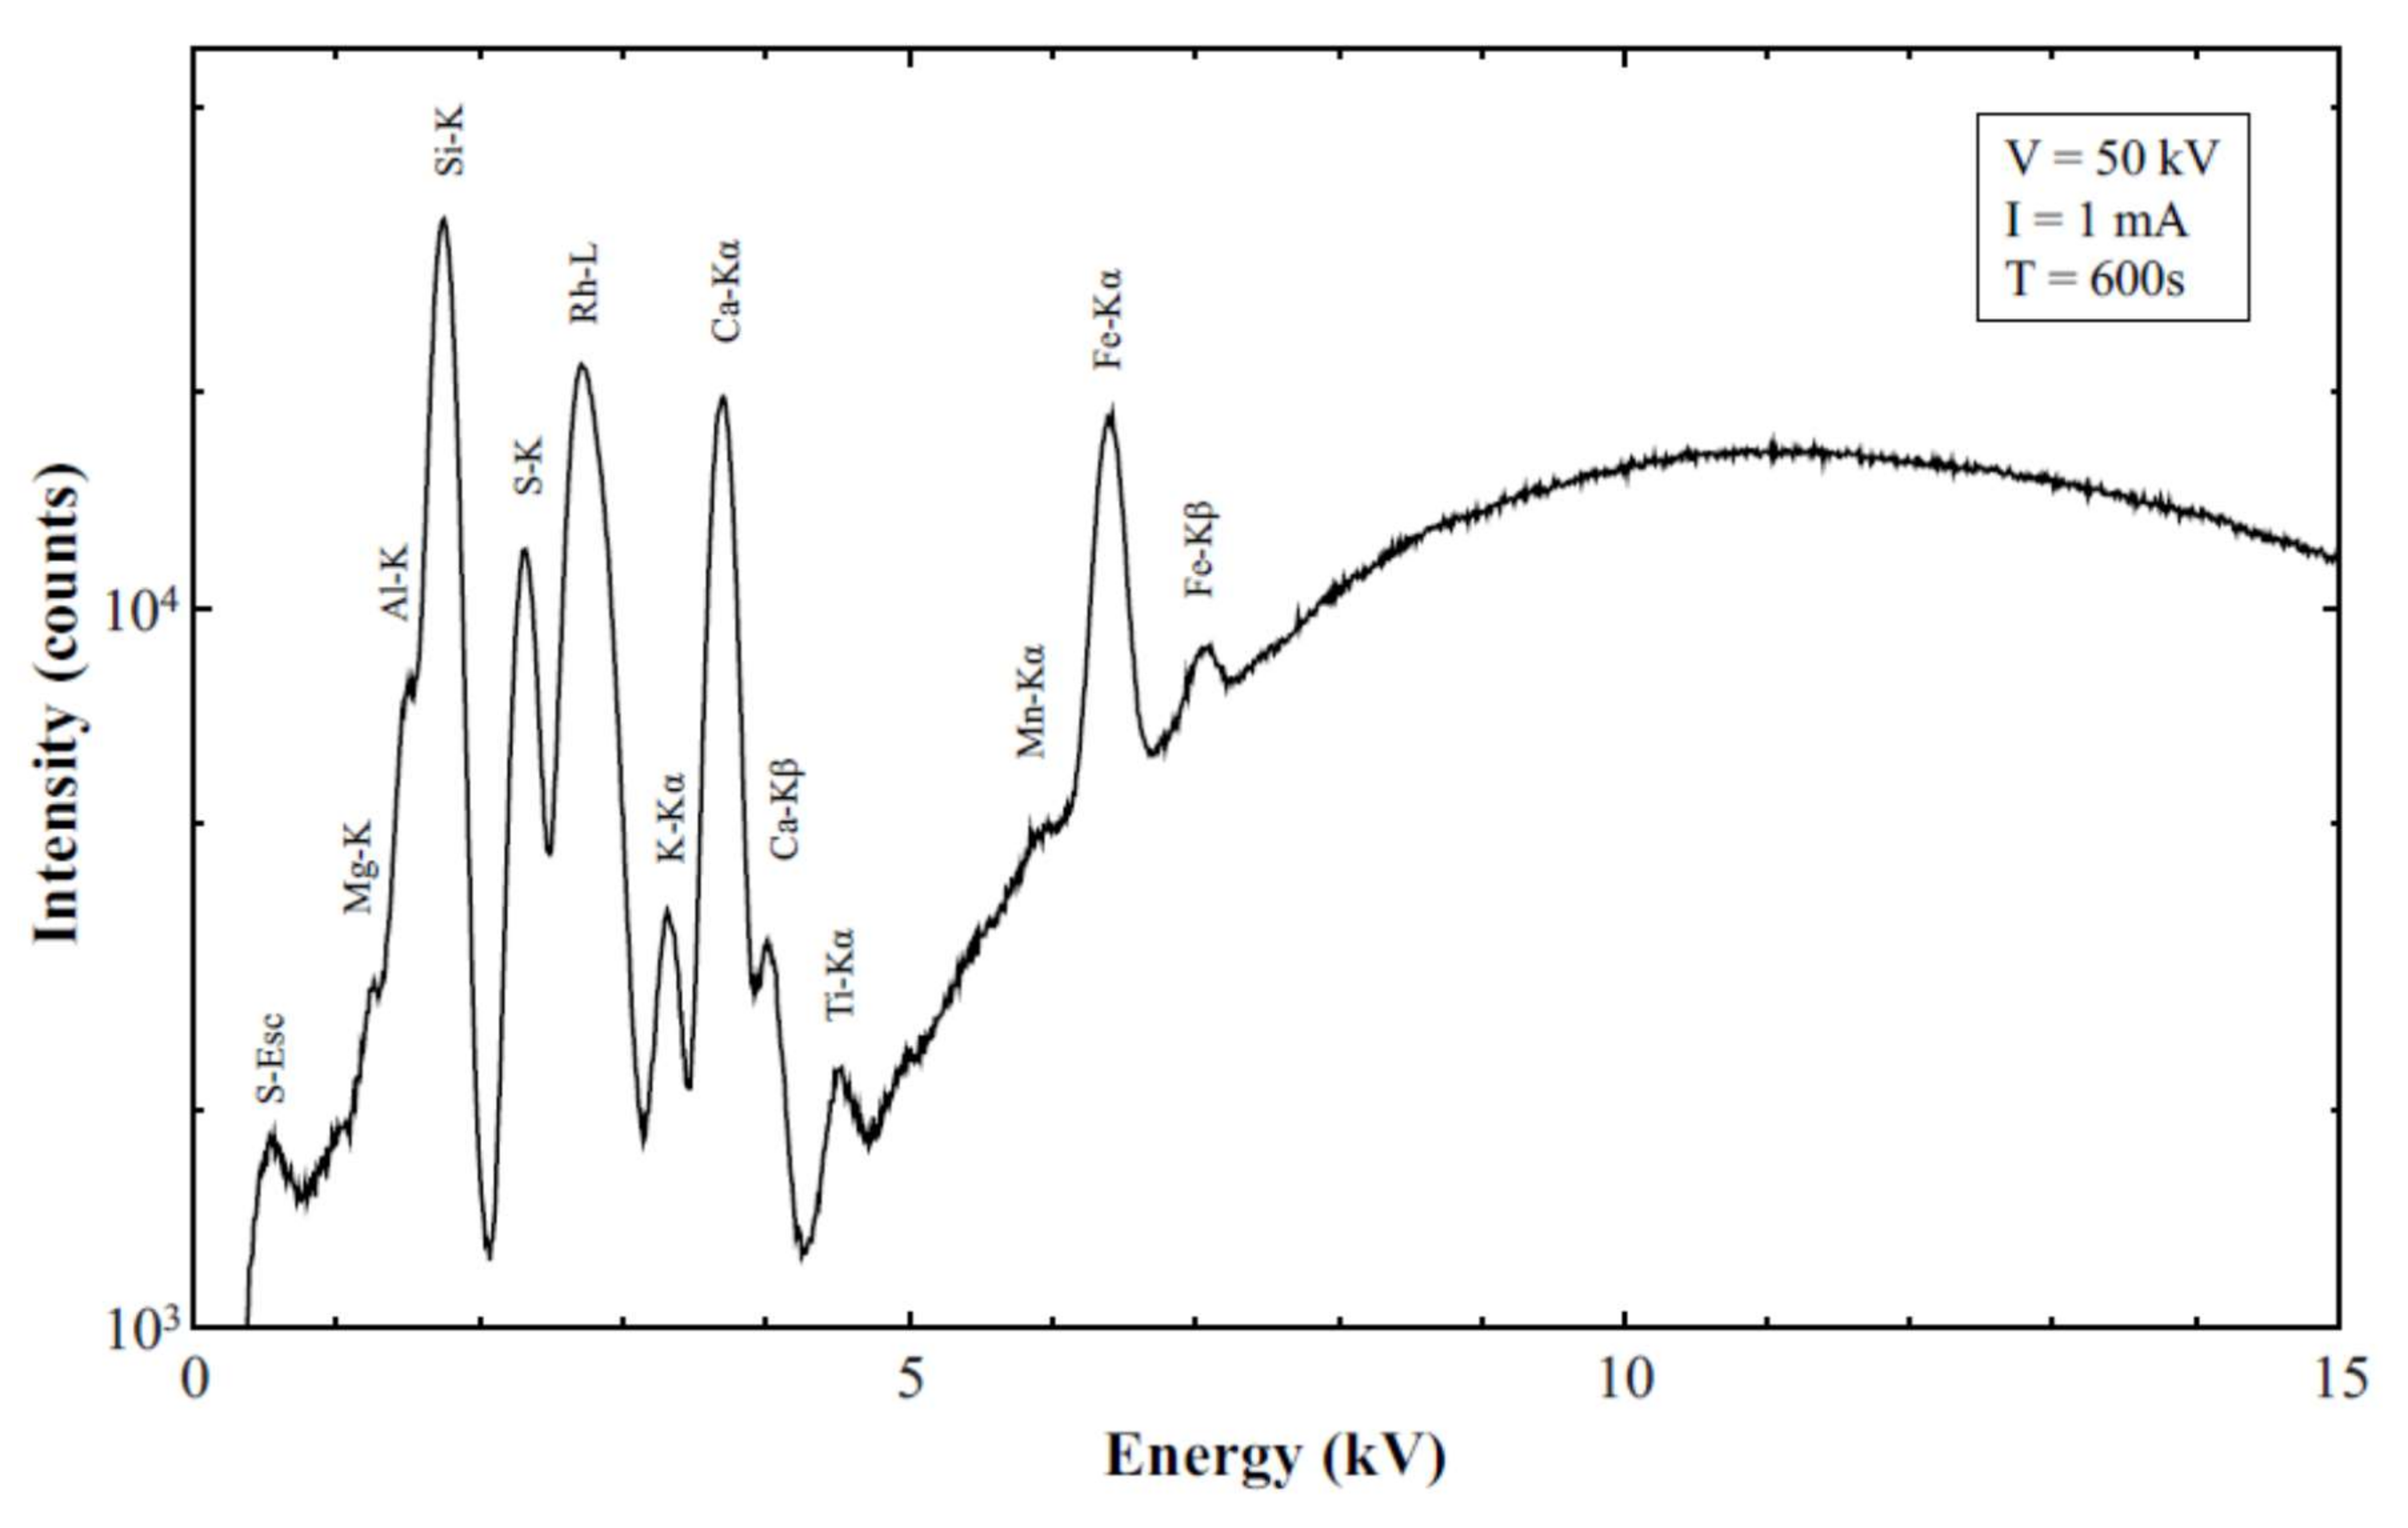
2.2. XRF Measurements

X-ray fluorescence measurements were performed on a Horiba XGT7200 µ-XRF system, with 1.2-mm beam size, 1 mA emission current, and 50-kV excitation potential. Data were collected for 600 s at three different spots for each Teflon filter.
Micromatter thin film standards were used in order to establish single-point calibration values for the sensitivity factors (in (cps m−1A−1)/(µg cm−2)) for the following elements: Na, Cl, Mg, Al, Si, S, Ca, K, Ti, V, Cr, Mn, Fe, Ni, Cu, Zn, Sr, Ba, and Pb. Elemental compositions in µg m−3 of the 30 Teflon filters were then determined utilizing the sensitivity factor for each element.
Quantitative analysis of airborne mass concentrations was performed for 12 major elements in µg cm−2, appearing in the XRF spectra of all the filters. Other trace elements were below the detection limit of the analytical method. The sampling area on the filter was 12.9 cm2, and the collected air volume per sample was 55 m3. Airborne mass concentrations of various elements were converted to µg m−3 in order to determine the percentages of various sources of pollutants based on the total mass obtained by gravimetric measurements. Elemental concentrations for all filters are shown in the Supplementary Table S2.

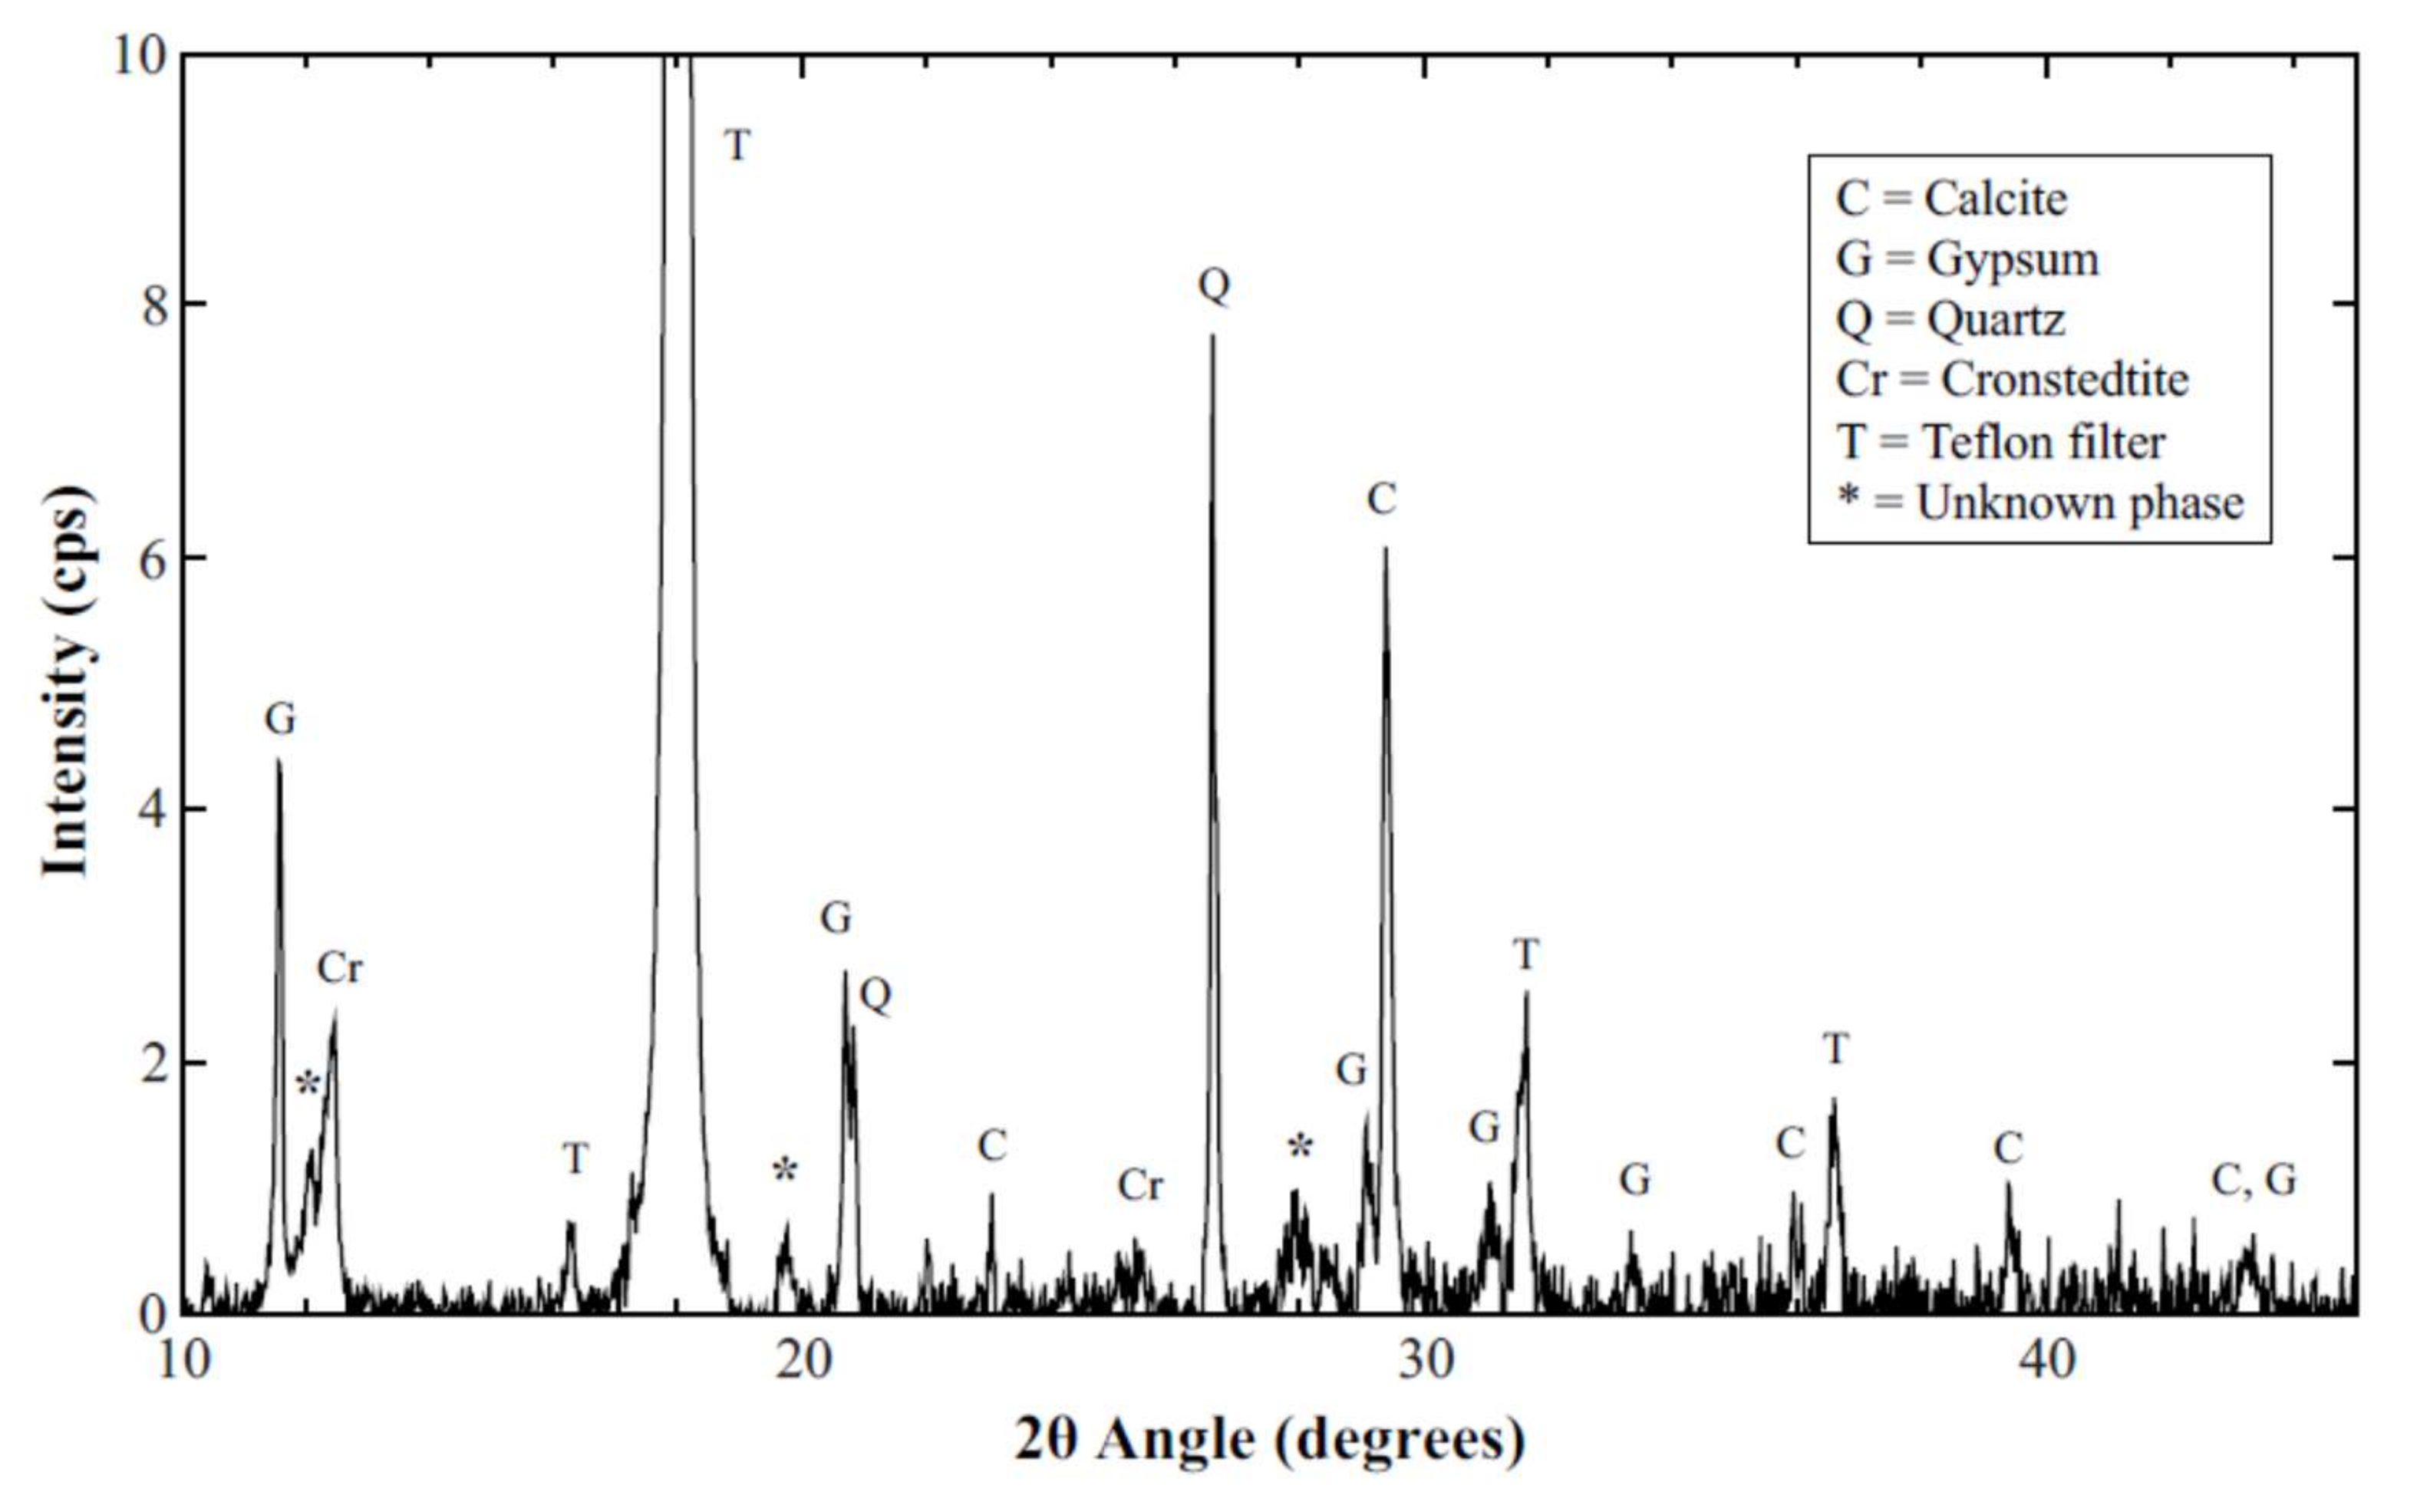
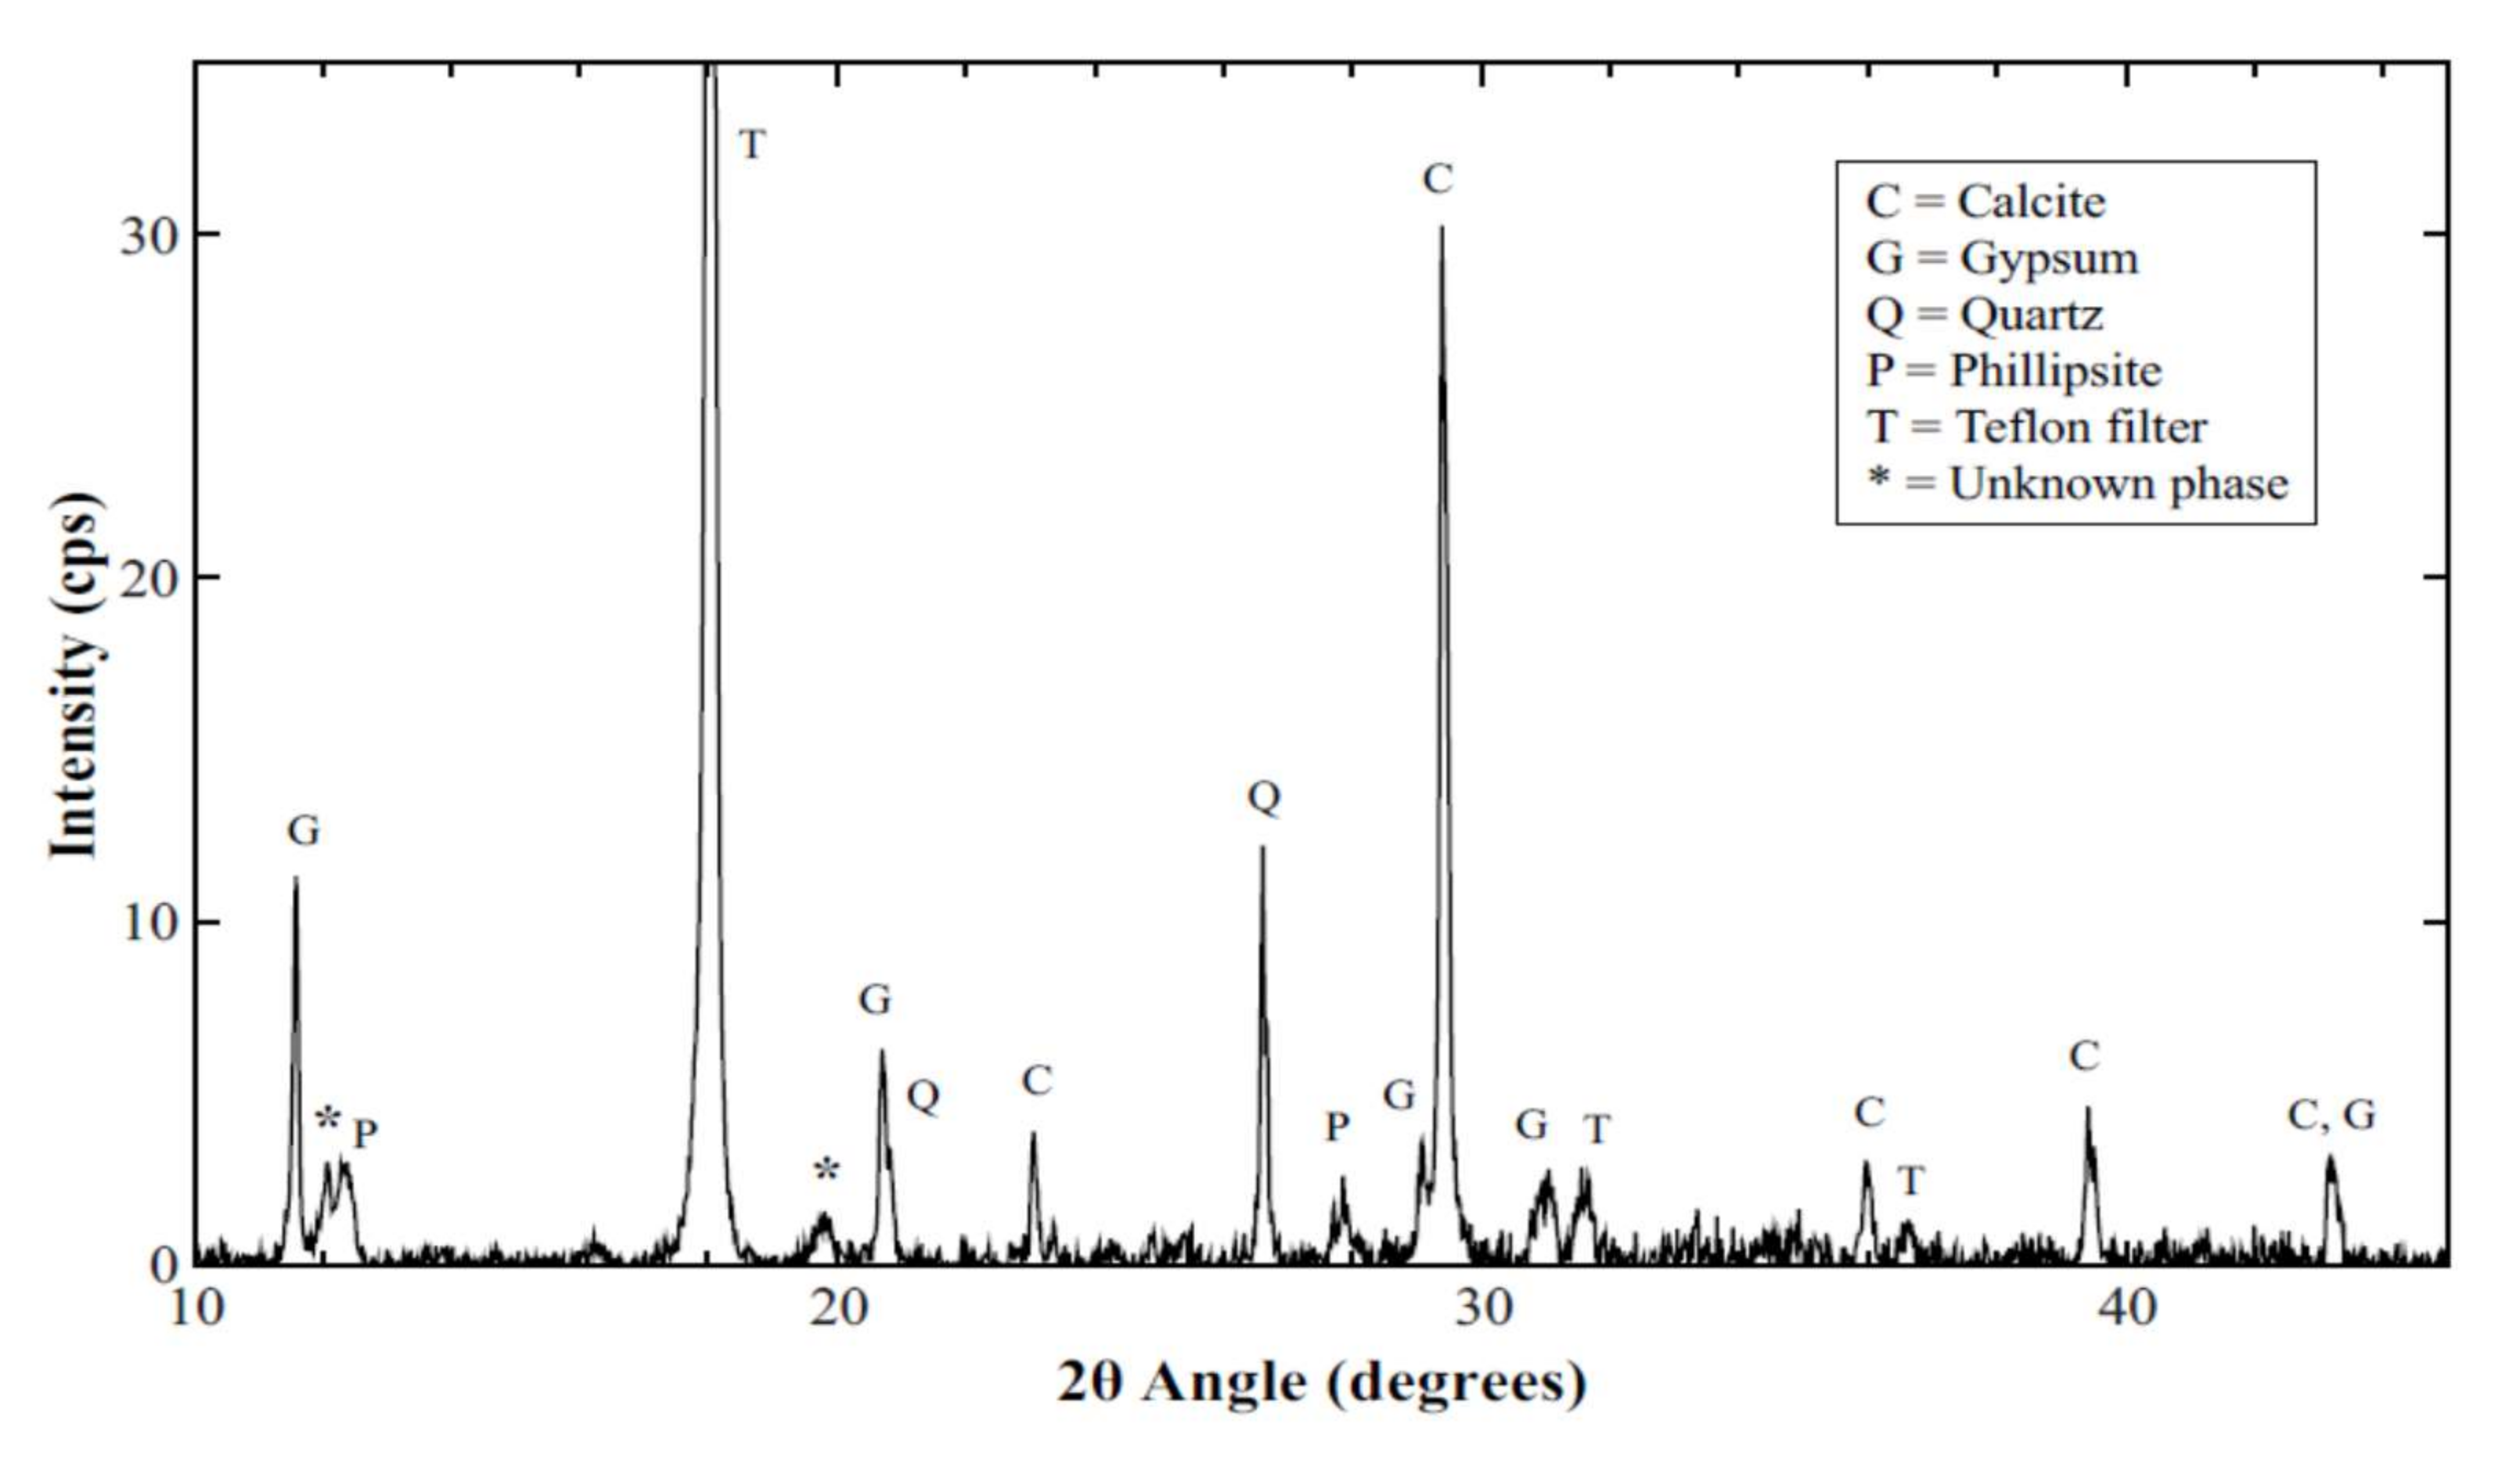
2.3. XRD Measurements

X-ray diffraction measurements were performed on selected filters using a Bruker D8 ADVANCE system with a Cu tube and a linear detector (LYNXEYE XE). The measurements were performed with a step size of 0.02°, 2θ range of 5° to 55°, and time per step of 5 s. A few filters from both clear and dusty days were selected for XRD analysis.

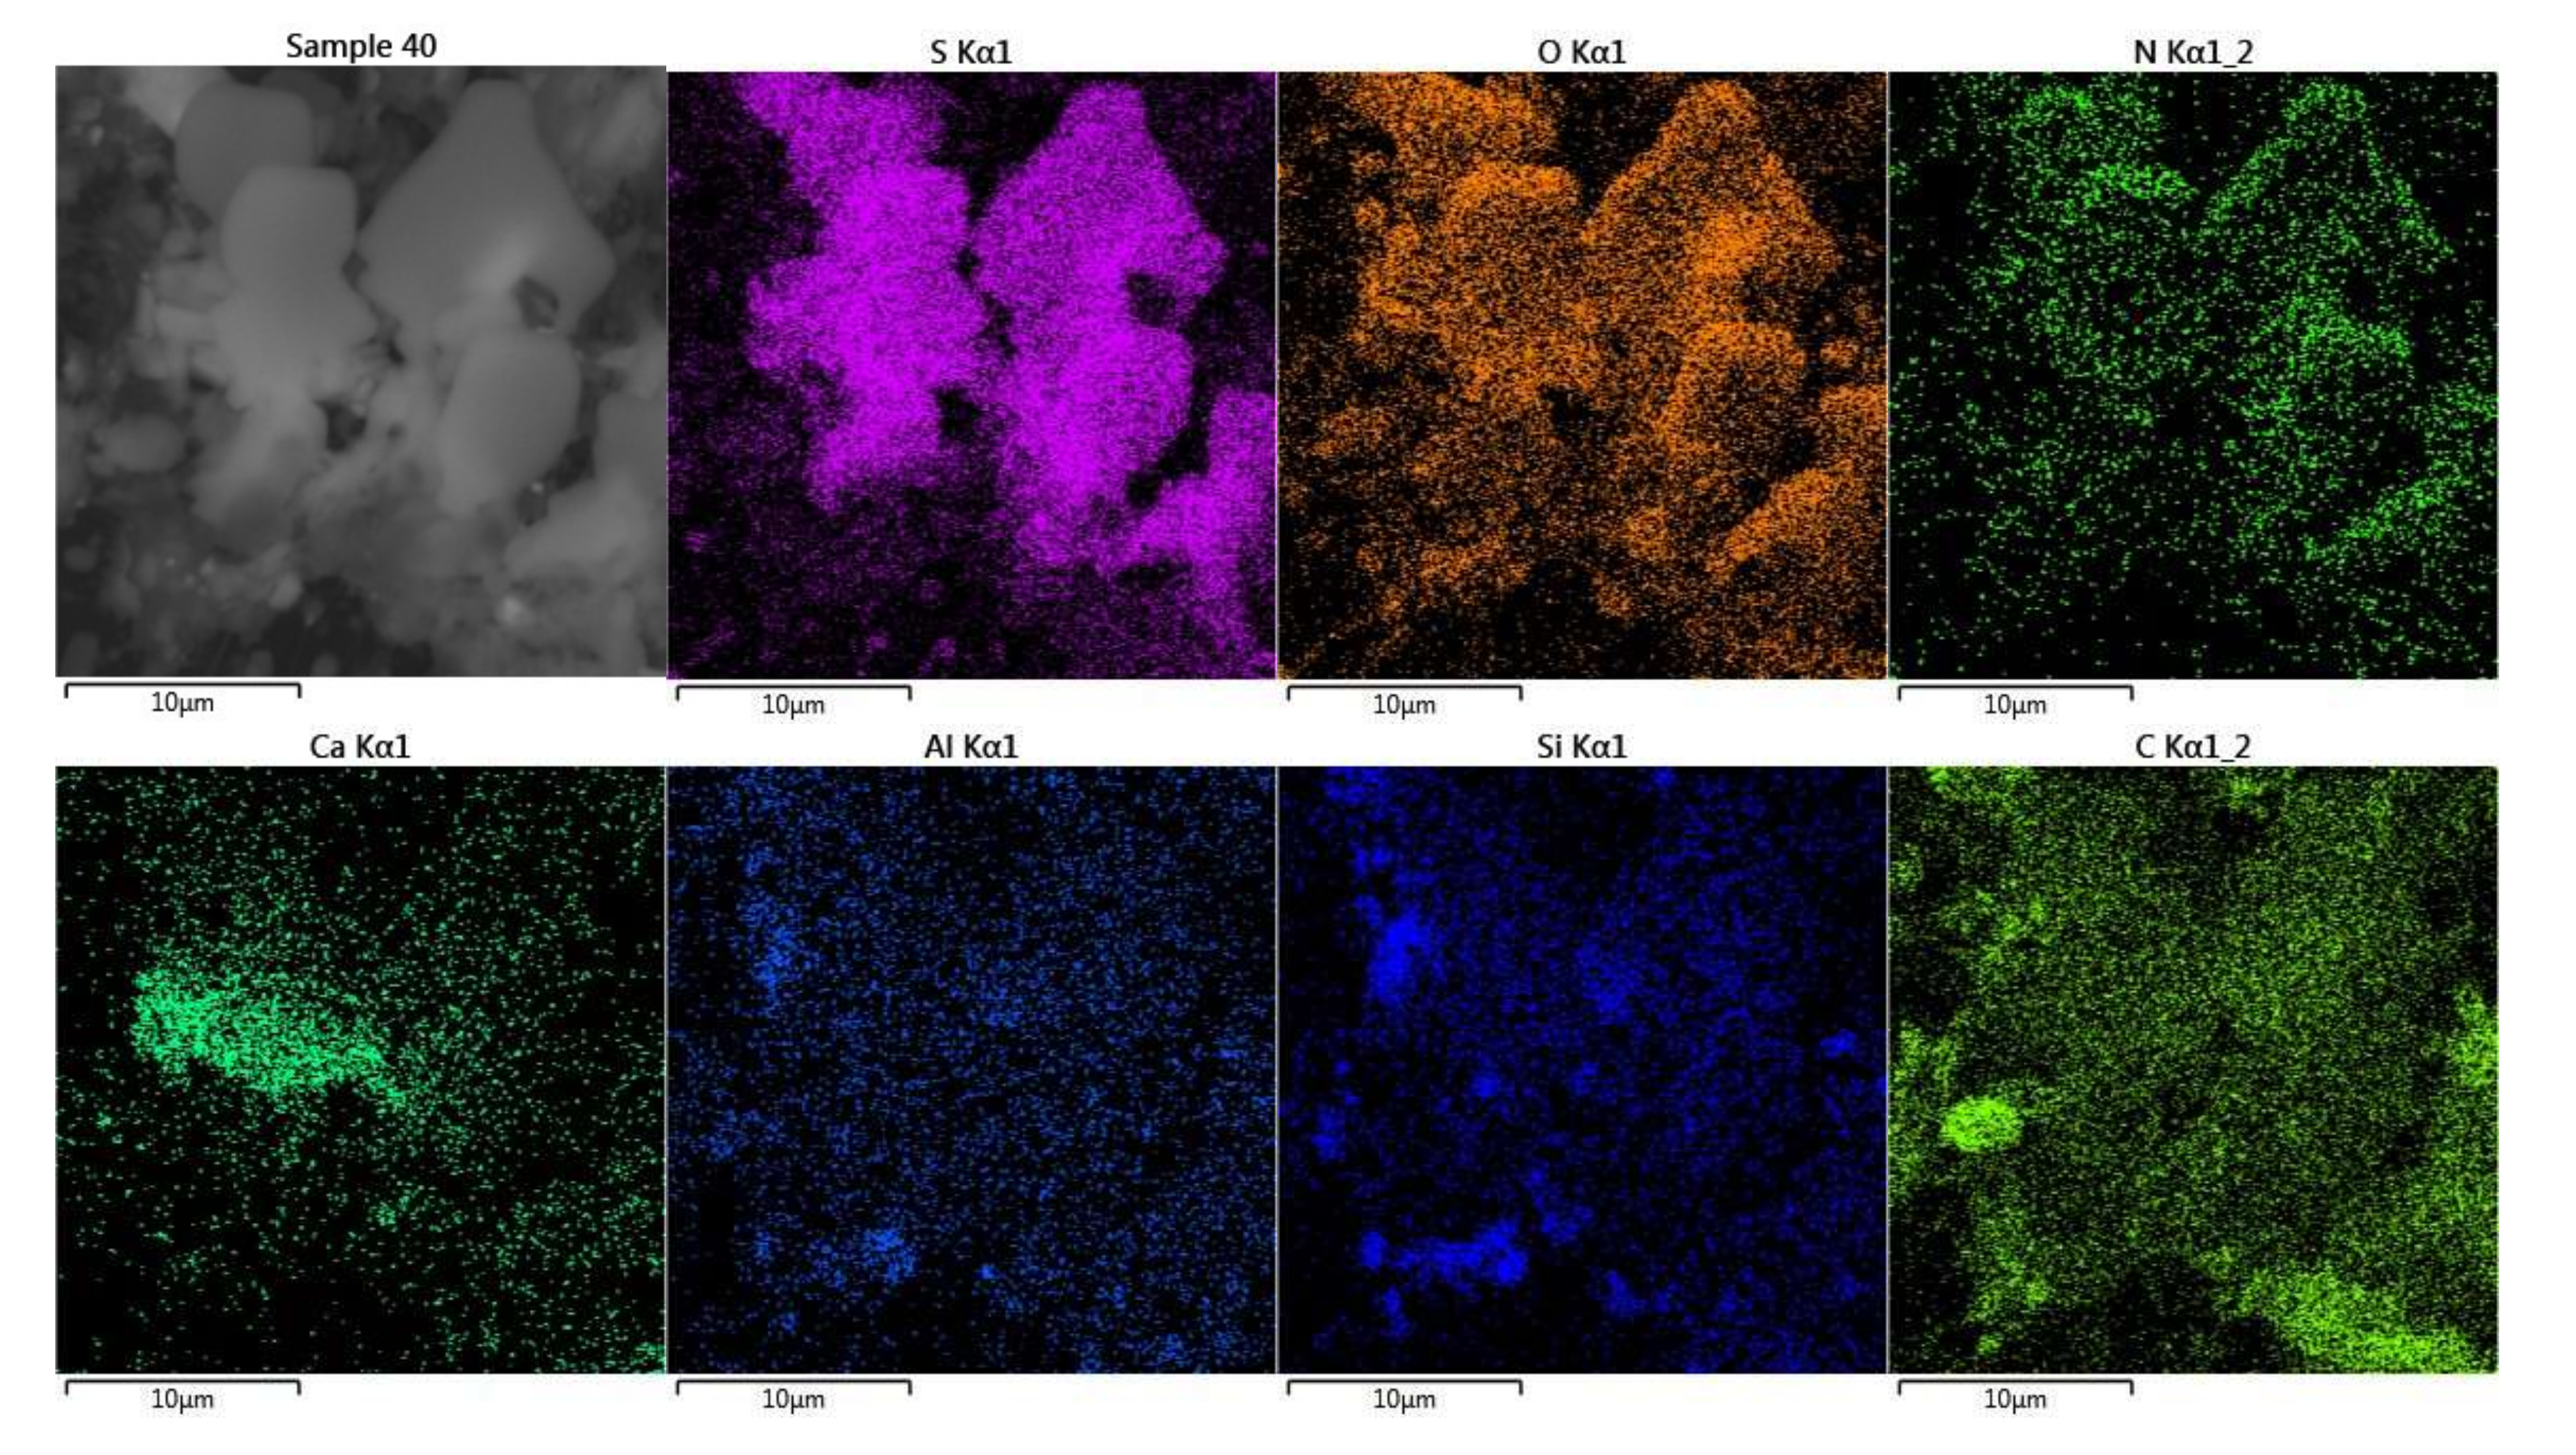
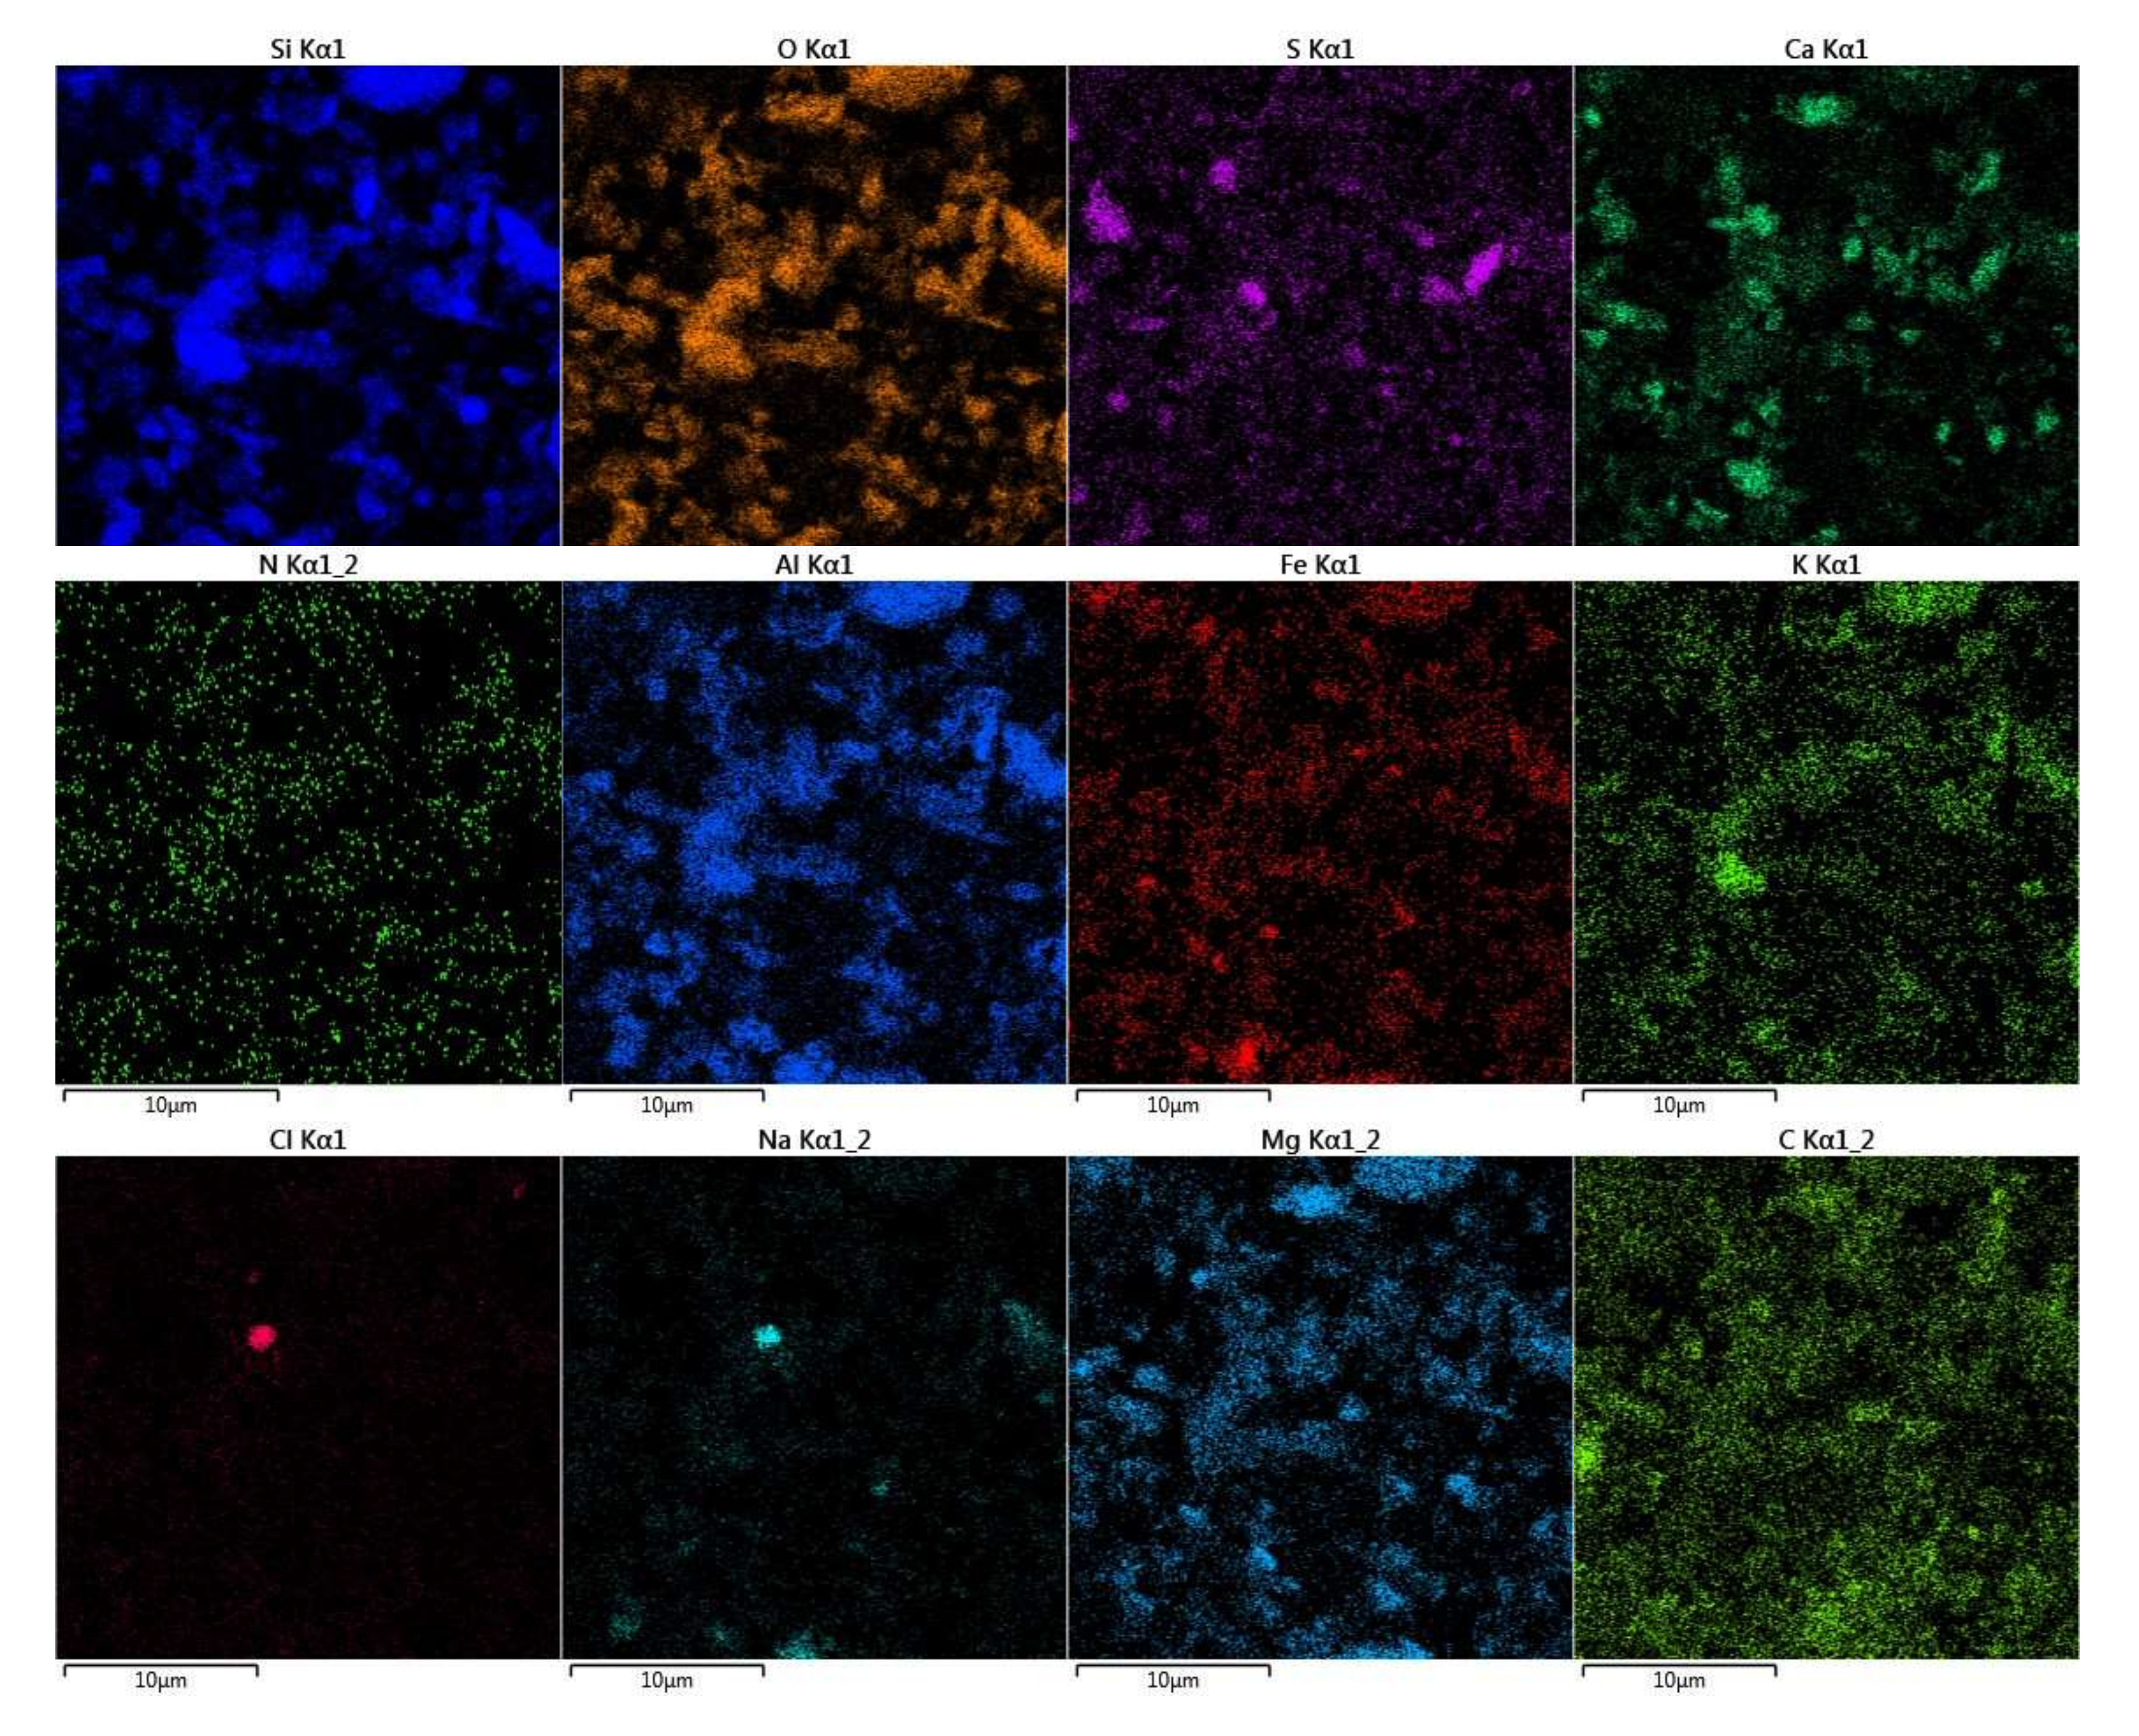
2.4. SEM/EDS Imaging

Imaging and elemental maps were performed for selected filters on a TESCAN environmental scanning electron microscope (VEGA3 XMU). The electron beam excitation was set at 20 kV, and low vacuum (10 Pa) was used to avoid charging the filters. A few filters from both clear and dusty days were selected for SEM imaging and elemental mapping.

2.5. Quality Assurance

Quality assurance and control were performed, and the data were validated against a NIST Standard Reference Material 2783, using the same established calibration procedures mentioned above with the Micromatter standards. This Standard Reference Material (SRM) is an air particulate sample reduced in particle size to simulate airborne PM2.5 and deposited on a polycarbonate filter membrane [29].

3. Results and Discussions

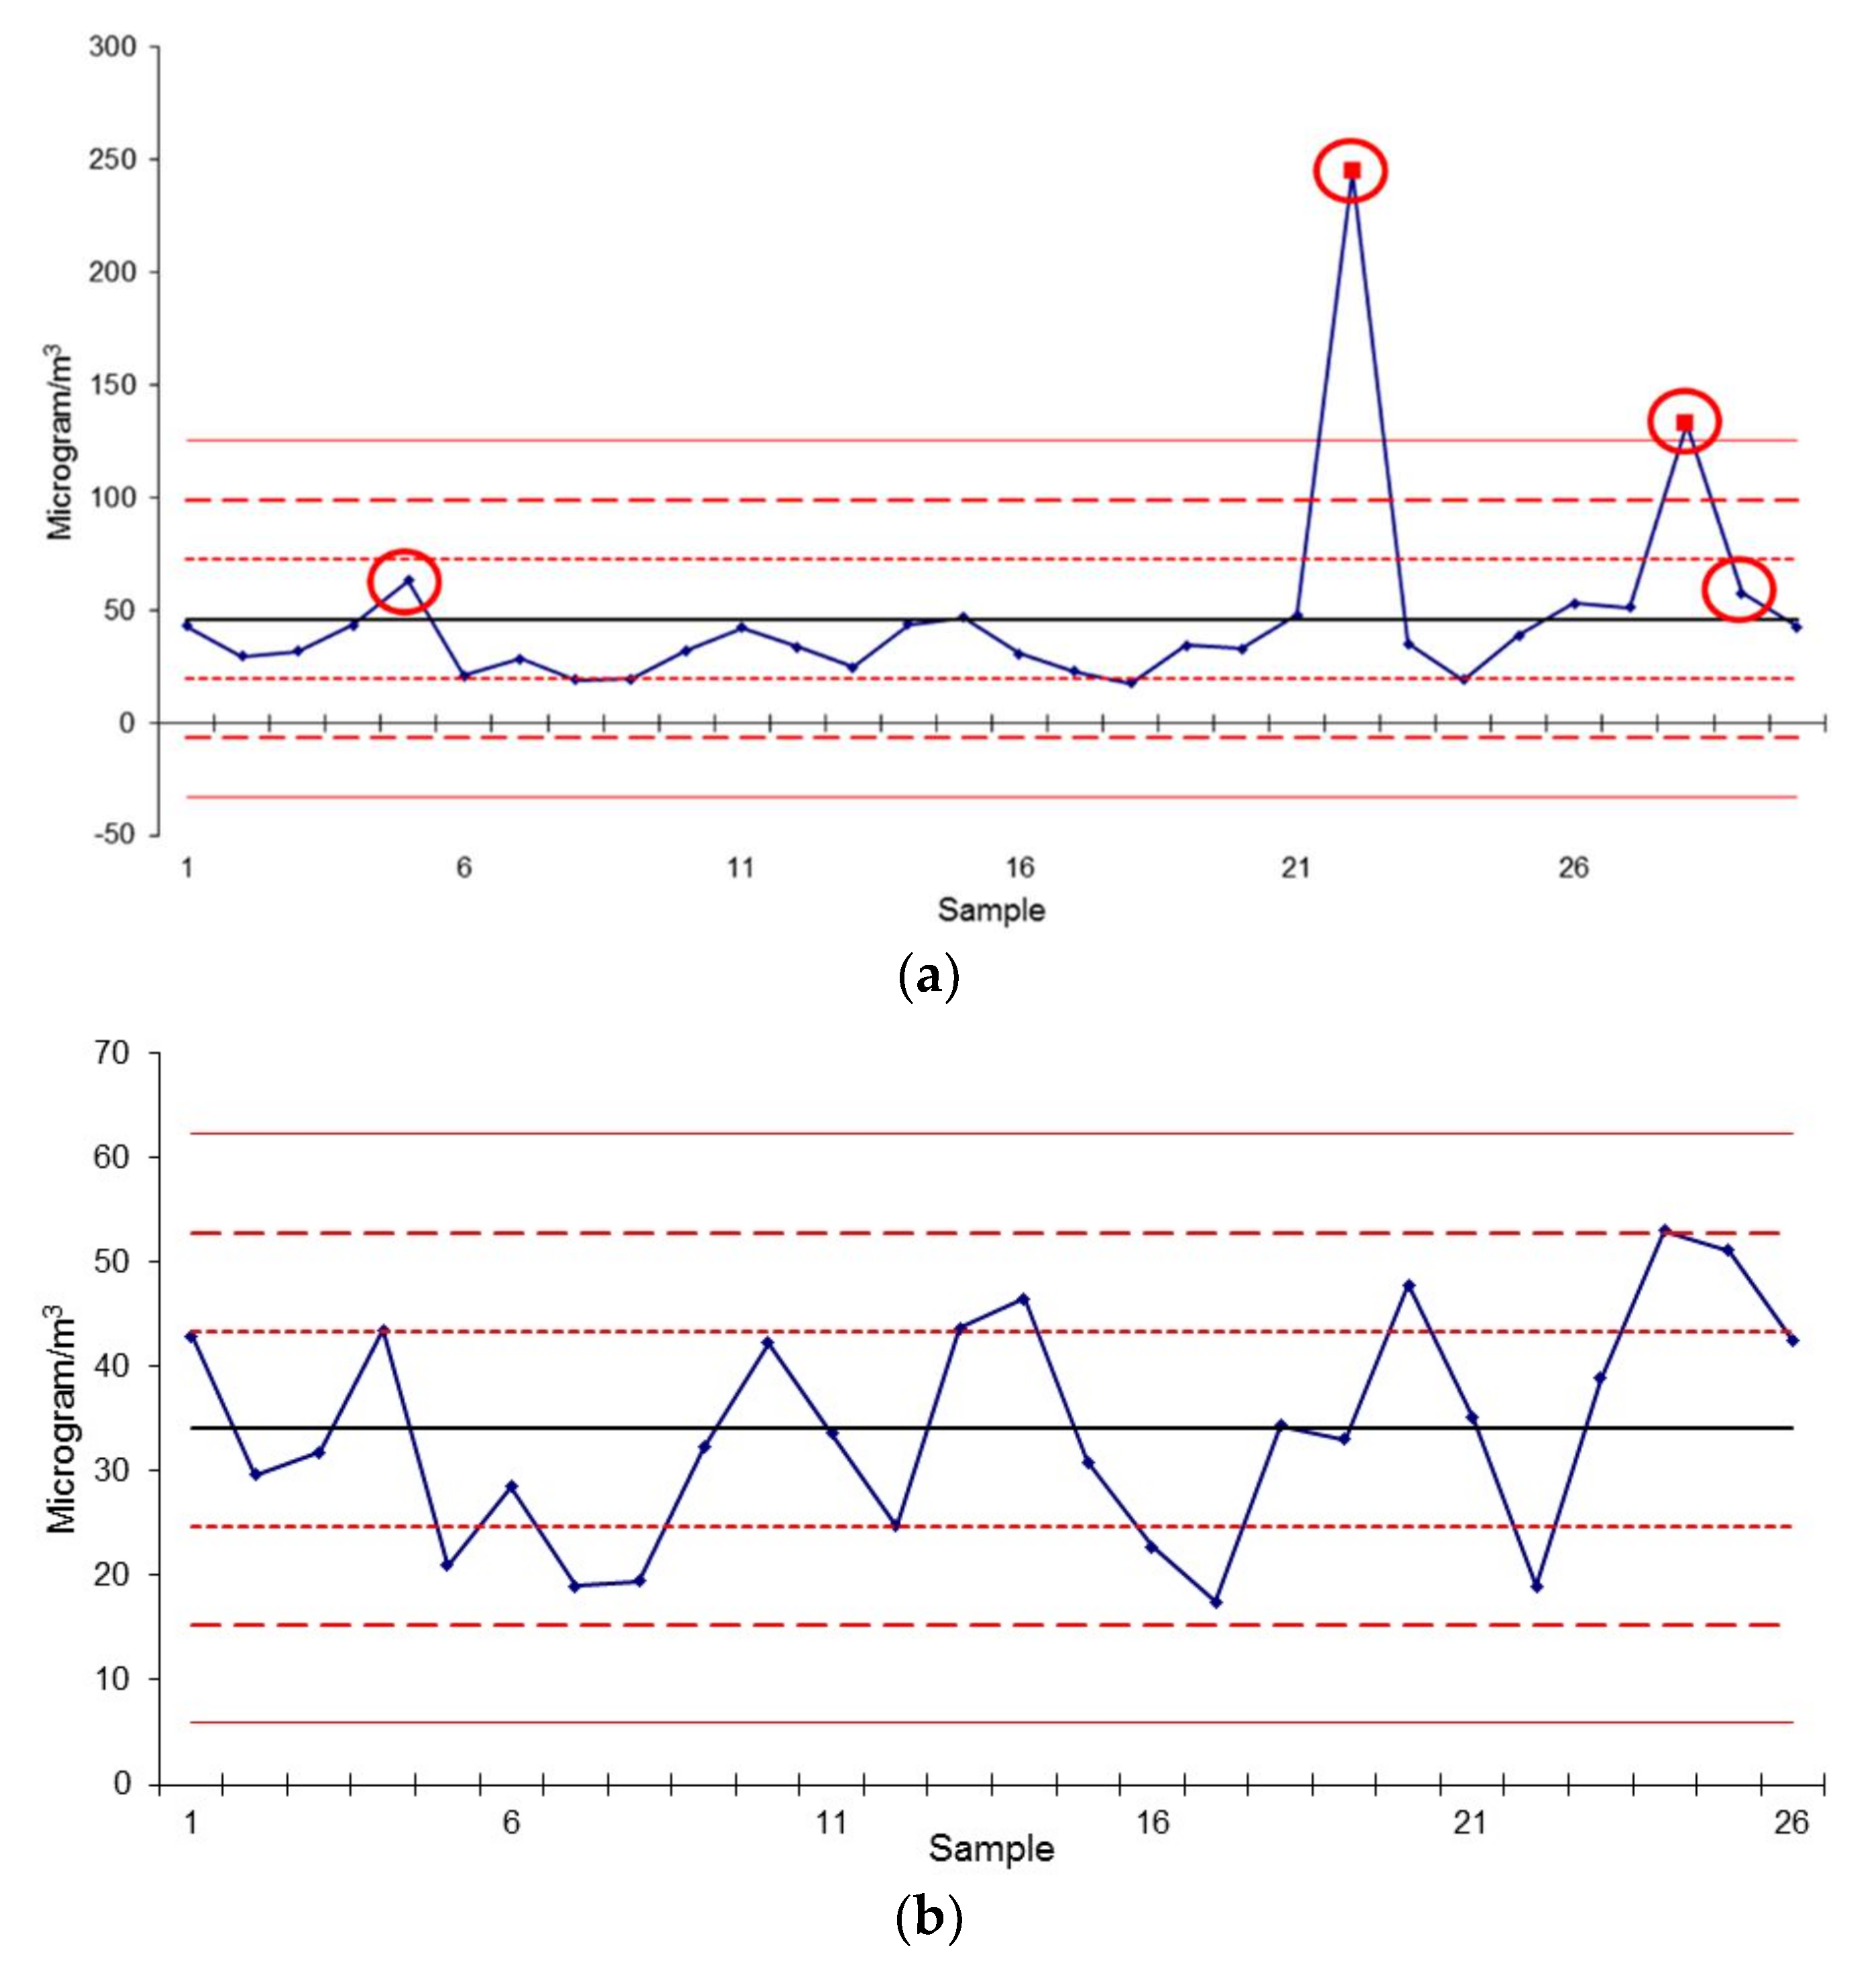
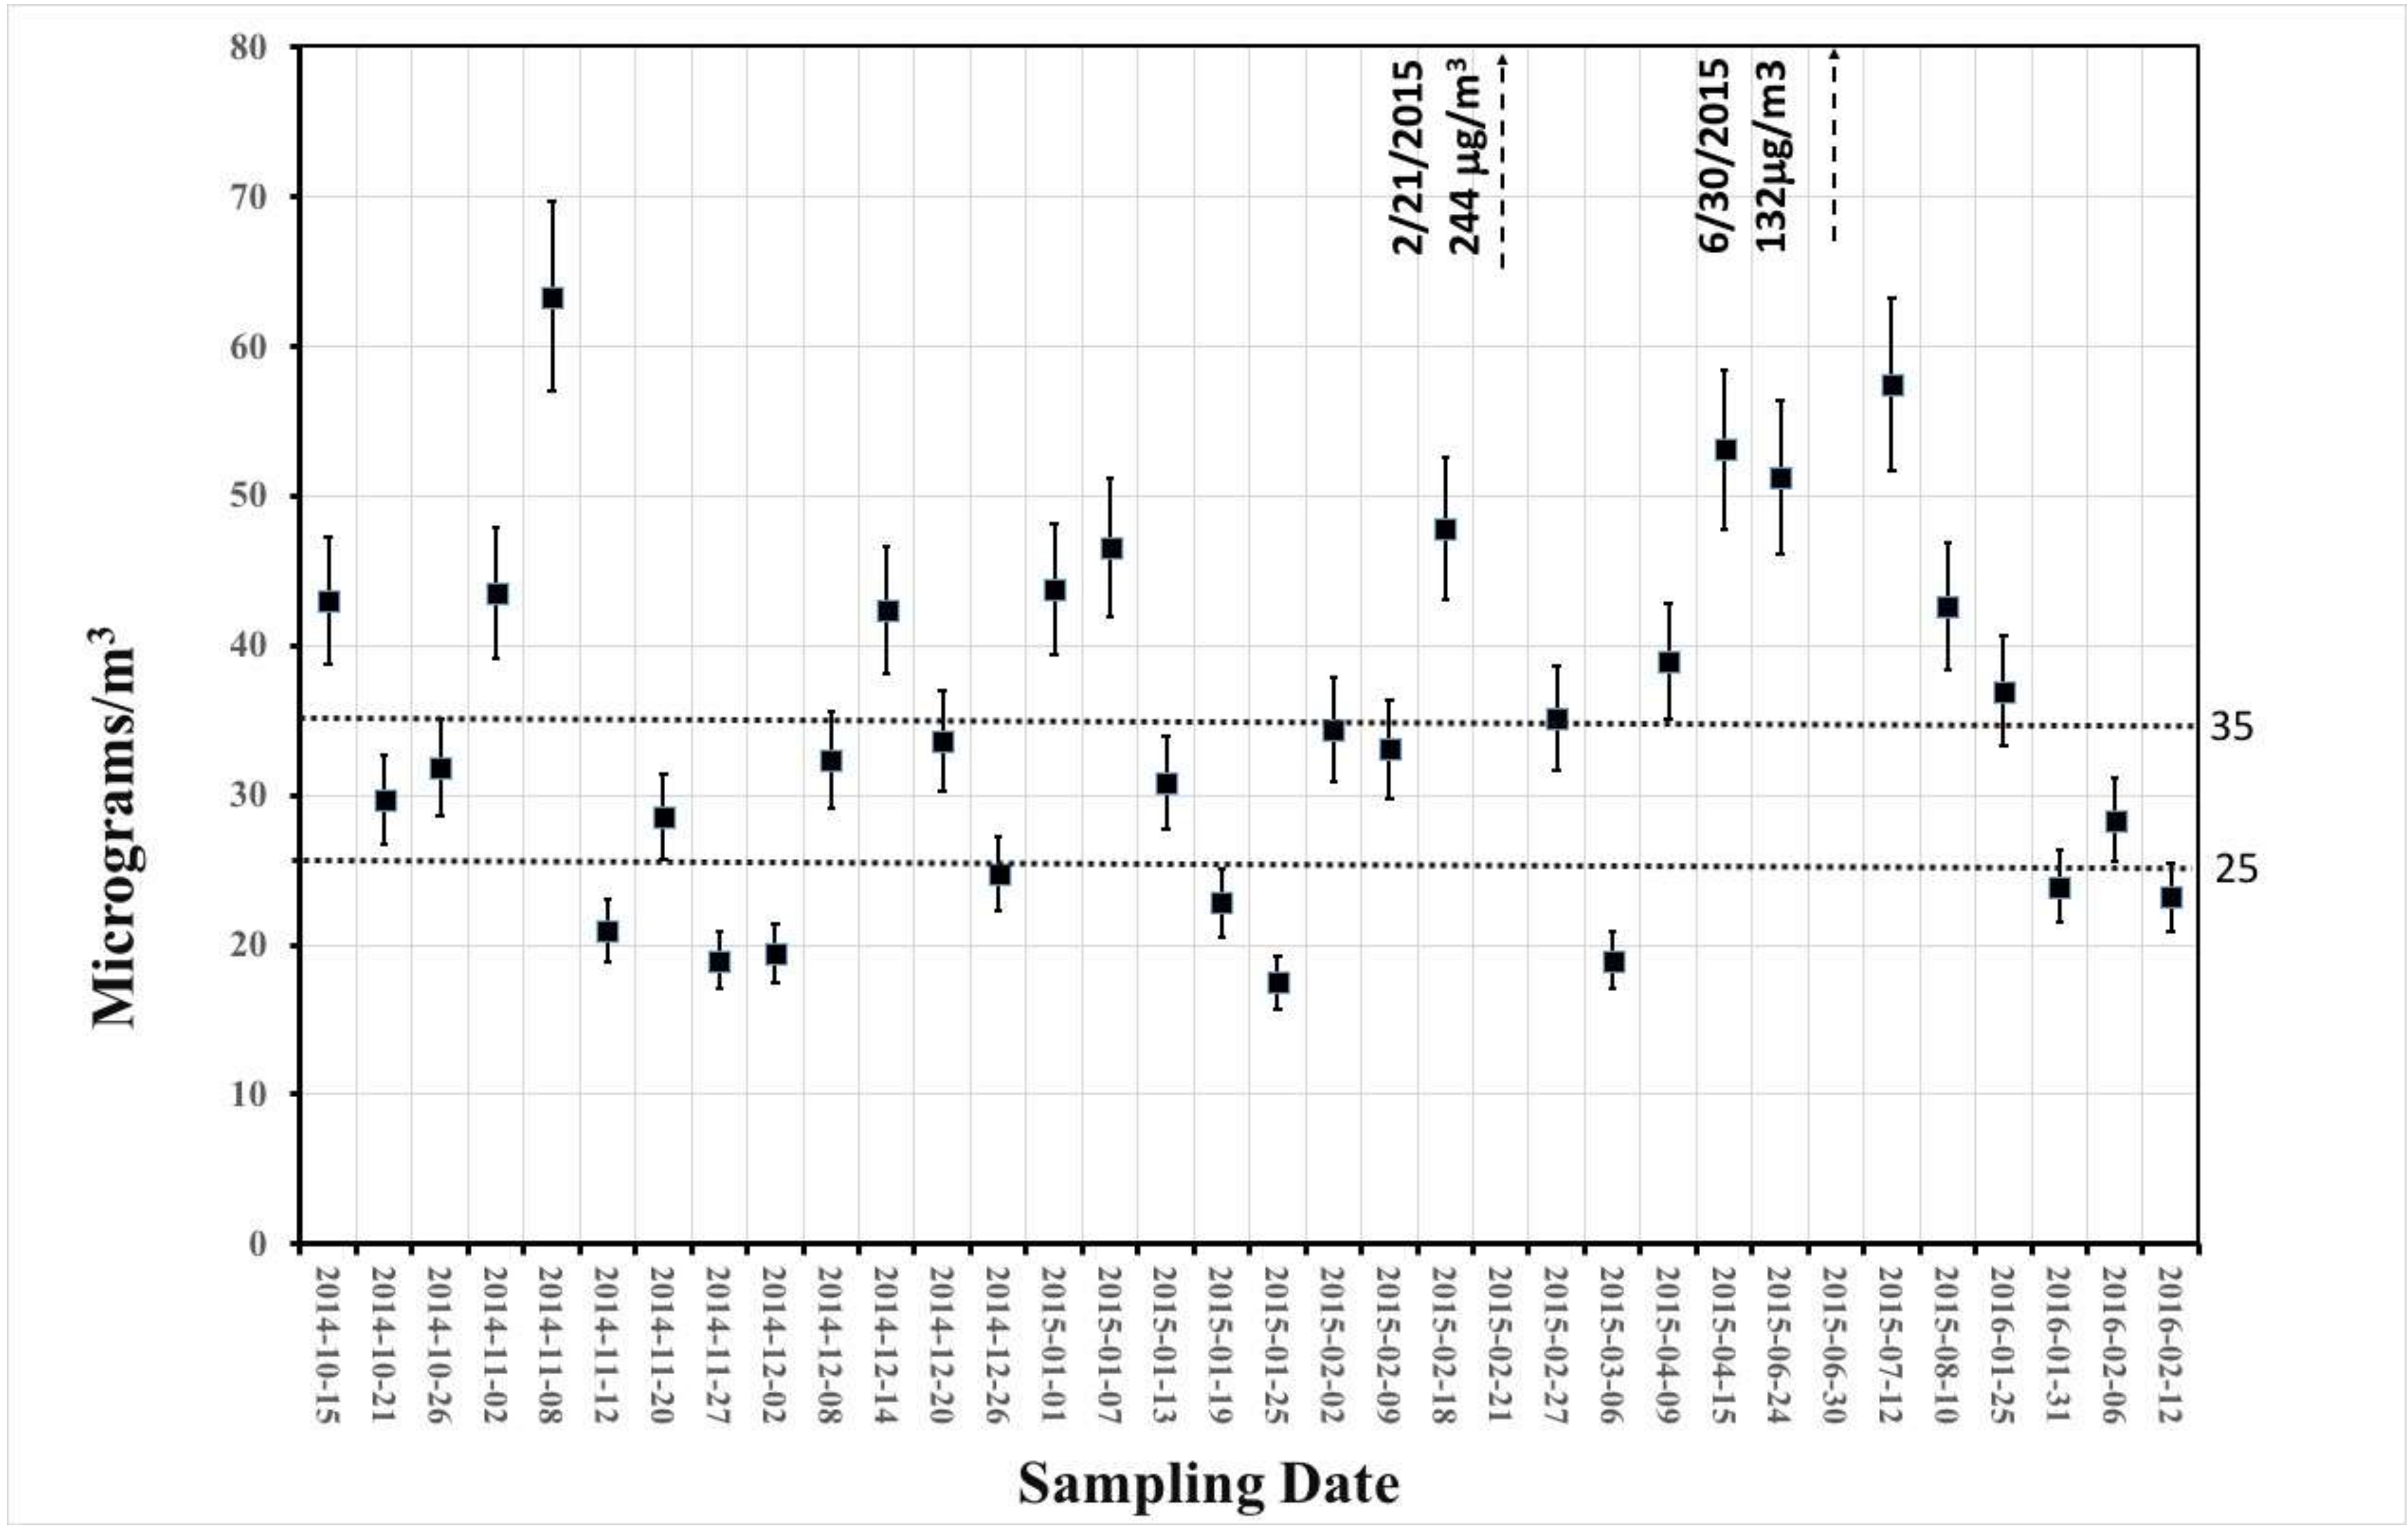
3.1. Gravimetric and Smoke Stain Results

Figure 1 represents the airborne mass concentrations of aerosols obtained from gravimetric analysis. It shows that the amounts of airborne PM2.5 collected are below the WHO limits for about 30% of sampling days, and below the accepted United States Environmental Protection Agency (US-EPA) limits on more than 60% of the sampling days [30,31]. PM2.5 concentrations are above the internationally accepted limits on about 40% of the sampling days. The PM2.5 values were above the international standards only on days that had dust episodes. This is evidence that natural sources of pollutants contribute to the fine and ultrafine fractions of PM. We note here that in the event of dust episodes, the coarse ring filter, which is located above the PM2.5 Teflon filter in the sampler, gets saturated, and coarse PM in this case are deposited on the PM2.5 filter. For this reason, the airborne mass concentrations can reach values as high as twice the accepted numbers. There were two extreme dust episodes during the sampling days where the PM2.5 filter was visually observed to be loaded with coarse particles (the filter for coarse fraction became saturated). This happened on Saturday 21 February 2015, where the loaded PM on the filter was about 240 µg m−3; and on Tuesday 30 June 2015, when the loaded PM on that day was 132 µg m−3. On 16 August 2015, we experienced yet another severe dust storm in which the PM2.5 filter was overloaded with coarse particles, and we couldn’t identify the amount of PM2.5 fraction. To a lesser extent, this may have also occurred for sample 31, when the airborne mass concentration on that day was 63 µg m−3. The filters with 240 µg m−3 and 132 µg m−3 were excluded from gravimetric analysis, but they will be presented in the statistical process control chart below (Figure 2a).
Figure 2a represents the statistical process control chart for the total mass concentration of the samples. The graph measures the average distribution of the data and its variation from the mean. The black middle line is the average of the mass concentration of PM2.5. The deviation from the average is measured by three different confidence intervals. The closest lines (above and below) to the average are the upper and lower control limits within one standard deviation of the mean. The same equations were used for the other two sets of lines, but for two and three standard deviations of the means. The equations for the upper and lower control limits are as follows, where x is the confidence level [32]:
U p p e r   C o n t r o l   L i m i t = A v e r a g e + x σ ^
L o w e r   C o n t r o l   L i m i t = A v e r a g e x σ ^
Figure 2a shows that the process is not in statistical control for two of the points that have a red square on top of them. These points fall outside of the upper and lower control limits for all of the confidence levels. However, the reason that the mass concentrations for these samples are relatively high is that there were dust storms on the days that they were collected. All of the samples that were collected on days with dust storms are circled in red. This explains the elevated mass concentration levels for these samples. After removing these points, the new statistical control chart is shown in Figure 2b The process is now in statistical control within a confidence level of 2* σ ^ . The new average value is now 34 µg m−3.

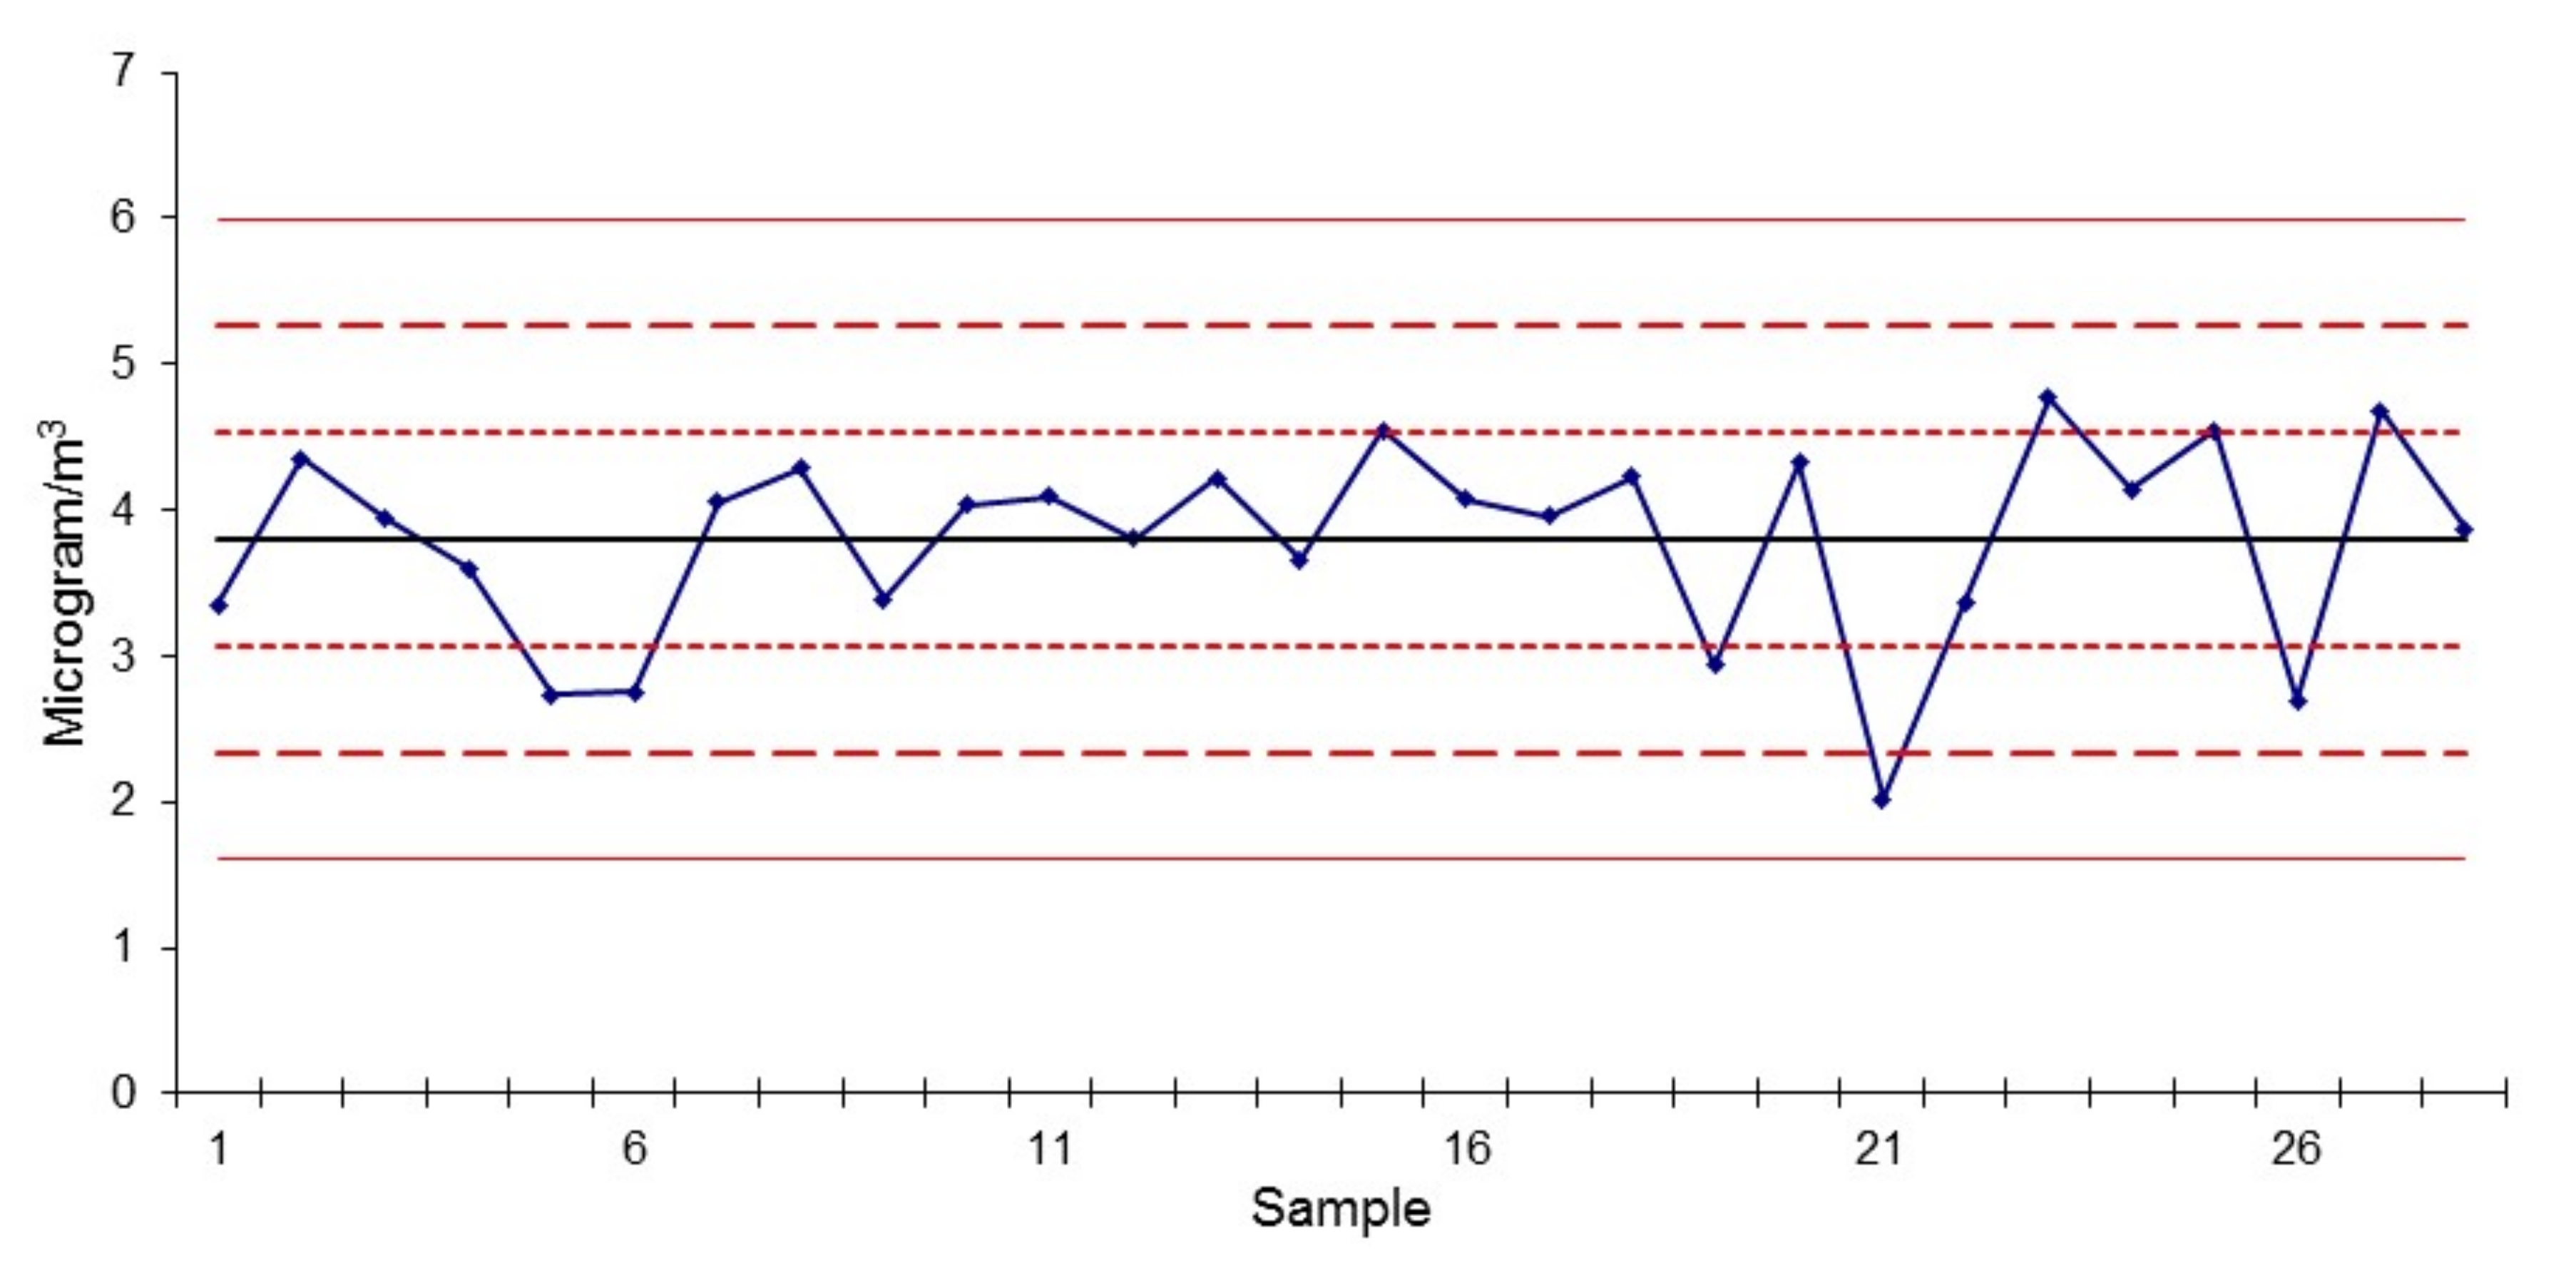
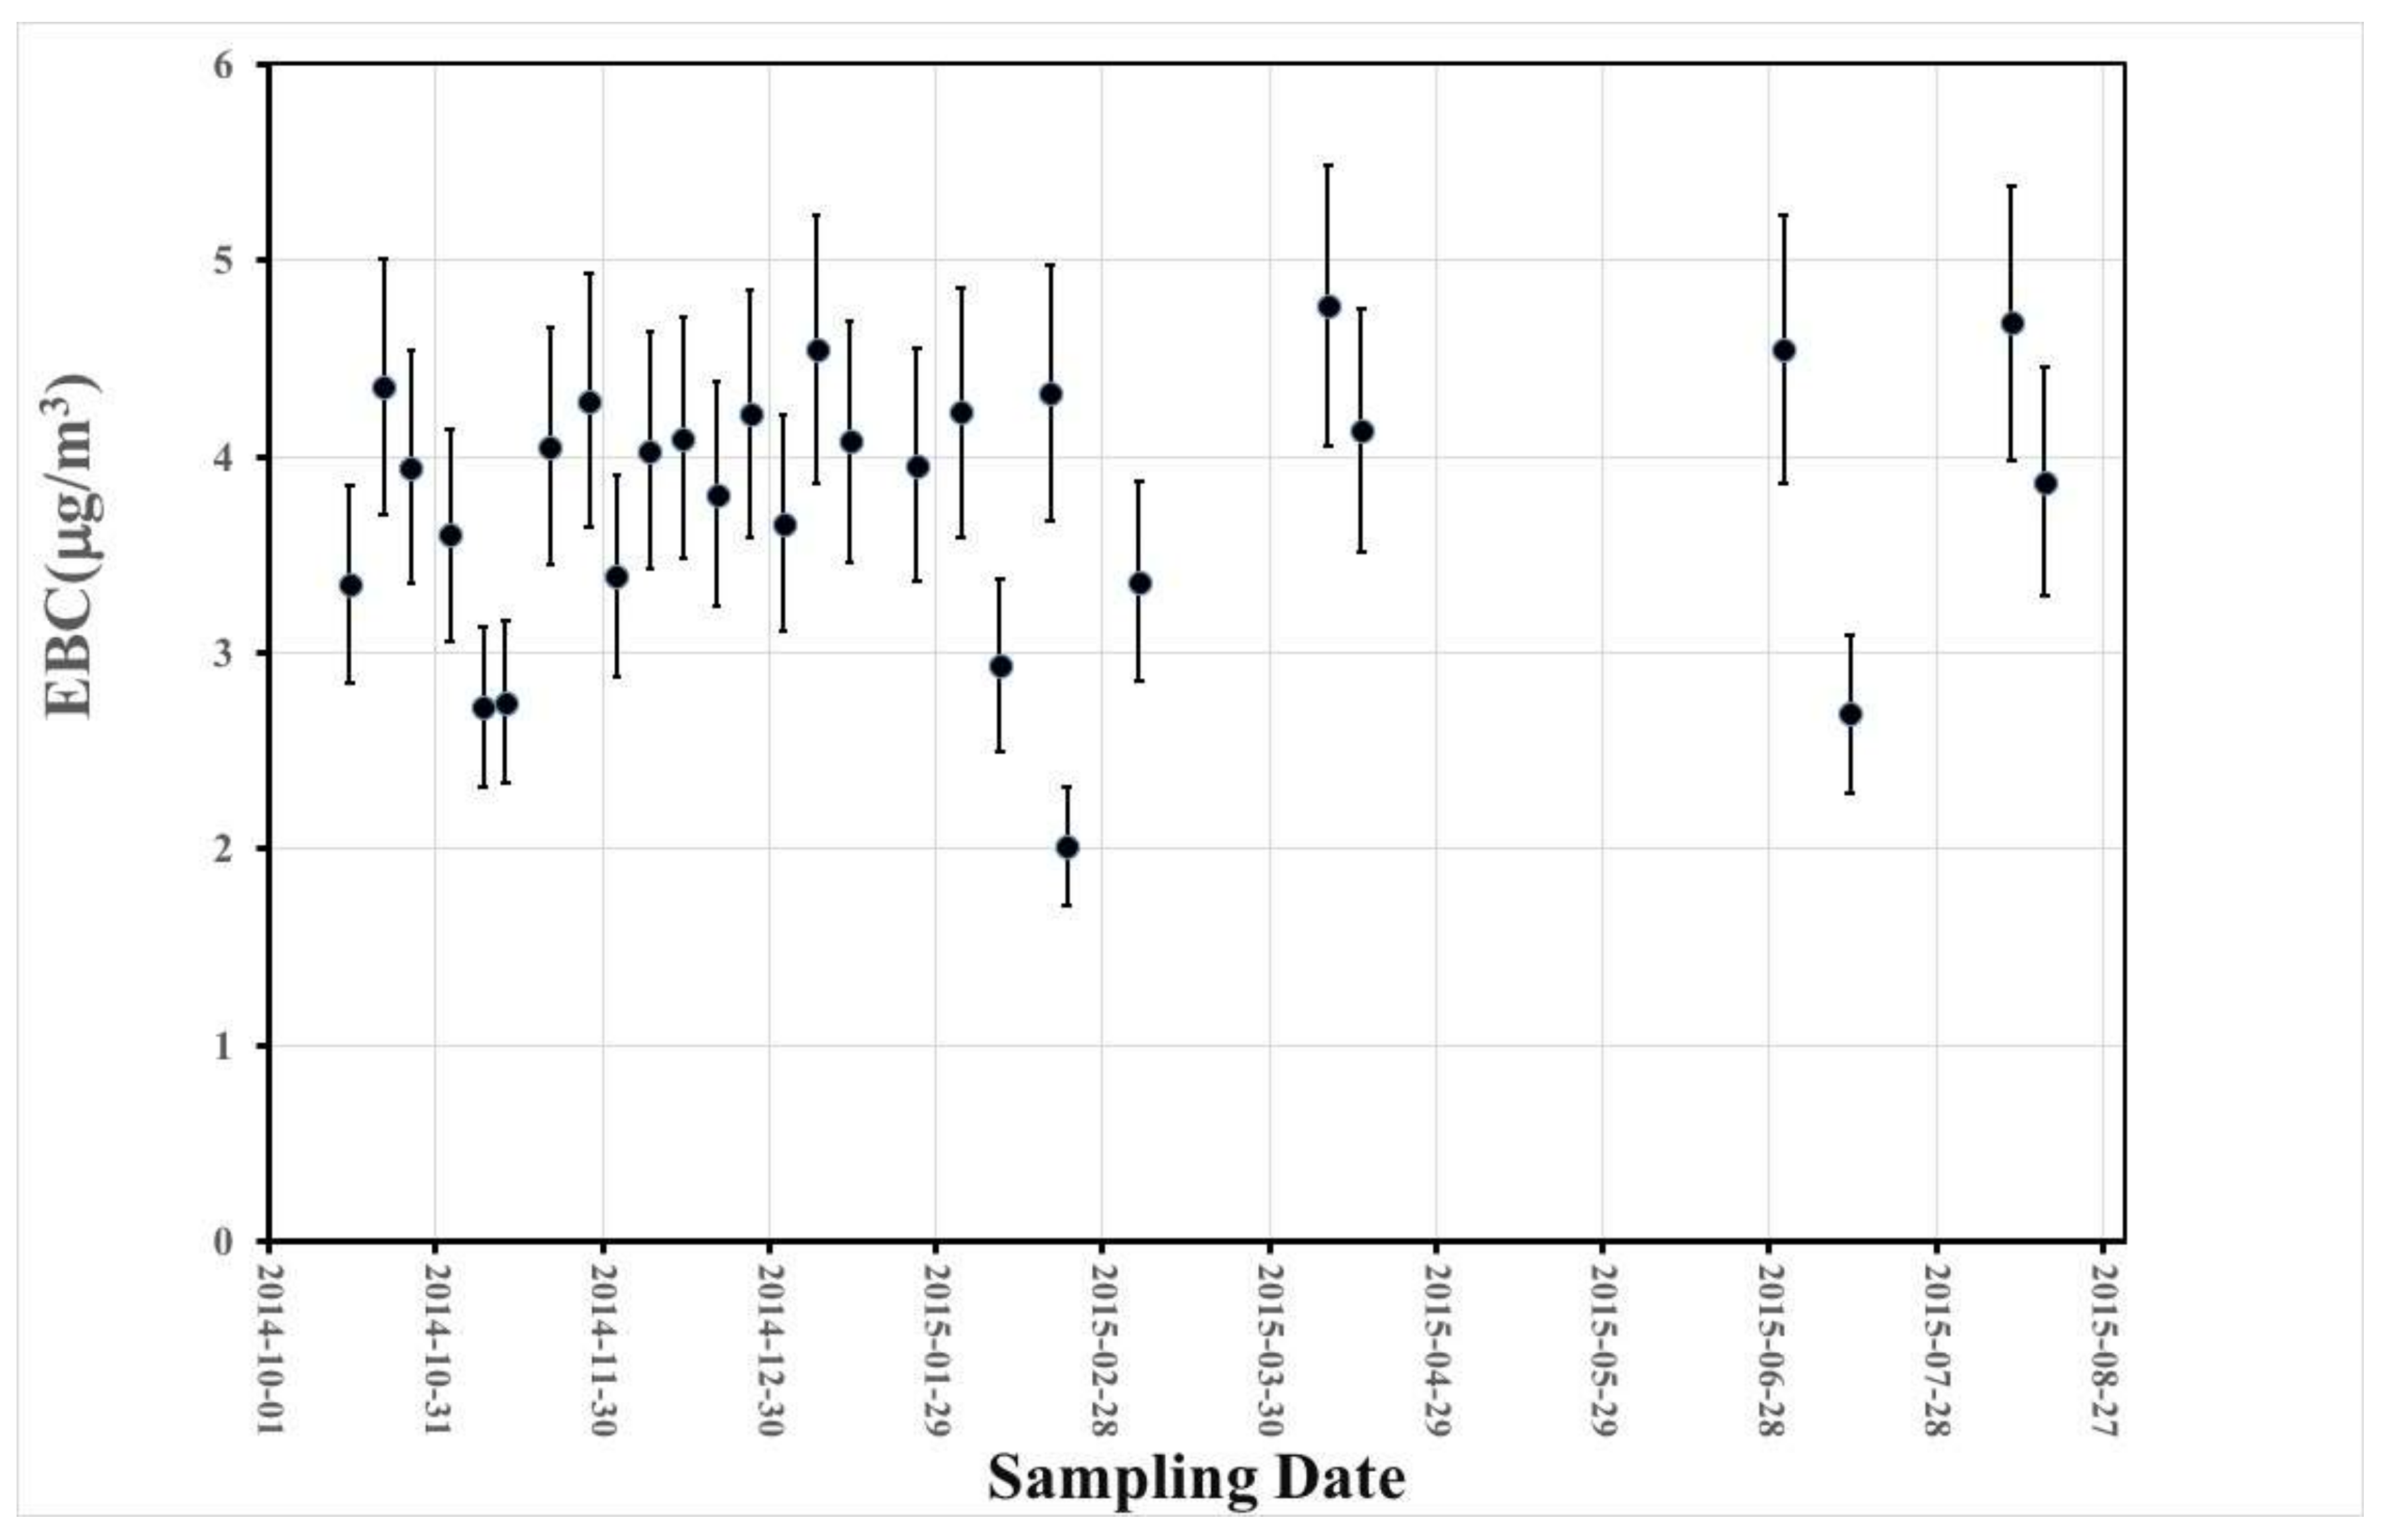
3.2. Equivalent Black Carbon (EBC) Measurements

In a recent review, Petzold et al. [33] recommended the use of the term EBC instead of black carbon (BC) for data derived from optical absorption methods, together with a suitable mass absorption coefficient (MAC) for the conversion of light absorption coefficient into airborne mass concentration. The amount of EBC represents an important component of fine PM and requires quantification [34]. We used smoke stain reflectivity to estimate the EBC on different sampling days.
The amount of EBC in µg cm−2 is calculated using the following equation [34]:
EBCR (μg cm−2) = {100/(2)} {4.61 − ln[%R]}.
EBCR represents the equivalent black carbon content in reflection mode (in μg cm−2); F is a correction factor (of order 1) to account for the sulfates, nitrates and other possible factors such as shadowing and filter loading that have been ignored, and it is assumed to be 1; ε is the mass absorption coefficient for a given wavelength in m2 g−1; and R is the white light reflectance. Cohen et al. [34] defined an equivalent, experimentally determined expression for EBCR using white light reflectance measurements on 47-mm diameter Nuclepore filters with ε = 5.27 m2 g−1 and F = 1.00. Since we are also using white light reflectance, we have used their values for both ε and F.
Figure 3 shows the airborne mass concentration of EBC in our samples calculated using Equation (2). The determined EBC varies between (2–4.7) µg m−3 during the sampling period, which represents between 10–12% of the total airborne mass concentration of the pollutants. The main source of EBC in the UAE is traffic and other transportation means such as ships and airplanes from the two nearby major airports. On clear days, the EBC concentration is usually above 3.5 µg m−3 up to about 4.8-µg m−3, while on dusty days it can be as low as 2 µg m−3. The EBC is made of carbonaceous particles, originating from incomplete combustions of hydrocarbon fuel, which can also be referred to as “soot” [35]. The amounts of EBC found here agree with those found in several regional cities in the Middle East [36]. The relatively low values of EBC are because the region does not have biomass burning or forest fires, which are the two other major sources of carbonaceous PM2.5 [22].
Statistical process control analysis was conducted for the EBC concentration values of the samples in Figure 4. This analysis shows that the process is within statistical control. Specifically, the process is well within 2* σ ^ of the mean of the values.

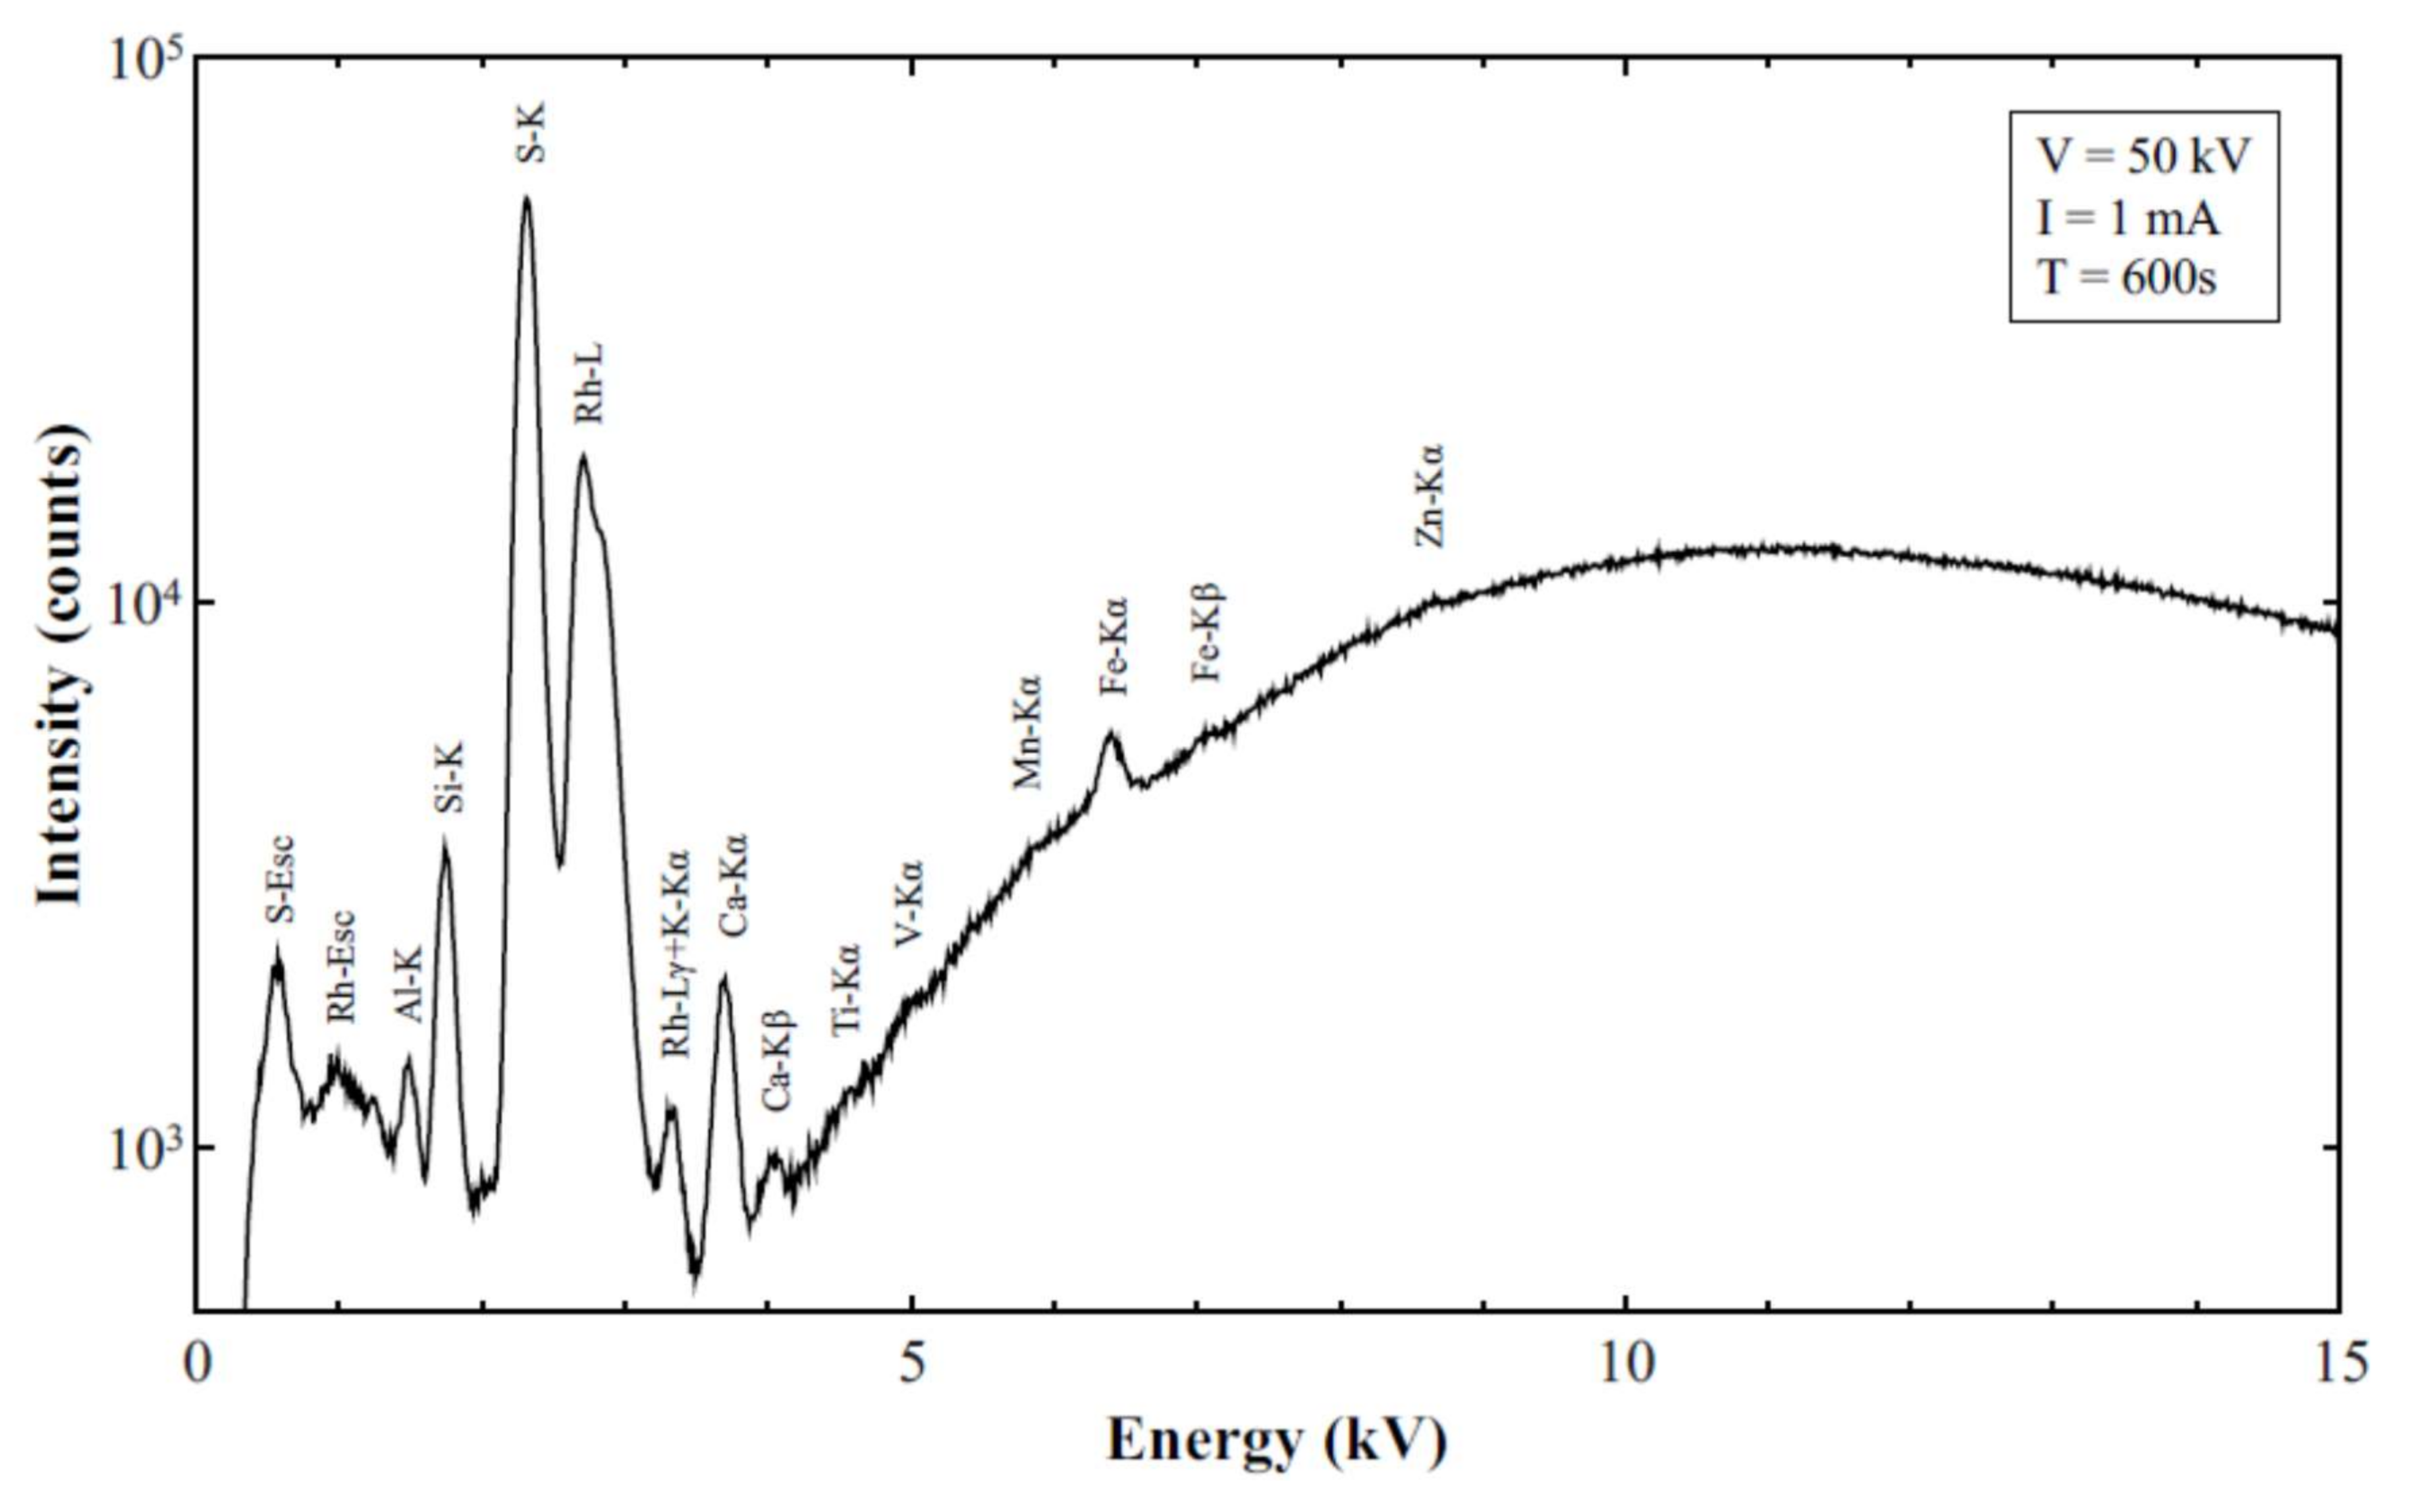
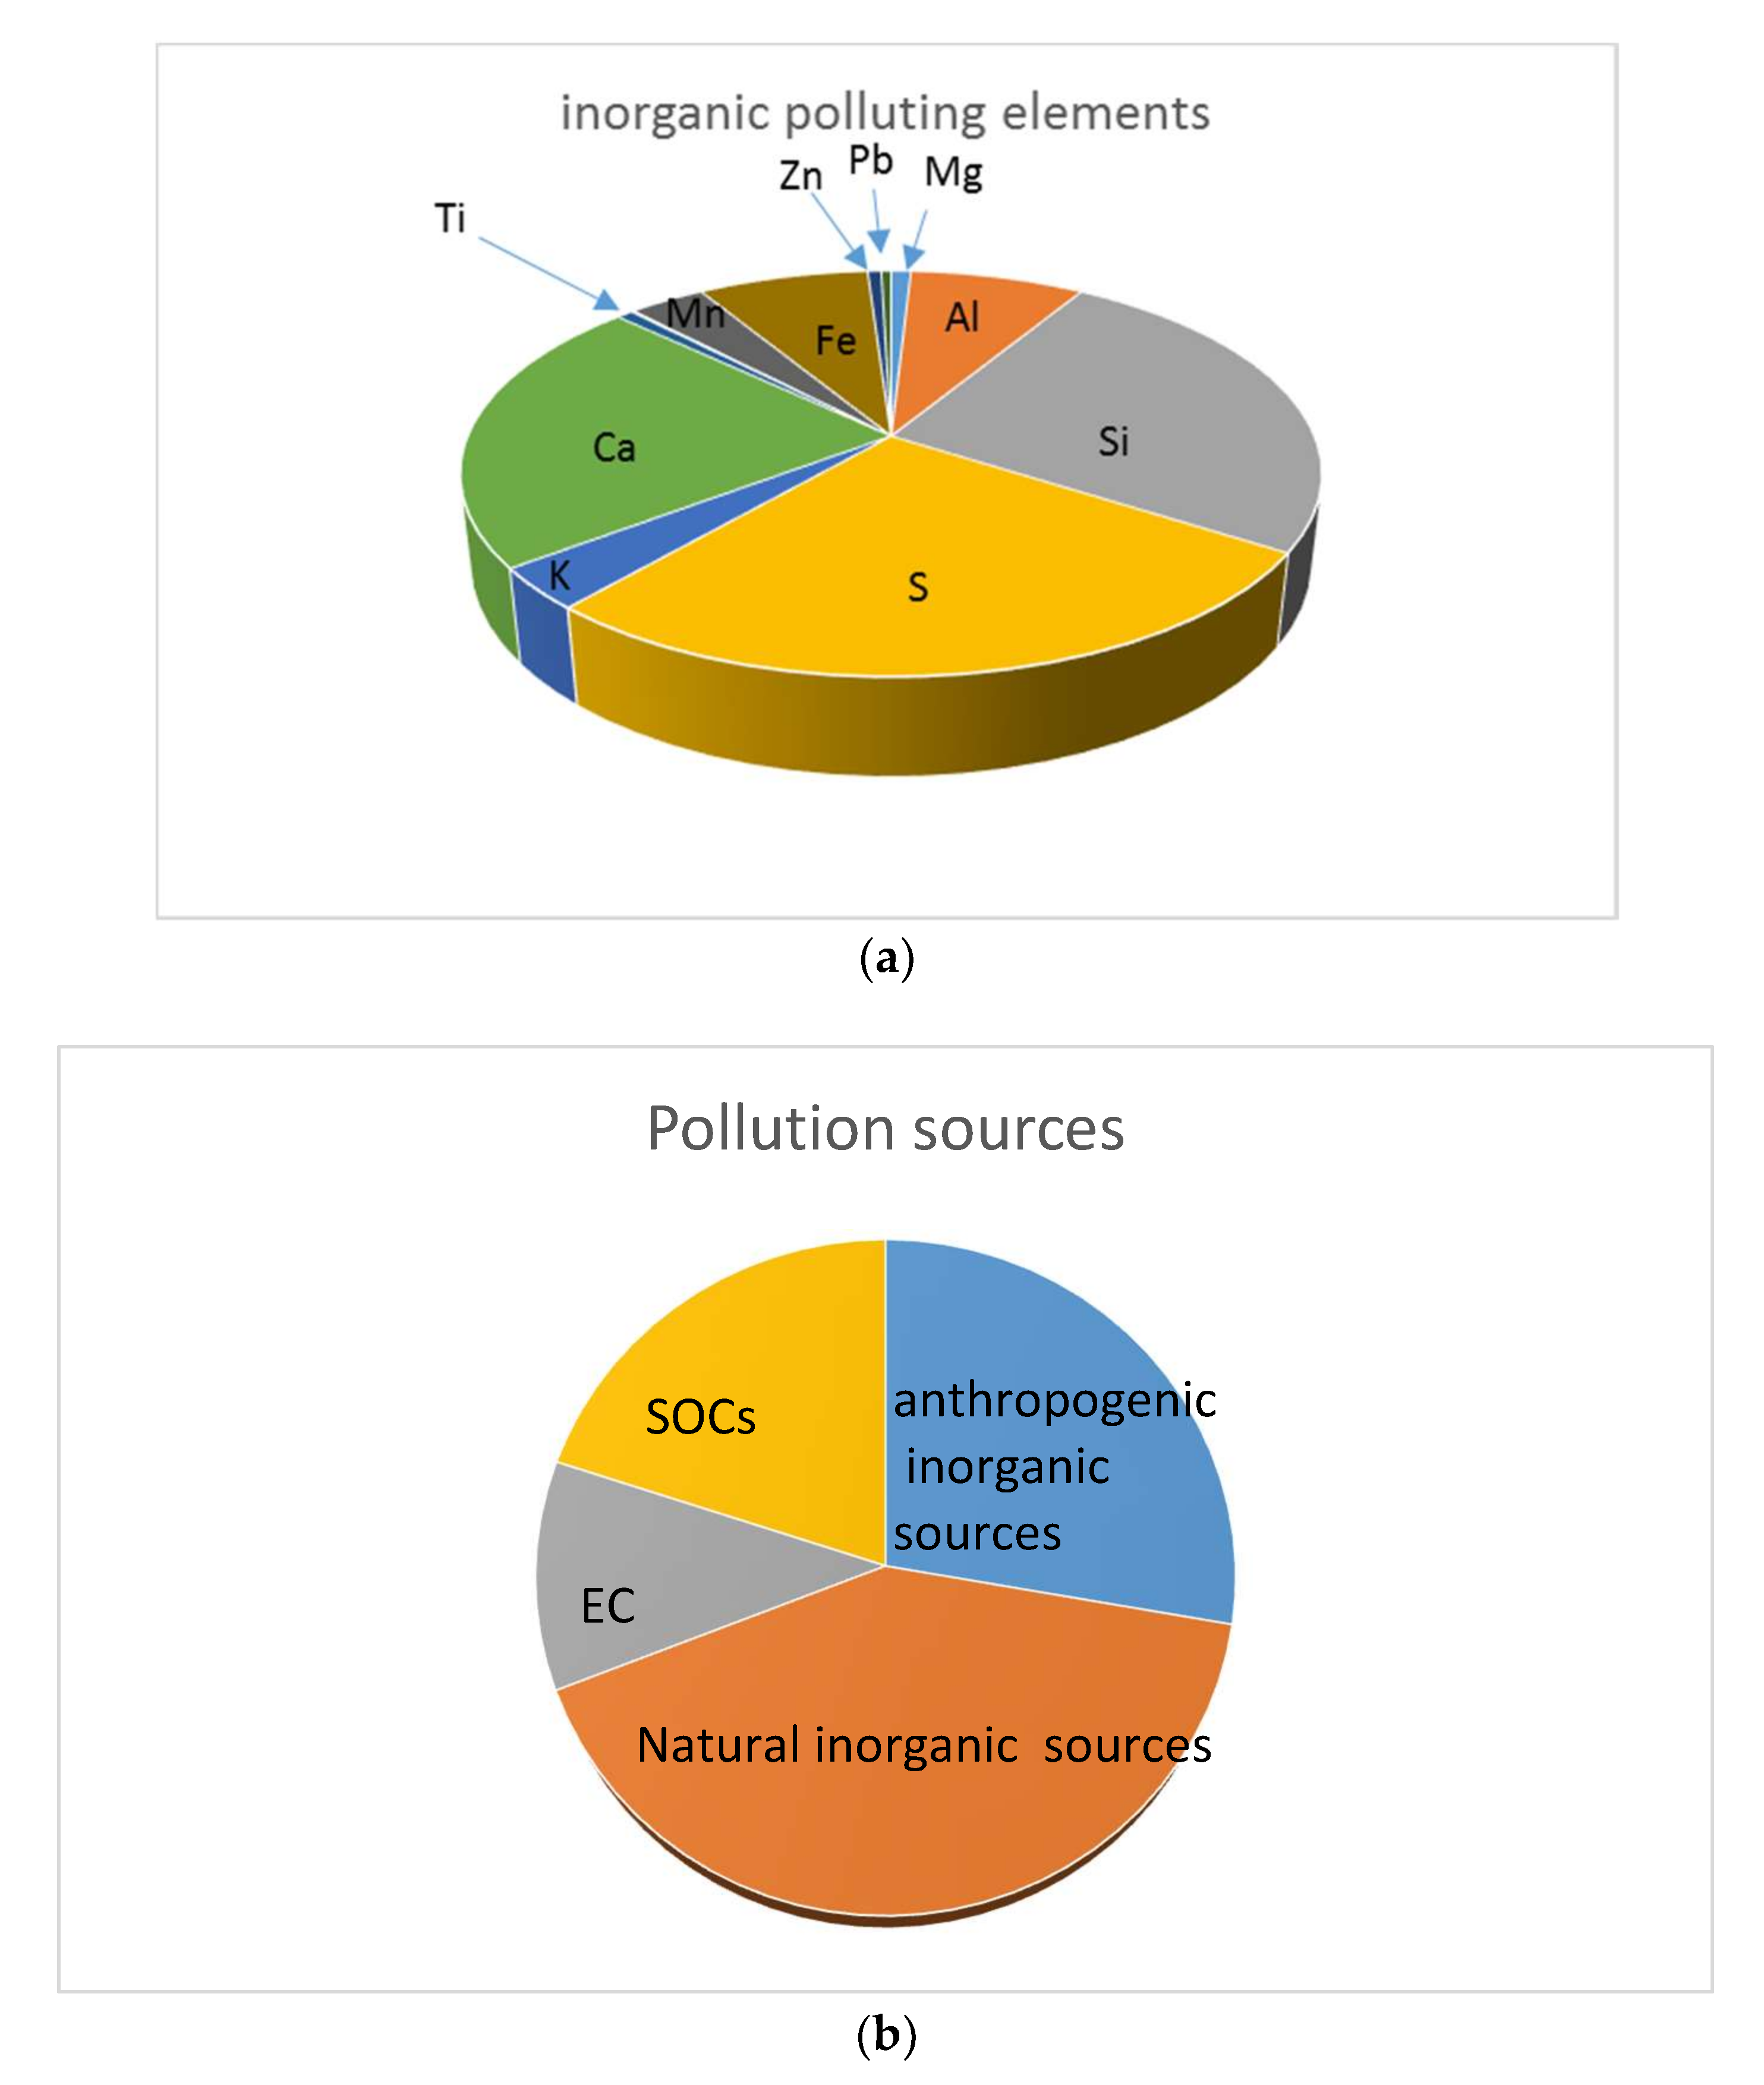
3.3. XRF Results and Analysis

Typical XRF scans are shown in Figure 5 and Figure 6, which also display the scan parameter. Figure 5 shows the XRF spectrum for sample 31 that was collected on 8 November 2014, when the region was experiencing a haboob dust storm. It shows that elements originating from natural sources (Si, Ca, Fe, Al, Fe, K, Mg, and Ti) are dominant. The S peak is weaker than the major natural elements such as Si and Ca, considering the logarithmic intensity scale. These results are consistent with gravimetric results where the amount of PM2.5 on that day was among the highest (about 63 µg m−3). The only elements from anthropogenic sources visible in the spectrum are S and Mn.
Figure 6 shows an XRF spectrum for filter No. 40 sampled on 7 January 2015, which was a clear day in Sharjah. Unlike sample 31 above, Figure 6 shows that S is the dominant element, with its intensity more than an order of magnitude higher than those of Si and Ca. Figure 5 and Figure 6 show that elemental concentrations vary from sample to sample depending on the meteorological conditions and dust events. Samples collected during clear days will have more S and elements originating from anthropogenic sources such as V and Zn compared with samples collected during a dust event.
Figure 7a shows the average distribution of the airborne mass concentration in µg m−3 for the major inorganic elements obtained by XRF. Despite being an average over all of the sampling days, Figure 7a shows that sulfur (mainly from sulfates) is the major pollutant in the fine fraction of PM, followed by elements from natural sources such as Ca and Si. Traces of other anthropogenic elements are also shown.
Detailed investigations of the elemental concentrations on various days reveal correlations among various elements, as shown in Table 1. It is clear that there is a strong correlation (0.8–0.9) among Mg, Al, Si, K, Ca, Mn, and Fe, indicating that they are coming mainly from natural sources (e.g., dust storms, sea salts, or crustal materials). S, V, Zn, and Pb show poor correlations with the elements from natural sources, indicating that they are mainly from anthropogenic sources. For Ti, the correlation with elements from natural sources is about (~0.5), indicating that it can come from both natural and anthropogenic sources, such as the resuspension of dust from traffic [8,37,38]. The only correlation between elements from anthropogenic sources that can be seen in this table is the one between V and S (~0.5). S is originating from fossil fuel burning in the traffic-induced resuspension of dust and energy power plants, while V is due to fuel and oil combustion in refineries and power plants [39]. Therefore, the correlation between these two elements shows that S and V have some common sources, while S is also due to traffic emissions.
Several major, minor, and trace elements are from the earth’s crustal materials, but secondary organic compounds (SOCs), EBC, Fe, Si, and Ca could also be traffic-related products (e.g., brake wear and road surface wear [37]). The elemental increase due to road dust depends on the materials from which the road surfaces are made. For example, it was found that Fe content is enhanced due to traffic abrasion products in the United Kingdom (UK), while in Denmark, Ca content was enhanced due to the type of road surface material [37,40,41]. Many back roads in Sharjah are unpaved and cause the enhancement of Si, Al, and Fe content in the PM2.5 fraction. As it is surrounded by desert, the sand in Sharjah—which is rich in quartz—contributes significantly to road surface resuspension.
Pb did not correlate with any other element except for a slight correlation with Zn (~0.2). The average Pb concentration was found to be 0.08 µg m−3, which is well below the US-EPA and WHO limits of 1.5 µg m−3 and 0.5 µg m−3, respectively. We note that on 14 December 2014, the amount of Pb was six times higher than the average Pb content for the sampling period.
We assumed that inorganic compounds exist either as oxides, nitrates, or sulfates, and estimated the average contribution of natural sources to be about 40%, while the average contribution of secondary inorganic compounds to be about 27% of the total airborne mass load on the filters. The EBC contribution that was calculated from Equation (2) is about 11%. The remaining 22% is assumed to be due to SOCs. These results are presented in Figure 7b. The contribution of various sources can vary significantly between dusty days and clear days. On clear days, ammonium sulfate and secondary compounds are the major sources, while the contribution due to natural sources (Si, Ca, Al, Fe, Mg, and K) can reach more than 70% of airborne PM2.5 mass concentrations during dust events.

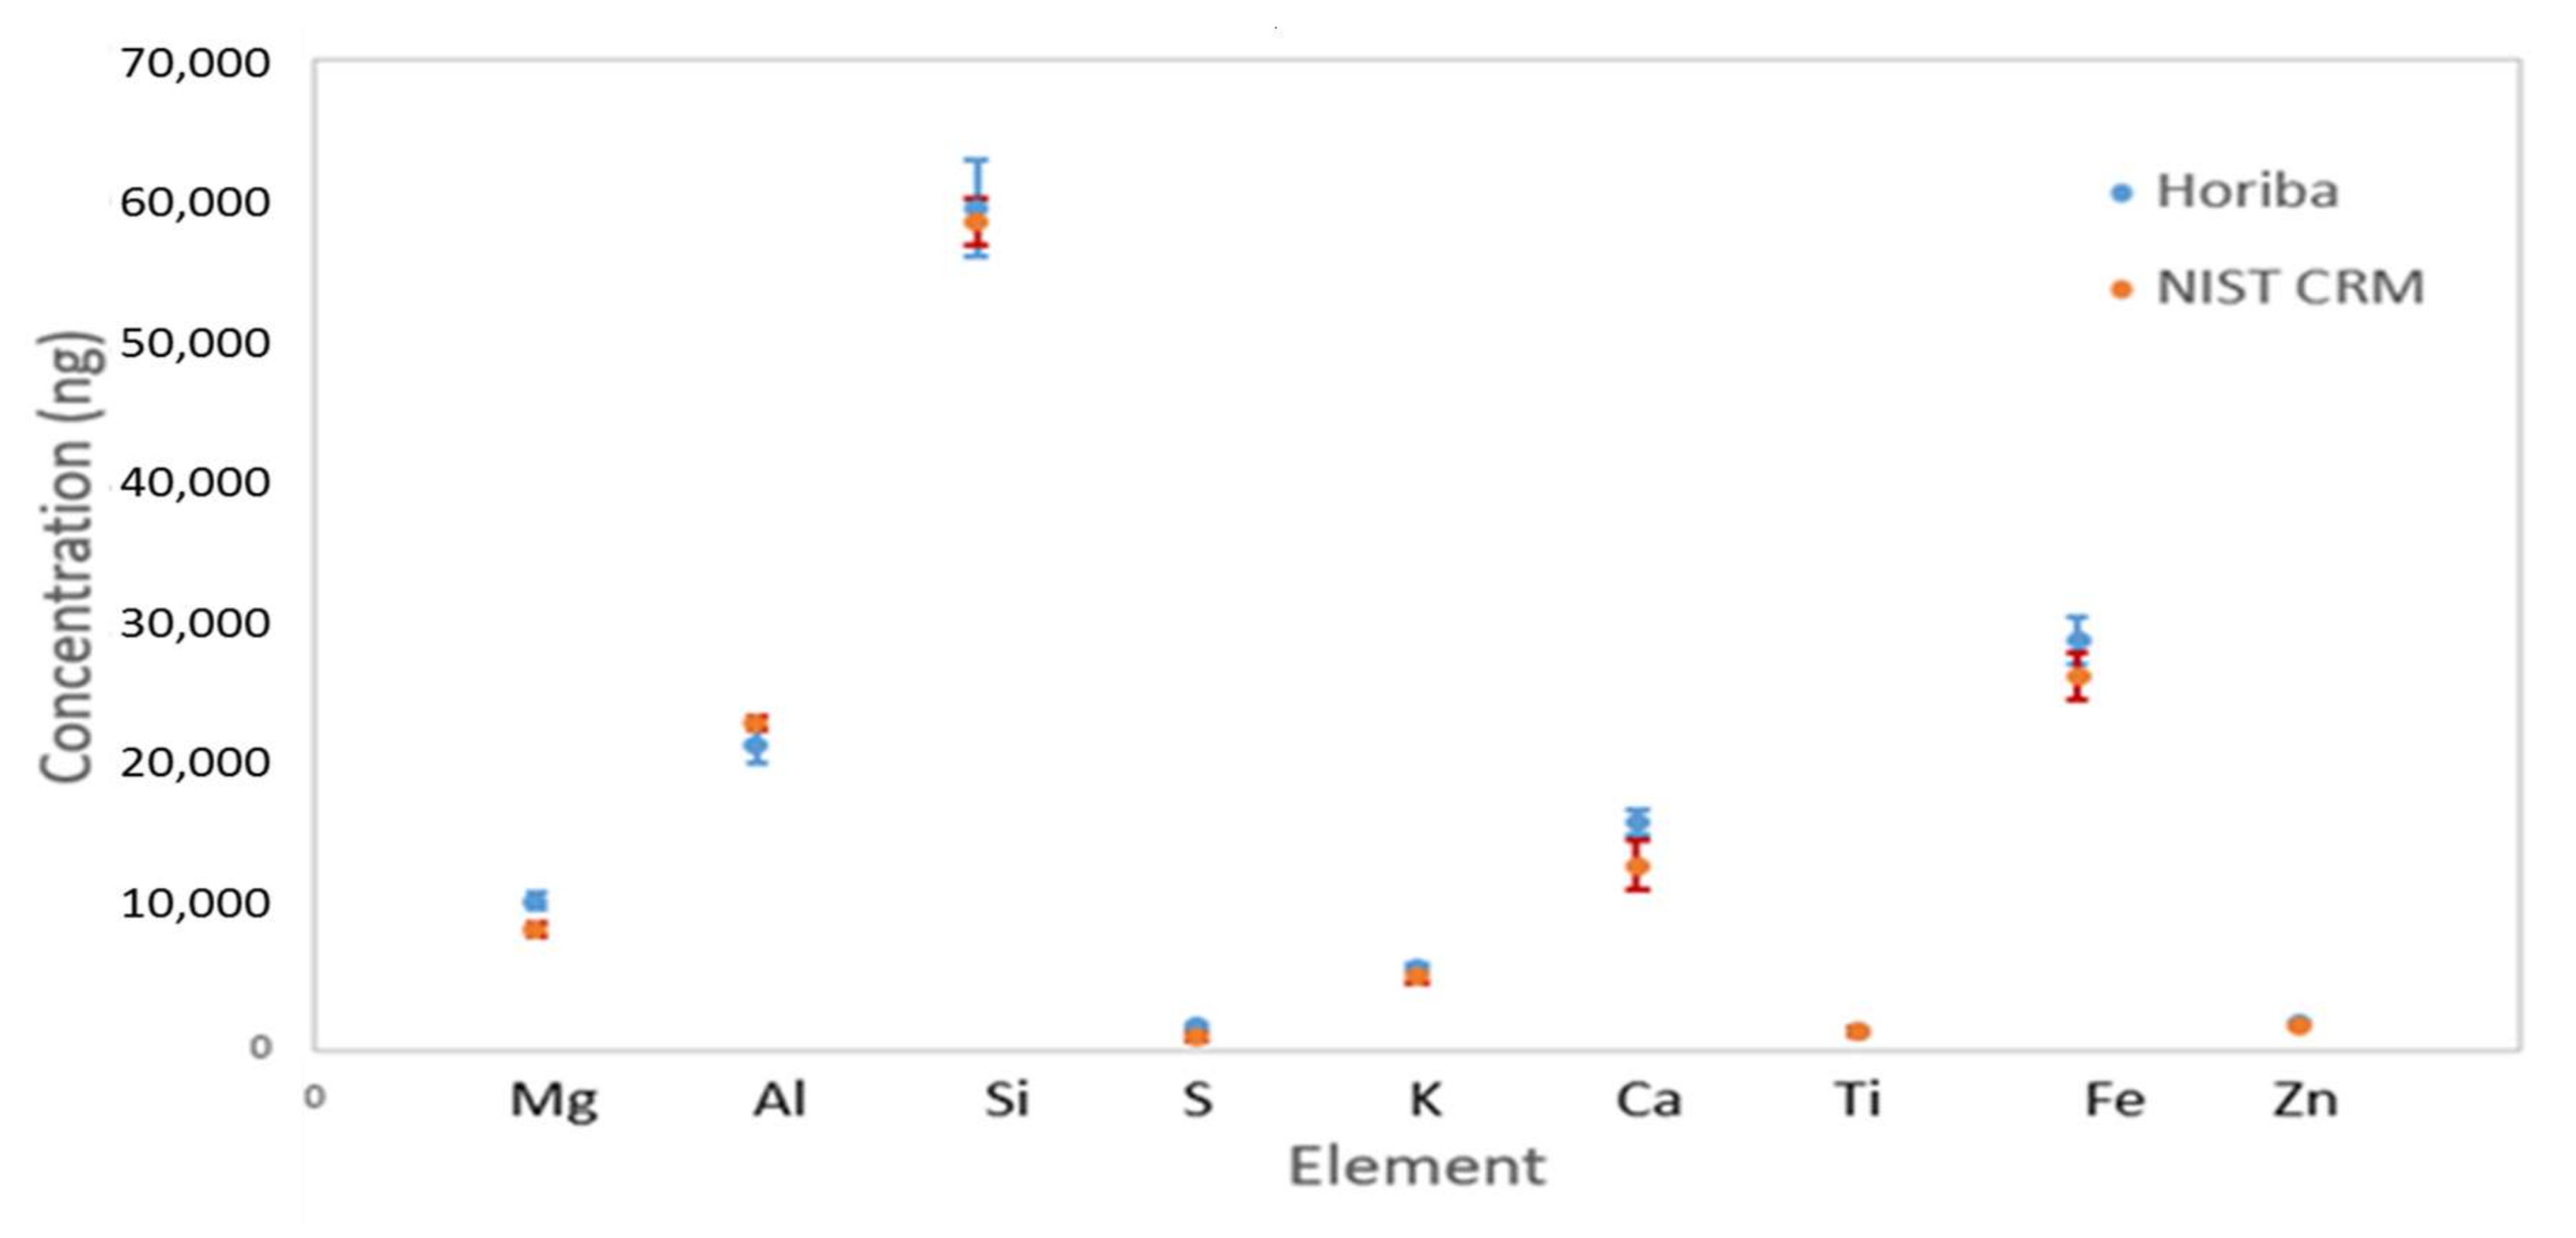
Quality Assurance and Control

Figure 8 shows the results of the analysis obtained from our procedures and the National Institute of Standards and Technology (NIST) certified values for the same elements measured with our Horiba XGT 7200. The figure includes elements with loading values above the detection limits of the analytical method. The figure shows good agreement between the certified NIST values and the measured values with our Horiba machine. We have followed the same calibration procedures for the NIST 2738 standard reference material as for our samples, as mentioned earlier.

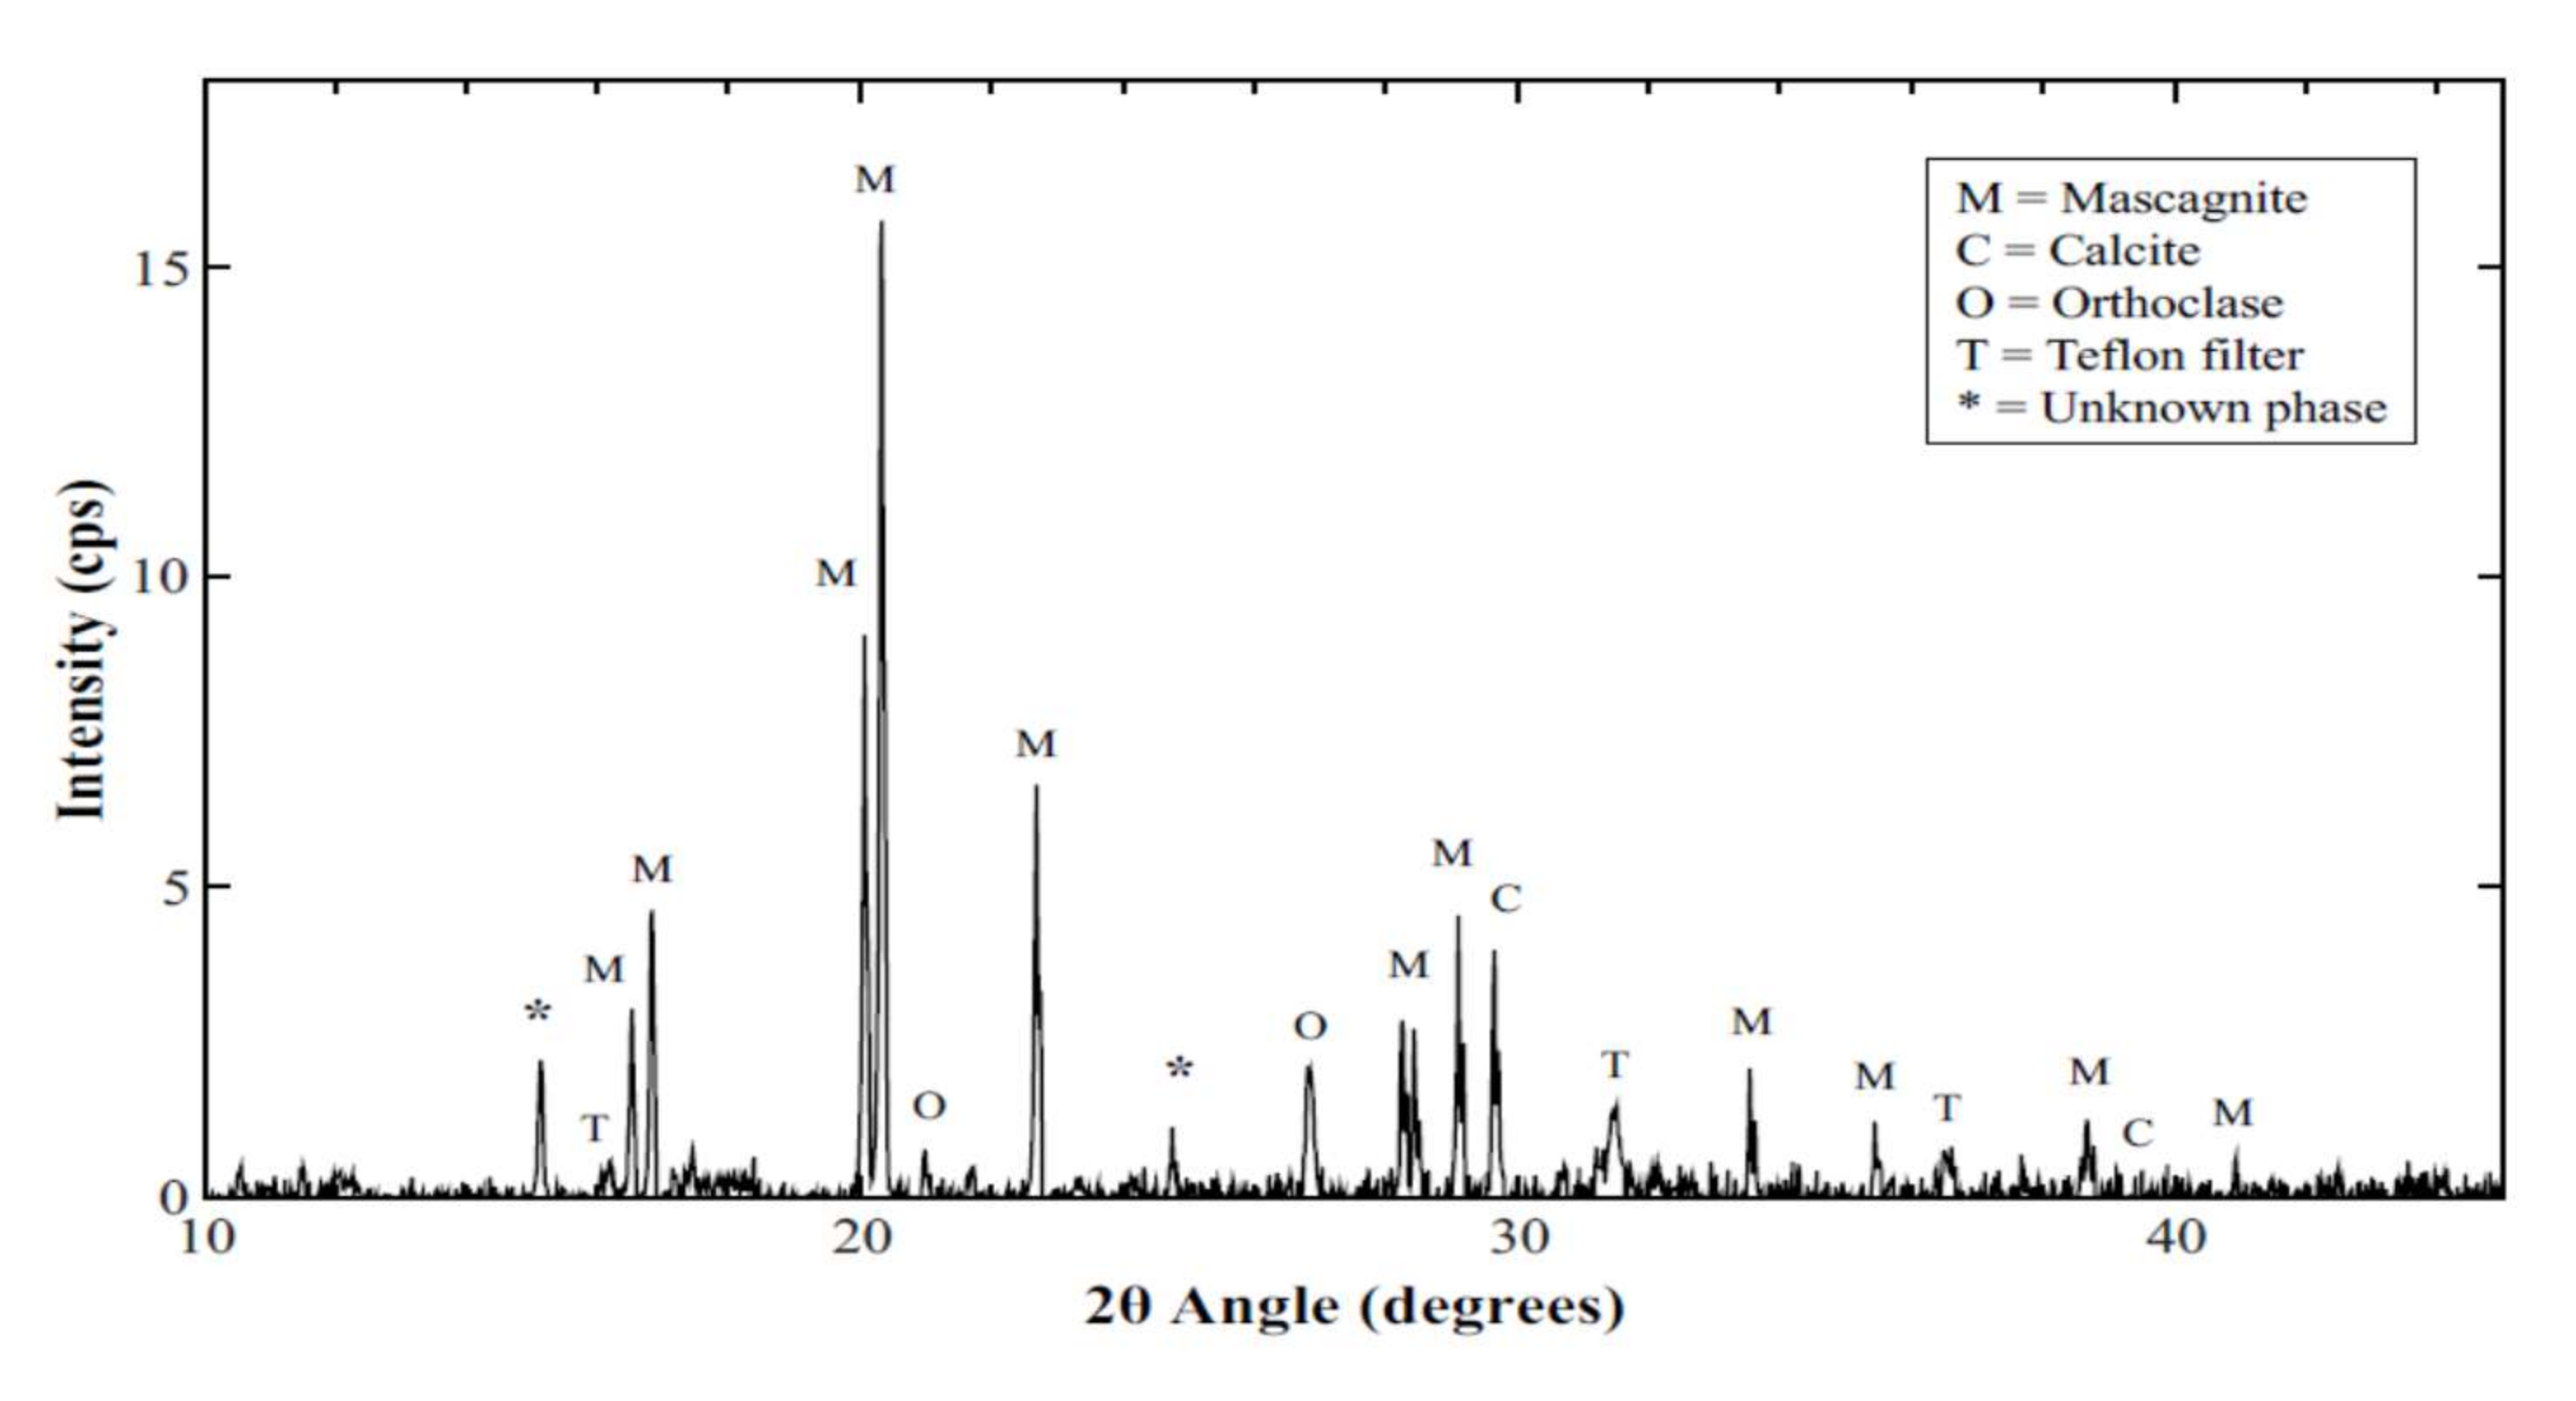
3.4. XRD Results and Analysis

Figure 9 shows the X-ray diffraction (XRD) pattern for sample 40. The main compound present in this sample is ammonium sulfate ((NH4)2SO4), which is known as mascagnite. Other minor compounds present are calcite (CaCO3) and orthoclase (KAlSi3O8). The major compound, ammonium sulfate, is a secondary compound that forms through the reaction of the primary pollutants during transport in the atmosphere. Natural and anthropogenic primary pollutants interact during transport to form new compounds: the so-called “secondary pollutants”. For example, SO2 and NO2 are the main emissions of fossil fuel burning that interact with hydroxide, oxygen, and humidity to form nitrates and sulfates with particulates of very fine sizes. A number of new compounds can also be formed because of the interaction of quartz (from desert sand) and calcite (from building materials) with sea salts and SO2 [19,24]. Due to elevated relative humidity, which could reach above 90%, some pollutants are hydrolyzed or partially hydrolyzed, despite having low rainfall levels [1]. The interaction of natural and anthropogenic emissions and the high levels of humidity and temperatures favor the formation of sulfates over nitrates [42].
With the elevated temperatures, abundance of sunshine, and high relative humidity [19], oxidation of the SO2 gas phase by hydroxyl radical (OH) produces sulfuric acid (H2SO4). Sulfuric acid then interacts with ammonia (NH3) to form the ammonium sulfates fine particulates [2NH3 + H2SO4 → (NH4)2SO4]. SO2 gas ends up in the atmosphere either as an acid (causing acid rain), as ammonium sulfate ((NH4)2SO4), or ammonium bisulfate (NH)4HSO4, depending on the amount of ammonia in the atmosphere [43]. Our XRD and SEM/EDS maps show that on most clear days, conditions are suitable for the formation of ammonium sulfate. Therefore, chemical speciation of PM is essential to understanding the reaction and interaction mechanisms of primary natural and anthropogenic pollutants during their transport. These secondary compounds can modify the toxicity of the original primary pollutants.
Figure 10 represents the XRD pattern for sample 47, which consists mainly of natural pollutants that originated in a severe dust storm. The main compounds in this sample are calcite, quartz, and gypsum, in addition to two other minor compounds. These compounds are primary pollutants that are carried with wind to urban areas. Unlike the case of sample 40 above, the sulfur in this sample is mainly due to gypsum rather than ammonium sulfate. This may not indicate that there are no anthropogenic emissions, but the conditions may have not been suitable for the formation of ammonium sulfate from SO2 and NH3. It may also indicate that, because of the high concentration of natural emissions, calcite, quartz, and gypsum existed in very large amounts, and therefore other pollutants are not detected.
Figure 11 shows the XRD pattern of sample 31. As is the case for sample 47 above, natural pollutants are dominant in this sample. This sample has a higher quartz content than sample 47 above. Quartz originates from large desert areas that surround major cities in the UAE, including the sampling site in Sharjah. XRD results agree with the elemental analysis of the XRF results above. Due to the strong correlation among natural constituents, it is difficult to identify various anthropogenic pollution sources during dust events. The results also show the need to carry out a more extensive investigation with quantitative analysis for PM2.5 in the whole region in order to understand the reaction mechanism of pollutants and identify pollution sources.

3.5. SEM/EDS Analysis

SEM imaging and energy dispersive x-ray spectroscopy (EDS) elemental mappings were performed on several samples. We present here the results of the analysis of two samples: one collected on a dusty day (sample 31), and the other (sample 40) on a clear day. Figure 12 shows the elemental maps for sample 31, which illustrates the presence of Ca, Fe, Al, Mg, K, S, Ti, C, and O. The maps show good correlation between Si and O, confirming the presence of quartz, as shown by XRD above. Furthermore, there is a clear correlation between Ca and S, confirming the presence of gypsum (CaSO4·2H2O), which was also observed in the XRD pattern. The lack of a nitrogen signature in the maps confirms the absence of ammonium sulfate in this sample.
The formation of ammonium sulfate is directly related to both the ambient temperatures and relative humidity [19]. This sample was collected on 8 November 2014 on a windy day, as evident in the large amount of pollutants (63 µg m−3) and from the low EBC content (2.7 µg m−3). The conditions of moderate temperatures and low humidity are less suitable for the formation of ammonium sulfate. Ammonium sulfate forms as a very fine particles (less than 0.5 µm in size) [19], which can be transported long distances with the wind. Therefore, not all of the measured amounts of ammonium sulfate are of local origin.
Figure 12 also shows that Na and Cl maps correlate strongly when one focuses on a single particle, indicating the presence of an NaCl crystal. Na, Cl, Mg, and K originate from sea salts that are transported with the sea breeze from the gulf, about 10 km away from the sampling site.
Figure 13 shows SEM and EDS maps for sample 40. The sample was collected on a very clear day. XRF results above have shown that S is the major inorganic element present, and XRD has shown that ammonium sulfate was the main inorganic constituent of the sample. Most of the inorganic compounds existing in this sample are secondary compounds that are formed during the interaction of various pollutants during transport in the atmosphere.

4. Conclusions

PM2.5 was sampled weekly, over a period of 10 months, using standard protocols on 47-mm Teflon filters [44]. The filters were analyzed by combining several complementary techniques that provided a comprehensive understanding of the elemental and chemical composition of PM2.5. Gravimetric analysis revealed that the amount of PM2.5 pollution in the city of Sharjah is below international limits except on days that involved dust storms. Smoke-stain measurements show that EBC constitutes about 11% of the total mass of the PM2.5, with concentrations varying between 2–4.7 µg m−3. Statistical control analysis shows that both the gravimetric and EBC results are within a confidence level of 2*σ. XRF, XRD, and SEM/EDS results show that anthropogenic pollutants are dominant on samples collected on clear days, with ammonium sulfate as the major compound. Minor compounds originating from natural sources are also present in these samples. Other anthropogenic elements originating from traffic and industrial emissions such as Z, V, and Mn were also identified. The main elements originating from natural sources identified by XRF and SEM are Ca, Si, Al, Fe, K, Na, Ti, and Mg. XRD results show that calcite, quartz, and gypsum are the major compounds in the samples that were collected on less clear days. SEM/EDS elemental mapping have shown small amounts of sea salts such as NaCl. In summary, our results reveal that about 40% of the total mass concentration of PM2.5 is originating from natural inorganic sources, 11% is EBC, the secondary organic compounds contribution is about 27%, and the remaining 22% is assumed to be secondary organic compounds. We are currently working on a comprehensive aerosol project utilizing single stage samplers with more frequent sampling protocols. Source apportionment analysis will be performed on the measurement results utilizing the positive matrix factorization method (PMF).

Supplementary Materials

The following are available online at https://www.mdpi.com/2071-1050/10/4/1088/s1, Table S1: Sampling dates and weather conditions; Table S2: Elemental concentrations, gravimetric data and EBC.

Acknowledgments

N.M.H. acknowledges the support of AUS through FRG grants. He also acknowledges the support of IAEA in Vienna through projects RAS0072 and RAS0076. We acknowledge the support of the Center for Advanced Materials Research and the University of Sharjah under project No. 16020143026-P.

Author Contributions

N.M.H. designed the sampling protocol, performed the sampling campaign, gravimetric analysis and EBC measurements; H.A. did the XRD measurements and analysis; N.J. participated in XRF measurements and analysis, M.S. performed XRF and SEM/EDS experiments and analysis. N.M.H., H.A. and N.J. participated in analyzing, writing and revising the manuscript.

Conflicts of Interest

The authors report no conflicts of interest. The authors alone are responsible for the content and writing of the paper.

References

  1. “Climate Yearly Report 2003–2016”, NCMS2017. Available online: http://www.ncms.ae/en/climate-reports-yearly.html?id=26 (accessed on 19 July 2017).
  2. “Air Quality and Atmospheric Pollution, In the Arab Region”, UNEP2014. Available online: http://www.un.org/esa/sustdev/csd/csd14/escwaRIM_bp1.pdf (accessed on 22 July 2017).
  3. Anderson, J.O.; Thundiyil, J.G.; Stolbach, A. Clearing the air: A review of the effects of particulate matter air pollution on human health. J. Med. Toxicol. 2012, 8, 166–175. [Google Scholar] [CrossRef] [PubMed]
  4. Al Katheeri, E.; Al Jallad, F.; Al Omar, M. Assessment of gaseous and particulate pollutants in the ambient air in Al Mirfa City, United Arab Emirates. J. Environ. Prot. 2012, 3, 640. [Google Scholar] [CrossRef]
  5. Sundvor, I.; Balaguer, N.; Mar Viana, X.; Reche, C.; Amato, F.; Mellios, G. Road traffic’s contribution to air quality in European cities. In ETC/ACM Technical Paper; European Economic Area (EEA): Bilthoven, The Netherlands, 2012; Volume 14, p. 74. [Google Scholar]
  6. Birch, M.; Cary, R. Elemental carbon-based method for monitoring occupational exposures to particulate diesel exhaust. Aerosol Sci. Technol. 1996, 25, 221–241. [Google Scholar] [CrossRef]
  7. Young, L.H.; Liou, Y.J.; Cheng, M.T.; Lu, J.H.; Yang, H.H.; Tsai, Y.I.; Wang, L.C.; Chen, C.B.; Lai, J.S. Effects of biodiesel, engine load and diesel particulate filter on nonvolatile particle number size distributions in heavy-duty diesel engine exhaust. J. Hazard. Mater. 2012, 199, 282–289. [Google Scholar] [CrossRef] [PubMed]
  8. Li, Y.; Gibson, J.M.; Jat, P.; Puggioni, G.; Hasan, M.; West, J.J.; Vizuete, W.; Sexton, K.; Serre, M. Burden of disease attributed to anthropogenic air pollution in the United Arab Emirates: Estimates based on observed air quality data. Sci. Total Environ. 2010, 408, 5784–5793. [Google Scholar] [CrossRef] [PubMed]
  9. Bener, A.; Dogan, M.; Ehlayel, M.; Shanks, N.; Sabbah, A. The impact of air pollution on hospital admission for respiratory and cardiovascular diseases in an oil and gas-rich country. Eur. Ann. Allergy Clin. Immunol. 2009, 41, 80–84. [Google Scholar] [PubMed]
  10. Gibson, J.M.; Farah, Z.S. Environmental risks to public health in the United Arab Emirates: A quantitative assessment and strategic plan. Environ. Health Perspect. 2012, 120, 681–686. [Google Scholar] [CrossRef] [PubMed]
  11. Gibson, J.M.; Thomsen, J.; Launay, F.; Harder, E.; DeFelice, N. Deaths and medical visits attributable to environmental pollution in the United Arab Emirates. PLoS ONE 2013, 8, e57536. [Google Scholar]
  12. Hochstetler, H.A.; Yermakov, M.; Reponen, T.; Ryan, P.H.; Grinshpun, S.A. Aerosol particles generated by diesel-powered school buses at urban schools as a source of children’s exposure. Atmos. Environ. 2011, 45, 1444–1453. [Google Scholar] [CrossRef] [PubMed]
  13. Miller, K.A.; Siscovick, D.S.; Sheppard, L.; Shepherd, K.; Sullivan, J.H.; Anderson, G.L.; Kaufman, J.D. Long-term exposure to air pollution and incidence of cardiovascular events in women. N. Engl. J. Med. 2007, 356, 447–458. [Google Scholar] [CrossRef] [PubMed]
  14. Yeatts, K.B.; El-Sadig, M.; Leith, D.; Kalsbeek, W.; Al-Maskari, F.; Couper, D.; Funk, W.E.; Zoubeidi, T.; Chan, R.L.; Trent, C.B.; et al. Indoor air pollutants and health in the United Arab Emirates. Environ. Health Perspect. 2012, 120, 687–694. [Google Scholar] [CrossRef] [PubMed]
  15. The National Strategy and Action Plan for Environmental Health for the UAE, Abu Dhabi. EAD 2010. Available online: https://sph.unc.edu/files/2013/07/report.pdf (accessed on 19 July 2017).
  16. Health and Sustainable Development: Air Pollution. 2014. Available online: http://www.who.int/sustainable-development/cities/health-risks/air-pollution/en/ (accessed on 12 February 2018).
  17. Seven Million Premature Deaths Annually Linked to Air Pollution. Available online: http://www.who.int/mediacentre/news/releases/2014/air-pollution/en/ (accessed on 18 July 2017).
  18. Wong, C.M.; Tsang, H.; Lai, H.K.; Thomas, G.N.; Lam, K.B.; Chan, K.P.; Zheng, Q.; Ayres, J.G.; Lee, S.Y.; Lam, T.H.; et al. Cancer mortality risks from long-term exposure to ambient fine particle. Cancer Epidemiol. Biomark. Prev. 2016, 25, 839–845. [Google Scholar] [CrossRef] [PubMed]
  19. Hamdan, N.M.; Alawadhi, H.; Jisrawi, N.; Shameer, M. Size-resolved analysis of fine and ultrafine fractions of indoor particulate matter using energy dispersive X-ray fluorescence and electron microscopy. X-ray Spectrom. 2018, 47, 72–78. [Google Scholar] [CrossRef]
  20. Li, J.D.; Deng, Q.H.; Lu, C.; Huang, B.L. Chemical compositions and source apportionment of atmospheric PM 10 in suburban area of Changsha. China J. Cent. South Univ. Technol. 2010, 17, 509–515. [Google Scholar] [CrossRef]
  21. Engelbrecht, J.; McDonald, E.V.; Gillies, J.A.; Jayanty, R.; Casuccio, G.; Gertler, A.W. Characterizing mineral dusts and other aerosols from the Middle East—Part 1: Ambient sampling. Inhal. Toxicol. 2009, 21, 297–326. [Google Scholar] [CrossRef] [PubMed]
  22. Tsiouri, V.; Kakosimos, K.E.; Kumar, P.K. Concentrations, sources and exposure risks associated with particulate matter in the Middle East Area—A review. Air Qual. Atmos. Health 2015, 8, 67–80. [Google Scholar] [CrossRef]
  23. Hamdan, N.M.; Alawadhi, H.; Jisrawi, N. Particulate Matter Pollution in the United Arab Emirates: Elemental Analysis and Phase Identification of Fine Particulate Pollutants. In Proceedings of the 2nd World Congress on New technologies (New Tech’16), Budapest, Hungary, 18–19 August 2016. [Google Scholar]
  24. Hamdan, N.M.; Alawadhi, H.; Jisrawi, N. Elemental and Chemical Analysis of PM10 and PM2.5 Indoor and Outdoor Pollutants in the UAE. Int. J. Environ. Sci. Dev. 2015, 6, 566–570. [Google Scholar] [CrossRef]
  25. Schulze, G. Handling Manual. In Automation Engineering; International Society of Anti-Infective Pharmacology (ISAP): Berlin, Germany, 2014. [Google Scholar]
  26. NSAI Standard. Ambient Air-Standard Gravimetric Measurement Method for the Determination of the PM10 or PM2.5 Mass Concentration of Suspended Particulate Matter; German Version EN 12341; NSAI Standard: Brussels, Belgium, 2014. [Google Scholar]
  27. European Economic Area (EEA). Criteria for EUROAIRNET; European Economic Area (EEA): Bilthoven, The Netherlands, 1999. [Google Scholar]
  28. Standard, E. Ambient Air Quality-Standard Gravimetric Measurement Method for the Determination of the PM2.5; BSI: London, UK, 2005; p. 14907. [Google Scholar]
  29. Air Particulate on Filter Media. In Certificate of Analysis: Standard Reference Material 2783; National Institute of Standards and Technology (NIST): Gaithersburg, MD, USA, 2011.
  30. Air Quality Guidelines for Particulate Matter, Ozone, Nitrogen Dioxide and Sulfur Dioxide, Summary of Risk Assessments. WHO, 2005. Available online: http://apps.who.int/iris/bitstream/10665/69477/1/WHO_SDE_PHE_OEH_06.02_eng.pdf (accessed on 12 February 2018).
  31. Criteria Air Pollutants: NAAQS Table. 2017. Available online: https://www.epa.gov/criteria-air-pollutants/naaqs-table (accessed on 12 February 2018).
  32. Bersimis, S.; Psarakis, S.; Panaretos, J. Multivariate statistical process control charts: An overview. Qual. Reliab. Eng. Int. 2007, 23, 517–543. [Google Scholar] [CrossRef] [Green Version]
  33. Petzold, A.; Ogren, J.A.; Fiebig, M.; Laj, P.; Li, S.M.; Baltensperger, U.; Holzer-Popp, T.; Kinne, S.; Pappalardo, G.; Sugimoto, N.; et al. Recommendations for reporting “black carbon” measurements. Atmos. Chem. Phys. 2013, 13, 8365–8379. [Google Scholar] [CrossRef] [Green Version]
  34. Cohen, D.D.; Taha, G.; Stelcer, E.; Garton, D.; Box, G. The measurement and sources of fine particle elemental carbon at several key sites in NSW over the past eight years. In Proceedings of the 15th International Clean Air Conference, Sydney, Australia, 26–30 November 2000; pp. 485–490. [Google Scholar]
  35. Glassmane, I.; Yetter, R.A. Combustion, 4th ed.; Academic Press: Burlington, MA, USA, 2008. [Google Scholar]
  36. Sarnat, J.A.; Moise, T.; Shpund, J.; Liu, Y.; Pachon, J.E.; Qasrawi, R.; Abdeen, Z.; Brenner, S.; Nassar, K.; Saleh, R.; et al. Assessing the spatial and temporal variability of fine particulate matter components in Israeli, Jordanian, and Palestinian cities. Atmos. Environ. 2010, 44, 2383–2392. [Google Scholar] [CrossRef]
  37. Viana, M.; Kuhlbusch, T.A.J.; Querol, X.; Alastuey, A.; Harrison, R.M.; Hopke, P.K.; Winiwarter, W.; Vallius, M.; Szidat, S.; Prévôt, A.S.H.; et al. Source apportionment of particulate matter in Europe: A review of methods and results. J. Aerosol Sci. 2008, 39, 827–849. [Google Scholar] [CrossRef]
  38. Zhang, R.; Han, Z.; Cheng, T.; Tao, J. Chemical properties and origin of dust aerosols in Beijing during springtime. Particuology 2009, 7, 61–67. [Google Scholar] [CrossRef]
  39. Mazzei, F.; D’alessandro, A.; Lucarelli, F.; Nava, S.; Prati, P.; Valli, G.; Vecchi, R. Characterization of particulate matter sources in an urban environment. Sci. Total Environ. 2008, 401, 81–89. [Google Scholar] [CrossRef] [PubMed]
  40. Wåhlin, P.; Berkowicz, R.; Palmgren, F. Characterisation of traffic-generated particulate matter in Copenhagen. Atmos. Environ. 2006, 40, 2151–2159. [Google Scholar] [CrossRef]
  41. Harrison, R.M.; Jones, A.M.; Lawrence, R.G. Major component composition of PM10 and PM2.5 from roadside and urban background sites. Atmos. Environ. 2004, 38, 4531–4538. [Google Scholar] [CrossRef]
  42. Belis, C.; Karagulian, F.; Larsen, B.; Hopke, P.K. Critical review and meta-analysis of ambient particulate matter source apportionment using receptor models in Europe. Atmos. Environ. 2013, 69, 94–108. [Google Scholar] [CrossRef]
  43. Ianniello, A.; Spataro, F.; Esposito, G.; Allegrini, I.; Hu, M.; Zhu, T. Chemical characteristics of inorganic ammonium salts in PM2.5 in the atmosphere of Beijing (China). Atmos. Chem. Phys. 2011, 11, 10803–10822. [Google Scholar] [CrossRef]
  44. Hussein, T. Atmospheric Aerosol Sampling Protocol and Strategy for ARASIA Member States. In Evaluating and Mapping Air Pollutants Using Nuclear Analytical Techniques (ARASIA); International Atomic Energy Agency (IAEA): Austria, Vienna, 2014. [Google Scholar]
Figure 1. 24-h average airborne mass concentrations of PM2.5 obtained from gravimetric measurements. The horizontal dashed lines represent the United States Environmental Protection Agency (US-EPA) limit at 35 µg m−3 and the World Health Organization (WHO) limit at 25 µg m−3.
Sustainability 10 01088 g001
Figure 2. Statistical process control charts for the total PM2.5 mass concentrations for (a) all samples including dust episodes; (b) samples without dust episodes.
Sustainability 10 01088 g002
Figure 3. Variation of the equivalent black carbon (EBC) content on different sampling days.
Sustainability 10 01088 g003
Figure 4. Statistical process control chart for EBC concentration.
Sustainability 10 01088 g004
Figure 5. X-ray fluorescence (XRF) spectrum for Filter No. 31, showing that Si, Ca, and Fe are the dominant elements.
Sustainability 10 01088 g005
Figure 6. XRF spectrum for Filter No. 40, showing that S is the dominating element (please note the logarithmic scale).
Sustainability 10 01088 g006
Figure 7. (a) Average relative contribution of various inorganic elements in PM2.5; (b) Average relative contribution of pollution sources in PM2.5.
Sustainability 10 01088 g007
Figure 8. Consistency between NIST-certified airborne mass loading values of selected elements and values obtained with our HIORIBA XGT7200 for the NIST 2783 air particulate standard.
Sustainability 10 01088 g008
Figure 9. X-ray diffraction (XRD) pattern for Filter No. 40. The identified phases are mascagnite (NH4)2SO4, calcite (CaCO3), and orthoclase (KAlSi3O8).
Sustainability 10 01088 g009
Figure 10. XRD pattern for Filter No. 47. The identified phases are: calcite (CaCO3), gypsum (CaSO4·2H2O), quartz (SiO2), and phillipsite (Ca, Na2, K2)3Al6Si10O32·12H2O).
Sustainability 10 01088 g010
Figure 11. XRD pattern for Filter No. 31. The identified phases are quartz (SiO2), calcite (CaCO3), gypsum (CaSO4·2H2O), and cronstedtite (iron silicate mineral).
Sustainability 10 01088 g011
Figure 12. Elemental maps for sample 31. The maps show the existence of natural elements: Si, Ca, Al, Fe, Mg, K, Ti, Na, and Cl. Na and Cl exist in a single particle of NaCl crystal that is about 1 µm in diameter.
Sustainability 10 01088 g012
Figure 13. Scanning electron microscopy (SEM) and energy dispersive X-ray spectroscopy EDS maps for sample 40, showing strong correlation among S, N, and O originating from ammonium sulfates.
Sustainability 10 01088 g013
Table 1. Correlations among different elements obtained from XRF airborne mass concentration values.
ElementMgALSiSKCaTiVMnFeZnPb
Mg10.930.970.070.920.880.480.030.770.97−0.190.10
AL 10.99−0.110.970.860.520.010.850.96−0.190.01
Si 1−0.050.970.870.520.030.830.98−0.190.01
S 1−0.12−0.11−0.090.43−0.260.060.16−0.24
K 10.870.57−0.020.820.95−0.20−0.01
Ca 10.53−0.160.810.93−0.170.04
Ti 1−0.240.570.55−0.200.00
V 10.080.02−0.26−0.38
Mn 10.83−0.280.00
Fe 1−0.140.00
Zn 10.19
Pb 1

