Assessing the Sustainability of Decentralized Renewable Energy Systems: A Comprehensive Framework with Analytical Methods


Abstract
:1. Introduction
2. Methodological Approach
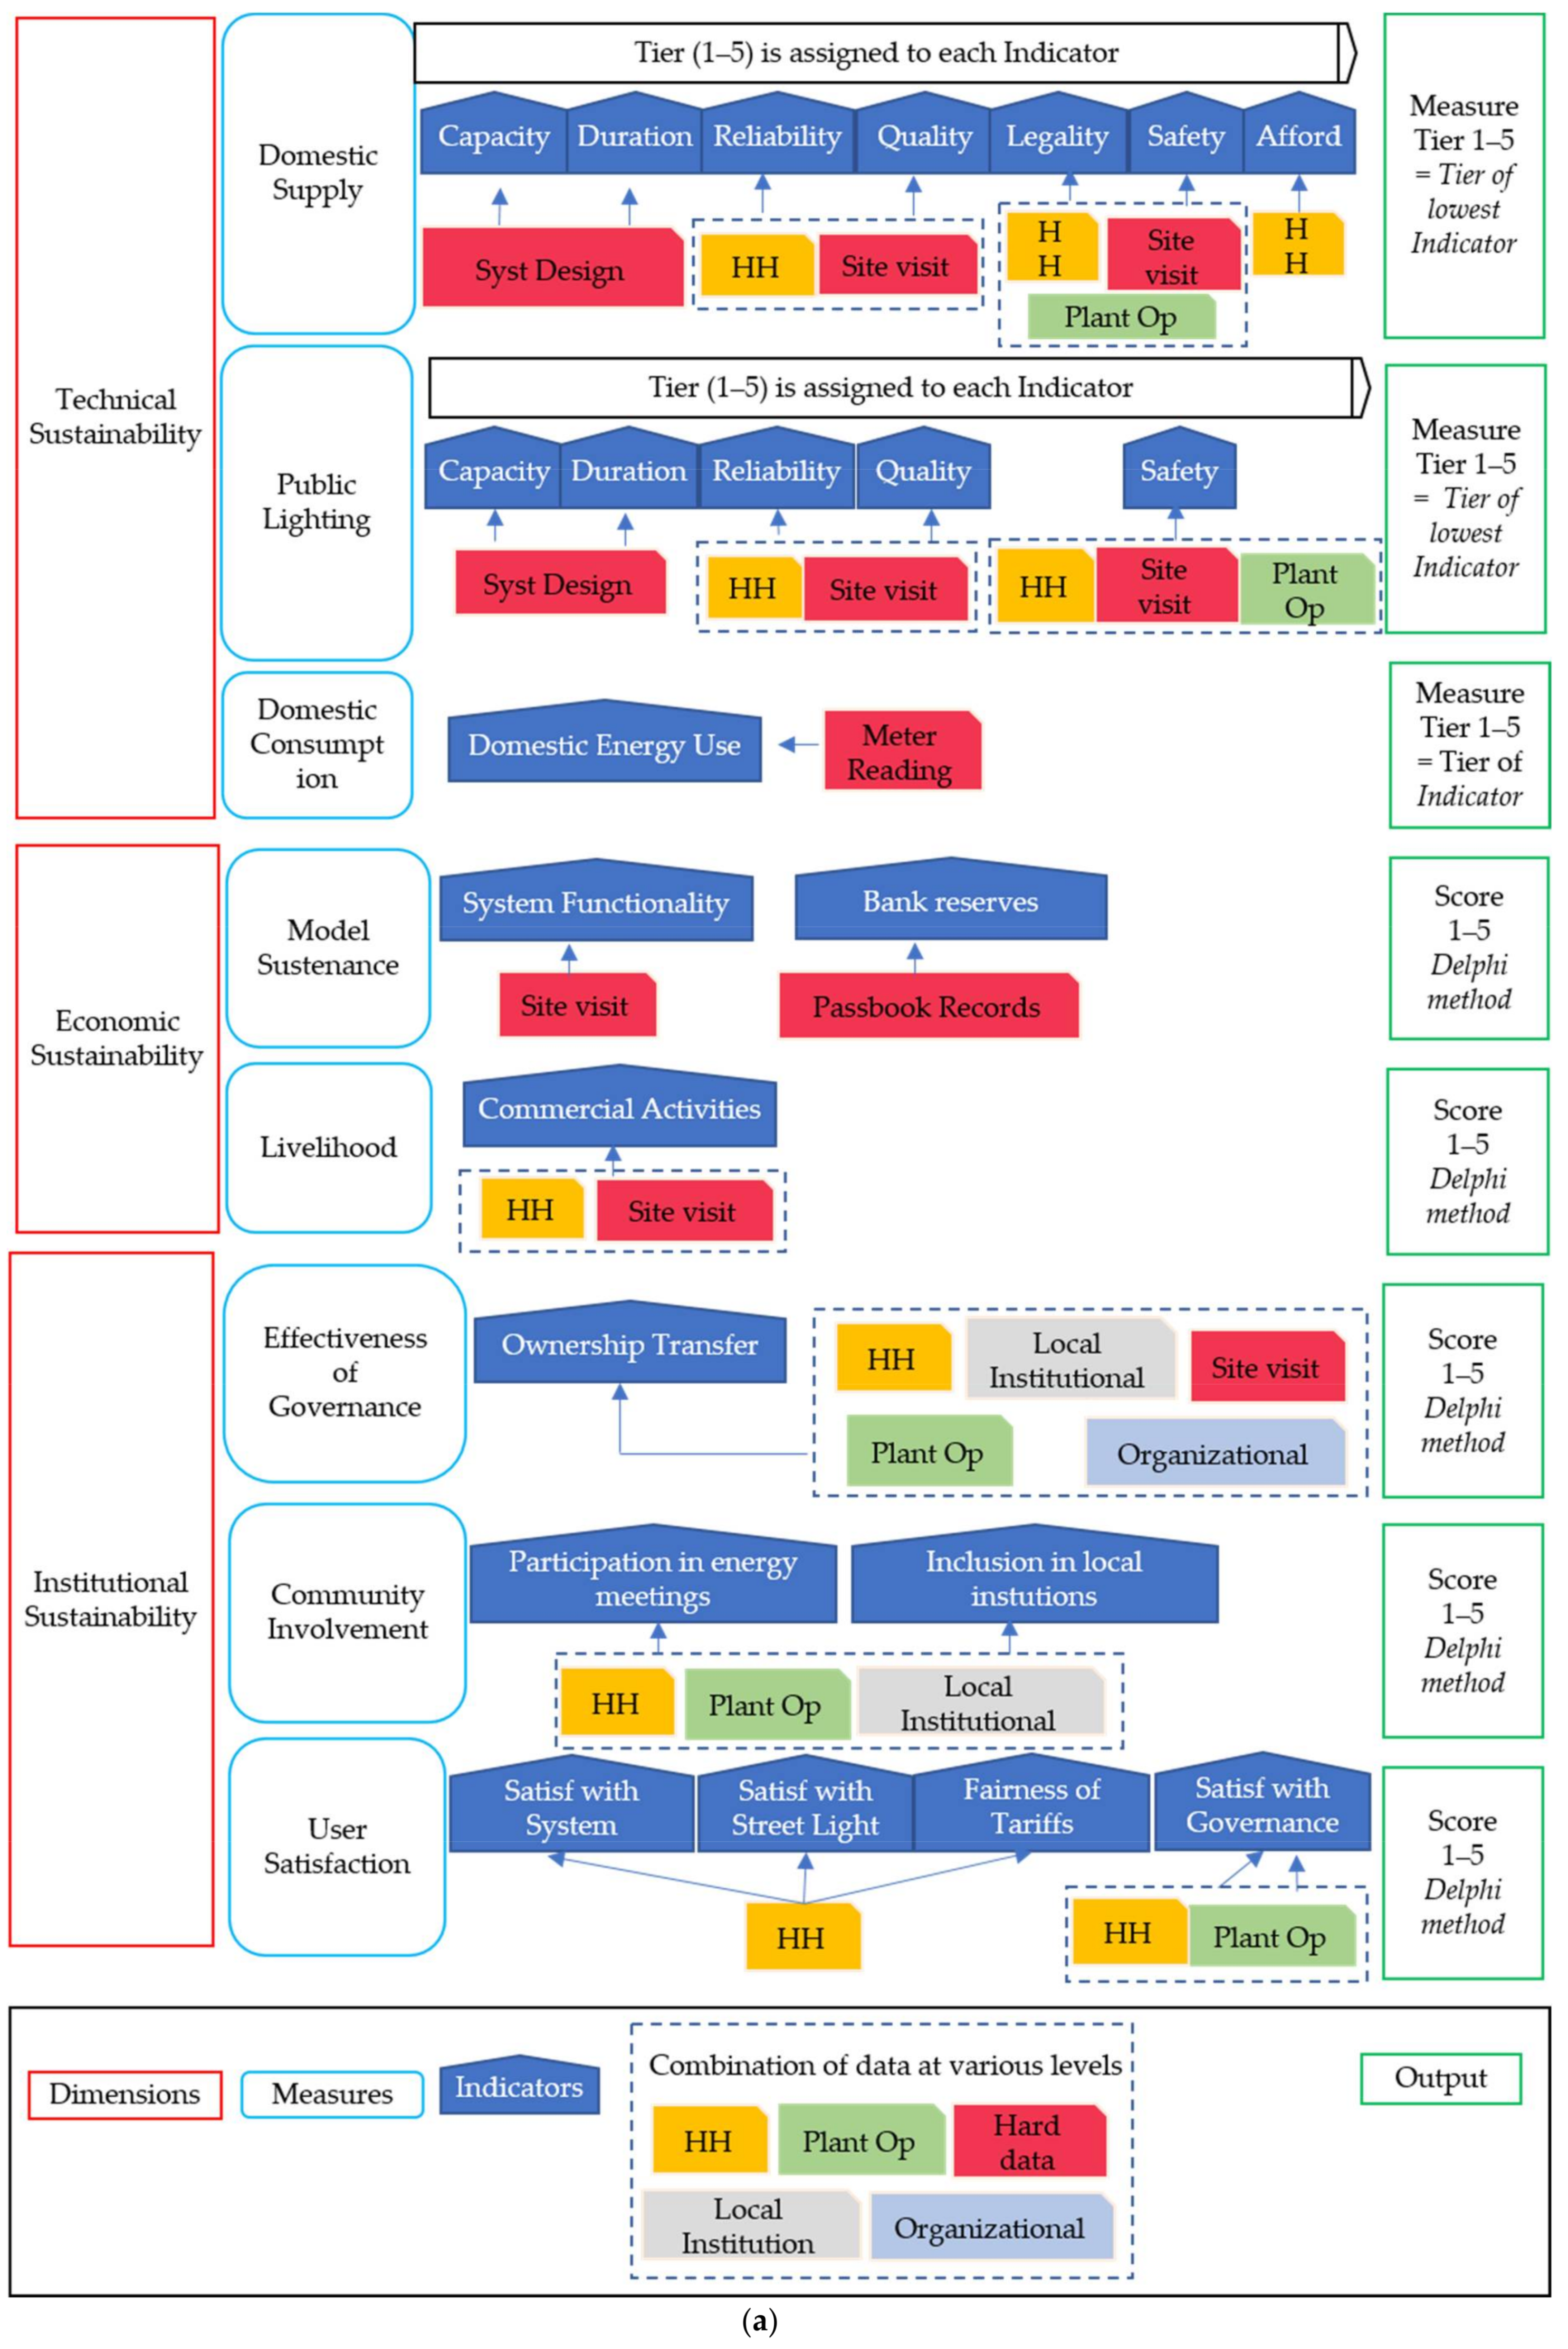
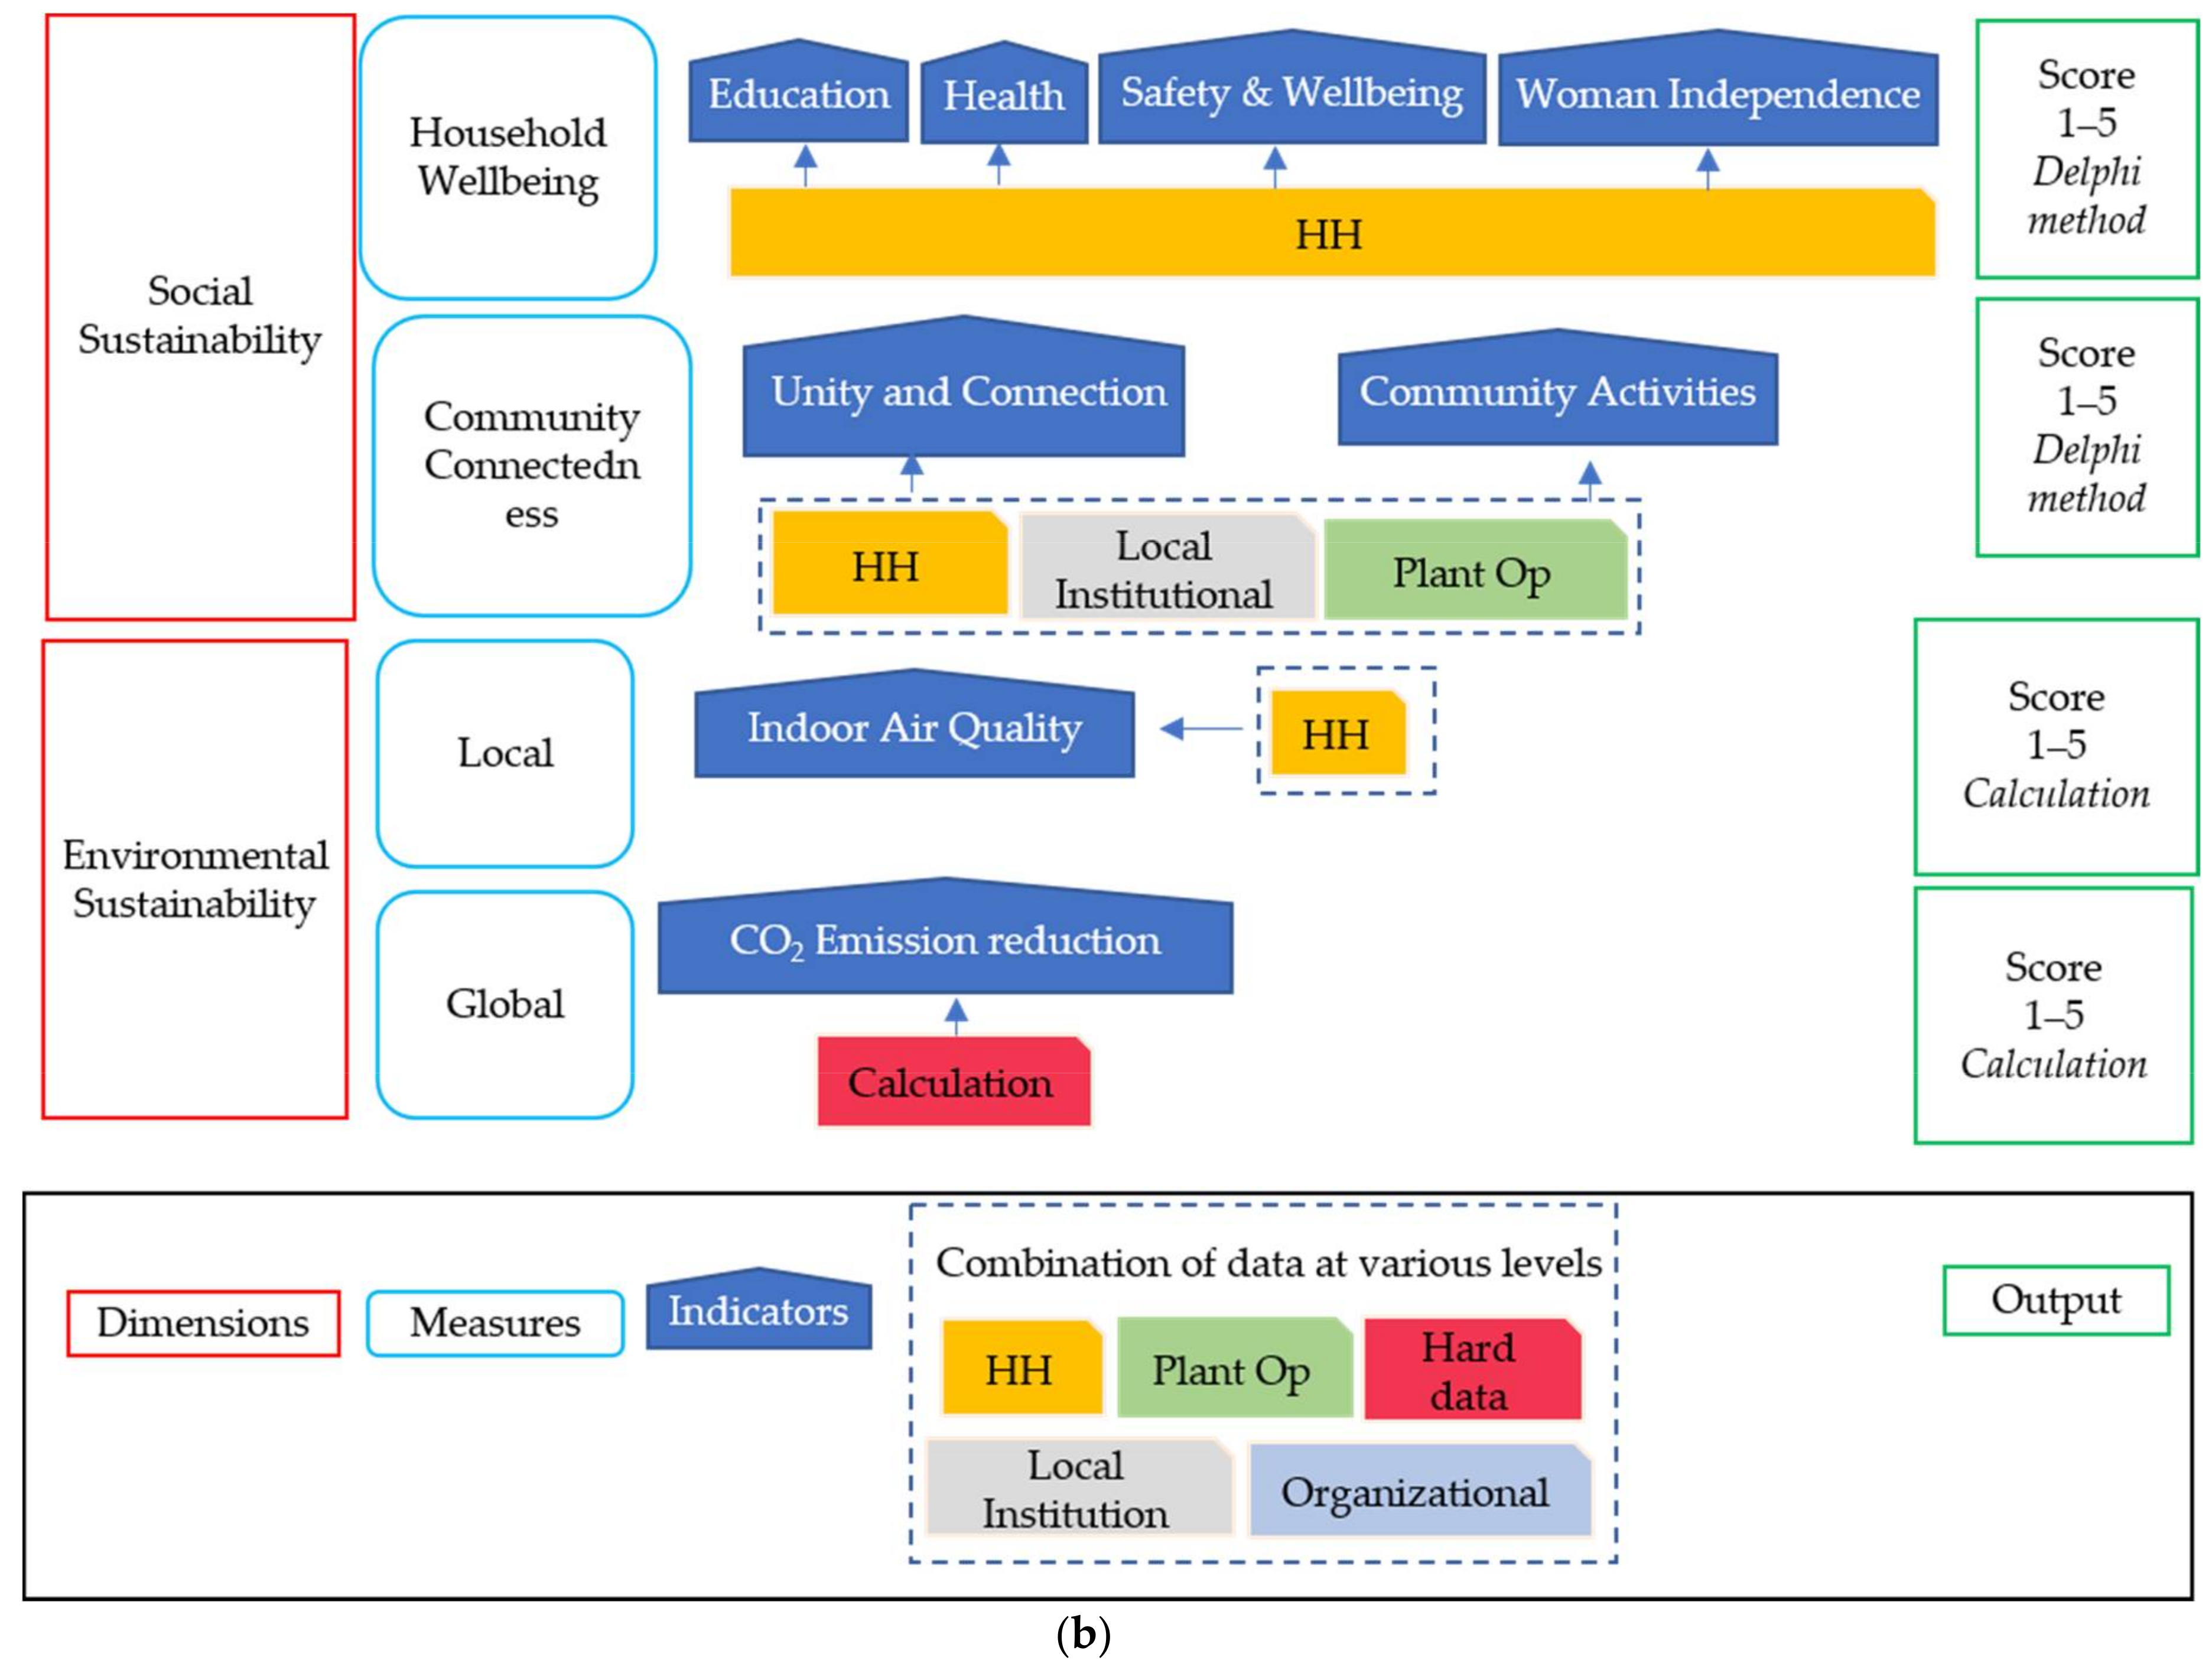
2.1. Building Blocks: Dimensions, Measures, Indicators
2.2. Definitions of Dimensions and Measures
2.3. Definition of Benchmarks and Scores
3. Discussion
4. Conclusions
Acknowledgments
Author Contributions
Conflicts of Interest
References
- International Energy Agency (IEA). Energy Access Outlook 2017: From Poverty to Prosperity; IEA: Paris, France, 2017. [Google Scholar]
- Feron, S. Sustainability of off-grid photovoltaic systems for rural electrification in developing countries: A review. Sustainability 2016, 8, 1326. [Google Scholar] [CrossRef]
- Palit, D.; Sovacool, B.K.; Cooper, C.; Zoppo, D.; Eidsness, J.; Crafton, M.; Johnson, K.; Clarke, S. The trials and tribulations of the Village Energy Security Programme (VESP) in India. Energy Policy 2013, 57, 407–417. [Google Scholar] [CrossRef]
- Murali, R.; Malhotra, S.; Palit, D.; Sasmal, K. Socio-technical assessment of solar photovoltaic systems implemented for rural electrification in selected villages of Sundarbans region of India. AIMS Energy 2015, 3, 612–634. [Google Scholar] [CrossRef]
- Dutt, P.K.; MacGill, I. Addressing Some Issues Relating to Hybrid Mini Grid Failures in Fiji, Proceedings of the 2013 IEEE Global Humanitarian Technology Conference: South Asia Satellite (GHTC-SAS), Trivandrum, India, 23–24 August 2013; IEEE: New York, NY, USA, 2013; pp. 106–111. [Google Scholar]
- Nygaard, I. The compatibility of rural electrification and promotion of low-carbon technologies in developing countries—The case of solar PV for sub-Saharan Africa. Eur. Rev. Energy Markets 2009, 3, 1–34. [Google Scholar]
- Ilskog, E. Indicators for assessment of rural electrification—An approach for the comparison of apples and pears. Energy Policy 2008, 36, 2665–2673. [Google Scholar] [CrossRef]
- Bhattacharyya, S.C. Review of alternative methodologies for analysing off-grid electricity supply. Renew. Sustain. Energy Rev. 2012, 16, 677–694. [Google Scholar] [CrossRef]
- Goldemberg, J.; Johansson, T.B.; Reddy, A.K.; Williams, R.H. Energy for the new millennium. Ambio 2001, 30, 330–337. [Google Scholar] [CrossRef] [PubMed]
- Gollwitzer, L.; Ockwell, D.; Muok, B.; Ely, A.; Ahlborg, H. Rethinking the sustainability and institutional governance of electricity access and mini-grids: Electricity as a common pool resource. Energy Res. Soc. Sci. 2018, 39, 152–161. [Google Scholar] [CrossRef]
- Goldthau, A. Rethinking the governance of energy infrastructure: Scale, decentralization and polycentrism. Energy Res. Soc. Sci. 2014, 1, 134–140. [Google Scholar] [CrossRef]
- Sovacool, B.K.; D’Agostino, A.L.; Bambawale, M.J. The socio-technical barriers to Solar Home Systems (SHS) in Papua New Guinea: “Choosing pigs, prostitutes, and poker chips over panels”. Energy Policy 2011, 39, 1532–1542. [Google Scholar] [CrossRef]
- Cloke, J.; Mohr, A.; Brown, E. Imagining renewable energy: Towards a social energy systems approach to community renewable energy projects in the Global South. Energy Res. Soc. Sci. 2017, 31, 263–272. [Google Scholar] [CrossRef]
- Kumar, A.; Mohanty, P.; Palit, D.; Chaurey, A. Approach for standardization of off-grid electrification projects. Renew. Sustain. Energy Rev. 2009, 13, 1946–1956. [Google Scholar] [CrossRef]
- Annecke, W. Monitoring and evaluation of energy for development: The good, the bad and the questionable in M&E practice. Energy Policy 2008, 36, 2839–2845. [Google Scholar]
- Acosta, C.; Ortega, M.; Bunsen, T.; Koirala, B.P.; Ghorbani, A. Facilitating energy transition through energy commons: An application of socio-ecological systems framework for integrated community energy systems. Sustainability 2018, 10, 366. [Google Scholar] [CrossRef]
- Miller, C.A.; Altamirano-Allende, C.; Johnson, N.; Agyemang, M. The social value of mid-scale energy in Africa: Redefining value and redesigning energy to reduce poverty. Energy Res. Soc. Sci. 2015, 5, 67–69. [Google Scholar] [CrossRef]
- Ulsrud, K.; Winther, T.; Palit, D.; Rohracher, H.; Sandgren, J. The solar transitions research on solar mini-grids in India: Learning from local cases of innovative socio-technical systems. Energy Sustain. Dev. 2011, 15, 293–303. [Google Scholar] [CrossRef]
- Bhattacharyya, S.C. Energy access programmes and sustainable development: A critical review and analysis. Energy Sustain. Dev. 2012, 16, 260–271. [Google Scholar] [CrossRef]
- Ilskog, E.; Kjellström, B. And then they lived sustainably ever after?—Assessment of rural electrification cases by means of indicators. Energy Policy 2008, 36, 2674–2684. [Google Scholar] [CrossRef]
- Feron, S.; Heinrichs, H.; Cordero, R.R. Are the rural electrification efforts in the Ecuadorian Amazon sustainable? Sustainability 2016, 8, 443. [Google Scholar] [CrossRef]
- Bhatia, M.; Angelou, N. Beyond Connections: Energy Access Redefined. Executive Summary; ESMAP Technical Report 008/15; World Bank: Washington, DC, USA.
- Elmustapha, H.; Hoppe, T.; Bressers, H. Understanding stakeholders’ views and the influence of the socio-cultural dimension on the adoption of solar energy technology in Lebanon. Sustainability 2018, 10, 364. [Google Scholar] [CrossRef]
- Prasad, G. National Policy for Renewable Energy Based Micro and Mini Grids; Ministry of New and Renewable Energy Energy, Ed.; Government of India: New Delhi, India, 2016.
- Kirubi, C.; Jacobson, A.; Kammen, D.M.; Mills, A. Community-based electric micro-grids can contribute to rural development: Evidence from Kenya. World Dev. 2009, 37, 1208–1221. [Google Scholar] [CrossRef]
- Marks, S.J.; Davis, J. Does user participation lead to sense of ownership for rural water systems? Evidence from Kenya. World Dev. 2012, 40, 1569–1576. [Google Scholar] [CrossRef]
- Neudoerffer, R.C.; Malhotra, P.; Ramana, P.V. Participatory rural energy planning in India—A policy context. Energy Policy 2001, 29, 371–381. [Google Scholar] [CrossRef]
- Palit, D.; Chaurey, A. Off-grid rural electrification experiences from South Asia: Status and best practices. Energy Sustain. Dev. 2011, 15, 266–276. [Google Scholar] [CrossRef]
- Brown, E.D.; Cloke, J.M.; Harrison, J. Governance, Decentralisation and Energy: A Critical Review of the Key Issues. 2015. Available online: https://dspace.lboro.ac.uk/dspace-jspui/bitstream/2134/26780/1/READ%20WP1.pdf (accessed on 1 December 2017).
- Mansfield, W.; Grunewald, P. The Use of Indicators for the Monitoring and Evaluation of Knowledge Management and Knowledge Brokering in International Development; Report of a Workshop Held at the Institute of Development Studies 8th March 2013; Institute of Development Studies Knowledge Services and Louborough University: Brighton, UK, 2013. [Google Scholar]
- Menon, S.; Karl, J.; Wignaraja, K. Handbook on Planning, Monitoring and Evaluating for Development Results; UNDP Evaluation Office: New York, NY, USA, 2009. [Google Scholar]
- Oparaocha, S.; Dutta, S. Gender and energy for sustainable development. Curr. Opin. Environ. Sustain. 2011, 3, 265–271. [Google Scholar] [CrossRef]
- Aklin, M.; Cheng, C.-Y.; Urpelainen, J.; Ganesan, K.; Jain, A. Factors affecting household satisfaction with electricity supply in rural India. Nat. Energy 2016, 1, 16170. [Google Scholar] [CrossRef]
- Aklin, M.; Bayer, P.; Harish, S.; Urpelainen, J. Does basic energy access generate socioeconomic benefits? A field experiment with off-grid solar power in India. Sci. Adv. 2017, 3, e1602153. [Google Scholar] [CrossRef] [PubMed]


| Level | Description | Data & Collection Method |
|---|---|---|
| Village/System | Installation and village-specific data providing village profile and key system characteristics | Site visits and inspection, data from meter readings, system characteristics, record of project finances |
| Village/Institutions | Village-level organization in charge of effective operations and management of the system | In-person survey with close and open-ended questions with plant operators, semi-structured interviews and guided group discussions with governance committee members |
| Organizational | Perspectives from solution provider, local NGOs, and financiers | Semi-structured interviews and guided group discussions |
| Household | Information on a variety of indicators for singular house/family | In-person survey with close and open-ended questions with household members |
| Indicator Sheet | |
|---|---|
| Dimension | Economic Sustainability |
| Measure | Livelihood Generation |
| Indicator Name | Number of Commercial Activities |
| Description | This indicator tracks the use of electricity for income generating activities |
| Type | Quantitative |
| Source | Household Questionnaire—Question 16 |
| Level | Household level |
| Data verification | Site inspection |
| Calculation & unit of measure | Percentage of respondents for a unit of sample (in this case a village-level project) using electricity for commercial purposes (supported by description of activities) |
| Indicator | Tier 1 | Tier 2 | Tier 3 | Tier 4 | Tier 5 |
|---|---|---|---|---|---|
| Capacity (W/HH) | Min 3 | Min 50 | Min 200 | Min 800 | Min 2000 |
| Duration | >4 h >1 h @ night | >4 h >2 h @ night | >8 h >3 h @ night | >16 h >4 h @ night | >23 h >4 h @ night |
| Reliability (monsoon months) | Frequent outages >5 days/month | 2–5 days/month | 1–2 days/month | No unscheduled outages | |
| Quality | Frequent issues with V and f affecting use of appliances | Few issues with V and f | No issues with ability to use appliances when needed | ||
| Affordability | House unable to pay at time of collection and still in debt | House unable to pay at time of collection and facing difficulties in paying on following month | House unable to pay at time of collection but easily paid back the following month | No difficulties with regular payments | |
| Legality | Illegal connections and irregularities with payments | No illegal connections and bills paid to authorized representative | |||
| Safety | Unsafe connection and installation | Absence of past accidents and perception of risk in the future | |||
| Indicator | Tier 1 | Tier 2 | Tier 3 | Tier 4 | Tier 5 |
|---|---|---|---|---|---|
| Capacity (village coverage) | 1 street light | >25% | >50% | >75% | >95% |
| Duration (Night hours) | >2 h/day | >4 h/day | >50% | >75% | >95% s |
| Reliability (monsoon) | Frequent outages >5 days/month | 2–5 days/month | 1–2 days/month | No outages | |
| Quality | No functioning lights | Failures, brightness flickering issues | No early failures, no issues with brightness, flickering, etc. | ||
| Safety | Unsafe connection and installation | No perceived risk of electrocution due to poor installation or maintenance | |||
| Indicator | Tier 1 | Tier 2 | Tier 3 | Tier 4 | Tier 5 |
|---|---|---|---|---|---|
| Daily Consumption (Wh/HH) | ≤12–200> | ≤200–1000> | ≤1000–3425> | ≤3425–8219> | ≥8219 |
| Score | Description |
|---|---|
| 1 | System not operational. Information from community finances shows few or no collections happening and no sign of re-establishing the mechanism for tariff collections. |
| 2 | System is operational/partly operational. Information from community finances shows a big difference between expected and actual balances at the time of inspection and energy tariffs are not being collected regularly by the local operator. |
| 3 | System is operational. Information from community finances shows a few sparse deposits. The difference between expected and actual balance at the time of the visit may still be substantial, but money collection happens regularly. |
| 4 | System is operational. Information from community finances shows regular and timely deposit. Difference between expected and actual balance at the time of the visit is small. |
| 5 | System is operational. Information from community finances show regular deposits and consistency between expected and actual balance. |
| Score | Description |
|---|---|
| 1 | No economic activities in the village linked to energy use. Users are not reporting an increase in productivity that can be linked to electricity being available at home. |
| 2 | Limited livelihood generation activities in the village and limited increase in productivity registered |
| 3 | Few households are starting to use electricity and are purchasing appliances to help with existing businesses. A growing number of people in the village are also reporting increased productivity. |
| 4 | Few households have invested money to actively start a new business and purchase electrical equipment. The majority of people are also noticing an increase in productivity thanks to electricity at home. |
| 5 | Engagement in income activities is extended to few houses in the village, and many examples of houses actively investing money to start new businesses. |
| Score | Description |
|---|---|
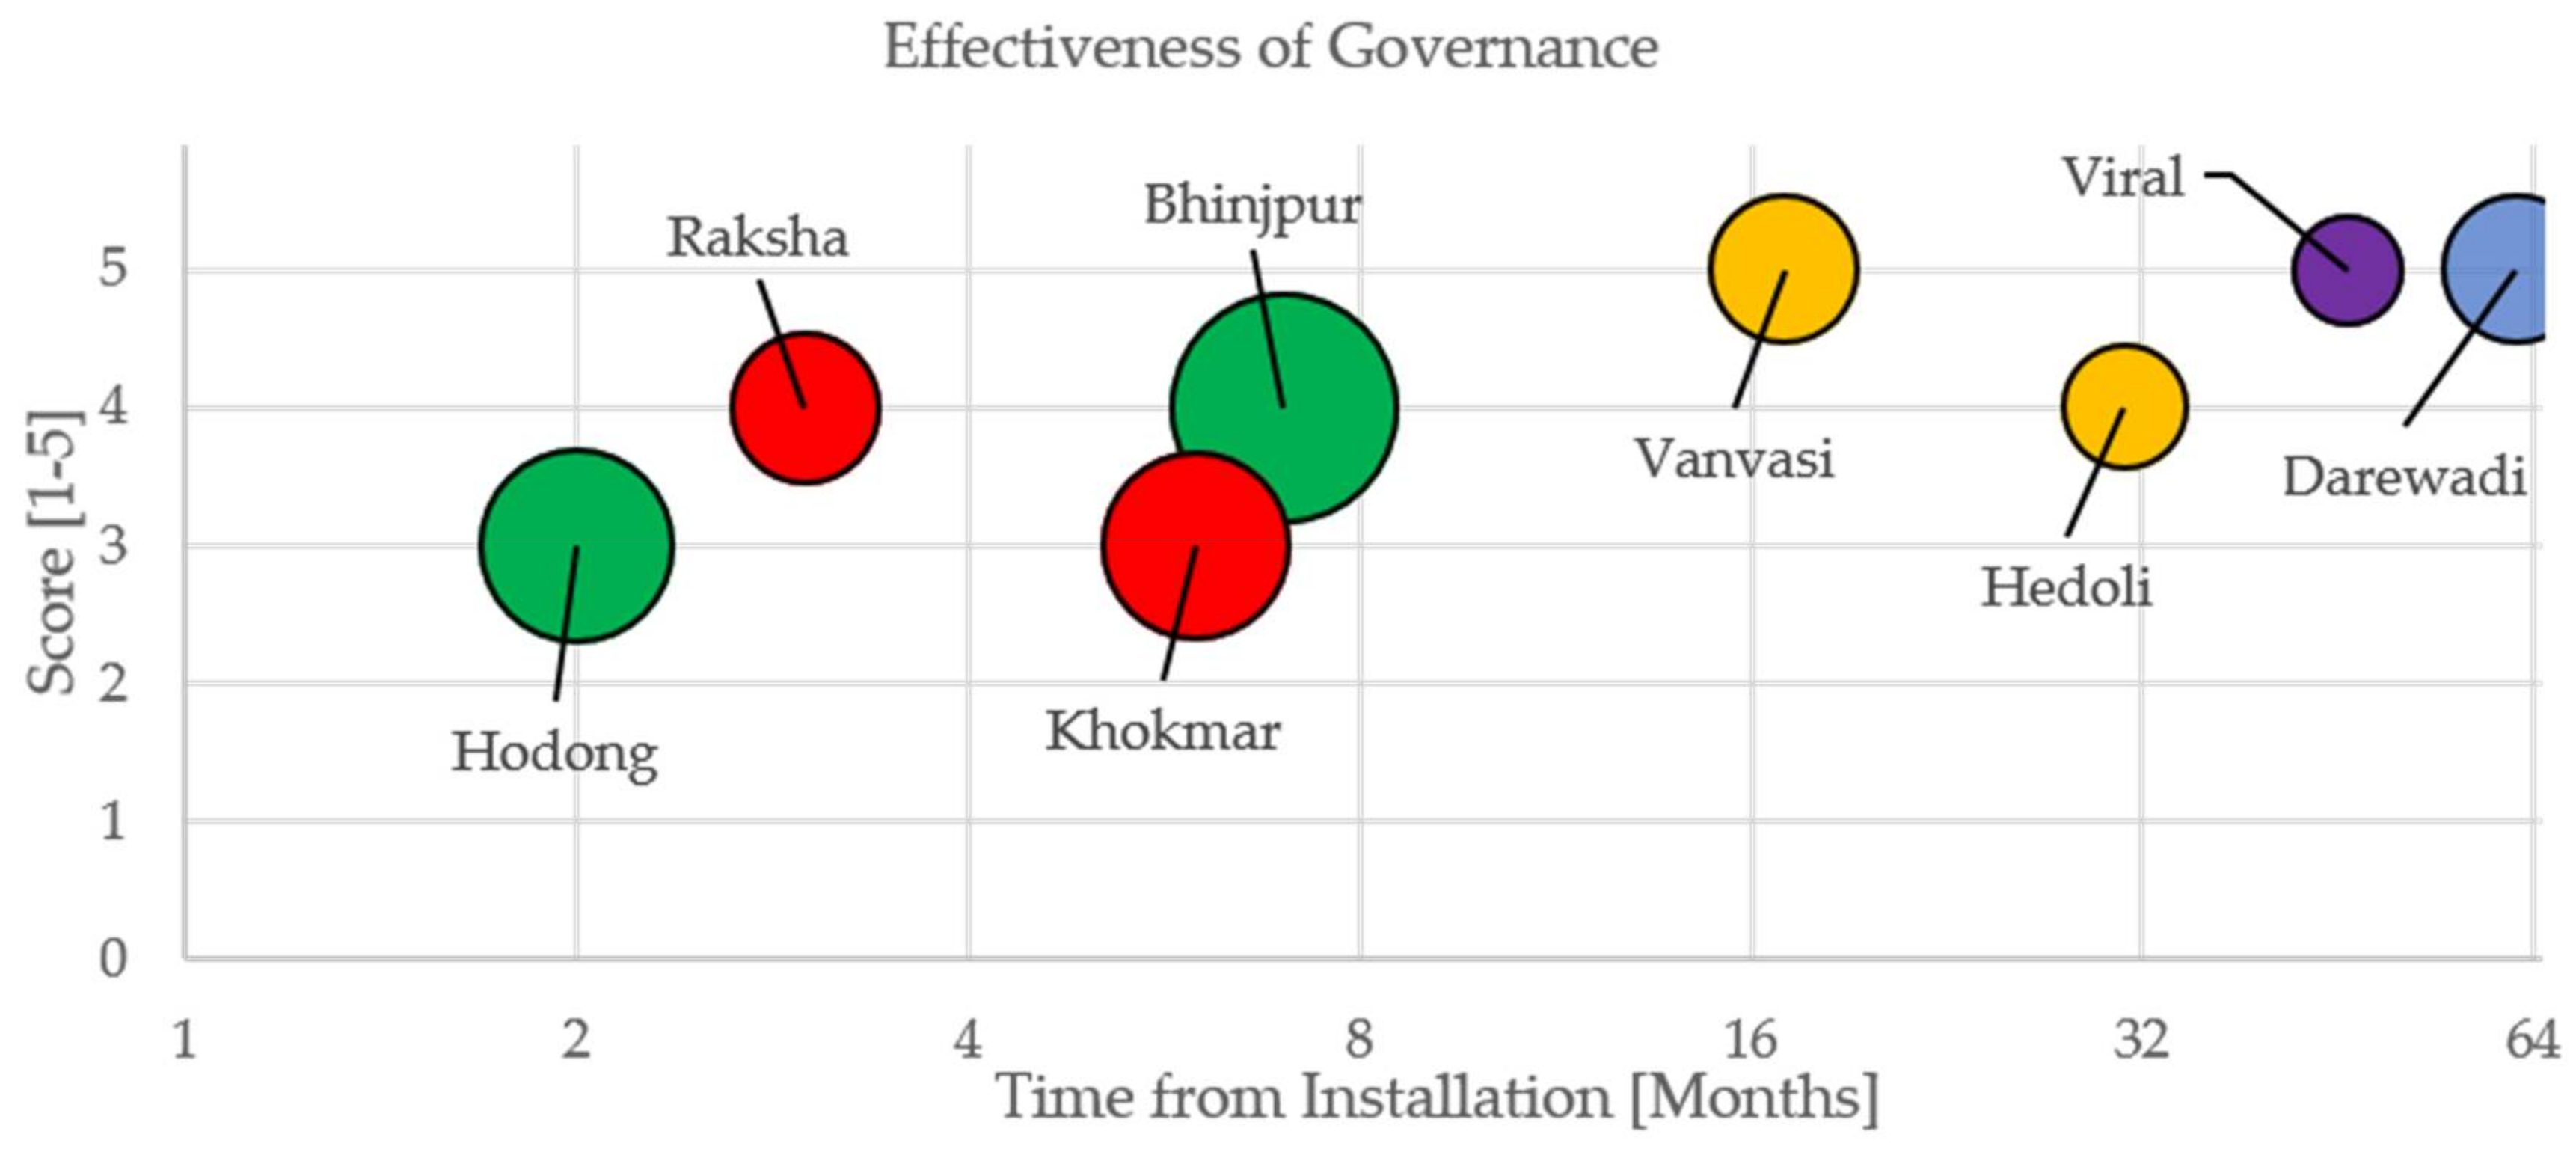
| 1/2 | Very ineffective. Major external intervention needed to keep the project going. Local operator is not able to collect tariffs from households nor take care of small technical issues. Institutional meetings for energy-related issues are infrequent and ineffective. |
| 3 | Medium effectiveness. Local operator and members of local institutions are able to solve small technical and financial issues autonomously. Energy-related meetings are happening, though not very frequently. External intervention from higher organizational level is still largely needed to initiate meetings and discuss issues. System for accountability and enforcement of rules is in place but not solid. |
| 4 | Effective. Local operator and members of local institutions have demonstrated ability to take care of the majority of technical and financial issues autonomously in many occasions. External intervention may still be needed to take care of more serious technical issues, or to solve major internal disputes. Despite this, representative of local governance are able to seek external help when issues arise without compromising the system’s functionality. |
| 5 | Very effective. Local institutions have demonstrated ability take care of technical and financial issues autonomously over a long period of time, timely seeking help when serious issues arise and limiting the down time of the system due to O&M to the lowest possible level. Meetings happen regularly, and local institutions have been able to craft and modify rules around the use and management of the system to accommodate local necessities. |
| Score | Description |
|---|---|
| 1–2 | Low involvement. Few people participate in meetings and there is limited sense of ownership being transferred to the community. |
| 3 | Medium involvement. About half of the village attends meetings that happen at regular intervals. Sense of ownership and trust on institutions is also good. |
| 4–5 | High level of involvement. Meetings happen regularly and the majority of people participate and interact. Confidence on local institutions and governance is also high. |
| Score | Description |
|---|---|
| 1–2 | Low satisfaction. Users at various levels report high level of dissatisfaction over many indicators. |
| 3 | Medium satisfaction. Users at various levels are fairly satisfied with the system. However, there may be some emerging factors limiting to higher score. |
| 4 | Medium–high. Users at various levels report high level of satisfaction across many indicators. There are, however, still one or two limiting factors. |
| 5 | High. Very high satisfaction at all levels across all indicators. |
| Score | Description |
|---|---|
| 1–2 | Low. Limited to no improvements across many indicators |
| 3 | Medium. Some improvements reported but limitations noticed across 1–2 indicators |
| 4–5 | High. Improvements noticed across all indicators and high degree of confidence |
| Score | Description |
|---|---|
| 1–2 |
|
| 3 |
|
| 4–5 |
|
| Village | Darewadi | Viral | Jhaliyabandh | Sukalipada |
|---|---|---|---|---|
| Geography | Junnar | Karnataka | Jarkhand | Jawhar |
| Village Code | 1 | 2 | 19 | 24 |
| Domestic Supply | 3 | 3 | 2 | 3 |
| Public Lighting | 4 | 1 | 2 | 4 |
| Domestic Consumption | 2 | 1 | 1 | 1 |
| Model Sustenance | 4 | 4 | 2 | 3 |
| Livelihood | 3 | 1 | 2 | 1 |
| Efficiency of Governance | 5 | 4 | 2 | 2 |
| Community Participation | 5 | 5 | 2 | 2 |
| User Satisfaction | 5 | 5 | 3 | 2 |
| Household Wellbeing | 5 | 3 | 5 | 2 |
| Community Connectedness | 5 | 3 | 3 | 2 |
| Local Environmental benefits | 2 | 5 | 5 | 3 |
| Global Environmental benefits | 5 | 5 | 5 | 3 |
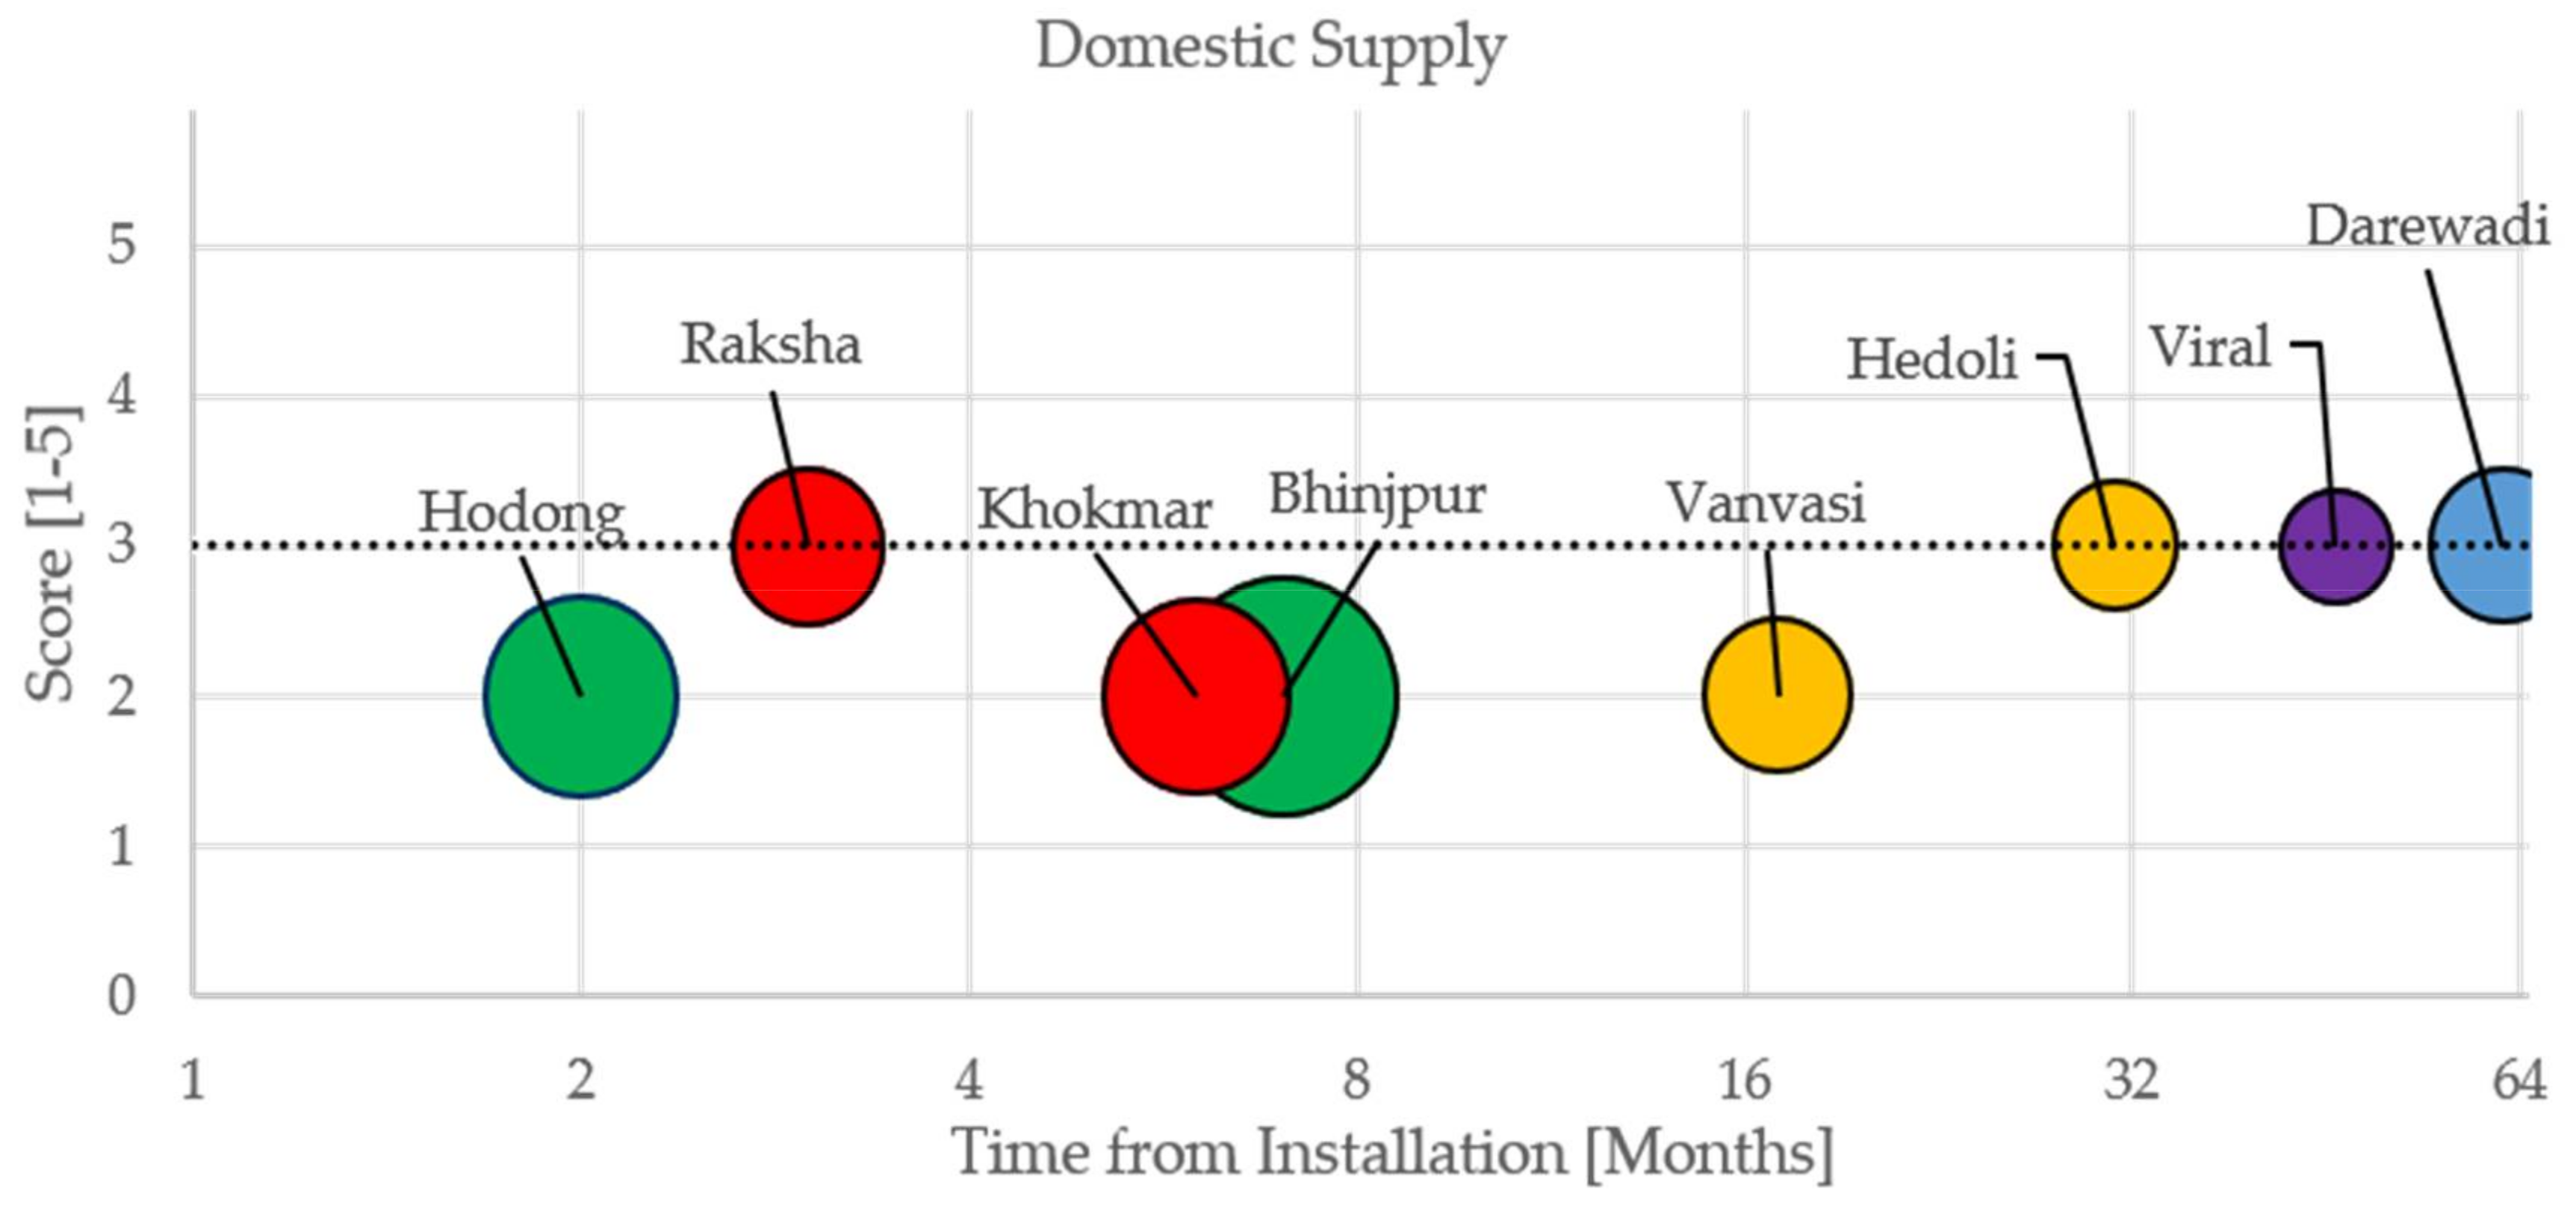
| Village | Capacity | Duration | Reliability | Quality | Affordability | Legality | Safety | Domestic Supply |
|---|---|---|---|---|---|---|---|---|
| Solution Provider target | 3 | 4 | 4 | 4 | 4 | 5 | 5 | 3 |
| Darewadi | 3 | 4 | 4 | 5 | 5 | 5 | 5 | 3 |
| Viral | 3 | 5 | 5 | 5 | 4 | 5 | 5 | 3 |
| Hedolipada | 3 | 5 | 3 | 3 | 4 | 5 | 5 | 3 |
| Vanvasipada | 3 | 5 | 2 | 2 | 4 | 5 | 5 | 2 |
| Bhinjpur | 3 | 5 | 3 | 3 | 4 | 5 | 5 | 3 |
| Khokmar | 2 | 5 | 4 | 5 | 4 | 5 | 5 | 2 |
| Raksha | 3 | 5 | 3 | 5 | 4 | 5 | 5 | 3 |
| Hodong | 2 | 5 | 2 | 2 | 5 | 5 | 5 | 2 |
| Cons | Model Sust. | Livelihood | Eff. Gov. | Comm. Part. | User Satisf. | HH Well Being | Comm. Conn. | ||
|---|---|---|---|---|---|---|---|---|---|
| Cons | P. Corr. | 1 | 0.152 | 0.431 * | 0.190 | 0.009 | 0.169 | −0.108 | 0.119 |
| Sig | 0.479 | 0.035 | 0.374 | 0.968 | 0.430 | 0.614 | 0.580 | ||
| Model Sust. | P. Corr. | 1 | 0.433 * | 0.815 ** | 0.757 ** | 0.691 ** | 0.280 | 0.431 * | |
| Sig. | 0.035 | 0.000 | 0.000 | 0.000 | 0.185 | 0.035 | |||
| Livelihood | P. Corr. | 1 | 0.433 * | 0.499 * | 0.448 * | 0.383 | 0.641 ** | ||
| Sig. | 0.034 | 0.013 | 0.028 | 0.065 | 0.001 | ||||
| Eff Gov. | P. Corr. | 1 | 0.897 ** | 0.728 ** | 0.483 * | 0.578 ** | |||
| Sig. | 0.000 | 0.000 | 0.017 | 0.003 | |||||
| Comm. Part. | P. Corr. | 1 | 0.821 ** | 0.467 * | 0.559 ** | ||||
| Sig. | 0.000 | 0.021 | 0.005 | ||||||
| User Satisf. | P. Corr | 1 | 0.302 | 0.382 | |||||
| Sig. | 0.152 | 0.065 | |||||||
| HH Well Being | P. Corr | 1 | 0.590 ** | ||||||
| Sig. | 0.002 | ||||||||
| Comm. Conn. | P. Corr. | 1 | |||||||
| Sig. | |||||||||
| Model Summary | ||||||||||
| Model | R | R Square | Adjusted R Square | Std. Error of the Estimate | ||||||
| 1 | 0.416 a | 0.173 | 0.168 | 0.532 | ||||||
| 2 | 0.527 b | 0.278 | 0.269 | 0.499 | ||||||
| 3 | 0.574 c | 0.330 | 0.317 | 0.482 | ||||||
| Coefficients d | ||||||||||
| Model | Non Std. Coefficients | Std. Coeff. | t | Sig. | 95.0% Confidence Interval for B | |||||
| B | Std. Error | Beta | Lower Bound | Upper Bound | ||||||
| 3 | (Constant) | −0.593 | 0.267 | −2.224 | 0.028 | −1.119 | −0.066 | |||
| HH Well Being | 0.119 | 0.020 | 0.389 | 5.861 | 0.000 | 0.079 | 0.159 | |||
| Supply Quality | 0.161 | 0.034 | 0.306 | 4.672 | 0.000 | 0.093 | 0.229 | |||
| Fairness of Charge | 0.262 | 0.075 | 0.232 | 3.490 | 0.001 | 0.114 | 0.410 | |||
© 2018 by the authors. Licensee MDPI, Basel, Switzerland. This article is an open access article distributed under the terms and conditions of the Creative Commons Attribution (CC BY) license (http://creativecommons.org/licenses/by/4.0/).
Share and Cite
Katre, A.; Tozzi, A. Assessing the Sustainability of Decentralized Renewable Energy Systems: A Comprehensive Framework with Analytical Methods. Sustainability 2018, 10, 1058. https://doi.org/10.3390/su10041058
Katre A, Tozzi A. Assessing the Sustainability of Decentralized Renewable Energy Systems: A Comprehensive Framework with Analytical Methods. Sustainability. 2018; 10(4):1058. https://doi.org/10.3390/su10041058
Chicago/Turabian StyleKatre, Aparna, and Arianna Tozzi. 2018. "Assessing the Sustainability of Decentralized Renewable Energy Systems: A Comprehensive Framework with Analytical Methods" Sustainability 10, no. 4: 1058. https://doi.org/10.3390/su10041058
APA StyleKatre, A., & Tozzi, A. (2018). Assessing the Sustainability of Decentralized Renewable Energy Systems: A Comprehensive Framework with Analytical Methods. Sustainability, 10(4), 1058. https://doi.org/10.3390/su10041058