A Path Walkability Assessment Index Model for Evaluating and Facilitating Retail Walking Using Decision-Tree-Making (DTM) Method


Abstract
:1. Introduction
2. Problem Statement
3. Materials and Methods
3.1. Path Walkability Assessment Variables
3.2. Methods
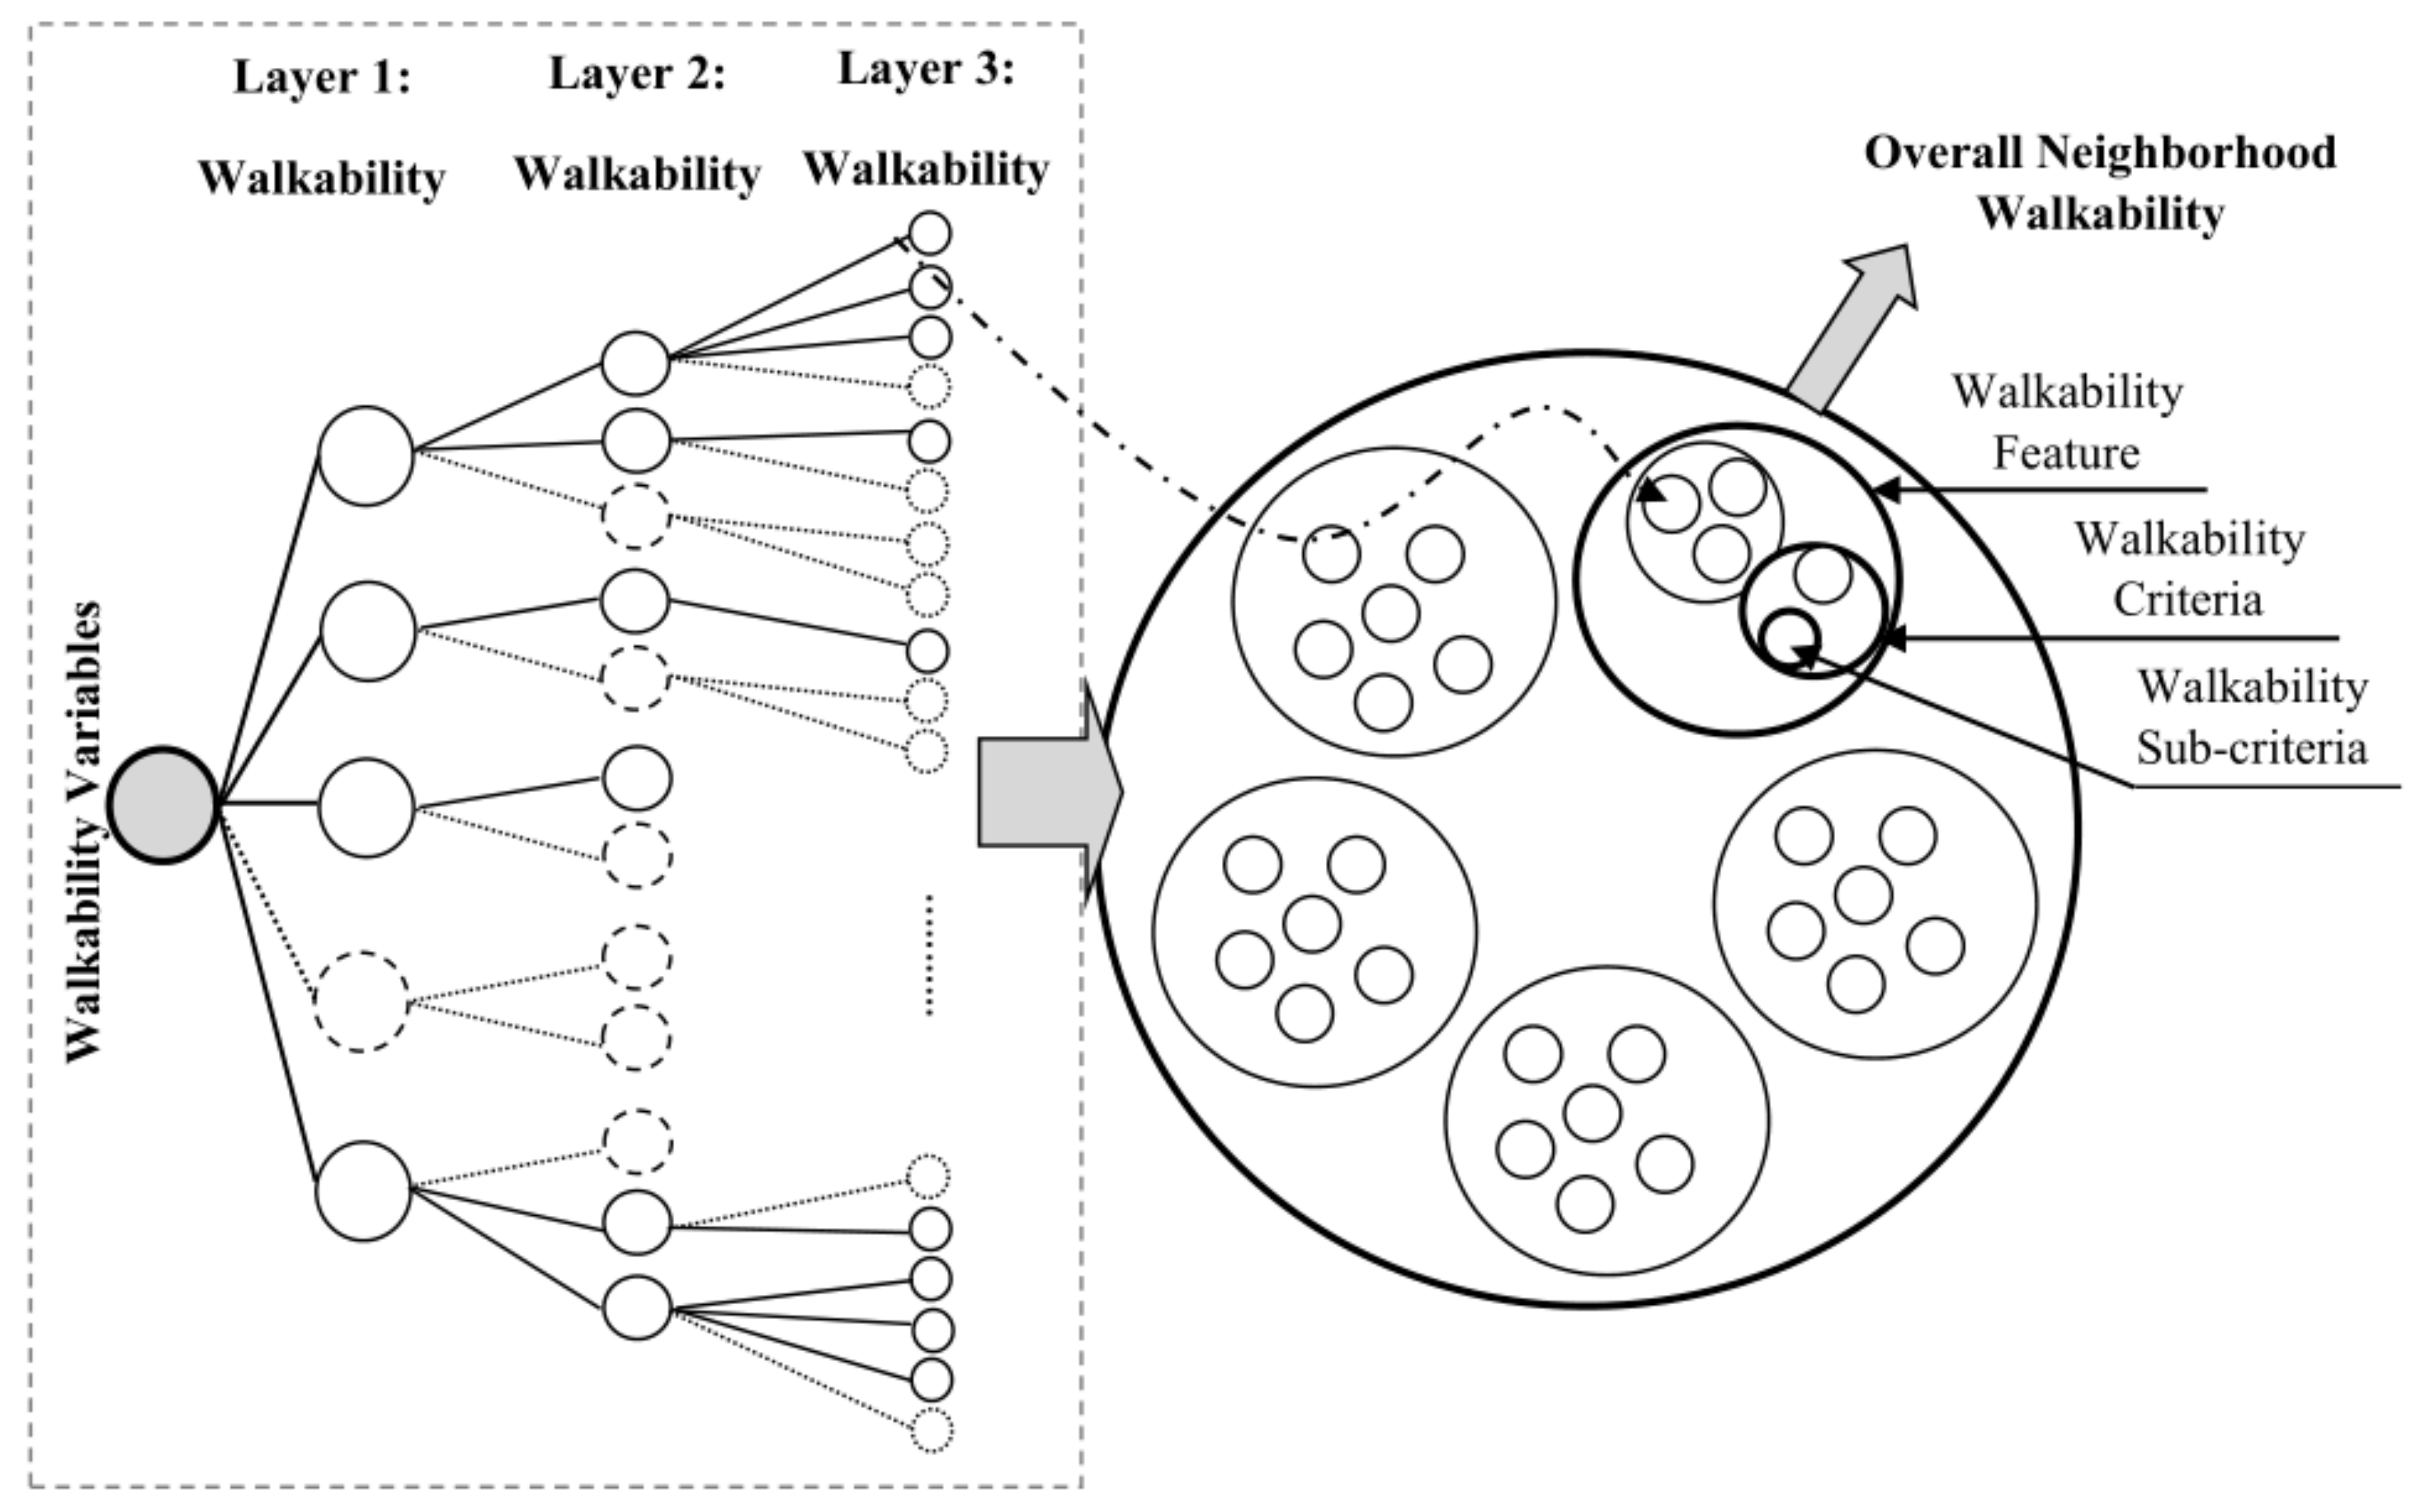
3.2.1. Decision Tree Making (DTM)
- ■
- is the feature number “i”, and “i” can be 1, 2, 3, 4 or 5.
- ■
- is the criteria number “j”, and “j” can be 0, 1, 2 or 3.
- ■
- is the sub-criteria number “k”, and “k” can be 0, 1, 2, 3, 4, 5, 6, 7 or 8.
3.2.2. Regression Analysis
- (Y hat) refers to the predicted score of an individual on the dependent variable.
- is the mean of independent variable, which is calculated as the sum of all of the scores divided by the sample size ().
- X refers to the scores of dependent variables.
- is the mean of dependent variable, which is calculated as the sum of all of the scores divided by the sample size ().
- and , refer to the standard deviations of the X and Y, respectively ( = ).
- r is the Pearson correlation coefficient.
- and Y refer to the score of dependent and independent variables, respectively.
- refers to the ample size.
4. Analysis
- (1)
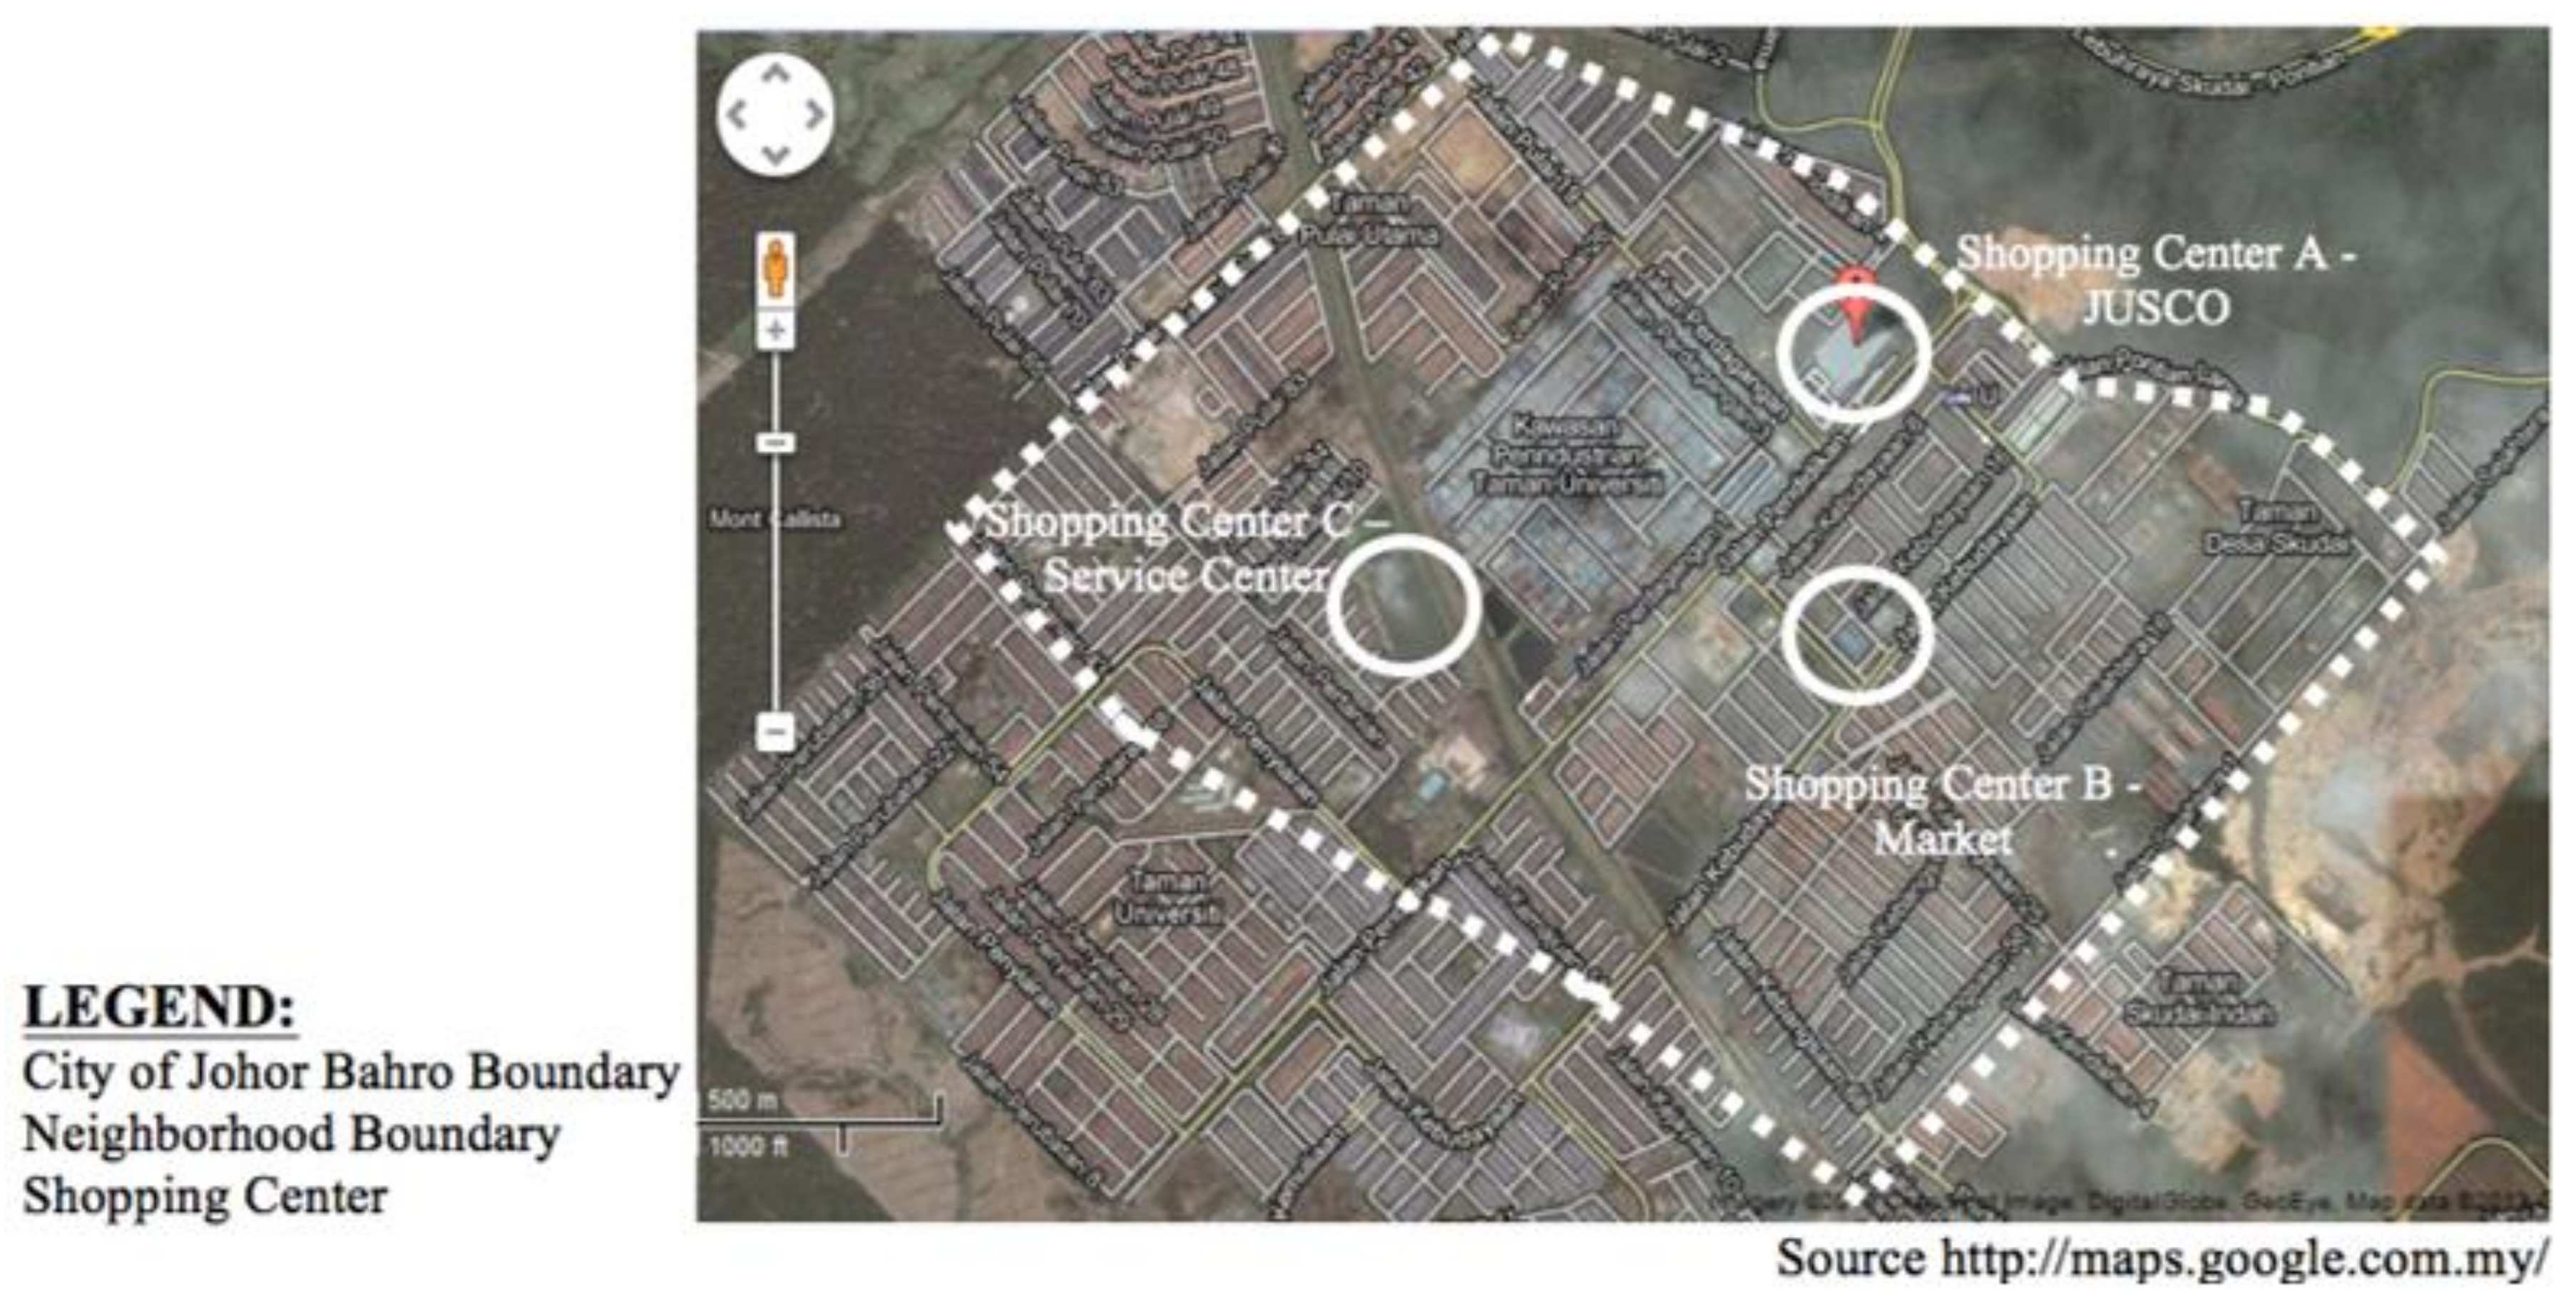
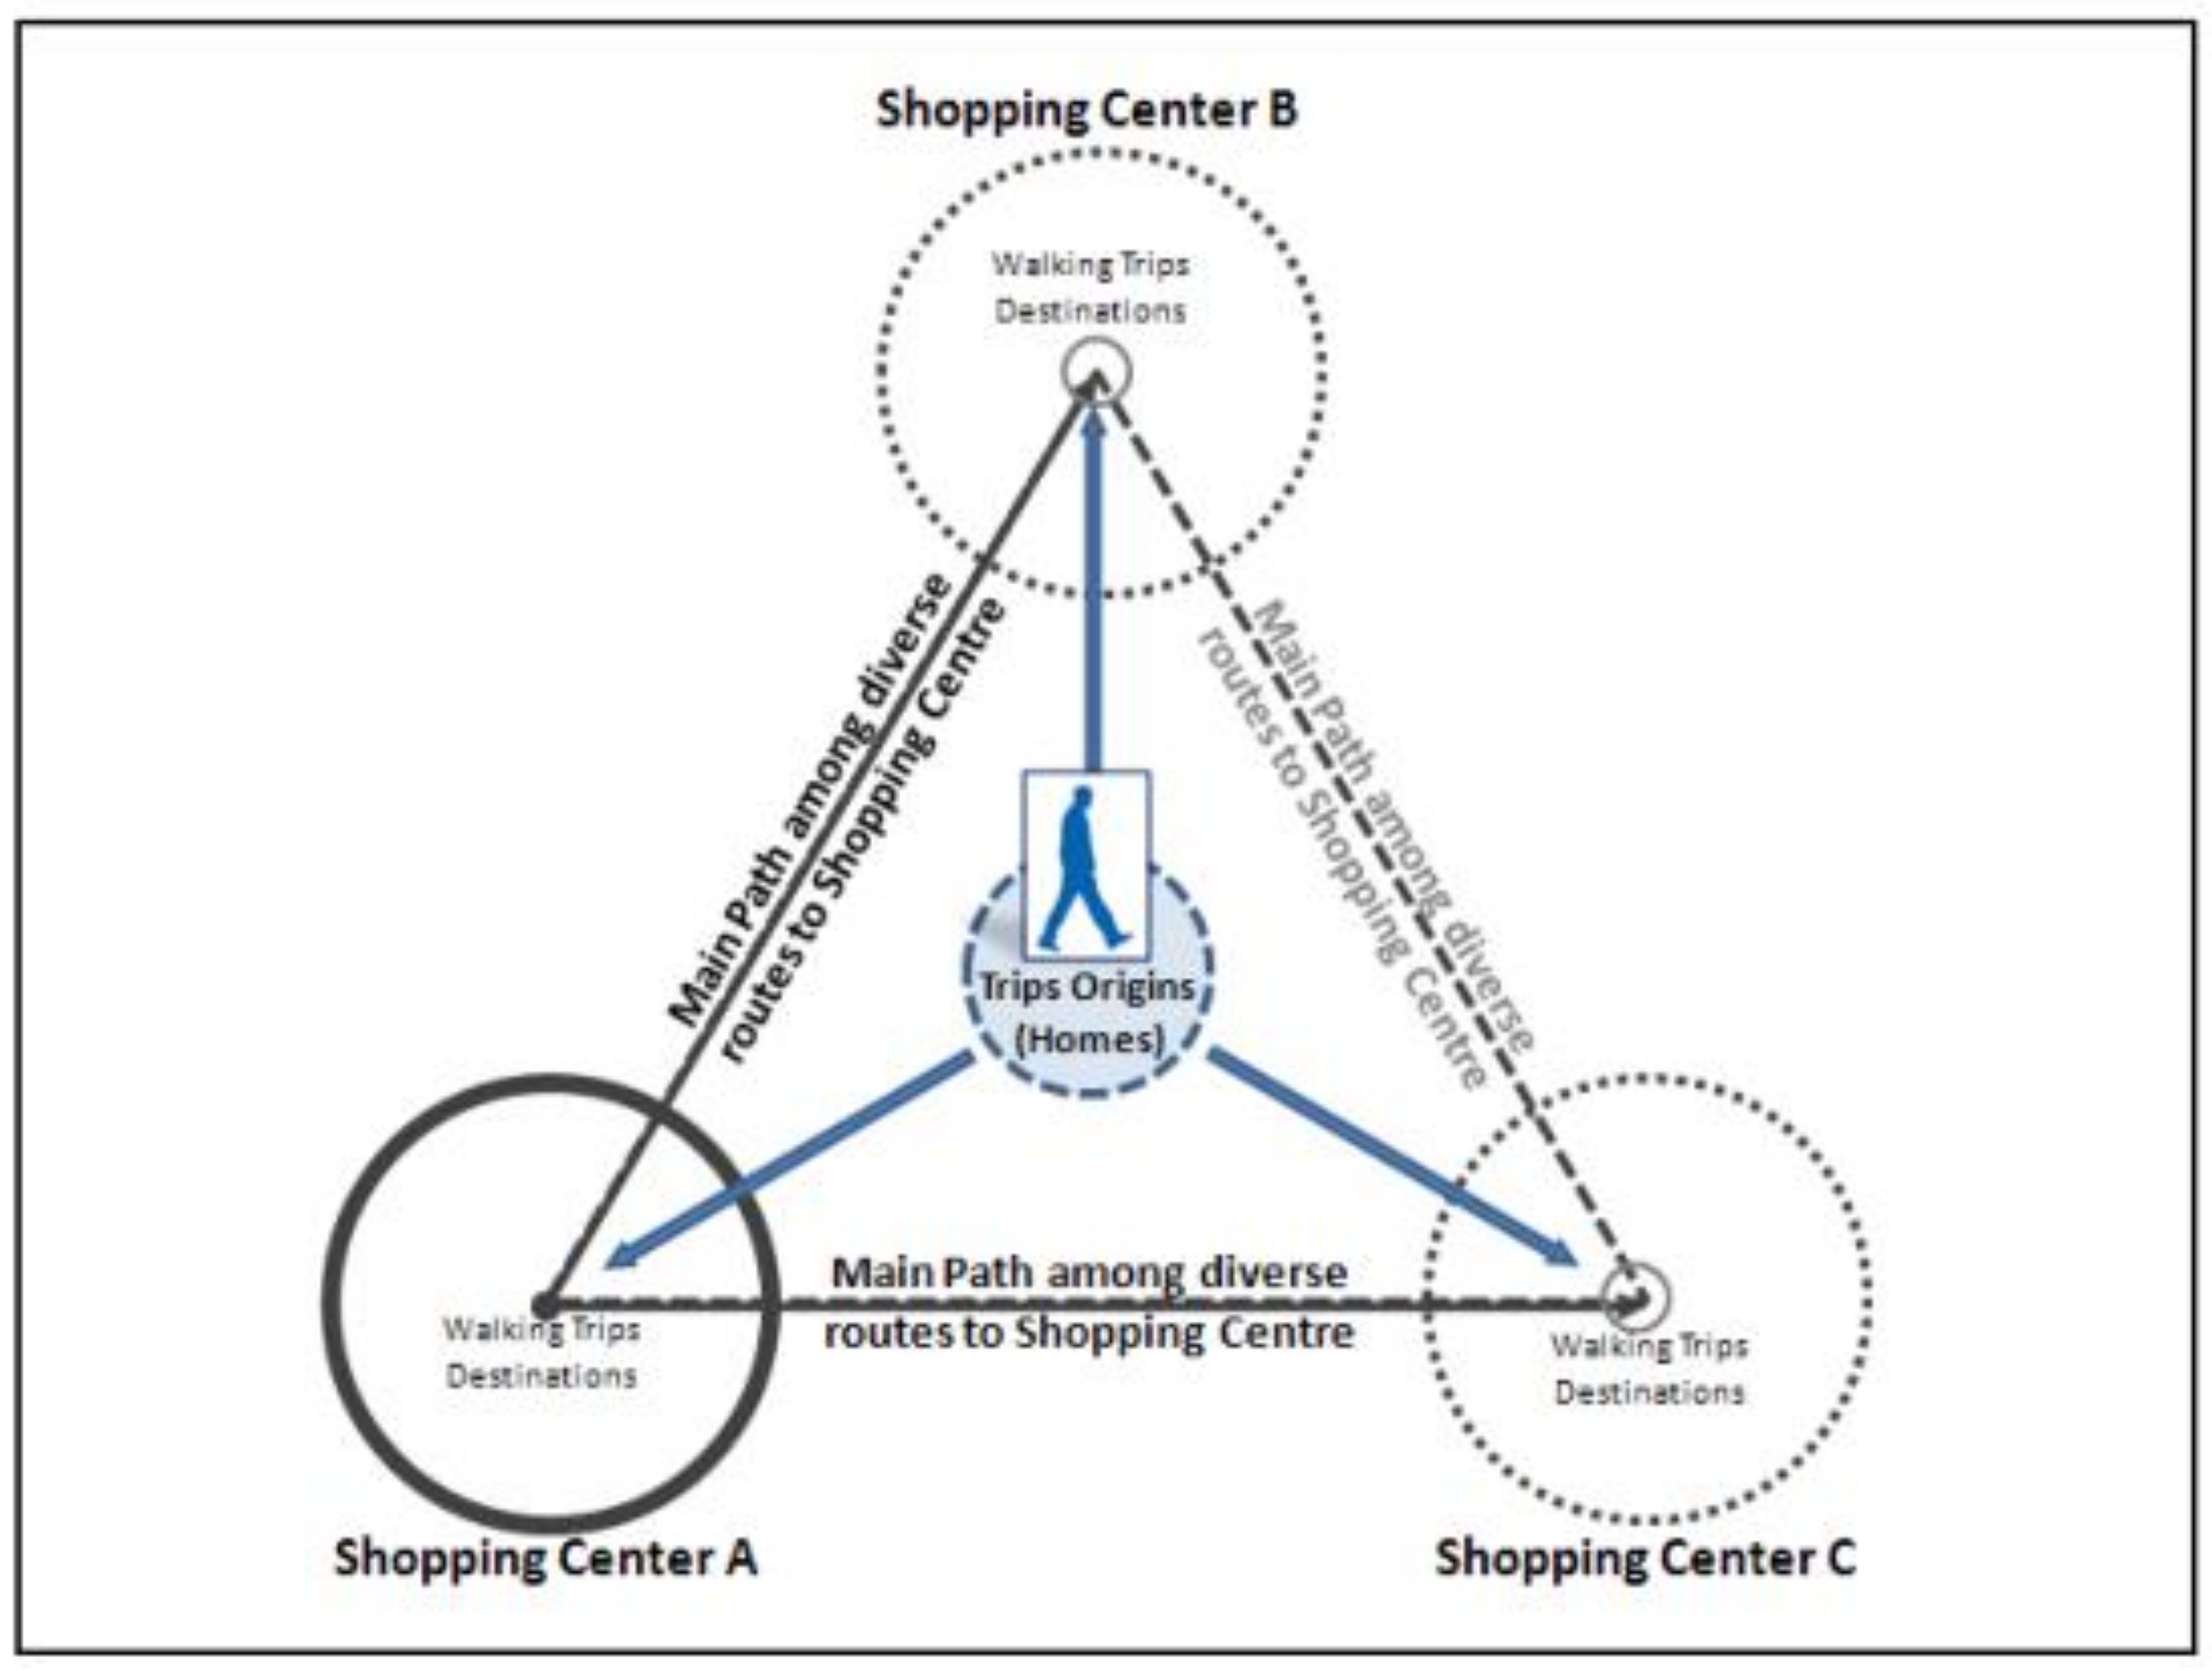
- It was located in an urban setting (not suburb) providing a high accessibility to all shopping centers.
- (2)
- It has large-scale shopping centers that can support a wide range of residents’ needs.
- (3)
- It has numerous shop-houses that function as the small-scale shops competing with those large-scale shopping centers, and accounting for a relatively large share of walking trips.
- (4)
- Distance between each pair of shopping centers is in a normal walking distance (i.e., 400–900 m, equal to 5–10 min).
- (5)
- It does not have a public space or parks, thus the shopping centers play roles as focal points that inspire neighborhood vitality and livability.
4.1. DTM Analysis
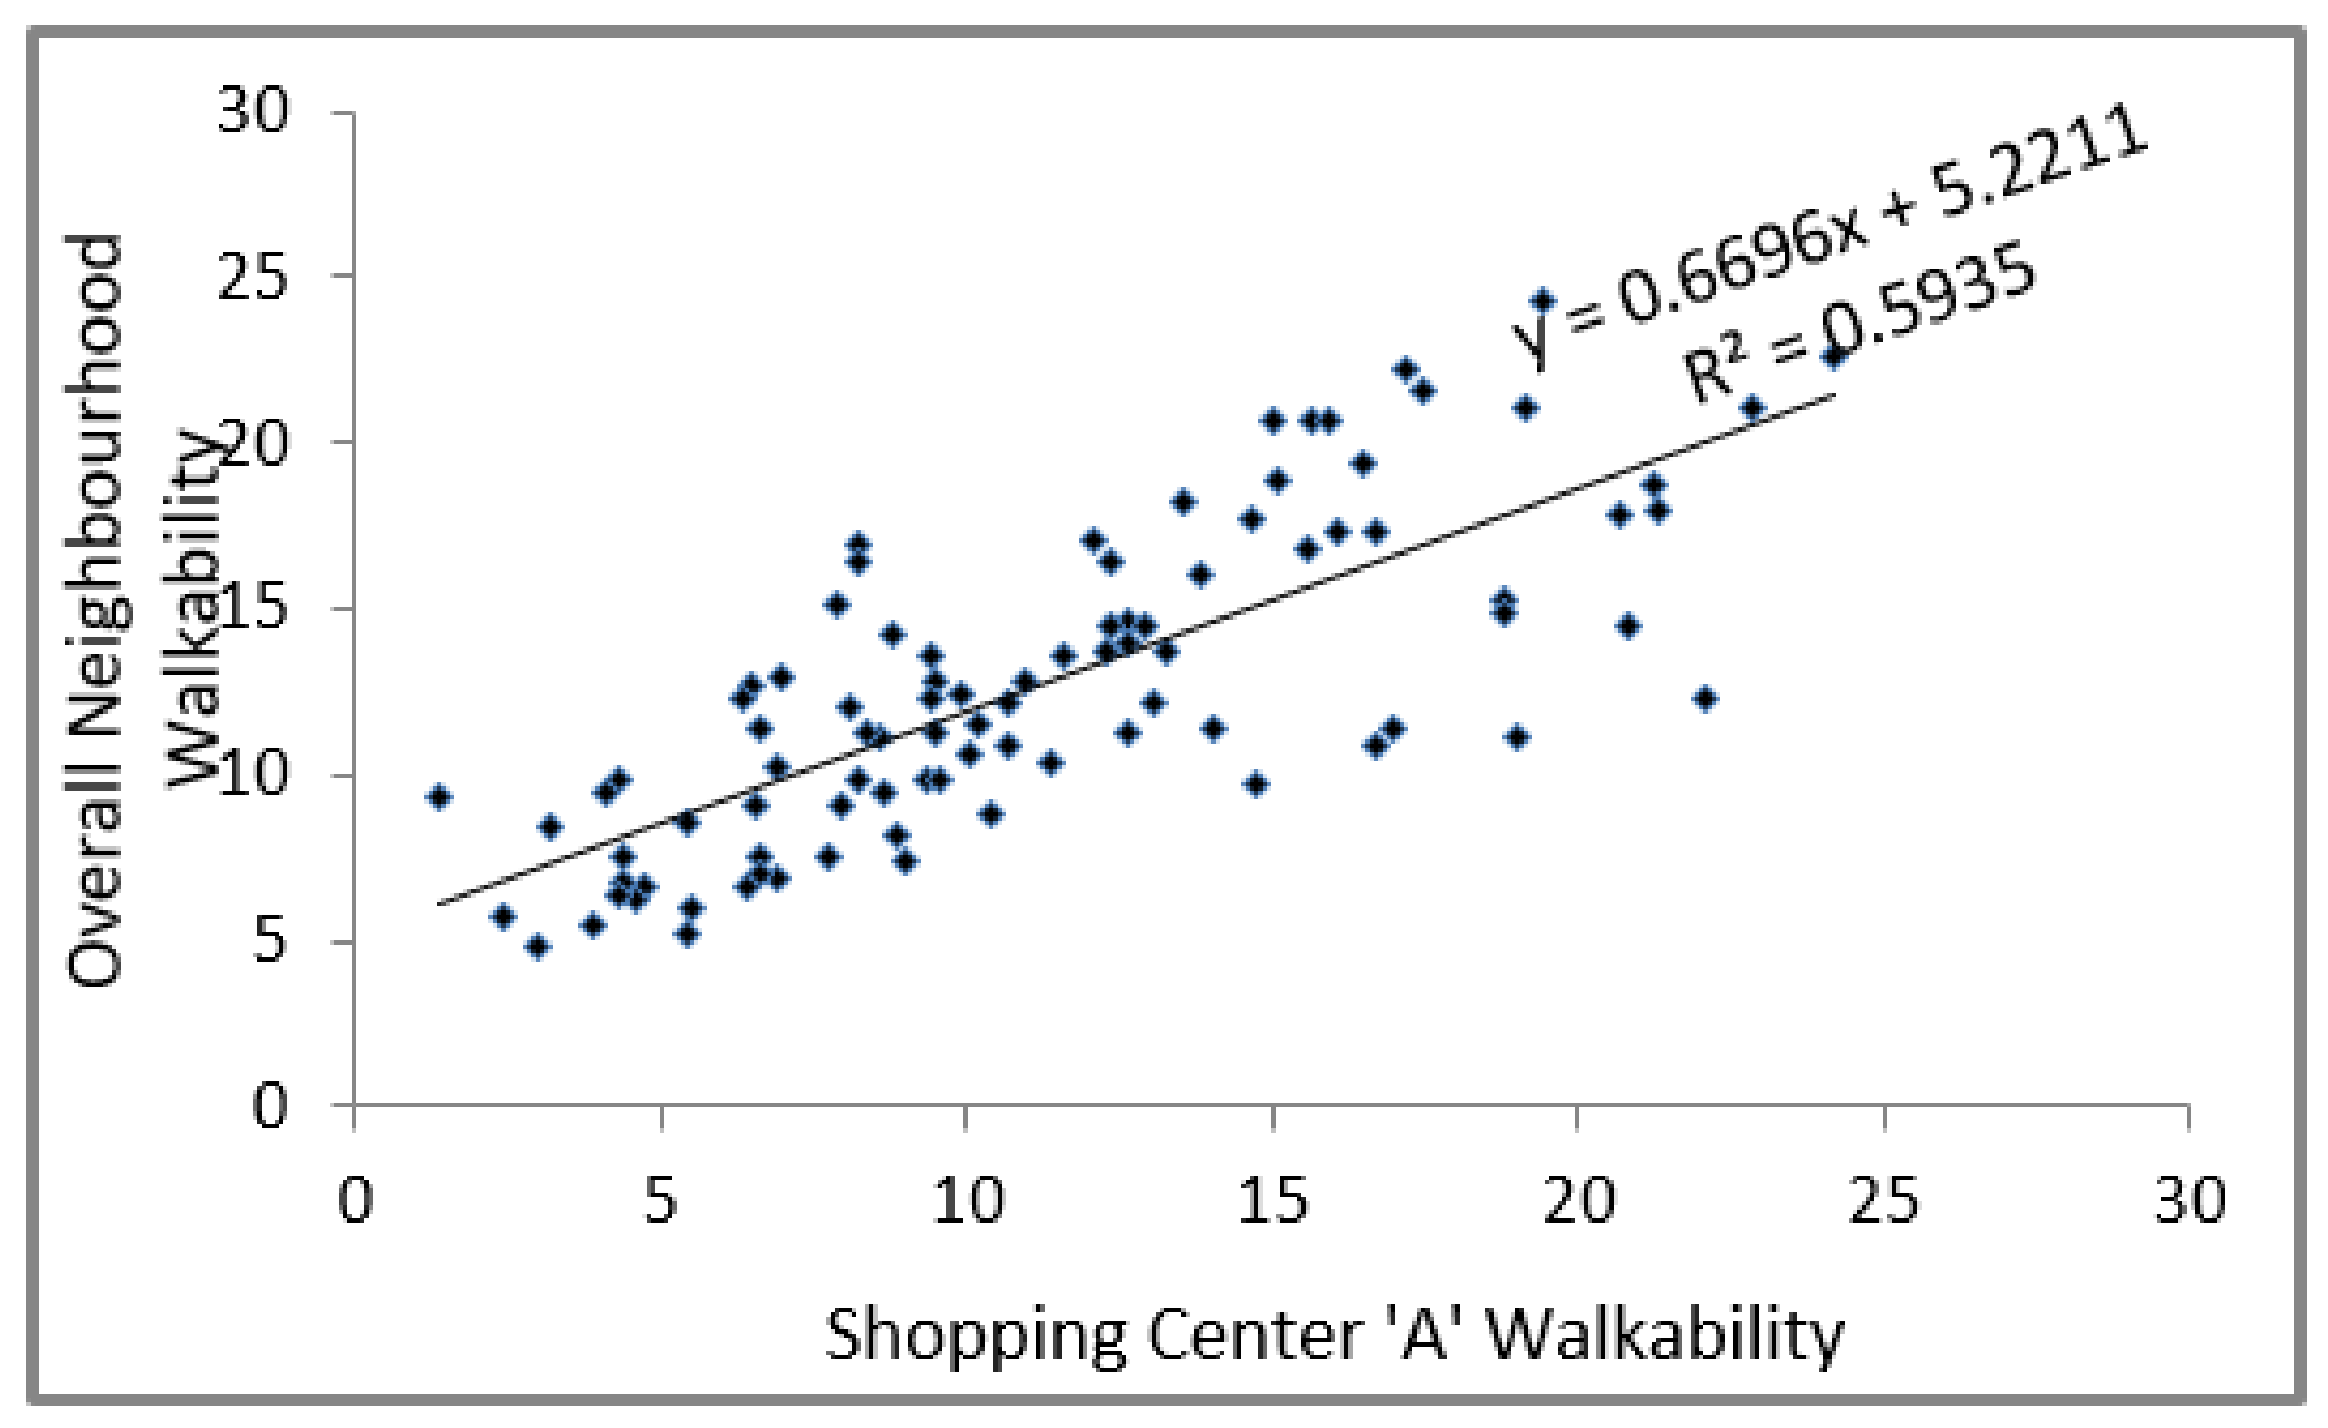
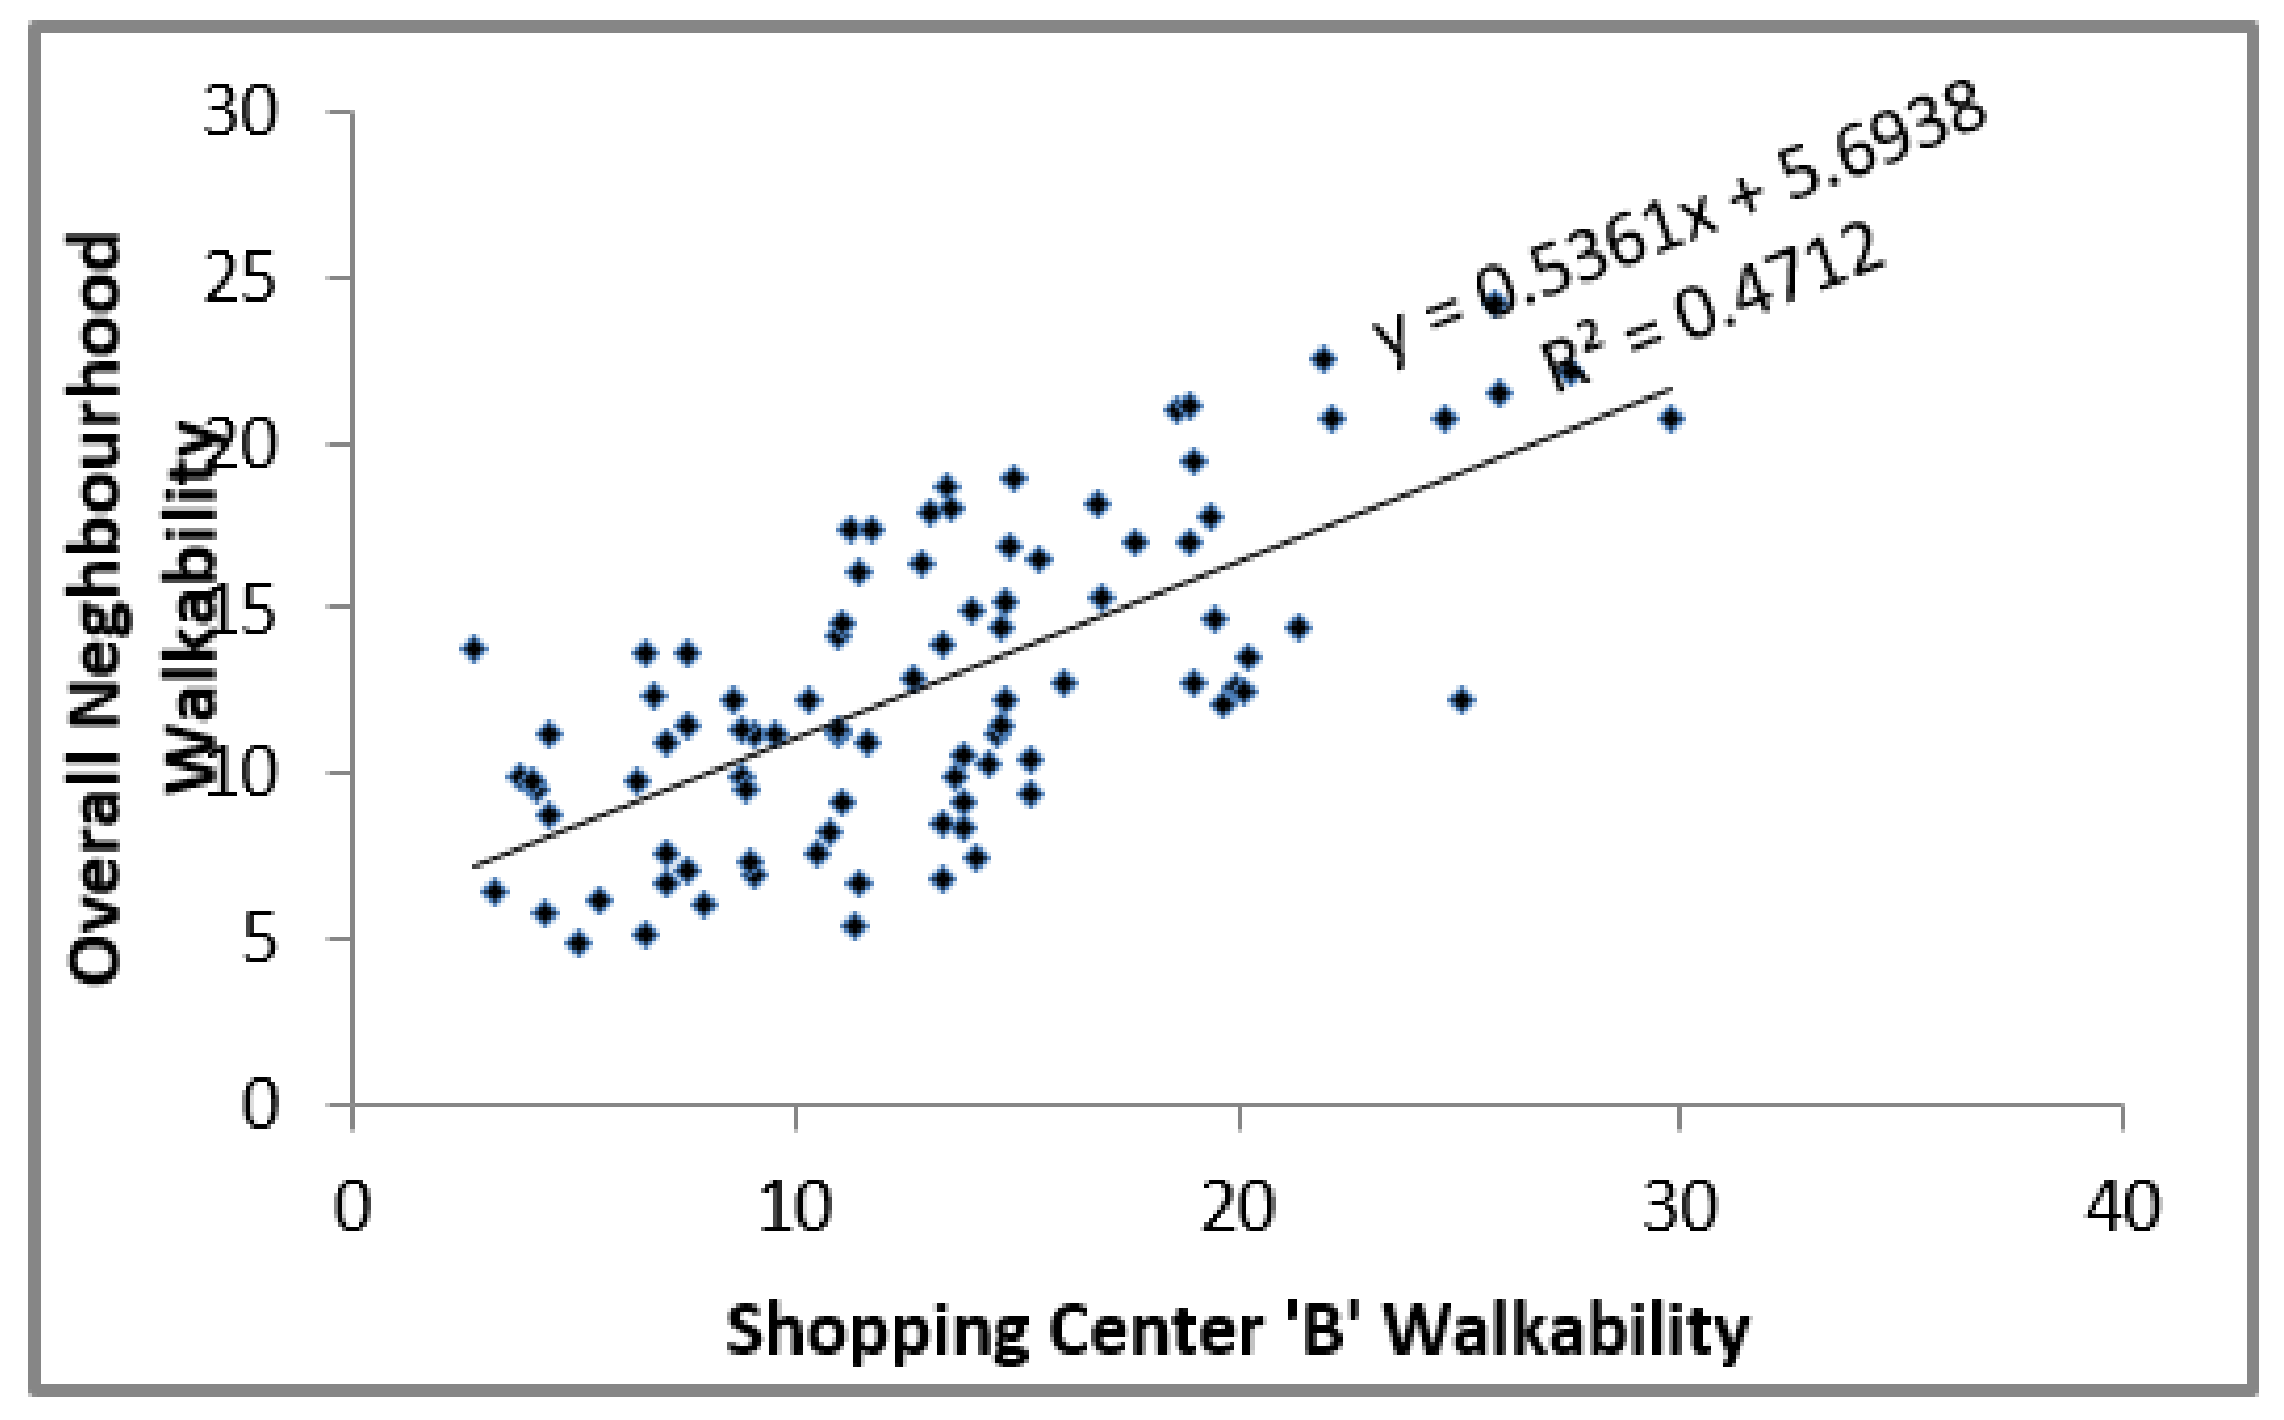
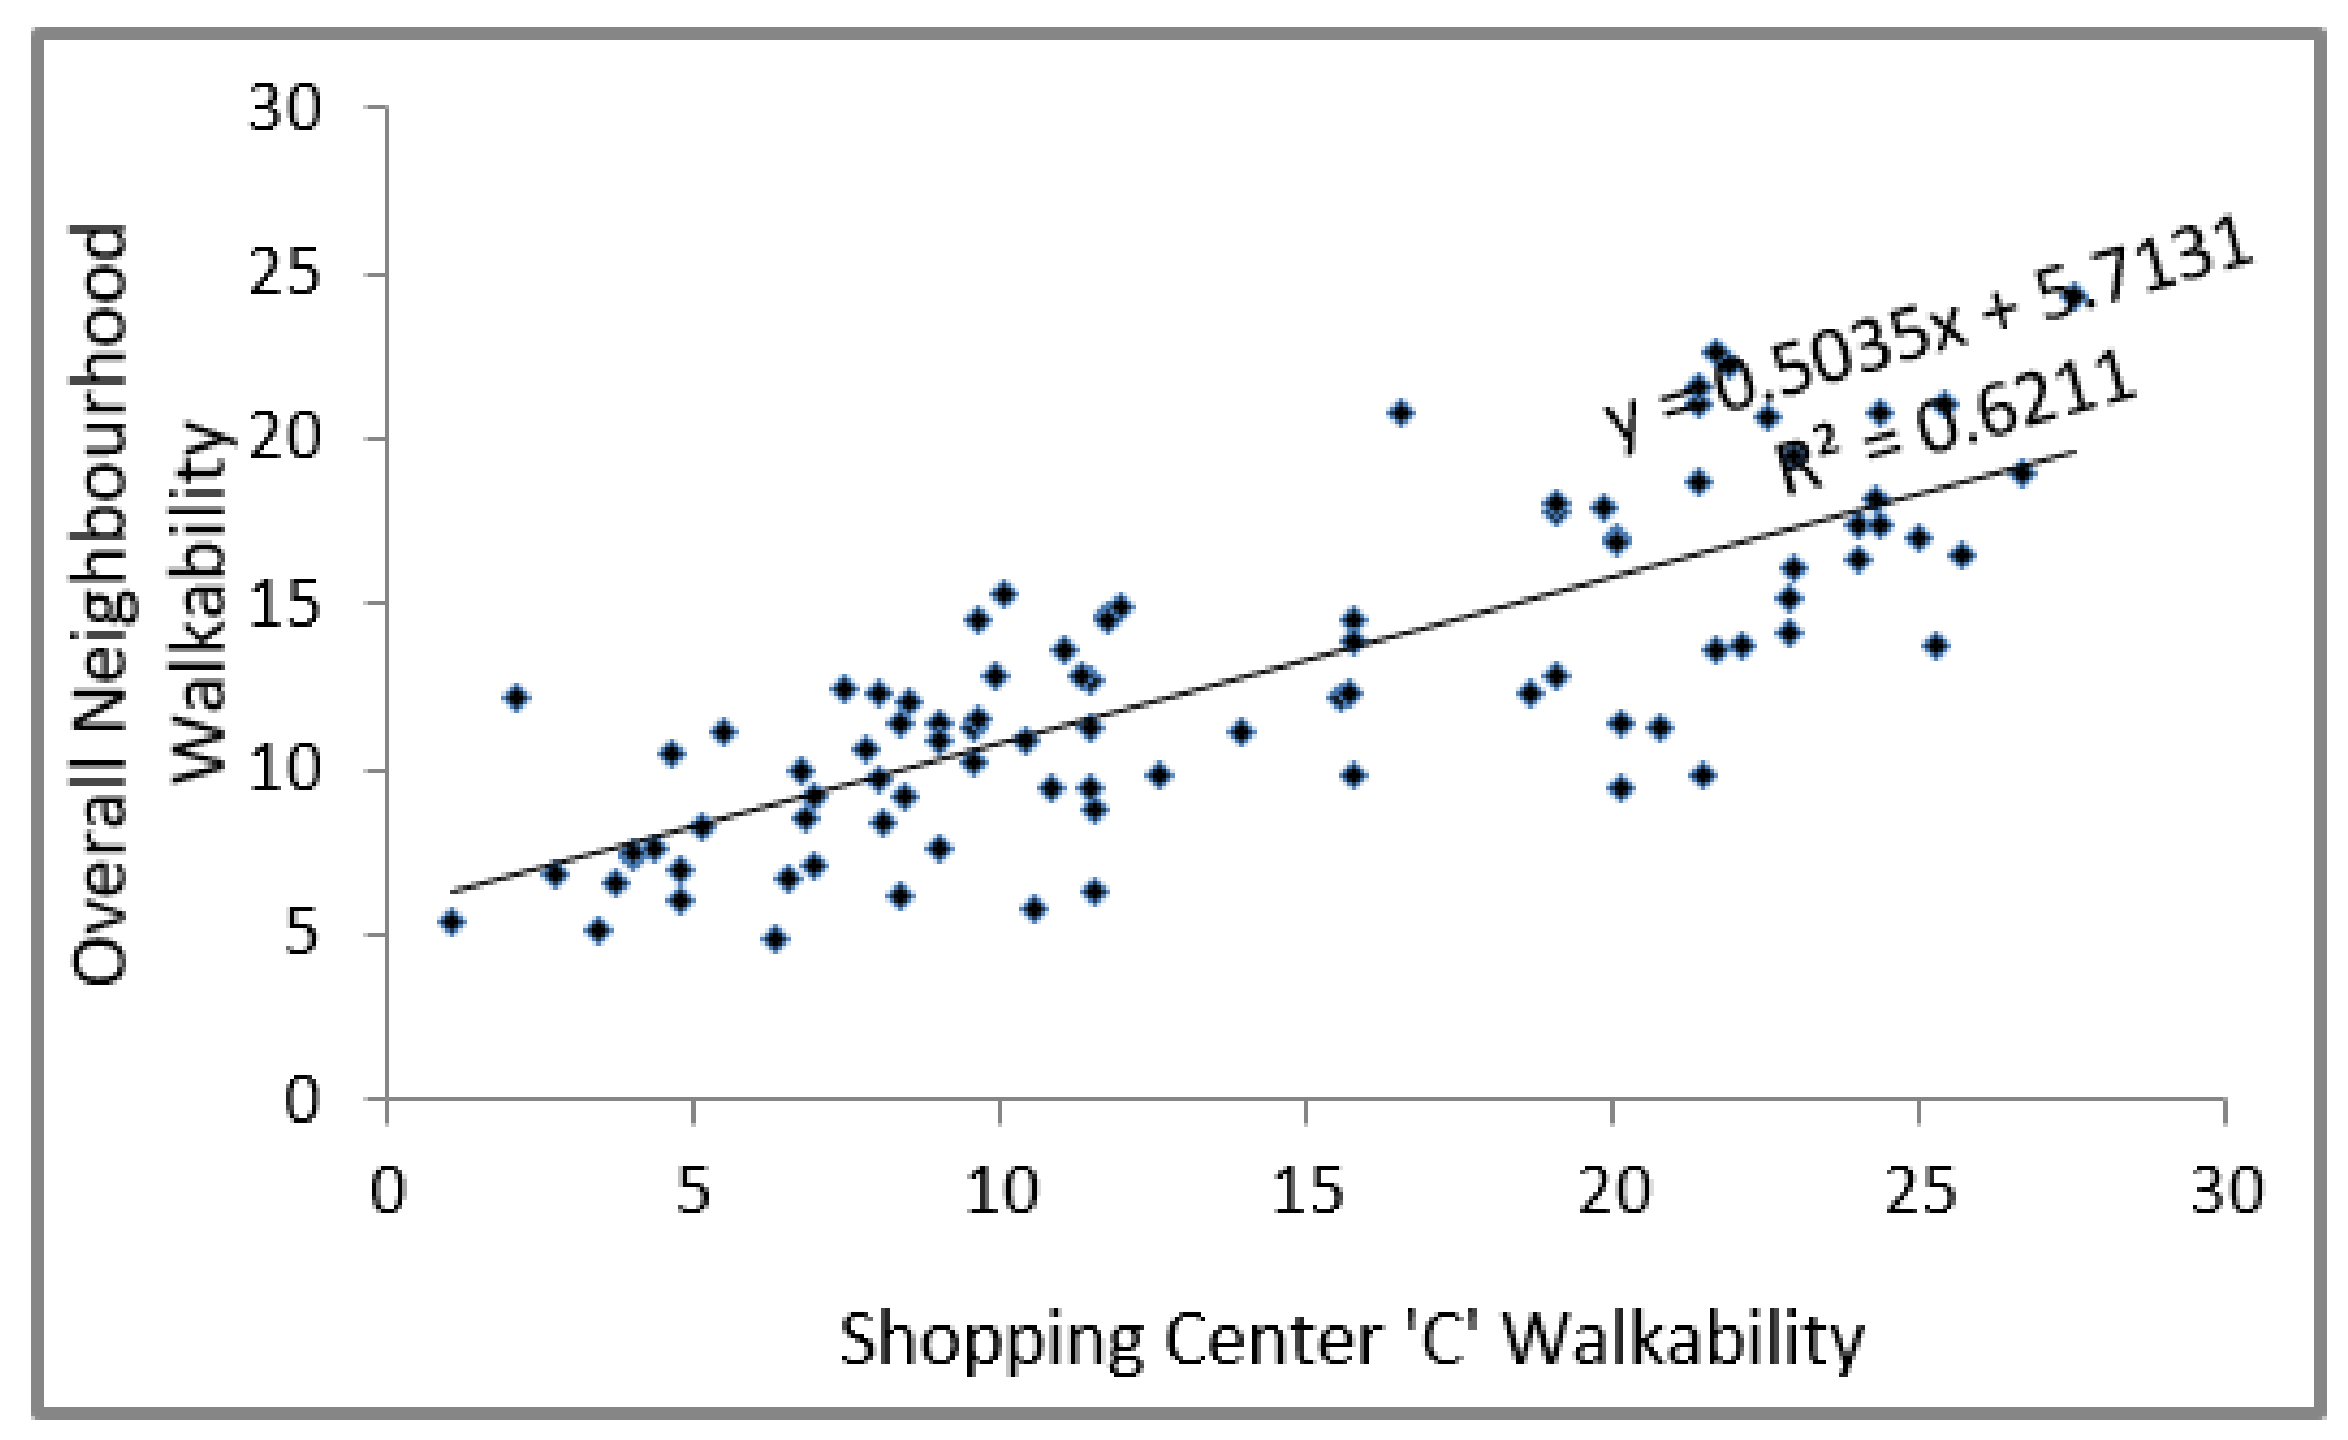
4.2. Regression Analysis
5. Results and Findings
6. Discussion
- (A)
- The focus on urban transportation networking promotes urban connectivity, accessibility, and degree of street interconnectedness for achieving a more compact city development. This approach reduces the amount of land needed for constructing road and street facilities, reduces pollution emissions and energy resource consumption, shortens walking distances, provides more route choices, and reduces the need for wide, difficult-to-cross streets, which simultaneously improves urban aesthetics and vitality, and preserves open space and parks.
- (B)
- The focus on social networking identifies inconsistencies between the “perceptual qualities” of the urban built infrastructure and measures of “qualitative variables” that relate to people’s needs and preferences for activity opportunities within the urban environment that encourage the selection of walking rather other modes of travel. Hence, the research will address the walkability qualities (both tangible and intangible) of the built environment in allowing social community networks to pursue and satisfy basic daily needs and preferences on foot.
7. Conclusions
- -
- Descriptive study on walkability index as the Smartphone Application
- -
- Formulating walkability index as a Smartphone Application
- -
- Developing a framework to assess correlation of neighborhood walkability through Smartphone Application.
Acknowledgments
Author Contributions
Conflicts of Interest
Nomenclature
| Symbol | Description |
| PWA | Path Walkability Assessment |
| DTM | Decision Tree Making |
| Features (1st layer of DTM) | |
| Criteria (2nd Layer of DTM) | |
| Sub-criteria (3rd Layer of DTM) | |
| Rr | Respondent |
| Average Weight Value of the variable | |
| The abbreviation of Rate Weight Value of the variable by rth Respondent (Rr) | |
| n | Total number of respondents |
| RWV Max | The least possible Rate Value of the Variable by Respondent |
| Actual Weight Value of each variable in 1st Layer of DTM | |
| Actual Weight Value of each variable in 2nd Layer of DTM | |
| Actual Weight Value of each variable in 3rd Layer of DTM | |
| The predicted score of an individual on the dependent variable | |
| The mean of independent variable | |
| X | The scores of dependent variables |
| The mean of dependent variable | |
| The standard deviations of X | |
| The standard deviations of Y | |
| r | Pearson correlation coefficient |
| N | Total number of the sample size |
| CSM | The Combined Scaling Method |
Appendix A

| Features (Layer 1) | Criteria (Layer 2) | Sub-Criteria (Layer 3) | Description | Citations |
|---|---|---|---|---|
| F1. Sense of Safety and Security | F1.C1. Safety facilities at sidewalks | … [F1.C1. S1] Driveway Curb-cuts, | The points along the sidewalk that interrupt pedestrian’s continuous movement by automobiles entering driveways. | [16,17,18,24,32,33,34] |
| … [F1.C1. S2] Existence of Pedestrian Crossing, | Pedestrian Crossing facilities in both segment and intersection exist in the different types, including marked crosswalk with pedestrian signal light, marked crosswalk with stop sign, marked crosswalk with hatching. | [17,18,34,35,36,37] | ||
| … [F1.C1. S3] Width of Utility Zones, | The width of the sidewalk next to the curb allotted to street facilities. | [17,24,26,33,38] | ||
| … [F1.C1. S4] Shelters, | For preservation against sun rain, and snow such as bus stations. | [26,39,40] | ||
| … [F1.C1. S5] Length of Tree Canopies, | Total length of the center-line of the sidewalk walking zone covered by the tree canopies, including those planted on the private properties. | [17,24,33,37] | ||
| … [F1.C1. S6] Releasing visual Obstacles/Nuisances, | Visual obstacles such as freeway overpass, utility poles and hanging wires make dissatisfaction on both street and sidewalk users. | [26,33,34,41] | ||
| … [F1.C1. S7] Sidewalk Steepness, | The elevation difference between the end points of the segments divided by length of the segment. | [16,24,28,33,42] | ||
| … [F1.C1. S8] Existence of Bike Lanes, | Bike Lanes would exist in both sides of the street. | [26,28,34,36,43,44] | ||
| … [F1.C1. S9] Existence of On-street Parking, | On-street parking would exist on both sides of the street in the various forms: rectangular, diagonal, parallel, and non-parking. | [17,32,39,43] | ||
| … [F1.C1. S10] Informing the intersection blindness, | It prevents continuous path of travel and cannot provide visual continuity of the streetscape. It requires additional signage which creates visual clutter | [18,25] | ||
| … [F1.C1. S11] Mid-block crossing, | The element separates two parallel streets by solid obstacle such as grail, boulevard, or lighting. | [17,24,35,43,44] | ||
| … [F1.C1. S12] Providing over-bridge | A way to get over water or a freeway for pedestrians. | [40] | ||
| F1.C2. Slowing traffic speed | … [F1.C2. S1] Existence of Pedestrian Crossing, | Pedestrian Crossing facilities in both segment and intersection exist in different types, including marked crosswalk with pedestrian signal light, marked crosswalk with stop sign, and with hatching. | [18,25,35,36,43,44] | |
| … [F1.C2. S2] Number(s) of Traffic Lanes, | The number of traffic lanes design based on volume of street. The main and secondary street would have one or two traffic lanes. | [16,17,35,36,44,45] | ||
| … [F1.C2. S3] Traffic Signals, | It is a pedestrian crossing facility located in the corner at the intersections or junctions. | [26,33,34,45,46] | ||
| … [F1.C2. S4] Traffic Calming Devices, | Traffic Calming Devices are in different forms of speed bumps, chokers, bulb-out, chicanes, street closing with bollards, raised crosswalks, textured paving treatments, diverters, crossing islands, and mini-circles. | [7,24,28,34,35,43] | ||
| … [F1.C2. S5] Drivers’ respect to pedestrian, | The manner causes drivers to slow down the speed to let pedestrians pass, especially in junctions, intersections. | [7,27,45,47,48] | ||
| … [F1.C2. S6] Slow Traffic speed | Making the mix of pedestrians, cyclists and vehicles slow and safe when lot frontages are wide. | [46] | ||
| F1.C3. Security in day and nights | … [F1.C3. S1] Sidewalk Lighting, | Lighting would be located in both sides of the streets, or in a middle along the street segment. | [24,26,35,43,44] | |
| … [F1.C3. S2] Number of Intermediary, | Similar to façade transparencies, intermediaries are objects that link public space on the sidewalk and indoor private space, such as small tables and chairs outside restaurants | [7,17,24,33,44] | ||
| … [F1.C3. S3] Length of Tree Canopies, | Total length of the center-line of the sidewalk walking zone covered by the tree canopies, including those planted on the private properties. | [17,32,39,43] | ||
| … [F1.C3. S4] Number of Street Trees, | The street trees are mostly planted between the traffic zones and sidewalk passages, excluding small trees, bushes, and private property. | [26,33,34,37,38] | ||
| … [F1.C3. S5] Releasing visual Obstacles/Nuisances, | Visual obstacles, such as freeway overpass, utility poles and hanging wires, make dissatisfaction on both street and sidewalk users. | [7,24,26,28,41,45] | ||
| … [F1.C3. S6] Not-crowded Route, | Public realm where became cluttered and have high traffic. | [7,24,40] | ||
| … [F1.C3. S7] Street Surveillance, | It limits the opportunity for crime by increasing the perception designing transparent barriers (glass walls, picket fences). | [7,24,35,40,43] | ||
| … [F1.C3. S8] Street-Facing Entrances, | Street-facing entrances are in relationship with the orientation of the doors, proximity to the sidewalk (not more than 70 feet). | [35,43,45,47,49,50,51] | ||
| … [F1.C3. S9] Street-level Façade Transparency, | The degree of visual access of pedestrians into the inside of adjacent buildings. It is mainly indicated by proportion of glass windows on façade. | [28,34,42,49,50,51] | ||
| … [F1.C3. S10] First Floor Use of Buildings, | The first floor use of buildings in the segment are different; commercial, residential, office, industrial, and institutional. | [7,16,22,24,45,50] | ||
| … [F1.C3. S11] Upper-Floor Windows | The windows facing the street in the segment in the second and third floors. | [28,45,50,51] | ||
| F2. Connectivity | F2.C1. Sidewalk accessibility | … [F2.C1. S1] Sidewalks networking, | The linkages among the sidewalk routes which connects them tightly and systematically. | [49,50,52] |
| … [F2.C1. S2] Length of Sidewalks, | A sidewalk is defined as a linear space for pedestrians separated from traffic zones by physical devices, such as vertical curb, bollards, or fences. | [26,28,33,34,40,44] | ||
| … [F2.C1. S3] Width of Walking Zones, | The width of the clear passageway for pedestrians on the sidewalk excluding the utility zones. | [7,24,26,33,38] | ||
| … [F2.C1. S4] Continuity to diverse activity, | Proper hierarchical understanding of places as physical, social and psychological dimensions of human experience. | [18,25,27,45,47] | ||
| … [F2.C1. S5] Length of Segments, | The length between the center points of the two intersections along the street segment. | [17,28,40,44,45] | ||
| … [F2.C1. S6] Informing the Intersection blindness, | It prevents continuous path of travel and cannot provide visual continuity of the streetscape. It requires additional signage which creates visual clutter | [17,38] | ||
| … [F2.C1. S8] Street signage | Different sings to show the rule or functions of that specific place. | [7,16,22,53] | ||
| F2.C2. Physical connectivity | … [F2.C2. S1] Sidewalk steepness, | The elevation difference between the end points of the segments divided by length of the segment. | [7,16,17,24,42,44,45,54] | |
| … [F2.C2. S2] Street-Facing Entrances, | Street-facing entrances are in relationship with the orientation of the doors, proximity to the sidewalk. | [35,43,45,47,50,51] | ||
| … [F2.C2. S3] Street Signage, | Different sings to show the rule or functions of that specific place. | [7,24,27,53] | ||
| … [F2.C2. S4] Length of Segment | The length between the center points of the two intersections along the street segment. | [17,28,40,44,45] | ||
| F3. Comfort | F3.C1. Physical comfort | … [F3.C1. S1] Well-locating of service utilities, | The service facilities need to be arranged and located properly within the walkable area not to compromise the walking activity. | [35,43,44,45] |
| … [F3.C1. S2] Amount of Street Furniture, | There are many types of street furniture, such as benches, seating facilities, lighting, trashes, and drinking fountains. | [17,26,33,34,37,38,45] | ||
| … [F3.C1. S3] Sidewalk Lighting, | Lighting would be located in both sides of the streets, or in a middle along the street segment. | [17,18,24,25,26,44,45,55] | ||
| … [F3.C1. S4] Number of Intermediary, | Similar to façade transparencies, intermediaries are objects that link public space on the sidewalk and indoor private space, such as small tables and chairs outside restaurants. | [17,26,33,34,37] | ||
| … [F3.C1. S5] Shelters, | For preservation against sun, rain, and snow such as bus stations | [26,28,40] | ||
| … [F3.C1. S6] Planting deciduous trees, | Planting deciduous trees in both sides of streets for providing shading during a year. | [45,54] | ||
| … [F3.C1. S7] Existence and width of medians, | The elements along the street segments separate it into two sides. | [17,26,36,37,45,54] | ||
| … [F3.C1. S8] Existence of On-street Parking, | The places are design in the edge of streets for vehicle parking. | [45,50] | ||
| … [F3.C1. S9] Human Ergonomic Scale Design | It is the scientific discipline concerned with the understanding of the interactions among humans and other elements of a street and urban system. | [5,6,31,33,34,41,48,52,56,57,58] | ||
| F3.C2. Environmentally comfort | … [F3.C2. S1] Width of Walking Zones, | The width of the clear passageway for pedestrians on the sidewalk excluding the utility zones. | [17,26,33,34,38] | |
| … [F3.C2. S2] Types of Sidewalk Pavement, | The sidewalk pavements are various, such as colored/patterned concrete, bricks, cobblestones, asphalt, or dirt. | [26,33,34,35,36,37,38,39,40,41,42,43,44,45] | ||
| … [F3.C2. S3] Number of Street Trees, | The street trees are mostly planted between the traffic zones and the sidewalk passages, excluding small trees, bushes, and private property. | [17,26,33,34,38] | ||
| … [F3.C2. S4] Sidewalk Steepness, | The elevation difference between the end points of the segments divided by length of the segment. | [5,6,31,33,48,52,56] | ||
| … [F3.C2. S5] Windy climate, | Places or routes cannot break the wind by design or planting which makes air circulation. | [26,39] | ||
| … [F3.C2. S6] Not-crowded Route, | Public realm where became cluttered and have high traffic. | [28,40] | ||
| … [F3.C2. S7] Height and types of Fences, | There are different types of fences; chain-link, barbed wire, iron bars, and wood board. | [45,50,51,54] | ||
| … [F3.C2. S8] Street reserve | The land set aside for a street carriageway and verge incorporating the full width from property line to opposite property line. | [7,27,48] | ||
| F4. Convenience | F4.C1. Functionality of diverse activities | … [F4.C1. S1] Number(s) of Traffic Lanes, | The number of traffic lanes design based on volume of street. The main and secondary street would have one or two traffic lanes. | [17,35,36,37,45] |
| … [F4.C1. S2] Existence and width of medians, | The elements along the street segments separates it into two sides | [17,35,37,45] | ||
| … [F4.C1. S3] Length of Segment, | The length between the center points of the two intersections along the street segment. | [17,28,33,40,45] | ||
| … [F4.C1. S4] Width of Traffic Zones, | Width of the moving traffic excluding on-street parking, bike lanes, left/right turn lanes, and medians. | [16,33,34,38,43] | ||
| … [F4.C1. S5] Widths of Buildings | Widths of buildings include garages and other structures with walls within each property. Normally, the buildings which are setback more than 70 feet from the property lines | [26,36,37,45,54] | ||
| F4.C2. Easy access without obstacles | … [F4.C2. S1] Releasing visual Obstacles/Nuisances, | Visual obstacles such as freeway overpass, utility poles and hanging wires make dissatisfaction on both street and sidewalk users. | [7,16,22,41,53] | |
| … [F4.C2. S2] Traffic Signals, | It is a pedestrian crossing facility located in the corner at the intersections or junctions. | [18,22,46] | ||
| … [F4.C2. S3] Sidewalk Steepness, | The elevation difference between the end points of the segments divided by length of the segment. | [7,19,22,53] | ||
| … [F4.C2. S4] Not-crowded Route, | Public realm where became cluttered and have high traffic. | [28,40] | ||
| … [F4.C2. S5] Existence of On-street Parking, | On-street parking would exist in both sides of the street in the various forms; rectangular, diagonal, parallel, and non-parking. | [28,35,40,44,45] | ||
| … [F4.C2. S6] Mid-block crossing, | The element separates two parallel streets by solid obstacle such as grail, boulevard, or lighting. | [28,40,45] | ||
| … [F4.C2. S7] Height and types of Fences, | There are different types of fences; chain-link, barbed wire, iron bars, and wood board. | [31,40,44,45,51] | ||
| … [F4.C2. S8] Public parking next to street, | The places are design in the edge of streets for vehicle parking. | [45,54] | ||
| … [F4.C2. S9] Slow Traffic speed | Making the mix of pedestrians, cyclists and vehicles slow and safe when lot frontages are wide. | [46] | ||
| F5. Attractiveness and Aesthetic | F5.C1. Street enclosure | … [F5.C1. S1] Width of Curb-to-Curb Roadway, | Pedestrian Crossing facilities in both segment and intersection exist in the different types, including marked crosswalk with pedestrian signal light, marked crosswalk with stop sign, marked crosswalk with hatching. | [7,16,22,53] |
| … [F5.C1. S2] Width of Utility Zones, | The width of the sidewalk next to the curb allotted to street facilities. | [26,38,45] | ||
| … [F5.C1. S3] Building Setbacks, | The building setback is the distance between the edge of sidewalk and the primary façade line of building or walls. | [28,34,50,51] | ||
| … [F5.C1. S4] Width of buffer zone, | Width of buffers on the both sides of the street where is the space between edge of traffic lane and the clear passage of the sidewalk. | [28,34,50,54,59,60] | ||
| … [F5.C1. S5] Street reserve, | The land set aside for a street carriageway and verge incorporating the full width from property line to opposite property line. | [7,48,56] | ||
| … [F5.C1. S6] Diversity of buildings, | The diversity in building functions and shapes make diverse destinations for pedestrian who can memorize them as the landmarks. | [17,33] | ||
| … [F5.C1. S7] Mixed functionality of Adjacent Buildings, | It is one of the major determinants of travel behavior by resident. It is interaction between commercial and residential uses which is the combination of public uses, employment uses. | [17,28,33,40,45,50] | ||
| … [F5.C1. S8] Enclosure ratio, | It the ratio of average building-to-building distance to average building height of the street segment | [7,24,28,34,51] | ||
| F5.C2. Vibrancy and vitality | … [F5.C2. S1] Planting diversity, | The diversity in landscape and planting make diverse functions and roles through the paths and spaces for pedestrians. | [42,54] | |
| … [F5.C2. S2] Sidewalk Lighting, | Lighting would be located in both sides of the streets, or in a middle along the street segment. | [7,17,24,26,33,38] | ||
| … [F5.C2. S3] Width of Landscaping Strips, | Width of the landscaping strips on both sides of the street. | [7,24,26,33,35,43] | ||
| … [F5.C2. S4] Types of Sidewalk Pavement, | The sidewalk pavements are various, such as colored/patterned concrete, bricks, cobblestones, asphalt, or dirt. | [17,26,33,35] | ||
| … [F5.C2. S5] Intangible Senses, | An asset that cannot be perceived by the senses, such as smelling of flowers | [7,27,31,57] | ||
| … [F5.C2. S6] Planting deciduous trees, | Planting deciduous trees in both sides of streets for providing shading during a year. | [28,34] | ||
| … [F5.C2. S7] Length of Tree Canopies, | Total length of center-line of the sidewalk zone covered by the tree canopies, including those planted on the private properties. | [28,34,40,44,45] | ||
| … [F5.C2. S8] Number of Street Trees, | The street trees are mostly planted between the traffic zones and the sidewalk passages, excluding small trees less (less than five inches), bushes, and private property. | [17,28,40,44,45] | ||
| … [F5.C2. S9] Vital Atmosphere in sidewalks, | Complex of intangible characteristics of place make it attractive to actual and potential residents and influences their behavior in observable ways. | [25,31,35,36,43,44,58] | ||
| … [F5.C2. S10] Street Interface | Using streetscape treatments as transitional elements between commercial and residential areas. | [26,38,45] | ||
| … [F5.C2. S11] Heights of Buildings, | Vertical measure of the building located in both sides of the street, which should balance with the street width and adjacent buildings. | [7,24,35,40,43] | ||
| … [F5.C2. S12] Upper-Floor Windows, | The windows facing the street in the segment in the second and third floors. | [26,38,45,61] | ||
| … [F5.C2. S13] Skyline height | The line along the surface of the earth and the sky appear to meet. | [26,38,45,51] |
References
- Mikalsen, R.; Wang, Y.; Roskilly, A. A comparison of Miller and Otto cycle natural gas engines for small scale CHP applications. Appl. Energy 2009, 86, 922–927. [Google Scholar] [CrossRef]
- Bereitschaft, B. Equity in Microscale Urban Design and Walkability: A Photographic Survey of Six Pittsburgh Streetscapes. Sustainability 2017, 9, 1233. [Google Scholar] [CrossRef]
- Blecic, I.; Canu, D.; Cecchini, A.; Congiu, T.; Fancello, G. Walkability and Street Intersections in Rural-Urban Fringes: A Decision Aiding Evaluation Procedure. Sustainability 2017, 9, 883. [Google Scholar] [CrossRef]
- National Centre for Chronic Disease Prevention and Health Promotion (CDC). 2017. Available online: http://www.cdc.gov/chronicdisease/about/foa.htm (accessed on 30 September 2017).
- Clifton, K.J.; Livi, S.L.; Andrea, D.; Rodriguez, D. The development and testing of an audit for the pedestrian environment. J. Landsc. Urban Plan. 2007, 80, 95–110. [Google Scholar] [CrossRef]
- New Zealand Transport Agency. 2009. Available online: http://www.nzta.govt.nz/resources/planning-policy-manual/index.html (accessed on 30 January 2017).
- Frank, L.D.; Sallis, J.; Saelens, R.; Leary, L.; Cain, K.; Conway, T.L.; Hess, P.M. Application to the Neighborhood Quality of Life Study. J. Sports Med. 2011, 44, 924–933. [Google Scholar]
- Gindroz, R.; Levine, K. The Urban Design Handbook: Techniques and Working Methods; WW Norton & Company: New York, NY, USA, 2002. [Google Scholar]
- Zhang, Y.; Li, Y.; Liu, Q.; Li, C. The built environment and walking activity of the elderly: An empirical analysis in the Zhongshan metropolitan area, China. Sustainability 2014, 6, 1076–1092. [Google Scholar] [CrossRef]
- Addy, C.L.; Wilson, D.K.; Kirtland, K.A.; Ainsworth, B.E.; Sharpe, P.; Kimsey, D. Associations of Perceived Social and Physical Environmental Supports with Physical Activity and Walking Behaviour. Am. J. Public Health 2004, 94, 440–443. [Google Scholar] [CrossRef] [PubMed]
- Rimer, B.K.; Glanz, K. Theory at Glance: A Guide for Health Promotion Practice; National Cancer Institute, National Institutes of Health, U.S Department of Health and Human Services: Washington, DC, USA, 2005.
- Rimer, B.K. Models of individuals health behaviour. In Health Behavior and Health Education: Theory, Research, and Practice, 4th ed.; Glanz, K., Rimer, B.K., Viswanath, K., Eds.; Jossey-Bass: San Francisco, CA, USA, 2008. [Google Scholar]
- Titze, S.; Giles-Corti, B.; Knuiman, M.W.; Pikora, T.J.; Timperio, A.; Bull, F.C.; Van Niel, K. Associations between intrapersonal and neighborhood environmental characteristics and cycling for transport and recreation in adults: Baseline results from the RESIDE study. J. Phys. Act. Health 2010, 7, 423–431. [Google Scholar] [CrossRef] [PubMed]
- Shafray, E.; Kim, S. A Study of Walkable Spaces with Natural Elements for Urban Regeneration: A Focus on Cases in Seoul, South Korea. Sustainability 2017, 9, 587. [Google Scholar] [CrossRef]
- Shafaghat, A. Path Walkability Assessment Framework Based on Decision Tree Analysis of Pedestrian Travelers’ Retail Walking. Ph.D. Thesis, Universiti Teknologi Malaysia, Bundesstaat Johor, Malaysia, 2013. [Google Scholar]
- Ewing, R.; Handy, S.; Brownson, L.; Clemente, O. Identifying and Measuring Urban Design Qualities Related to Walkability. In Proceedings of the Transportation Research Board Annual Meeting, Banff, AB, Canada, 11–14 February 2006. [Google Scholar]
- Harkey, D.L.; Zegeer, C. PEDSAFE: Pedestrian Safety Guide and Countermeasure Selection System; Report of Grant no. DTFH61-99-X-00003; University of North Carolina, Highway Safety Research Center: Chapel Hill, NC, USA, 2004. [Google Scholar]
- Moudon, A.V.; Hess, P.; Matlick, J.M.; Pergakes, N. Pedestrian location identification tools: Identifying suburban areas with potentially high latent demand for pedestrian travel. Transp. Res. Rec. 2012, 1818, 94–101. [Google Scholar] [CrossRef]
- Clean Air Initiative for Asian Cities Center. 2011. Available online: http://www.pciaonline.org/node/114 (accessed on 30 May 2017).
- Michael, Y.L.; Keast, E.M.; Chaudhury, H.; Day, K.; Mahmood, A.; Sarte, A.F.I. Revising the senior walking environmental assessment tool. Prev. Med. 2009, 48, 247–249. [Google Scholar] [CrossRef] [PubMed]
- Zegeer, C.V.; Carter, D.L.; Hunter, W.W.; Stewart, J.R.; Huang, H.; Do, A.H.; Sandt, L.S. Index for Assessing Pedestrian Safety at Intersections. Transp. Res. Rec. 2006, 982, 76–83. [Google Scholar] [CrossRef]
- Hoehner, C.M.; Ivy, A.; Brennan Ramirez, L.K.; Handy, S.L.; Brownson, R.C. The Active Neighborhood Checklist: A reliable and user-friendly tool for assessing activity-friendliness. Am. J. Health Promot. 2007, 21, 534–537. [Google Scholar] [CrossRef] [PubMed]
- Dannenberg, A. Assessing the walkability of the workplace: A new audit. In Proceedings of the 4th National Congress of Pedestrian Advocates, America Walks, Silver Spring, MD, USA, 6–8 May 2004. [Google Scholar]
- Saelens, B.E.; Sallis, J.F.; Black, J.B.; Chen, D. Neighborhood-based differences in physical activity: An environment scale evaluation. Am. J. Public Health 2003, 93, 1552–1558. [Google Scholar] [CrossRef] [PubMed]
- Moudon, A.V.; Lee, C.; Cheadle, A.; Garvin, C.; Jonson, D.; Schmid, T.; Weathers, R.; Lin, L. Operational Definitions of Walkable Neighborhood: Theoretical and Empirical Insights. J. Phys. Act. Health 2006, 3, 99–117. [Google Scholar] [CrossRef] [PubMed]
- Dixon, L. Bicycle and pedestrian level of service performance measures and standards for congestion management systems. Transp. Res. Rec. 1996, 1538, 1–9. [Google Scholar] [CrossRef]
- Frank, L.D.; Pivo, G. Impacts of mixed use and density on utilization of three modes of travel: Single-occupant vehicle, transit, and walking. Transp. Res. Rec. 1994, 1466, 44–52. [Google Scholar]
- Boarnet, M.G.; Crane, R. The influence of land use on travel behavior: Specification and estimation strategies. Transp. Res. A 2001, 35, 823–845. [Google Scholar] [CrossRef]
- Babiano, I.M. Sustainable + Mobility + Management: Pedestrian Space Management as a Strategy in Achieving Sustainable Mobility; Susatinability Marketing Managmnet and Consumtion, Summer Academy, University of St. Gallen: St. Gallen, Switzerland, 2003. [Google Scholar]
- Painter, K. The influence of street lighting improvements on crime, fear and pedestrian street use, after dark. Landsc. Urban Plan. 1996, 35, 193–201. [Google Scholar] [CrossRef]
- Kockelman, K.M. Travel behavior as function of accessibility, land use mixing, and land use balance: Evidence from San Francisco Bay area. Transp. Res. Rec. 1997, 1607, 116–125. [Google Scholar] [CrossRef]
- Bradshaw, C. Creating and using a rating system for neighborhood walkability: Towards an agenda for local heroes. In Proceedings of the 14th International Pedestrian Conference, Boulder, CO, USA, 1 October 1993. [Google Scholar]
- Lynch, K.; Gary Hack, G. Site Planning, 3rd ed.; Maple-vail Inc.: Cambridge, MA, USA, 1984. [Google Scholar]
- Boarnet, M.G. The Built Environment and Physical Activity: Empirical Methods and Data Resource; University of California Transportation Center: Berkeley, CA, USA, 2003. [Google Scholar]
- Southworth, M.; Ben-Joseph, E. Reconsidering the cul-de-sac. ACCESS Mag. 2004, 1, 28–33. [Google Scholar]
- Emery, J.; Crump, C.; Bors, P. Reliability and validity of two instruments designed to assess the walking and bicycling suitability of sidewalks and roads. Am. J. Health Promot. 2003, 18, 38–46. [Google Scholar] [CrossRef] [PubMed]
- Boarnet, M.; Anderson, C.; Day, K.; Mcillan, T.; Alfonzo, M. Evaluation of the California Safe Routes to School Legislation: Urban Form Changes and Children’s Active transportation to School. Am. J. Prev. Med. 2005, 28, 134–140. [Google Scholar] [CrossRef] [PubMed]
- Gallin, N. Quantifying Pedestrian friendliness- Guidelines for Assessing Pedestrian level of Service. J. Road Trans. Res. 2001, 10, 47–55. [Google Scholar]
- Khisty, C.J. Operationalizing Concepts of Equity for Public Project Investment. Transp. Res. Rec. 1997, 1559, 94–99. [Google Scholar] [CrossRef]
- Crane, R.; Crepeau, R. Does Neigbourhood Design Influence Travel? Behavioral Analysis of Travel Diary and GIS Data; UCTC Working Paper No.374; University of California Transportation Center: Berkeley, CA, USA, 1998. [Google Scholar]
- Humpel, N.; Owen, N.; Leslie, E.; Marshall, A.L.; Bauman, A.E.; Sallis, J.F. Associations of location and perceived environmental attributes with walking in neighborhoods. Am. J. Health Promot. 2004, 18, 239–242. [Google Scholar] [CrossRef] [PubMed]
- Jacobs, K. Discourse analysis and its utility for urban policy research. Urban Policy Res. 2006, 24, 39–52. [Google Scholar] [CrossRef]
- Southworth, M. Designing the Walkable City. J. Urban Plan. Dev. 2005, 131, 246–257. [Google Scholar] [CrossRef]
- Ewing, R.; Schmid, T.; Killingsworth, R.; Zlot, A.; Raudenbush, S. Relationship between urban sprawl and physical activity, obesity, and morbidity. In Urban Ecology; Springer: Boston, MA, USA, 2008; pp. 567–582. [Google Scholar]
- Handy, L.S.; Boarnet, M.G.; Ewing, R.; Killingsworth, R.E. How the built environment affects physical activity. Views from Urban Planning. Am. J. Prev. Med. 2002, 23, 64–73. [Google Scholar] [CrossRef]
- Duncan, M.J.; Spence, J.C.; Mummery, W.K. Perceived environment and physical activity: A meta-analysis of selected environmental characteristics. Int. J. Behav. Nutr. Phys. Act. 2005, 2, 11. [Google Scholar] [CrossRef] [PubMed]
- Handy, S.L. Urban Form and Pedestrian choices: Study of Austin neighborhoods. Transp. Res. Rec. 1996, 135–144. [Google Scholar] [CrossRef]
- Rodriguez, D.; Joo, J. The relationship between non-motorized mode choice and the local physical environment. Trans. Res. D 2004, 9, 151–173. [Google Scholar] [CrossRef]
- Handy, S.; Cao, X.; Mokhtarian, P. Correlation or causality between the built environment and travel behavior? Evidence from Northern California. Trans. Res. D 2005, 10, 427–444. [Google Scholar] [CrossRef]
- Calthorpe, P.; Poticha, S. The Next American Metropolis, Ecology, Communities, and the America Dream; Priceton Architectural Press: New York, NY, USA, 1993. [Google Scholar]
- Cervero, R. Built environments and mode choice: Toward a normative framework. Trans. Res. D 2002, 7, 265–284. [Google Scholar] [CrossRef]
- Handy, S.L.; Clifton, K. Evaluating Neighborhood Accessibility: Issues and Methods Using Geographic Information Systems; (No. SWUTC/00/167202-1); Southwest Region University Transportation Center, Center for Transportation Research, University of Texas: Austin, TX, USA, 2000. [Google Scholar]
- Badland, H.; Schofield, G. Transport, urban design, and physical activity: An evidence based update. Trans. Res. D 2005, 10, 177–196. [Google Scholar] [CrossRef]
- Boarnet, M.; Day, K.; Alfonzo, M.; Forsyth, A.; Oakes, M. The Irvine-Minnesota Inventory to Measure Built environment: Reliability Tests. Am. J. Prev. Med. 2006, 30, 153–159. [Google Scholar] [CrossRef] [PubMed]
- Ewing, R. Can the physical environment determine physical activity levels? Exerc. Sport Sci. Rev. 2005, 33, 69–75. [Google Scholar] [CrossRef]
- Clifton, K.; Livi, A.; Rodriguez, D.A. Pedestrian Environment Data Scan (PEDS) Tool. Planning 2005, 80, 95–110. [Google Scholar]
- Pikora, T.; Giles-Corti, B.; Bull, F.C.; Jamrozik, K.; Donovan, R. Developing a Framework for Assessment of the Environmental Determinants of Walking and Cycling. Soc. Sci. Med. 2003, 56, 1693–1703. [Google Scholar] [CrossRef]
- Kitamura, R.; Fujii, S. Two computational process models of activity-travel behavior. In Theoretical Foundations of Travel Choice Modeling; Garling, T., Laitila, T., Westin, K., Eds.; Emerald Group Publishin Ltd.: Bingley, UK, 1998; pp. 251–279. [Google Scholar]
- Guttenplan, M.; Landis, B.W.; Crider, L.; McLeod, D.S. Multi-modal level of service Analysis at planning level. Transp. Res. Rec. 2001, 1776, 151–158. [Google Scholar] [CrossRef]
- Landis, B.W.; Vattikuti, V.R.; Ottenberg, R.M.; McLeod, D.S.; Guttenplan, M. Modeling the roadside walking environment: A Pedestrian Level of Service. Transp. Res. Board 2001. [Google Scholar] [CrossRef]
- Matan, A.; Newman, P.; Trubka, R.; Beattie, C.; Selvey, L.A. Health, Transport and Urban Planning: Quantifying the Links between Urban Assessment Models and Human Health. Urban Policy Res. 2015, 33, 145–159. [Google Scholar] [CrossRef]
- Boitsidis, A.J. A decision Support system for identifying the habitat quality and rehabilitation potential of Urban Rivers. Water Environ. J. 2006, 20, 130–140. [Google Scholar] [CrossRef]
- Byrd, E.T.; Gustke, I. A brief history of decision making. Harv. Bus. Rev. 2007, 84, 32–42. [Google Scholar]
- Zhang, X.; Jiang, H.; Jin, J.; Xu, X.; Zhang, Q. Analysis of acid rain patterns in northeastern China using a decision tree method. Atmos. Environ. 2012, 46, 590–596. [Google Scholar] [CrossRef]
- Simard, M.; Saatchi, S.S.; De Grandi, G. The Use of Decision Tree and Multiscale Texture for Classification of JERS-1 SAR Data over Tropical Forest. IEEE Trans. Geosci. Remote Sens. 2000, 38, 2310–2321. [Google Scholar] [CrossRef]
- Fries, R.D.; Hansen, M.; Townshend, J.; Sohlberg, R. Global land cover classification at 8 km spatial resolution: The use of data derived from land sat imagery in decision tree classifiers. Int. J. Remote Sens. 1998, 19, 3141–3168. [Google Scholar] [CrossRef]
- Aitkenhead, M.J. A coevolving decision tree classification method. J. Expert Syst. Class 2007, 34, 18–27. [Google Scholar] [CrossRef]
- Stangor, C. Research Methods for the Behavioral Sciences, 3rd ed.; Houghton Mifflin Company, University of Maryland: College Park, MD, USA, 2007. [Google Scholar]
- Shafaghat, A.; Keyvanfar, A.; Lamit, H.; Mousavi, A.; Majid, M.Z.A. Open plan office design features affecting staff’s health and well-being status. J. Teknol. 2014, 70, 83–88. [Google Scholar] [CrossRef]
- Lamit, H.B.; Shafaghat, A.; Majid, M.Z.; Keyvanfar, A.; Ahmad, M.H.B.; Malik, T.A. The Path Walkability Index (PAWDEX) Model: To Measure Built Environment Variables Influencing Residents' Walking Behavior. Adv. Sci. Lett. 2013, 19, 3017–3020. [Google Scholar] [CrossRef]
- Shafaghat, A.; Manteghi, G.; Keyvanfar, A.; Lamit, H.B.; Saito, K.; Ossen, D.R. Street geometry factors influence urban microclimate in tropical coastal cities: A review. Environ. Clim. Technol. 2016, 17, 61–75. [Google Scholar] [CrossRef]
- Lamit, H.B.; Shafaghat, A.; Majid, M.Z.; Keyvanfar, A.; Hamdan, M.; Ahmad, B.; Malik, T.A.; Zin, R.; Yadollahi, M. Application of the Path Walkability Index (PAWDEX) Model: A Case Study of Retail Walking Pattern Recognition in Taman University Skudai, Johor, Malaysia. Adv. Sci. Lett. 2013, 19, 3021–3024. [Google Scholar] [CrossRef]
- Shafaghat, A.; Keyvanfar, A.; Manteghi, G.; Lamit, H.B. Environmental-conscious factors affecting street microclimate and individuals’ respiratory health in tropical coastal cities. Sustain. Cities Soc. 2016, 21, 35–50. [Google Scholar] [CrossRef]
- Shafaghat, A.; Keyvanfer, A.; Muslim, N.H.B. Drivers’ adaptive travel behaviors towards green transportation development: A critical review. Arch. Transp. 2016, 38, 49–70. [Google Scholar] [CrossRef]


| Sense of Safety and Security for Shopping Center A | |||||
|---|---|---|---|---|---|
| Ranking Score | 1 | 2 | 3 | 4 | 5 |
| Quantity | 7 | 9 | 3 | 2 | 3 |
| Value | 5 | 4 | 3 | 2 | 1 |
| Quantity Value | 35 | 36 | 9 | 4 | 3 |
| Total | 87 | ||||
| Actual Weight Value | 87 − 24 = 63 | ||||
| Total (Sum) = = 87 Maximum Number = 245 = 120 Minimum Number = 241 = 24 Limitation Range = Maximum Number − Minimum Number = 120 − 24 = 96 Actual Weight Value of the “Sense of safety and security” in the “Limitation range” = Total − Minimum Number = 87 − 24 = 63 “Actual satisfactory percentage” of the “Sense of safety and security” = = = 65.62% | |||||
| Features | Criteria | Sub-Criteria | Shopping Center A (%) | Shopping Center B (%) | Shopping Center C (%) | Walkability Index of Overall Neighborhood (%) |
|---|---|---|---|---|---|---|
| F1. Sense of Safety and Security | F1.C1. Safety facilities at sidewalks | F1.C1. S1 Driveway Curb-cuts | 25.43 | 19.12 | 18.64 | 21.06 |
| F1.C1. S2 Existence of Pedestrian Crossing | 27.54 | 19.42 | 25.8 | 24.25 | ||
| F1.C1. S3 Width of Utility Zones | 24 | 16.73 | 11.25 | 17.33 | ||
| F1.C1. S4 Shelters | 24 | 12.34 | 12.82 | 16.41 | ||
| F1.C1. S5 Length of Tree Canopies | 15.53 | 10.68 | 10.28 | 12.16 | ||
| F1.C1. S6 Releasing visual Obstacles/Nuisances | 8.1 | 3.22 | 13.82 | 8.38 | ||
| F1.C1. S7 Sidewalk Steepness | 21.67 | 11.56 | 7.57 | 13.60 | ||
| F1.C1. S8 Existence of Bike Lanes | 12.59 | 8.23 | 8.77 | 9.86 | ||
| F1.C1. S9 Existence of On-street Parking | 9.54 | 6.89 | 14.37 | 10.27 | ||
| F1.C1. S10 Informing the intersection blindness | 4.76 | 6.87 | 9.04 | 6.89 | ||
| F1.C1. S11 Mid-block crossing | 10.05 | 18.78 | 16.94 | 15.26 | ||
| F1.C1. S12 Providing over-bridge | 10.81 | 8.62 | 8.92 | 9.45 | ||
| F1.C2. Slowing traffic speed at pedestrian crossing | F1.C2. S1 Existence of Pedestrian Crossing | 24.96 | 8.23 | 17.66 | 16.95 | |
| F1.C2. S2 Number(s) of Traffic Lanes | 19.07 | 14.69 | 19.39 | 17.72 | ||
| F1.C2. S3 Traffic Signals | 24.36 | 15.68 | 22.16 | 20.73 | ||
| F1.C2. S4 Traffic Calming Devices | 3.7 | 4.70 | 11.42 | 6.61 | ||
| F1.C2. S5 Drivers’ respect to pedestrian | 4.76 | 5.48 | 7.90 | 6.05 | ||
| F1.C2. S6 Slow Traffic speed | 11.78 | 12.67 | 19.47 | 14.64 | ||
| F1.C3. Security in day and nights | F1.C3. S1 Sidewalk Lighting | 19.07 | 6.97 | 12.64 | 12.89 | |
| F1.C3. S2 Number of Intermediary | 13.94 | 8.55 | 10.93 | 11.14 | ||
| F1.C3. S3 Length of Tree Canopies | 9.58 | 9.49 | 14.57 | 11.21 | ||
| F1.C3. S4 Number of Street Trees | 11.48 | 6.48 | 19.95 | 12.64 | ||
| F1.C3. S5 Releasing visual Obstacles/Nuisances | 8.4 | 4.6 | 5.57 | 6.19 | ||
| F1.C3. S6 Not-crowded Route | 20.04 | 12.06 | 18.94 | 17.01 | ||
| F1.C3. S7 Street Surveillance | 6.35 | 2.97 | 5.14 | 4.82 | ||
| F1.C3. S8 Street-Facing Entrances | 22.87 | 7.87 | 14.78 | 15.17 | ||
| F1.C3. S9 Street-level Façade Transparency | 11.04 | 9.45 | 20.21 | 13.57 | ||
| F1.C3. S10 First Floor Use of Buildings | 9.94 | 9.49 | 18.97 | 12.80 | ||
| F1.C3. S11 Upper-Floor Windows | 8.03 | 14.73 | 6.45 | 9.74 | ||
| F2. Connectivity | F2.C1. Sidewalk accessibility | F2.C1. S1 Sidewalks networking | 22.92 | 16.48 | 18.96 | 19.45 |
| F2.C1. S2 Length of Sidewalks | 22.5 | 15.03 | 24.64 | 20.72 | ||
| F2.C1. S3 Width of Walking Zones | 21.9 | 17.18 | 27.49 | 22.19 | ||
| F2.C1. S4 Continuity to diverse activity | 9.63 | 12.39 | 21.35 | 14.46 | ||
| F2.C1. S5 Length of Segments | 11.36 | 10.96 | 16.04 | 12.79 | ||
| F2.C1. S6 Informing the Intersection blindness | 25.67 | 8.26 | 15.50 | 16.48 | ||
| F2.C1. S8 Street signage | 8.44 | 7.93 | 11.03 | 9.13 | ||
| F2.C2. Physical connectivity | F2.C2. S1 Sidewalk steepness | 19.85 | 20.7 | 13.05 | 17.87 | |
| F2.C2. S2 Street-Facing Entrances | 21.66 | 24.19 | 21.93 | 22.59 | ||
| F2.C2. S3 Street Signage | 7.44 | 9.90 | 20.13 | 12.49 | ||
| F2.C2. S4 Length of Segment | 21.40 | 22.89 | 18.90 | 21.09 | ||
| F3. Comfort | F3.C1. Physical comfort | F3.C1. S1 Well-locating of service utilities | 21.37 | 17.47 | 25.88 | 21.57 |
| F3.C1. S2 Amount of Street Furniture | 16.55 | 15.90 | 29.75 | 20.73 | ||
| F3.C1. S3 Sidewalk Lighting | 15.80 | 12.92 | 14.67 | 14.46 | ||
| F3.C1. S4 Number of Intermediary | 9.63 | 10.21 | 14.67 | 11.50 | ||
| F3.C1. S5 Shelters | 10.38 | 10.65 | 11.66 | 10.90 | ||
| F3.C1. S6 Planting deciduous trees | 26.67 | 15.12 | 14.94 | 18.91 | ||
| F3.C1. S7 Existence and width of medians | 8.48 | 8.09 | 19.68 | 12.08 | ||
| F3.C1. S8 Existence of On-street Parking | 7.82 | 10.08 | 13.80 | 10.57 | ||
| F3.C1. S9 Human Ergonomic Scale Design | 18.65 | 9.45 | 8.62 | 12.24 | ||
| F3.C2. Environmentally comfort | F3.C2. S1 Width of Walking Zones, | 24.29 | 13.52 | 16.84 | 18.22 | |
| F3.C2. S2 Types of Sidewalk Pavement, | 21.37 | 21.27 | 13.39 | 18.68 | ||
| F3.C2. S3 Number of Street Trees, | 9.02 | 14.06 | 10.96 | 11.35 | ||
| F3.C2. S4 Sidewalk Steepness, | 4.03 | 9.03 | 8.96 | 7.34 | ||
| F3.C2. S5 Windy climate, | 10.58 | 2.43 | 4.37 | 5.79 | ||
| F3.C2. S6 Not-crowded Route, | 19.07 | 21.35 | 13.54 | 17.99 | ||
| F3.C2. S7 Height and types of Fences, | 24.36 | 16.04 | 11.68 | 17.36 | ||
| F3.C2. S8 Street reserve | 5.47 | 19.04 | 9.07 | 11.19 | ||
| F4. Convenience | F4.C1. Functionality of diverse activities | F4.C1. S1 Number(s) of Traffic Lanes | 6.80 | 5.41 | 13.36 | 8.52 |
| F4.C1. S2 Existence and width of medians | 2.07 | 13.09 | 25.09 | 12.16 | ||
| F4.C1. S3 Length of Segment | 1.08 | 3.89 | 11.31 | 5.43 | ||
| F4.C1. S4 Width of Traffic Zones | 11.57 | 10.39 | 4.43 | 8.80 | ||
| F4.C1. S5 Widths of Buildings | 9.03 | 16.68 | 7.05 | 10.92 | ||
| F4.C2. Easy access without obstacles | F4.C2. S1 Releasing visual Obstacles/Nuisances | 6.77 | 9.36 | 13.60 | 9.91 | |
| F4.C2. S2 Traffic Signals | 6.98 | 6.53 | 13.84 | 9.12 | ||
| F4.C2. S3 Sidewalk Steepness | 4.38 | 7.73 | 10.50 | 7.54 | ||
| F4.C2. S4 Not-crowded Route, | 5.13 | 8.83 | 10.74 | 8.23 | ||
| F4.C2. S5 Existence of On-street Parking | 3.41 | 5.44 | 6.65 | 5.17 | ||
| F4.C2. S6 Mid-block crossing | 4.01 | 4.35 | 14.08 | 7.48 | ||
| F4.C2. S7 Height and types of Fences | 2.74 | 4.36 | 13.36 | 6.82 | ||
| F4.C2. S8 Public parking next to street | 20.15 | 6.63 | 7.53 | 11.44 | ||
| F4.C2. S9 Slow Traffic speed | 11.50 | 1.37 | 15.29 | 9.39 | ||
| F5. Attractiveness and Aesthetic | F5.C1. Street enclosure | F5.C1. S1 Width of Curb-to-Curb Roadway | 21.49 | 4.29 | 3.82 | 9.87 |
| F5.C1. S2 Width of Utility Zones | 20.15 | 4.13 | 4.13 | 9.47 | ||
| F5.C1. S3 Building Setbacks | 11.57 | 4.30 | 3.2 | 6.36 | ||
| F5.C1. S4 Width of buffer zone | 9.03 | 6.63 | 7.12 | 7.59 | ||
| F5.C1. S5 Street reserve | 6.94 | 6.63 | 7.53 | 7.03 | ||
| F5.C1. S6 Diversity of buildings | 4.63 | 11.37 | 15.29 | 10.43 | ||
| F5.C1. S7 Mixed functionality of Adjacent Buildings | 15.68 | 6.35 | 14.78 | 12.27 | ||
| F5.C1. S8 Enclosure ratio | 22.94 | 13.84 | 11.40 | 16.06 | ||
| F5.C2. Vibrancy and vitality | F5.C2. S1 Planting diversity, | 22.10 | 12.29 | 6.65 | 13.68 | |
| F5.C2. S2 Sidewalk Lighting, | 25.26 | 13.29 | 2.72 | 13.76 | ||
| F5.C2. S3 Width of Landscaping Strips, | 15.79 | 9.56 | 4.03 | 9.79 | ||
| F5.C2. S4 Types of Sidewalk Pavement, | 20.8 | 8.39 | 4.43 | 11.21 | ||
| F5.C2. S5 Intangible Senses, | 6.55 | 6.43 | 7.05 | 6.68 | ||
| F5.C2. S6 Planting deciduous trees, | 11.48 | 12.67 | 9.57 | 11.24 | ||
| F5.C2. S7 Length of Tree Canopies, | 8.4 | 16.95 | 8.77 | 11.37 | ||
| F5.C2. S8 Number of Street Trees, | 20.04 | 15.57 | 14.85 | 16.82 | ||
| F5.C2. S9 Building a Vital Atmosphere in sidewalks, | 22.87 | 8.77 | 10.94 | 14.19 | ||
| F5.C2. S10 Street Interface, | 11.99 | 18.78 | 13.98 | 14.92 | ||
| F5.C2. S11 Heights of Buildings, | 15.79 | 12.67 | 13.30 | 13.92 | ||
| F5.C2. S12 Upper-Floor Windows, | 8.02 | 22.10 | 6.83 | 12.32 | ||
| F5.C2. S13 Skyline height | 11.76 | 20.83 | 11.03 | 14.54 |
| Walkability Sub-Criteria | Score on Indicator | Mean Deviation Score | Mean Deviation Score Square |
|---|---|---|---|
| (X) | (X − ) | (X − ) | |
| F1.C1. S1 Driveway Curb-cuts | 25.43 | 11.54 | 133.1716 |
| F1.C1. S2 Existence of Pedestrian Crossing | 27.54 | 13.65 | 186.3225 |
| F1.C1. S3 Width of Utility Zones | 24 | 10.11 | 102.2121 |
| F1.C1. S4 Shelters | 24 | 10.11 | 102.2121 |
| F1.C1. S5 Length of Tree Canopies | 15.53 | 1.64 | 2.6896 |
| F1.C1. S6 Releasing visual Obstacles/Nuisances | 8.1 | −5.79 | 33.5241 |
| F1.C1. S7 Sidewalk Steepness | 21.67 | 7.78 | 60.5284 |
| F1.C1. S8 Existence of Bike Lanes | 12.59 | −1.3 | 1.69 |
| F1.C1. S9 Existence of On-street Parking | 9.54 | −4.35 | 18.9225 |
| F1.C1. S10 Informing the intersection blindness | 4.76 | −9.13 | 83.3569 |
| F1.C1. S11 Mid-block crossing | 10.05 | −3.84 | 14.7456 |
| F1.C1. S12 Providing over-bridge | 10.81 | −3.08 | 133.171 |
| F1.C2. S1 Existence of Pedestrian Crossing | 24.96 | 11.07 | 122.5449 |
| F1.C2. S2 Number(s) of Traffic Lanes | 19.07 | 5.18 | 26.8324 |
| F1.C2. S3 Traffic Signals | 24.36 | 10.47 | 109.6209 |
| F1.C2. S4 Traffic Calming Devices | 3.7 | −10.19 | 103.8361 |
| F1.C2. S5 Drivers’ respect to pedestrian | 4.76 | −9.13 | 83.3569 |
| F1.C2. S6 Slow Traffic speed | 11.78 | −2.11 | 4.4521 |
| F1.C3. S1 Sidewalk Lighting | 19.07 | 5.18 | 26.8324 |
| F1.C3. S2 Number of Intermediary | 13.94 | 0.05 | 0.0025 |
| F1.C3. S3 Length of Tree Canopies | 9.58 | −4.31 | 18.5761 |
| F1.C3. S4 Number of Street Trees | 11.48 | −2.41 | 5.8081 |
| F1.C3. S5 Releasing visual Obstacles/Nuisances | 8.4 | −5.49 | 30.1401 |
| F1.C3. S6 Not-crowded Route | 20.04 | 6.15 | 37.8225 |
| F1.C3. S7 Street Surveillance | 6.35 | −7.54 | 56.8516 |
| F1.C3. S8 Street-Facing Entrances | 22.87 | 8.98 | 80.6404 |
| F1.C3. S9 Street-level Façade Transparency | 11.04 | −2.85 | 8.1225 |
| F1.C3. S10 First Floor Use of Buildings | 9.94 | −3.95 | 15.6025 |
| F1.C3. S11 Upper-Floor Windows | 8.03 | −5.86 | 34.3396 |
| F2.C1. S1 Sidewalks networking | 22.92 | 9.03 | 81.5409 |
| F2.C1. S2 Length of Sidewalks | 22.5 | 8.61 | 74.1321 |
| F2.C1. S3 Width of Walking Zones | 21.9 | 8.01 | 64.1601 |
| F2.C1. S4 Continuity to diverse activity | 9.63 | −4.26 | 18.1476 |
| F2.C1. S5 Length of Segments | 11.36 | −2.53 | 6.4009 |
| F2.C1. S6 Informing the Intersection blindness | 25.67 | 11.78 | 138.7684 |
| F2.C1. S8 Street signage | 8.44 | −5.45 | 29.7025 |
| F2.C2. S1 Sidewalk steepness | 19.85 | 7.77 | 60.3729 |
| F2.C2. S2 Street-Facing Entrances | 21.66 | 7.77 | 60.3729 |
| F2.C2. S3 Street Signage | 7.44 | −6.45 | 41.6025 |
| F2.C2. S4 Length of Segment | 21.40 | 7.51 | 56.4001 |
| F3.C1. S1 Well-locating of service utilities | 21.37 | 7.48 | 55.9504 |
| F3.C1. S2 Amount of Street Furniture | 16.55 | 2.66 | 7.0756 |
| F3.C1. S3 Sidewalk Lighting | 15.80 | 1.91 | 3.6481 |
| F3.C1. S4 Number of Intermediary | 9.63 | −4.26 | 18.1476 |
| F3.C1. S5 Shelters | 10.38 | −3.51 | 12.3201 |
| F3.C1. S6 Planting deciduous trees | 26.67 | 12.78 | 163.3284 |
| F3.C1. S7 Existence and width of medians | 8.48 | −5.41 | 29.2681 |
| F3.C1. S8 Existence of On-street Parking | 7.82 | −6.07 | 36.8449 |
| F3.C1. S9 Human Ergonomic Scale Design | 18.65 | 4.76 | 22.6576 |
| F3.C2. S1 Width of Walking Zones, | 24.29 | 10.4 | 108.16 |
| F3.C2. S2 Types of Sidewalk Pavement, | 21.37 | 7.48 | 55.9504 |
| F3.C2. S3 Number of Street Trees, | 9.02 | −4.87 | 23.7169 |
| F3.C2. S4 Sidewalk Steepness, | 4.03 | −9.86 | 97.2196 |
| F3.C2. S5 Windy climate, | 10.58 | −3.31 | 10.9561 |
| F3.C2. S6 Not-crowded Route, | 19.07 | 5.18 | 133.1716 |
| F3.C2. S7 Height and types of Fences, | 24.36 | 5.18 | 26.8324 |
| F3.C2. S8 Street reserve | 5.47 | 10.47 | 109.6209 |
| F4.C1. S1 Number(s) of Traffic Lanes | 6.8 | −8.42 | 70.8964 |
| F4.C1. S2 Existence and width of medians | 2.07 | −7.09 | 50.2681 |
| F4.C1. S3 Length of Segment | 1.08 | −12.81 | 164.0961 |
| F4.C1. S4 Width of Traffic Zones | 11.57 | −2.32 | 5.3824 |
| F4.C1. S5 Widths of Buildings | 9.03 | −4.86 | 23.6196 |
| F4.C2. S1 Releasing visual Obstacles/Nuisances | 6.77 | −7.12 | 50.6944 |
| F4.C2. S2 Traffic Signals | 6.98 | −6.91 | 47.7481 |
| F4.C2. S3 Sidewalk Steepness | 4.38 | −9.51 | 90.4401 |
| F4.C2. S4 Not-crowded Route, | 5.13 | −8.76 | 76.7376 |
| F4.C2. S5 Existence of On-street Parking | 3.41 | −10.48 | 109.8304 |
| F4.C2. S6 Mid-block crossing | 4.01 | −9.88 | 109.8304 |
| F4.C2. S7 Height and types of Fences | 2.74 | −11.15 | 124.3225 |
| F4.C2. S8 Public parking next to street | 20.15 | 6.26 | 39.1876 |
| F4.C2. S9 Slow Traffic speed | 11.50 | −2.39 | 5.7121 |
| F5.C1. S1 Width of Curb-to-Curb Roadway | 21.49 | 7.6 | 57.76 |
| F5.C1. S2 Width of Utility Zones | 20.15 | 6.26 | 39.1876 |
| F5.C1. S3 Building Setbacks | 11.57 | −2.32 | 5.3824 |
| F5.C1. S4 Width of buffer zone | 9.03 | −4.86 | 23.6196 |
| F5.C1. S5 Street reserve | 6.94 | −6.95 | 48.3025 |
| F5.C1. S6 Diversity of buildings | 4.63 | −9.26 | 85.7476 |
| F5.C1. S7 Mixed functionality of Adjacent Buildings | 15.68 | 1.79 | 3.2041 |
| F5.C1. S8 Enclosure ratio | 22.94 | 9.05 | 81.9025 |
| F5.C2. S1 Planting diversity, | 22.10 | 8.21 | 67.4041 |
| F5.C2. S2 Sidewalk Lighting, | 25.26 | 11.37 | 129.2769 |
| F5.C2. S3 Width of Landscaping Strips, | 15.79 | 1.9 | 3.61 |
| F5.C2. S4 Types of Sidewalk Pavement, | 20.8 | 6.91 | 47.7481 |
| F5.C2. S5 Intangible Senses, | 6.55 | −7.34 | 53.8756 |
| F5.C2. S6 Planting deciduous trees, | 11.48 | −2.41 | 5.8081 |
| F5.C2. S7 Length of Tree Canopies, | 8.4 | −5.49 | 30.1401 |
| F5.C2. S8 Number of Street Trees, | 20.04 | 6.15 | 37.8225 |
| F5.C2. S9 Building a Vital Atmosphere in sidewalks, | 22.87 | 8.98 | 80.6404 |
| F5.C2. S10 Street Interface, | 11.99 | −1.9 | 3.61 |
| F5.C2. S11 Heights of Buildings, | 15.79 | 1.9 | 3.61 |
| F5.C2. S12 Upper-Floor Windows, | 8.02 | −5.87 | 34.4569 |
| F5.C2. S13 Skyline height | 11.76 | −2.13 | 4.5369 |
| = 1278.6 | = 13.89 | (X −)= 5000.81 |
| Walkability Sub-Criteria | Score on Indicator | Mean Deviation Score | Mean Deviation Score Square |
|---|---|---|---|
| (X) | (X − ) | (X − ) | |
| F1.C1. S1 Driveway Curb-cuts | 19.12 | 8.24 | 67.8976 |
| F1.C1. S2 Existence of Pedestrian Crossing | 19.42 | 8.24 | 67.8976 |
| F1.C1. S3 Width of Utility Zones | 16.73 | 5.55 | 30.8025 |
| F1.C1. S4 Shelters | 12.34 | 1.16 | 1.3456 |
| F1.C1. S5 Length of Tree Canopies | 10.68 | −0.5 | 0.25 |
| F1.C1. S6 Releasing visual Obstacles/Nuisances | 3.22 | −7.96 | 63.3616 |
| F1.C1. S7 Sidewalk Steepness | 11.56 | 0.38 | 0.1444 |
| F1.C1. S8 Existence of Bike Lanes | 8.23 | −2.95 | 8.7025 |
| F1.C1. S9 Existence of On-street Parking | 6.89 | −4.29 | 18.4041 |
| F1.C1. S10 Informing the intersection blindness | 6.87 | −4.31 | 18.5761 |
| F1.C1. S11 Mid-block crossing | 18.78 | 7.6 | 57.76 |
| F1.C1. S12 Providing over-bridge | 8.62 | −2.56 | 6.5536 |
| F1.C2. S1 Existence of Pedestrian Crossing | 8.23 | −2.95 | 8.7025 |
| F1.C2. S2 Number(s) of Traffic Lanes | 14.69 | 3.51 | 12.3201 |
| F1.C2. S3 Traffic Signals | 15.68 | 3.51 | 12.3201 |
| F1.C2. S4 Traffic Calming Devices | 4.7 | −6.48 | 41.9904 |
| F1.C2. S5 Drivers’ respect to pedestrian | 5.48 | −5.7 | 32.49 |
| F1.C2. S6 Slow Traffic speed | 12.67 | 1.49 | 2.2201 |
| F1.C3. S1 Sidewalk Lighting | 6.97 | −4.21 | 17.7241 |
| F1.C3. S2 Number of Intermediary | 8.55 | −2.63 | 6.9169 |
| F1.C3. S3 Length of Tree Canopies | 9.49 | −1.69 | 2.8561 |
| F1.C3. S4 Number of Street Trees | 6.48 | −4.7 | 22.09 |
| F1.C3. S5 Releasing visual Obstacles/Nuisances | 4.6 | −6.58 | 43.2964 |
| F1.C3. S6 Not-crowded Route | 12.06 | 0.88 | 0.7744 |
| F1.C3. S7 Street Surveillance | 2.97 | −8.21 | 67.4041 |
| F1.C3. S8 Street-Facing Entrances | 7.87 | −3.31 | 10.9561 |
| F1.C3. S9 Street-level Façade Transparency | 9.45 | −1.73 | 67.8976 |
| F1.C3. S10 First Floor Use of Buildings | 9.49 | −1.69 | 2.8561 |
| F1.C3. S11 Upper-Floor Windows | 14.73 | 3.55 | 12.6025 |
| F2.C1. S1 Sidewalks networking | 16.48 | 5.3 | 28.09 |
| F2.C1. S2 Length of Sidewalks | 15.03 | 3.85 | 14.8225 |
| F2.C1. S3 Width of Walking Zones | 17.18 | 6 | 36 |
| F2.C1. S4 Continuity to diverse activity | 12.39 | 1.21 | 1.4641 |
| F2.C1. S5 Length of Segments | 10.96 | 1.21 | 1.4641 |
| F2.C1. S6 Informing the Intersection blindness | 8.26 | −0.22 | 30.8025 |
| F2.C1. S8 Street signage | 7.93 | −3.25 | 10.562 |
| F2.C2. S1 Sidewalk steepness | 20.7 | 9.52 | 90.6304 |
| F2.C2. S2 Street-Facing Entrances | 24.19 | 13.01 | 169.2601 |
| F2.C2. S3 Street Signage | 9.90 | −1.28 | 1.6384 |
| F2.C2. S4 Length of Segment | 22.89 | 11.71 | 137.124 |
| F3.C1. S1 Well-locating of service utilities | 17.47 | 6.29 | 39.5641 |
| F3.C1. S2 Amount of Street Furniture | 15.90 | 4.72 | 22.2784 |
| F3.C1. S3 Sidewalk Lighting | 12.92 | 1.74 | 3.0276 |
| F3.C1. S4 Number of Intermediary | 10.21 | −0.97 | 0.9409 |
| F3.C1. S5 Shelters | 10.65 | −0.53 | 0.2809 |
| F3.C1. S6 Planting deciduous trees | 15.12 | 3.94 | 15.5236 |
| F3.C1. S7 Existence and width of medians | 8.09 | −3.09 | 9.5481 |
| F3.C1. S8 Existence of On-street Parking | 10.08 | −1.1 | 1.21 |
| F3.C1. S9 Human Ergonomic Scale Design | 9.45 | −1.73 | 2.9929 |
| F3.C2. S1 Width of Walking Zones, | 13.52 | 2.34 | 5.4756 |
| F3.C2. S2 Types of Sidewalk Pavement, | 21.27 | 10.09 | 101.8081 |
| F3.C2. S3 Number of Street Trees, | 14.06 | 2.88 | 8.2944 |
| F3.C2. S4 Sidewalk Steepness, | 9.03 | −2.15 | 4.6225 |
| F3.C2. S5 Windy climate, | 2.43 | −8.75 | 76.5625 |
| F3.C2. S6 Not-crowded Route, | 21.35 | 10.17 | 103.4289 |
| F3.C2. S7 Height and types of Fences, | 16.04 | 4.86 | 23.6196 |
| F3.C2. S8 Street reserve | 19.04 | 0.38 | 0.1444 |
| F4.C1. S1 Number(s) of Traffic Lanes | 5.41 | −5.77 | 33.2929 |
| F4.C1. S2 Existence and width of medians | 13.09 | 1.91 | 3.6481 |
| F4.C1. S3 Length of Segment | 3.89 | −7.29 | 53.1441 |
| F4.C1. S4 Width of Traffic Zones | 10.39 | −0.79 | 0.6241 |
| F4.C1. S5 Widths of Buildings | 16.68 | 5.5 | 30.25 |
| F4.C2. S1 Releasing visual Obstacles/Nuisances | 9.36 | 5.5 | 30.25 |
| F4.C2. S2 Traffic Signals | 6.53 | −4.65 | 21.6225 |
| F4.C2. S3 Sidewalk Steepness | 7.73 | −3.45 | 11.9025 |
| F4.C2. S4 Not-crowded Route, | 8.83 | −3.45 | 11.9025 |
| F4.C2. S5 Existence of On-street Parking | 5.44 | −2.35 | 5.5225 |
| F4.C2. S6 Mid-block crossing | 4.35 | −7.96 | 63.3616 |
| F4.C2. S7 Height and types of Fences | 4.36 | −11.18 | 124.9924 |
| F4.C2. S8 Public parking next to street | 6.63 | −4.55 | 20.7025 |
| F4.C2. S9 Slow Traffic speed | 1.37 | −9.81 | 96.2361 |
| F5.C1. S1 Width of Curb-to-Curb Roadway | 4.29 | −6.89 | 47.4721 |
| F5.C1. S2 Width of Utility Zones | 4.13 | −7.05 | 49.7025 |
| F5.C1. S3 Building Setbacks | 4.30 | −6.88 | 47.3344 |
| F5.C1. S4 Width of buffer zone | 6.63 | −4.55 | 20.7025 |
| F5.C1. S5 Street reserve | 6.63 | −4.55 | 20.7025 |
| F5.C1. S6 Diversity of buildings | 11.37 | 0.19 | 0.0361 |
| F5.C1. S7 Mixed functionality of Adjacent Buildings | 6.35 | −4.83 | 23.3289 |
| F5.C1. S8 Enclosure ratio | 13.84 | 2.66 | 7.0756 |
| F5.C2. S1 Planting diversity, | 12.29 | 1.11 | 1.2321 |
| F5.C2. S2 Sidewalk Lighting, | 13.29 | 2.11 | 4.4521 |
| F5.C2. S3 Width of Landscaping Strips, | 9.56 | −1.62 | 4.4521 |
| F5.C2. S4 Types of Sidewalk Pavement, | 8.39 | −2.79 | 7.7841 |
| F5.C2. S5 Intangible Senses, | 6.43 | −4.75 | 22.5625 |
| F5.C2. S6 Planting deciduous trees, | 12.67 | 1.49 | 2.2201 |
| F5.C2. S7 Length of Tree Canopies, | 16.95 | 5.77 | 33.2929 |
| F5.C2. S8 Number of Street Trees, | 15.57 | 4.39 | 19.2721 |
| F5.C2. S9 Building a Vital Atmosphere in sidewalks, | 8.77 | −2.41 | 5.8081 |
| F5.C2. S10 Street Interface, | 18.78 | 7.6 | 57.76 |
| F5.C2. S11 Heights of Buildings, | 12.67 | 1.49 | 2.2201 |
| F5.C2. S12 Upper-Floor Windows, | 22.10 | 10.92 | 119.2464 |
| F5.C2. S13 Skyline height | 20.83 | 9.65 | 93.1225 |
| = 1024.12 | = 13.08 | (X −)= 2745.526 |
| Walkability Sub-Criteria | Score on Indicator | Mean Deviation Score | Mean Deviation Score Square |
|---|---|---|---|
| (X) | (X − ) | (X − ) | |
| F1.C1. S1 Driveway Curb-cuts | 18.64 | 5.56 | 30.9136 |
| F1.C1. S2 Existence of Pedestrian Crossing | 25.8 | 12.72 | 161.7984 |
| F1.C1. S3 Width of Utility Zones | 11.25 | −1.83 | 3.3489 |
| F1.C1. S4 Shelters | 12.82 | −0.26 | 0.0676 |
| F1.C1. S5 Length of Tree Canopies | 10.28 | −2.8 | 7.84 |
| F1.C1. S6 Releasing visual Obstacles/Nuisances | 13.82 | 0.74 | 0.5476 |
| F1.C1. S7 Sidewalk Steepness | 7.57 | −5.51 | 30.3601 |
| F1.C1. S8 Existence of Bike Lanes | 8.77 | −4.31 | 18.5761 |
| F1.C1. S9 Existence of On-street Parking | 14.37 | 1.29 | 1.6641 |
| F1.C1. S10 Informing the intersection blindness | 9.04 | −4.04 | 16.3216 |
| F1.C1. S11 Mid-block crossing | 16.94 | 3.86 | 14.8996 |
| F1.C1. S12 Providing over-bridge | 8.92 | −4.16 | 17.3056 |
| F1.C2. S1 Existence of Pedestrian Crossing | 17.66 | 4.58 | 20.9764 |
| F1.C2. S2 Number(s) of Traffic Lanes | 19.39 | 6.31 | 39.8161 |
| F1.C2. S3 Traffic Signals | 22.16 | 9.08 | 82.4464 |
| F1.C2. S4 Traffic Calming Devices | 11.42 | −1.66 | 2.7556 |
| F1.C2. S5 Drivers’ respect to pedestrian | 7.9 | −5.18 | 26.8324 |
| F1.C2. S6 Slow Traffic speed | 19.47 | 6.39 | 40.8321 |
| F1.C3. S1 Sidewalk Lighting | 12.64 | −0.44 | 0.1936 |
| F1.C3. S2 Number of Intermediary | 10.93 | −2.15 | 4.6225 |
| F1.C3. S3 Length of Tree Canopies | 14.57 | 1.49 | 2.2201 |
| F1.C3. S4 Number of Street Trees | 19.95 | 6.87 | 47.1969 |
| F1.C3. S5 Releasing visual Obstacles/Nuisances | 5.57 | −7.51 | 56.4001 |
| F1.C3. S6 Not-crowded Route | 18.94 | 5.86 | 34.3396 |
| F1.C3. S7 Street Surveillance | 5.14 | −7.94 | 63.0436 |
| F1.C3. S8 Street-Facing Entrances | 14.78 | 1.7 | 2.89 |
| F1.C3. S9 Street-level Façade Transparency | 20.21 | 7.13 | 50.8369 |
| F1.C3. S10 First Floor Use of Buildings | 18.97 | 5.89 | 34.6921 |
| F1.C3. S11 Upper-Floor Windows | 6.45 | −6.63 | 43.9569 |
| F2.C1. S1 Sidewalks networking | 18.96 | 5.88 | 34.5744 |
| F2.C1. S2 Length of Sidewalks | 24.64 | 11.56 | 133.6336 |
| F2.C1. S3 Width of Walking Zones | 27.49 | 14.41 | 207.6481 |
| F2.C1. S4 Continuity to diverse activity | 21.35 | 8.27 | 207.6481 |
| F2.C1. S5 Length of Segments | 16.04 | 2.96 | 8.7616 |
| F2.C1. S6 Informing the Intersection blindness | 15.50 | 2.42 | 5.8564 |
| F2.C1. S8 Street signage | 11.03 | −2.05 | 4.2025 |
| F2.C2. S1 Sidewalk steepness | 13.05 | −0.03 | 0.0009 |
| F2.C2. S2 Street-Facing Entrances | 21.93 | 8.85 | 78.3225 |
| F2.C2. S3 Street Signage | 20.13 | 7.05 | 49.7025 |
| F2.C2. S4 Length of Segment | 18.90 | 5.82 | 33.8724 |
| F3.C1. S1 Well-locating of service utilities | 25.88 | 12.8 | 163.84 |
| F3.C1. S2 Amount of Street Furniture | 29.75 | 16.67 | 277.8889 |
| F3.C1. S3 Sidewalk Lighting | 14.67 | 1.59 | 2.5281 |
| F3.C1. S4 Number of Intermediary | 14.67 | 1.59 | 2.5281 |
| F3.C1. S5 Shelters | 11.66 | −1.42 | 2.0164 |
| F3.C1. S6 Planting deciduous trees | 14.94 | 1.86 | 3.4596 |
| F3.C1. S7 Existence and width of medians | 19.68 | 6.6 | 43.56 |
| F3.C1. S8 Existence of On-street Parking | 13.80 | 0.72 | 0.5184 |
| F3.C1. S9 Human Ergonomic Scale Design | 8.62 | −4.46 | 19.8916 |
| F3.C2. S1 Width of Walking Zones, | 16.84 | 3.76 | 14.1376 |
| F3.C2. S2 Types of Sidewalk Pavement, | 13.39 | 0.31 | 0.0961 |
| F3.C2. S3 Number of Street Trees, | 10.96 | −2.12 | 4.4944 |
| F3.C2. S4 Sidewalk Steepness, | 8.96 | −4.12 | 2.5281 |
| F3.C2. S5 Windy climate, | 4.37 | −8.71 | 75.8641 |
| F3.C2. S6 Not-crowded Route, | 13.54 | 0.46 | 0.2116 |
| F3.C2. S7 Height and types of Fences, | 11.68 | −1.4 | 1.96 |
| F3.C2. S8 Street reserve | 9.07 | −4.01 | 16.0801 |
| F4.C1. S1 Number(s) of Traffic Lanes | 13.36 | 0.28 | 0.0784 |
| F4.C1. S2 Existence and width of medians | 25.09 | 12.01 | 144.2401 |
| F4.C1. S3 Length of Segment | 11.31 | −1.77 | 3.1329 |
| F4.C1. S4 Width of Traffic Zones | 4.43 | −8.65 | 74.8225 |
| F4.C1. S5 Widths of Buildings | 7.05 | −6.03 | 36.360 |
| F4.C2. S1 Releasing visual Obstacles/Nuisances | 13.6 | 0.2704 | 0.52 |
| F4.C2. S2 Traffic Signals | 13.84 | 0.5776 | 0.76 |
| F4.C2. S3 Sidewalk Steepness | 10.50 | 6.6564 | −2.58 |
| F4.C2. S4 Not-crowded Route, | 10.74 | 5.4756 | −2.34 |
| F4.C2. S5 Existence of On-street Parking | 6.65 | 5.4756 | −6.43 |
| F4.C2. S6 Mid-block crossing | 14.08 | 1 | 1 |
| F4.C2. S7 Height and types of Fences | 13.36 | 0.0784 | 0.28 |
| F4.C2. S8 Public parking next to street | 7.53 | 30.8025 | −5.55 |
| F4.C2. S9 Slow Traffic speed | 15.29 | 4.884 | 2.21 |
| F5.C1. S1 Width of Curb-to-Curb Roadway | 3.82 | −9.26 | 85.7476 |
| F5.C1. S2 Width of Utility Zones | 4.13 | −8.95 | 80.1025 |
| F5.C1. S3 Building Setbacks | 3.2 | −9.88 | 97.6144 |
| F5.C1. S4 Width of buffer zone | 7.12 | −5.96 | 35.5216 |
| F5.C1. S5 Street reserve | 7.53 | −5.55 | 30.8025 |
| F5.C1. S6 Diversity of buildings | 15.29 | 2.21 | 4.8841 |
| F5.C1. S7 Mixed functionality of Adjacent Buildings | 14.78 | 1.7 | 2.89 |
| F5.C1. S8 Enclosure ratio | 11.40 | −1.68 | 2.8224 |
| F5.C2. S1 Planting diversity, | 6.65 | −6.43 | 41.3449 |
| F5.C2. S2 Sidewalk Lighting, | 2.72 | −10.36 | 107.3296 |
| F5.C2. S3 Width of Landscaping Strips, | 4.03 | −9.05 | 81.9025 |
| F5.C2. S4 Types of Sidewalk Pavement, | 4.43 | −8.65 | 74.8225 |
| F5.C2. S5 Intangible Senses, | 7.05 | −6.03 | 36.3609 |
| F5.C2. S6 Planting deciduous trees, | 9.57 | −3.51 | 12.3201 |
| F5.C2. S7 Length of Tree Canopies, | 8.77 | −4.31 | 18.5761 |
| F5.C2. S8 Number of Street Trees, | 14.85 | 1.77 | 3.1329 |
| F5.C2. S9 Building a Vital Atmosphere in sidewalks, | 10.94 | −2.14 | 4.5796 |
| F5.C2. S10 Street Interface, | 13.98 | 0.9 | 0.81 |
| F5.C2. S11 Heights of Buildings, | 13.30 | 0.22 | 0.0484 |
| F5.C2. S12 Upper-Floor Windows, | 6.83 | −6.25 | 39.0625 |
| F5.C2. S13 Skyline height | 11.03 | −2.05 | 4.2025 |
| = 1029.06 | = 11.18 | (X −)= 3332.25 |
| Path Walkability Scores Rating | Description and Recommendations | |
|---|---|---|
| 25 to 30 |
|
| 20 to <25 |
|
| 10 to <20 |
|
| 5 to <10 |
|
| 0 to <5 |
|
© 2018 by the authors. Licensee MDPI, Basel, Switzerland. This article is an open access article distributed under the terms and conditions of the Creative Commons Attribution (CC BY) license (http://creativecommons.org/licenses/by/4.0/).
Share and Cite
Keyvanfar, A.; Ferwati, M.S.; Shafaghat, A.; Lamit, H. A Path Walkability Assessment Index Model for Evaluating and Facilitating Retail Walking Using Decision-Tree-Making (DTM) Method. Sustainability 2018, 10, 1035. https://doi.org/10.3390/su10041035
Keyvanfar A, Ferwati MS, Shafaghat A, Lamit H. A Path Walkability Assessment Index Model for Evaluating and Facilitating Retail Walking Using Decision-Tree-Making (DTM) Method. Sustainability. 2018; 10(4):1035. https://doi.org/10.3390/su10041035
Chicago/Turabian StyleKeyvanfar, Ali, M. Salim Ferwati, Arezou Shafaghat, and Hasanuddin Lamit. 2018. "A Path Walkability Assessment Index Model for Evaluating and Facilitating Retail Walking Using Decision-Tree-Making (DTM) Method" Sustainability 10, no. 4: 1035. https://doi.org/10.3390/su10041035