Article

‘Urban-Rural’ Gradient Analysis of Landscape Changes around Cities in Mountainous Regions: A Case Study of the Hengduan Mountain Region in Southwest China

1
Key Laboratory of Land Surface Pattern and Simulation, Institute of Geographic Sciences and Natural Resources Research, Chinese Academy of Sciences, Beijing 100101, China
2
University of Chinese Academy of Sciences, Beijing 100049, China
3
School of Geographical Sciences, Guangzhou University, Guangzhou 510006, China
*
Author to whom correspondence should be addressed.
Sustainability 2018, 10(4), 1019; https://doi.org/10.3390/su10041019
Submission received: 27 February 2018 / Revised: 27 March 2018 / Accepted: 27 March 2018 / Published: 30 March 2018

Abstract

:
It is of great significance to explore landscape pattern changes around urban areas to maintain regional ecological security and encourage sustainable development. Few studies have focused on the small cities located in the mountain regions. In this study, we established an ‘urban-rural’ gradient, and combined with landscape metrics to analyze the spatial-temporal changes of the landscape pattern around cities located in the Hengduan Mountain region in China. We also explored the impacts of topography on urban sprawl using the ‘relief degree of land surface’ index. Our results showed that: (1) There was an inverse relationship between the urban sprawl and restricted topography; (2) From the city center to rural areas, the landscape dominance degree and connectivity decreased initially and then increased, while the diversity presented an opposite trend and the shape complexity increased first and then fluctuated; (3) For temporal changes, in the internal buffers, the landscape dominance degree and connectivity increased, and the shape complexity and diversity decreased. However, in the outer buffers, the landscape showed opposite trends. It is advisable to use gradient and landscape metrics to explore landscape pattern changes. Similar to cities on plains, the landscape around mountain cities exhibits a circular structure, however, it also possesses unique characteristics when facing topographic restrictions.

Graphical Abstract

1. Introduction

Rapid population and economic activity growth and the significant expansion of urban land have led to unprecedented global urbanization in the past sixty years [1,2,3]. In 1950, less than one-third of the world’s population lived in cities. With the acceleration of urbanization, the proportion of urban population exceeded the rural population for the first time in 2007, and the proportion of the total population living in urban areas reached 54% in 2014 [4]. In China, urbanization has developed rapidly, especially since the implementation of the ‘Reform and Opening-up’ policy. From the initial implementation of the policy to 2015, the urban population increased from 170 million to 770 million, and the corresponding level of urbanization sharply increased from 17.9% to 56.1% [5]. Urbanization, on one hand, has improved people’s quality of life by transforming their culture, lifestyles, and consumption. On the other hand, it has also caused degradation of ecosystem functions by altering land use structures [6,7,8,9,10,11,12,13,14,15,16]. Studies have shown that urban land expansion and land use changes associated with urbanization are among the main drivers for habitat loss and threats to biodiversity [17,18], and urbanization has strongly promoted the homogenization of flora and fauna [19,20]. In addition, land use changes during urbanization have affected carbon, water, and energy balances, thus leading to changes in regulating and provisioning ecosystem services [11,21]. Although it only occupies a small area of the planet’s surface, the expansion of urban land causes ecological changes beyond urban boundaries and even on a global scale [22]. Therefore, broadening our understanding of the spatiotemporal dynamics of land use change due to urbanization is important for exploring the ecological effects of urbanization and regional sustainable development.
Satellite remote sensing technology has been widely used in monitoring multi-scale changes in land use/cover, and the emergence of high temporal and spatial resolution images provides a database for continuous observation of spatiotemporal changes in land use surrounding cities [23,24,25,26,27]. Landscape ecology, as an interdisciplinary subject between geography and ecology, provides a new perspective for studying land use change [28,29,30]. ‘Landscape metrics’ can quantitatively characterize land use patterns from different aspects [31,32,33,34], and the ‘gradient’ reflects continuous changes in landscape heterogeneity in certain directions [20]. The ‘urban-rural’ gradient was first introduced by McDonnell and Pickett [35] to study urban ecosystems, and this approach is often combined with landscape metrics for exploring land use composition and structure changes caused by rapid urbanization, aiding our understanding of urban ecological processes [36,37,38,39,40]. Different ‘urban-rural’ gradients were established according to various research objects and content: based on buffer zones, Seto [1] and Wu [2] created a series of concentric annulus as an ‘urban-rural’ gradient when studying plain cities in the Pearl River Delta and Beijing-Tianjin-Shijiazhuang, respectively, and then analyzed the landscape metrics within each buffer; Li [41] and Fan [42] created a transect from an urban center to a rural area following a certain direction as an ‘urban-rural’ gradient in their Shanghai and Guangzhou urban land use change studies. It should be noted that such studies have mainly focused on the metropolitan areas on plains. However, little attention has been paid to small cities, which are the most in China. It should also be noted that these studies paid more attention to urban land changes, rather than changes throughout the whole landscape.
Mountain regions are both important ecological functional areas and sensitive to climate change and human activities [43]. Mountain regions, with their unique climate, geology, and hydrology, enable a variety of ecosystems and provide a vast array of ecosystem services to residents and populations in the lowlands [44,45,46]. However, these regions also frequently experience debris flow and other natural disasters, and the ecological environment is highly vulnerable to damage but difficult to recover [47]. China is the most mountainous country in the world, and mountain or plateau regions account for approximately 69% of the territory. Approximately 46.71% of China’s counties are distributed in mountains, while mountain dwellers account for 45% of the country’s total population [48,49,50]. Mountainous regions in China are almost always poverty-stricken and urbanization in these regions is below the national average level [51]. At the same time, mountain regions often harbor tourism, energy, and mining resources, which would support the economic development of the mountain itself and that of neighboring areas [52]. In the future, with urbanization, advancement of agricultural industrialization, and poverty alleviation, land use patterns will be greatly altered, along with capacities for various ecosystem functions. The human well-being integrated economy and ecosystem services for the populations of the mountain and neighboring areas would change, so it is necessary to focus on changes in land use patterns caused by urbanization in mountainous regions.
Several theories about land use patterns around cities have been proposed. “Thünen rings”, introduced by Thünen [53] in their study about plain cities, and the “Concentric zone model”, proposed by Burgess [54] in their survey of Chicago, suggest that the land use pattern around cities is circular in structure, i.e., land use structure changes consistently with changes in distance from the city center (Figure 1). Based on these two previous studies, further work has been conducted on the spatial structure of land use around cities globally [28,55,56]. However, few studies have studied this around small cities in mountainous regions. Unlike plain cities or a metropolis, cites in mountain regions are smaller and typically influenced by topography. What is the land use pattern around these cities? Does it also have a concentric structure? Determining similarities and differences in land use patterns around cites located in plains and mountains is important for mountain city development when using experience from plain cities. Hengduan Mountain region is an ideal area for such a study, as it has significant ecological functions (it contains the second largest forest in China areas and upper river reaches) and a fragile human-environment relationship. In this study, using remote sensing data captured in the Hengduan Mountain region, we determined the spatiotemporal characteristics of land use changes around 8 typical cities by integrating landscape metrics with ‘urban-rural’ gradient analysis. The objectives were to: (1) acquire land use data from remote sensing images and detecting its changes; (2) quantify the sprawl of each city in different directions and the relationship with topography; (3) explore the spatiotemporal changes in land use patterns along the ‘urban-rural’ gradient; and (4) compare the similarity and differences between mountain and plain cities.

2. Materials and Methods

2.1. Study Area

Located in the southwest of China (24°39′ N~33°34′ N, 96°58′ E~104°27′ E), the Hengduan Mountain region covers the eastern Tibet Autonomous Region, western Sichuan Province, and northwestern Yunnan Province under which there are 99 counties (Figure 2) and has a total area of approximately 434,463 km2. The elevation ranges from 306 m to 7143 m, which decreases from the northwest to the southeast. This region is a typical Longitudinal Range-Gorge Region [57], characterized by an array of parallel mountains and rivers stretching from north to south with relatively large variation elevation [58].
Forests and grasslands are the main land use types, with proportions reaching 88% of the total area. However, cities scatted within basins or valleys cover below 0.03% of the area, have different spatial forms due to restrictions from terrain conditions. The population increased from 15.82 million in 1990 to 21.23 million in 2010 at a rate of 34%, and urban areas grew from 143 km2 to 327 km2. The eight main cities (Chuxiong, Lijiang, Xichang, Shangri-La, Dali, Barkam, Kangding, and Panzhihua) in the Hengduan Mountain region differ from each other in their shapes, scale, and sprawl direction, which aids in elucidating common features of mountain city development.

2.2. Remote Sensing Images and Data Processing

In this study, Landsat images were the main data source used to obtain land use maps and detect land use changes. The images were downloaded from the USGS website (http://www.usgs.gov/) for the period of 1990 to 2010 at ten-year intervals (1990, 2000, and 2010). The path and row number ranged from 129 to 143 and 37 to 43, respectively, resulting in a final 126 images. Using the professional remote sensing data processing tools ENVI 5.3 and ArcGIS 10.2, we first calibrated these images to topographic maps based on ground control points, and then mosaicked multiple images from the same period into one image. Finally, we extracted the Landsat TM images based on the exact boundaries of the study area. Referring to the classification system proposed by Liu [59], we divided land use into 6 categories (cultivated land, forested areas, grassland, water areas, built-up land, and unused land). Considering the long distance between urban land and other built-up areas, we further categorized the built-up land into urban land, rural settlements, and other built-up lands, thus there were eight land use categories. Validation of land use data was conducted following two methods: (1) comparison with related literature and statistical data; (2) comparison with records and photographs obtained using the random sampling method during field investigation. The accuracy of the eight land use classes reached 90.02%, 86.70%, and 91.04% for 1990, 2000, and 2010 respectively, which would meet the requirements for detecting land use pattern changes.

2.3. Framework

Based on the land use data obtained above, we analyzed dynamic land use changes around the eight cities in the Hengduan Mountain region to ascertain landscape patterns and the sources of newly developed urban land areas. Following this, we analyzed the main sprawl direction of different cities and the determining factors for this by assessing urban land proportion (PLAND metric) in eight directions and terrain conditions. We then analyzed the spatiotemporal changes of different landscape metrics by establishing an ‘urban-rural’ gradient to identify whether there is a typical pattern for landscape changes around cities in a mountain region. Finally, based on the results above, we considered the characteristics and developed a principle for landscape pattern changes around mountain cities with urbanization (Figure 3).

2.3.1. The ‘Urban-Rural’ Gradient

The primary task of this work is to divide the space around cities according to distance from the city center, i.e., to generate a suitable ‘urban-rural’ gradient for each city. Dali Old City was isolated from Dali City, so we created a gradient for both. Panzhihua City consists of several parts. To facilitate the gradient setting, these parts were classified into Panzhihua Eastern and Panzhihua Western City. According to the land use data, the shape of the eight cities can be summarized as focal (Chuxiong, Lijiang, Xichang, Shangri-La, Dali, and Panzhihua) and linear forms (Barkam and Kangding). The geometric center of the focal form cities and the centerline of the linear form cities were regarded as the center of each city, and then a series of buffers rings were generated from the city center. As there is inadequate data about gradients in mountain cities, we delineated the buffers with equal interval width. Using a uniform width is difficult as there are different scales and development ratios for each city. The choices of the number and width of buffers were based on experience, but followed four criteria. The first criterion is that the buffer width of larger cities should be longer, and vice versa. Second, the buffers should allow the landscape to be compared by time. Third, the spacing of two buffers should not affect the value of landscape metrics. Fourth, the outline of the outermost buffer could be the smallest circle that contains all urban land in 2010, or expands outwards for one to two rings, based on each cities’ characteristics. The gradient details for each city are listed in Table 1.

2.3.2. Landscape Metrics

Numerous metrics have been developed to describe landscape patterns from different aspects [60,61]. However, there is no single metric that could comprehensively represent the landscape, so a series of metrics were needed. Referring to relevant urban studies, we selected several landscape metrics to conduct our analysis. Four landscape-level metrics were chosen to characterize the whole landscape and its changes [62]: Largest Patch Index (LPI), Area Weighted Mean Patch Fractal Dimension (AWMPFD), Contagion Index (CONTAG), and Shannon’s diversity index (SHDI). One class-level metric was used to present the sprawl of the urban area: Percentage of Landscape (PLAND). The details of each metric are listed in Table 2. All of these metrics were calculated using FRAGSTATS 4.2.

2.3.3. Urban Sprawl and Relationship with Terrain

We further analyzed the PLAND metric for urban land and terrain conditions in different directions. Four transects cutting across the city center with an angle of 45° were used to divide each city into eight parts: north (N), northwest (NW), west (W), southwest (SW), south (S), southeast (SE), east (E), and northeast (NE). For terrain conditions, we used the ‘relief degree of land surface’ index to reflect terrain complexity. The index was defined as follows [63]:
RDLS = { [ Max ( H ) Min ( H ) ] * [ 1 P ( A ) A ] } / 500
where RDLS is the relief degree of the land surface, Max(H) and Min(H) are the maximum and minimum elevation in a certain region respectively, P(A) is the area of ground with a slope lower than 10°, and A is the total area of a certain region.

3. Results

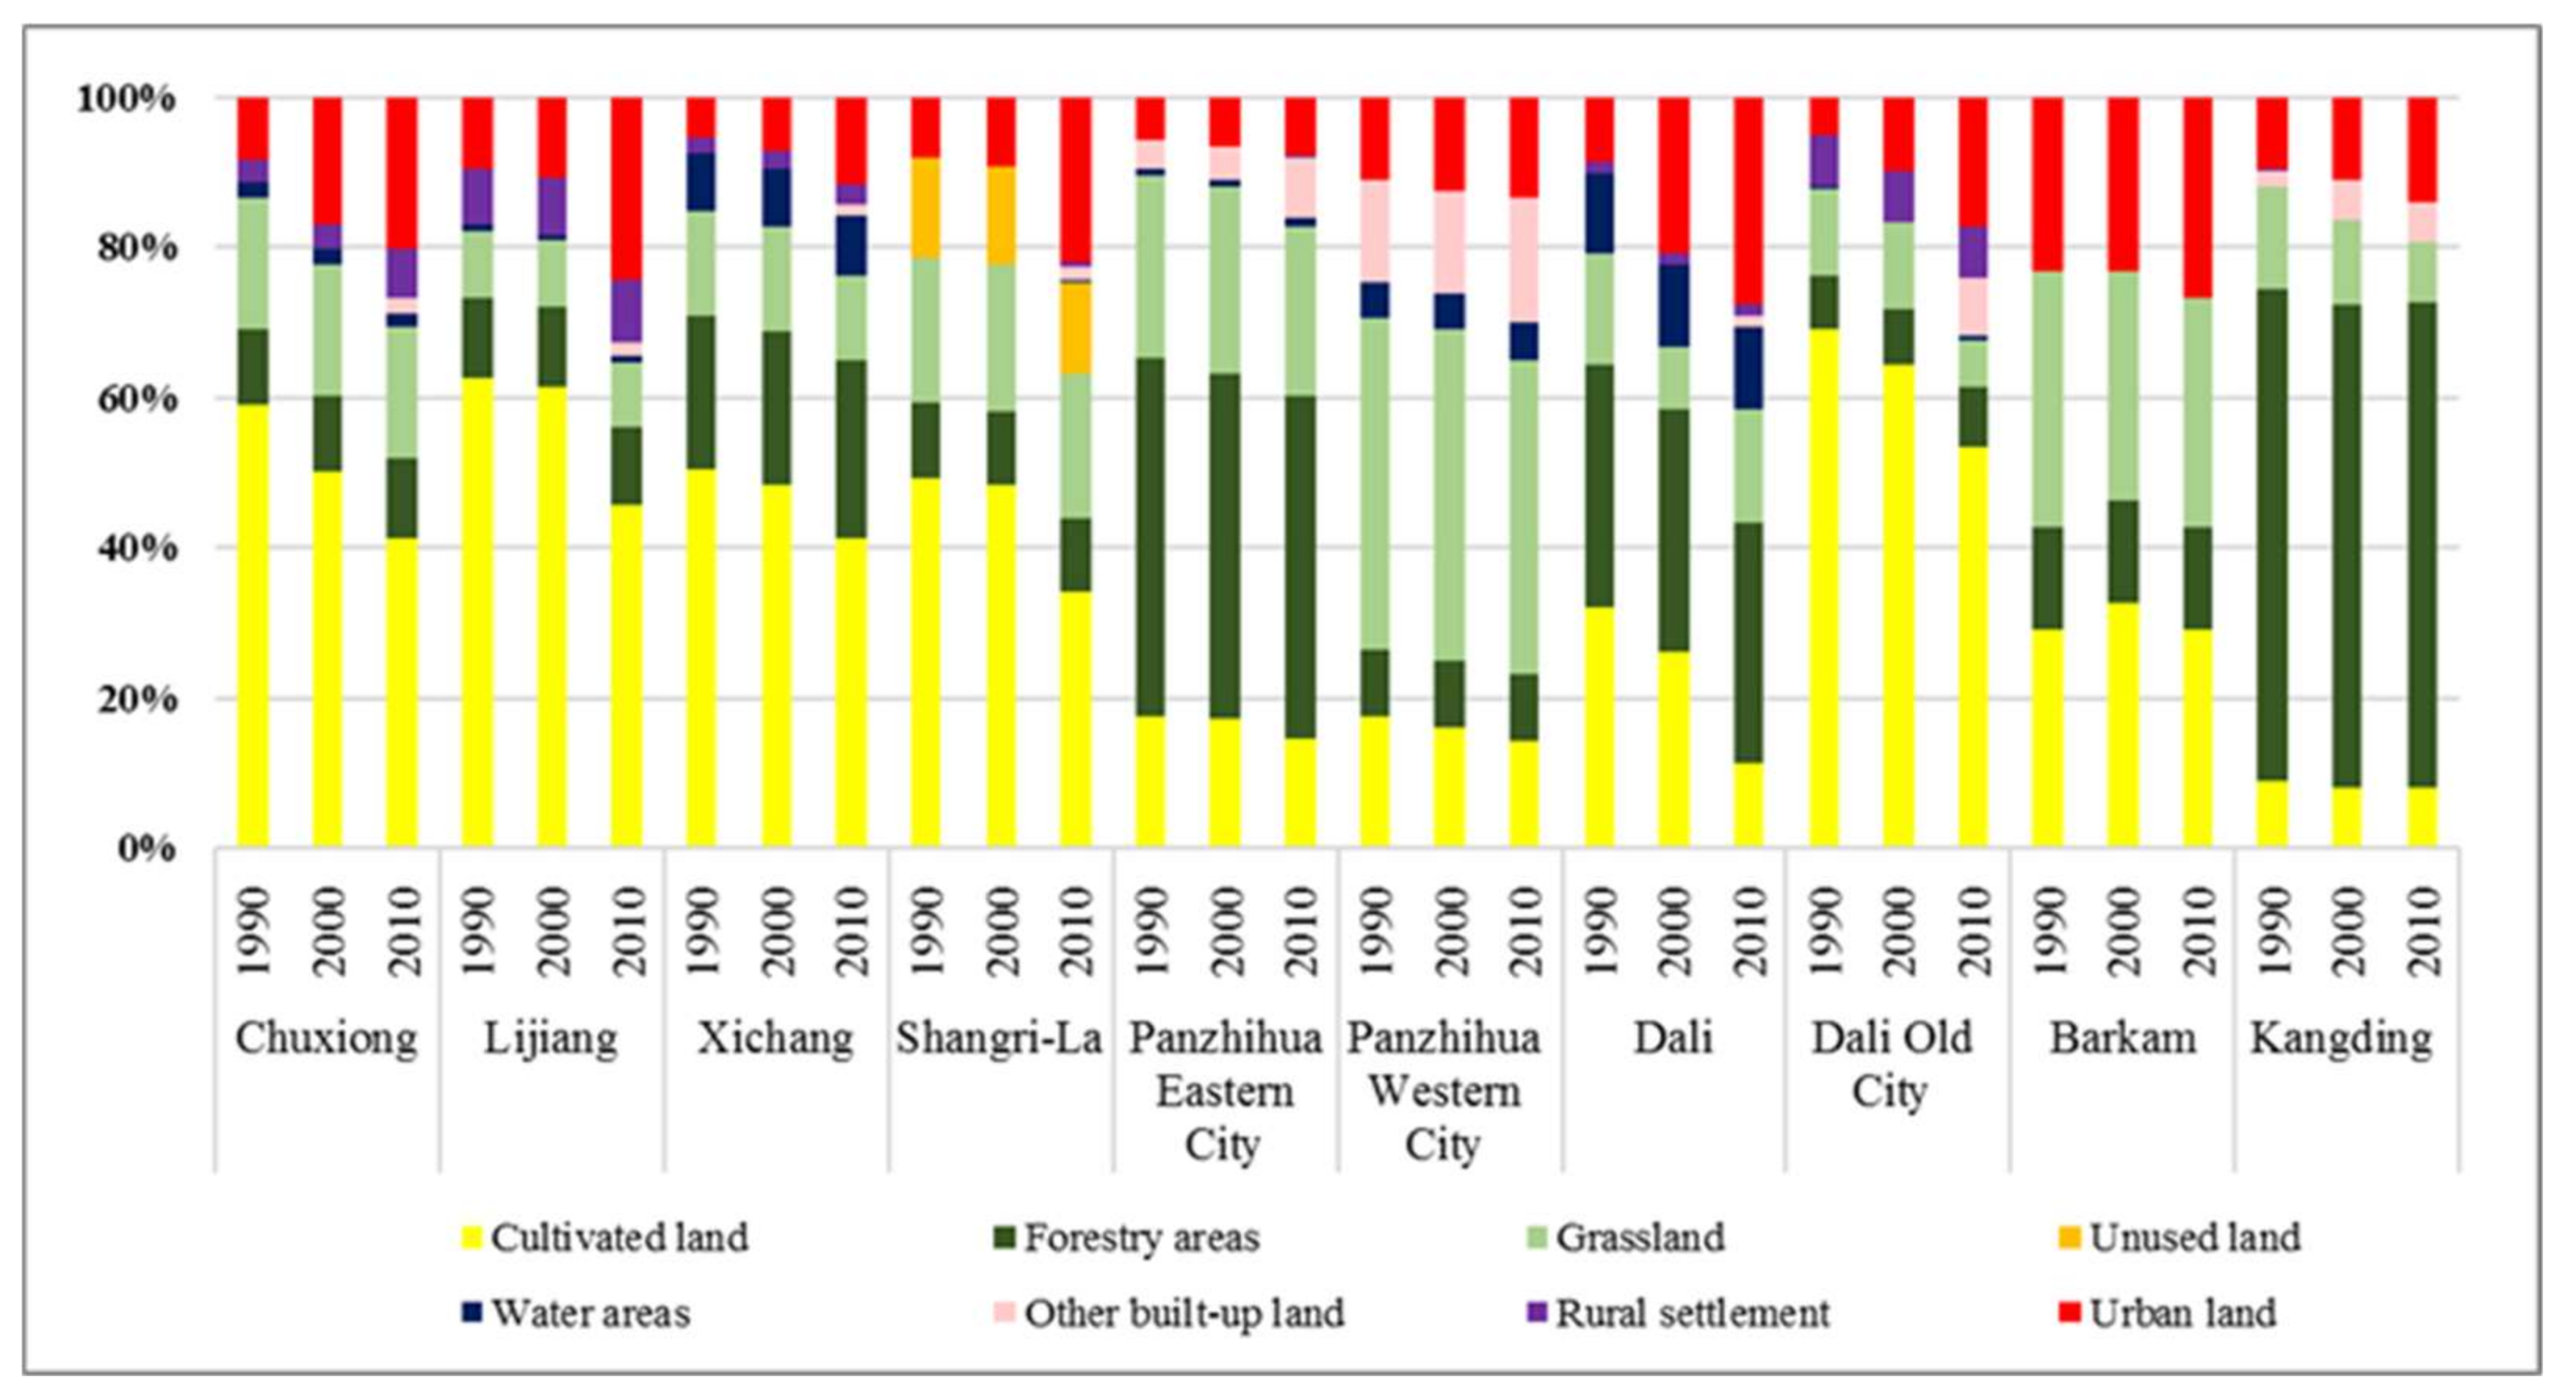
3.1. Land Use Changes around Cities

To explore the landscape pattern surrounding cities, changes in land use composition were considered. We focused on the smallest circles around cites that contain all of the 2010 urban land, and found that cultivated land is the most common type for most of the cities, while the forest area was the largest land type in Panzhihua Eastern City and Kangding, and grassland covered the largest area in Panzhihua Western City and Barkam (Figure 4). Land use changes were characterized by the increase in built-up land (including urban land, rural settlements, and other built-up land types), especially urban land. Newly developed urban land often originated from cultivated land, forest areas, and grassland between 1990 and 2010. For Chuxiong, Lijiang, Xichang, Shangri-La, Dali, and Panzhihua Eastern City, the expansion of urban land was due to the conversion from cultivated land during two periods. The newly established urban land of Panzhihua Western City primarily originated from cultivated land and grassland. In Kangding, urban land sprawl primarily originated from forest areas in the first stage, and grassland in the second stage. The growth of urban land in Barkam occurred primarily in 2000–2010 in grassland areas.

3.2. Urban Sprawl and Terrain

To display the RDLS and corresponding urban land PLAND index simultaneously, we standardized the RDLS value in different directions. Figure 5 shows that urban land has expanded continuously over the past 20 years, and there are differences in the development period between the eight cities. The urban land in Chuxiong mainly expanded during the first stage (1990–2000). Compared with the first stage urban land expanded more quickly during 2000–2010 in Lijiang, Xichang, Shangri-La, Dali Old City, and Barkam. In Panzhihua Eastern and Western City, Kangding, and Dali, urban land increased with an almost equivalent ratio.
The RDLS value was complementary with the urban PLAND index in different directions (Figure 5). PLAND was larger when RDLS was lower in a certain direction, PLAND would further increase over time, and vice versa. Using Panzhihua Eastern City as an example, RDLS has high value in the north, northwest, and western directions, while the urban percentage was high with noticeable development in the opposite directions (the east, southeast, and south) due to terrain restrictions. A similar phenomenon can be found in other cities, such as Chuxiong or Lijiang. RDLS here refers to the average value in each direction, and higher RDLS values do not indicate a lack of flat areas, so the urban PLAND index of Xichang, Dali Old City, and Kangding would increase in directions where RDLS is higher. The newly developed urban land of Xichang is mainly located in the slender piedmont lowlands in the south, while the expansion of Dali Old City is primarily focused in the lowlands in the western and southwestern directions.

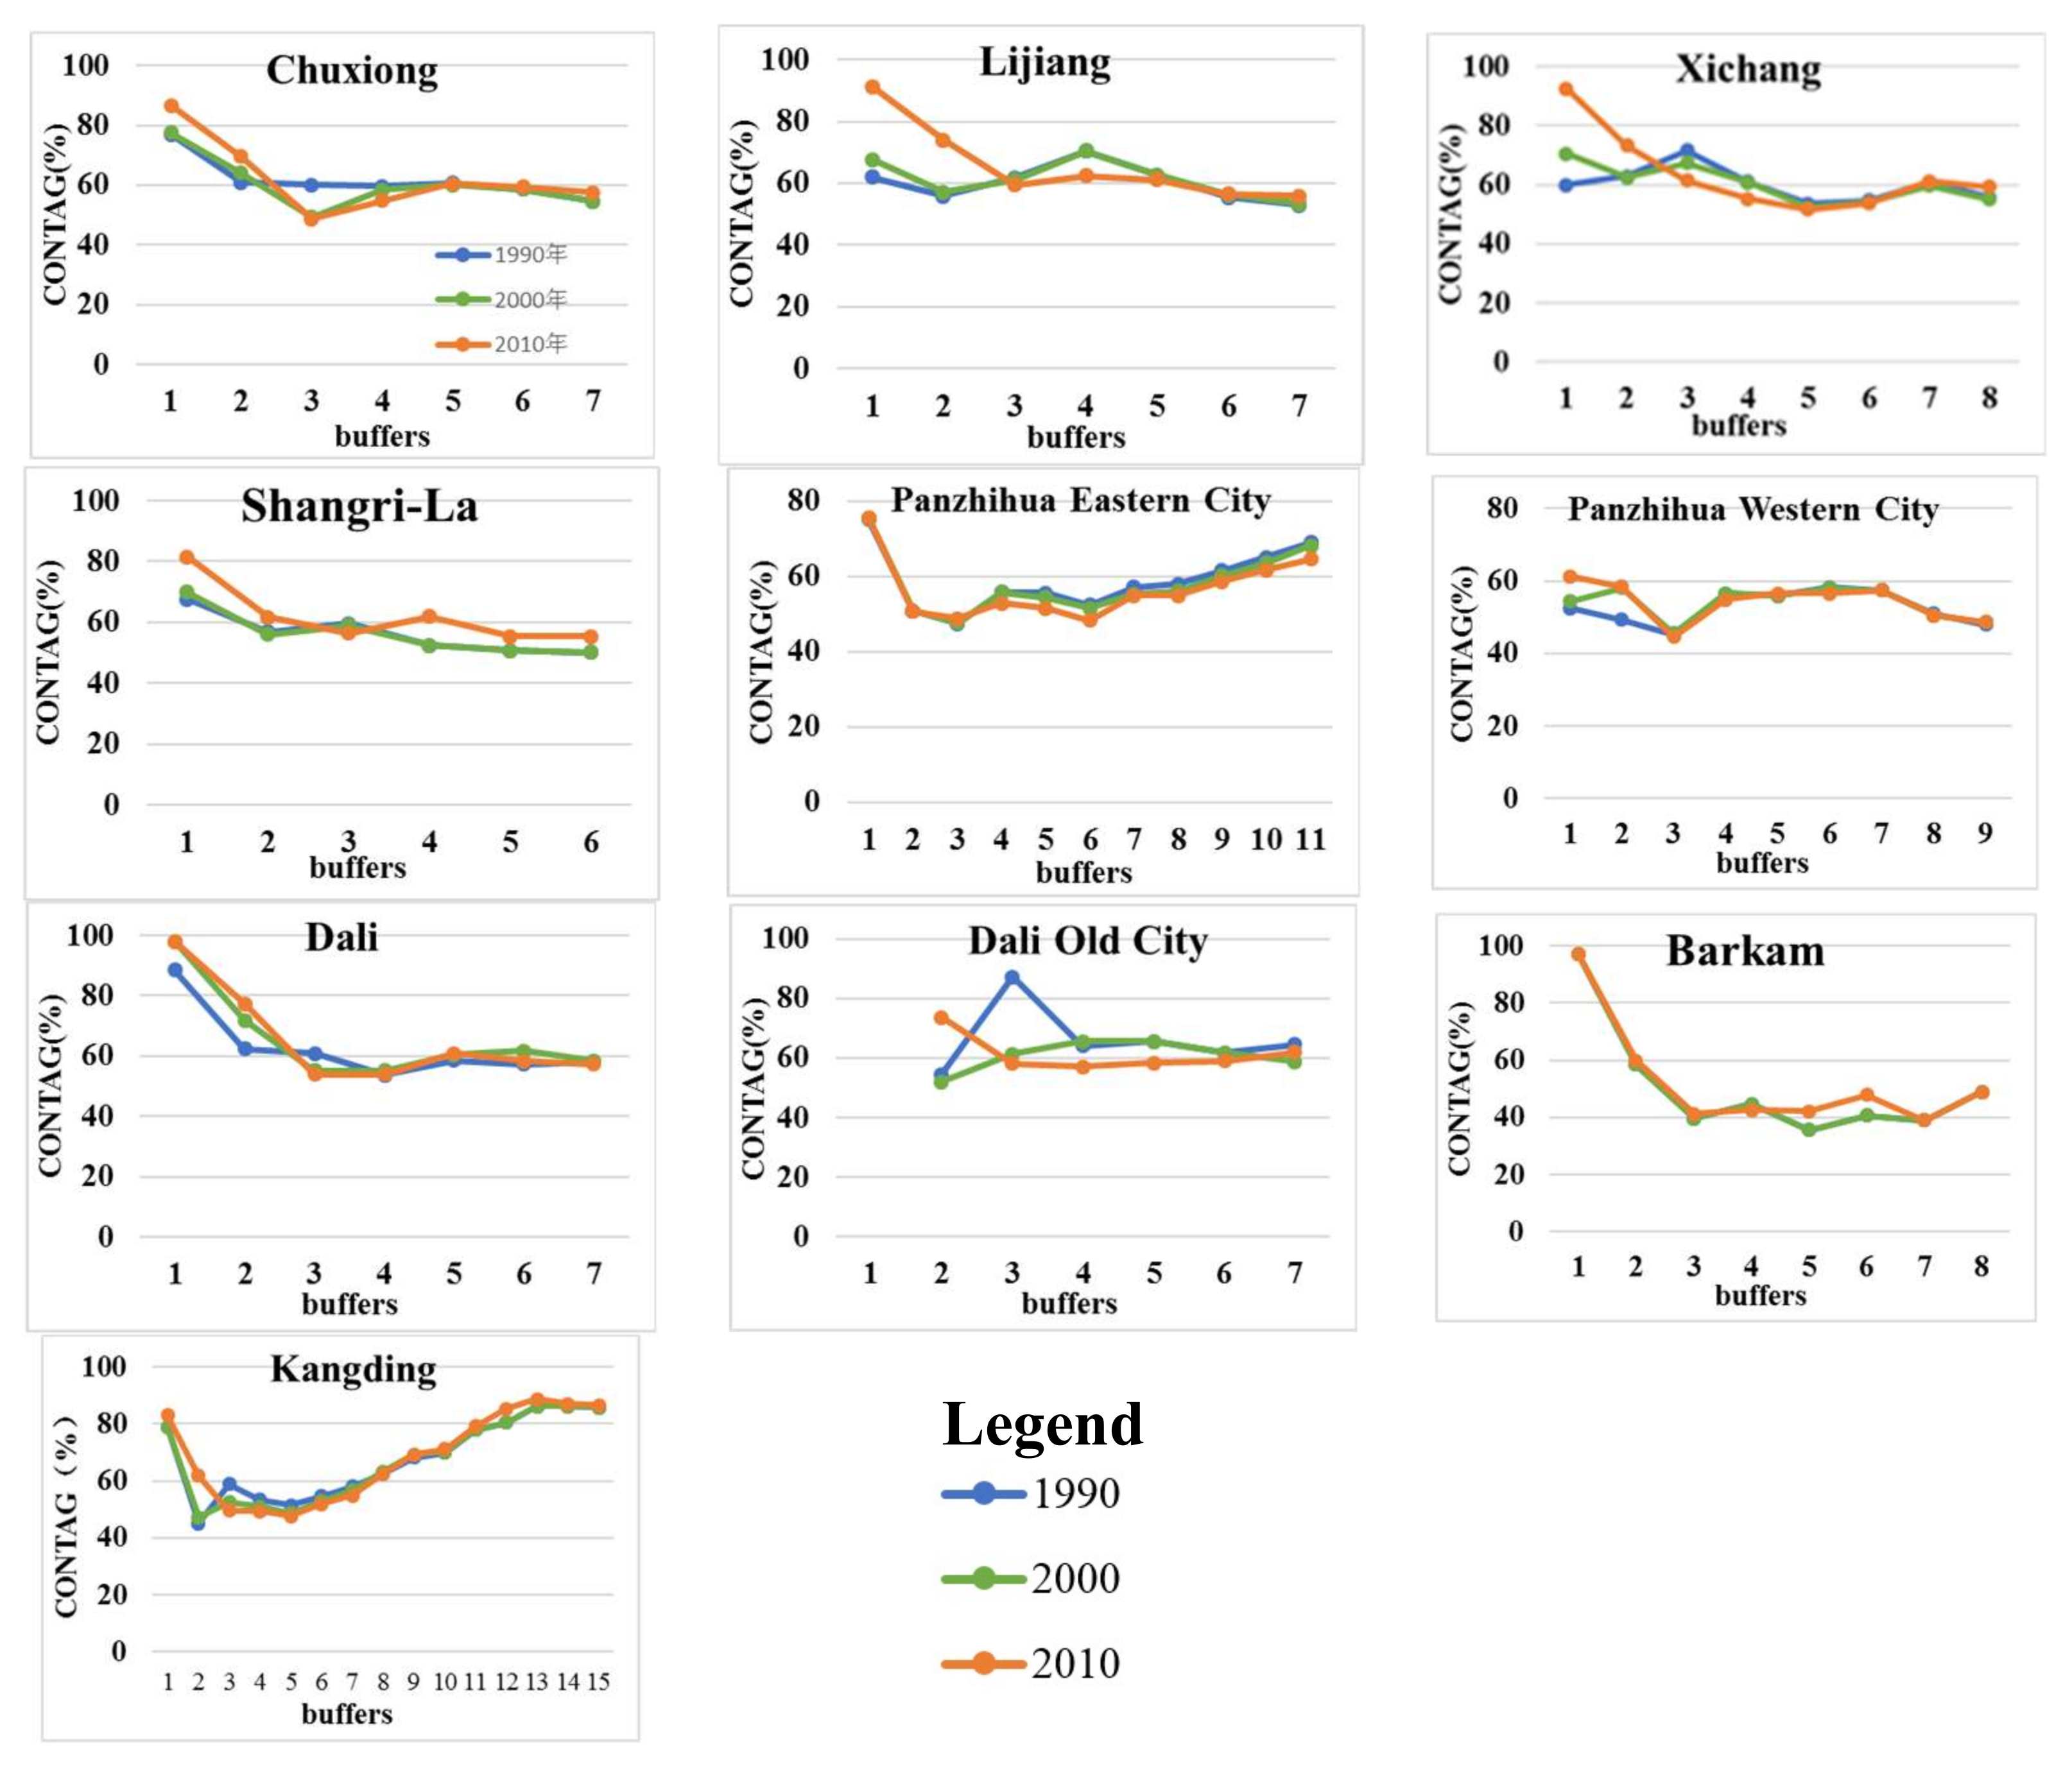
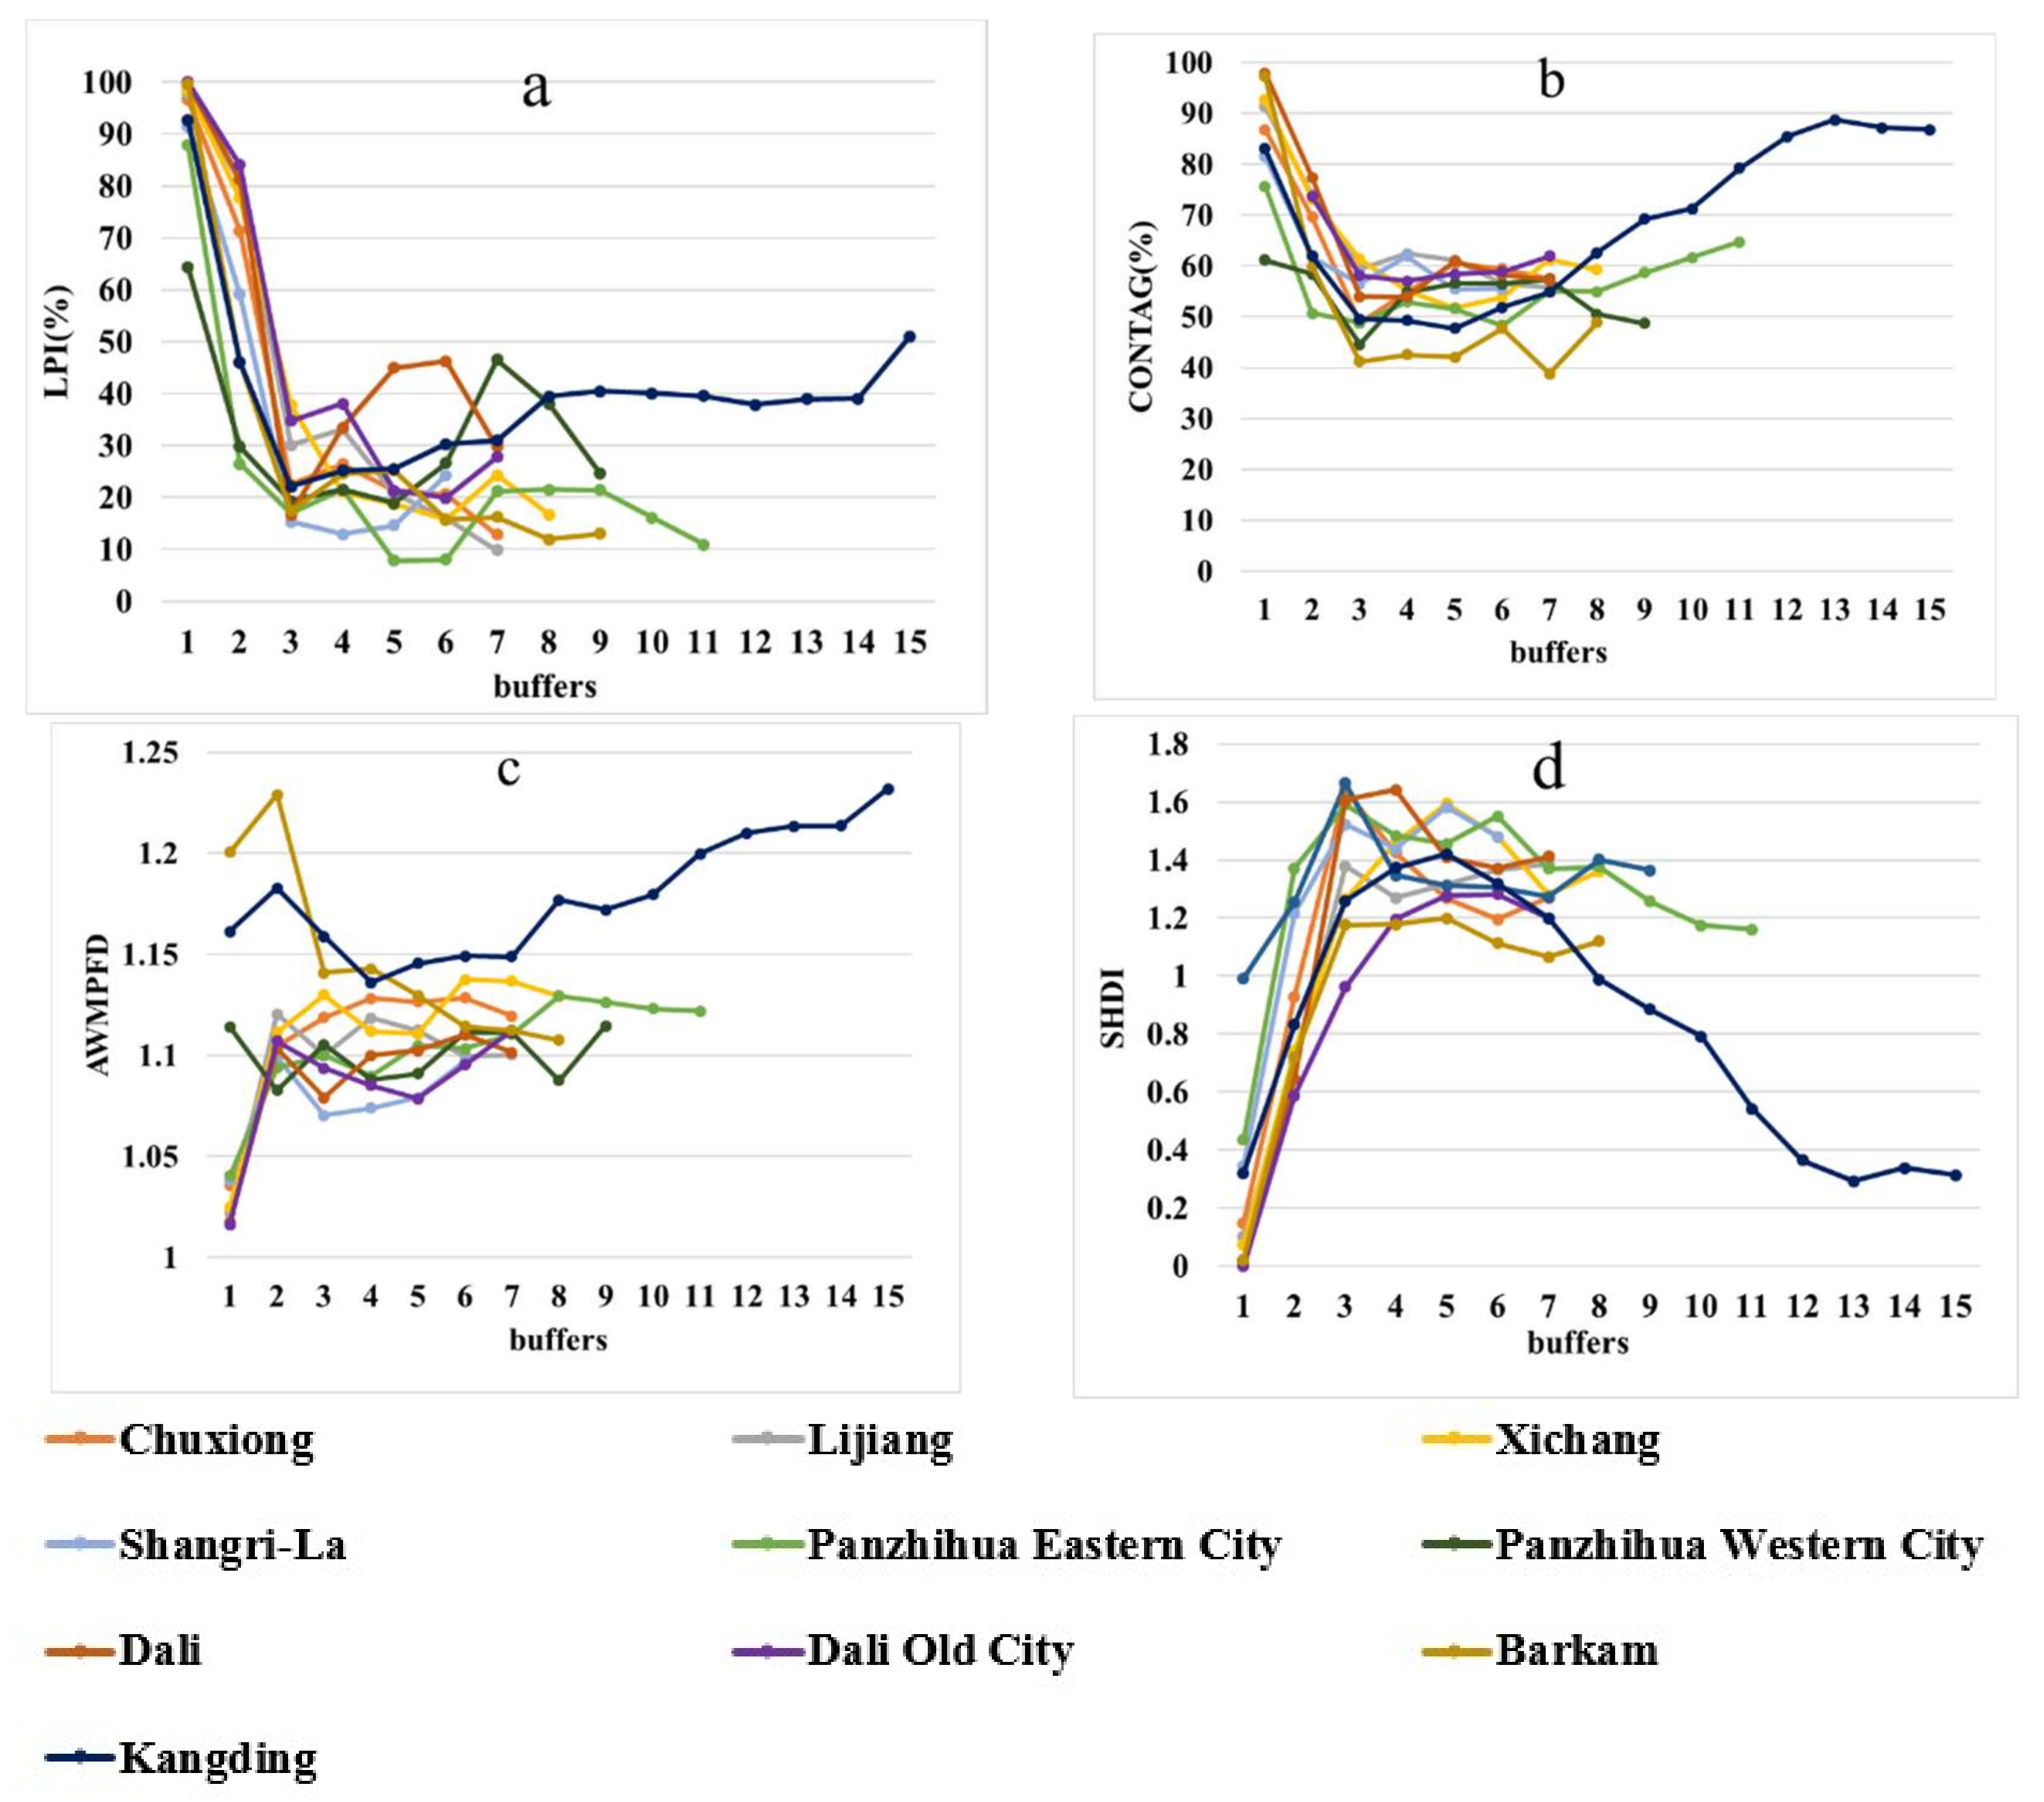
3.3. Spatial Heterogeneity of Landscape Patterns around Cities

To elucidate the spatial pattern of the landscape surrounding cities in the Hengduan Mountain region, landscape-level metrics were applied to quantify spatial heterogeneity along the ‘urban-rural’ gradient. From the city center to suburban and then rural areas, urban land gradually became occupied by other land types, and thus there were changes in landscape dominance, shape complexity, connectivity, and diversity. In Figure 6, the value 1 on the horizontal axis refers to the innermost buffer containing the city center, and the other positive values represent the numbers of buffers from the city center to rural areas in sequence.
The curve of LPI (Figure 6a) and CONTAG (Figure 6b) showed similar declining, then increasing trends. Both metrics were higher in the inner buffers. In the first buffer, the value of LPI exceeded 85%, which indicated high landscape dominance. In terms of CONTAG, the landscape possesses a higher connectivity in the first and second buffers, with values exceeding 80% and 60% for each city. Then, with an increase of distance from the city center, LPI and CONTAG decreased rapidly. The lowest LPI values were located in the third buffer of Chuxiong, Lijiang, Shangri-La, Dali, Dali Old City, and Kanding, the fourth buffer of Xichang, the fourth and fifth buffers of Barkam, and the third to sixth buffers of Panzhihua Eastern and Western Cities. The lowest CONTAG value in Chuxiong, Lijiang, Xichang, Shangri-La, Panzhihua Eastern and Western Cities, Dali, Dali Old City, Barkam, and Kangding were located in the third, third to fifth, fourth to fifth, second to third, third to sixth and third, third to fifth, third to fourth, third to fifth, and third to fifth buffers, respectively. After that, the LPI and CONTAG inverse to increase moderately, but to values well below those in the inner buffers.
Unlike the previous metrics, the SHDI metrics exhibited an opposite pattern (an inverted U-shape) from the city center to rural areas, and the AWMPFD increased first and then fluctuated. The value of AWMPFD (Figure 6c) was expected to increase during early urban development when new urban patches created irregular shape patches. For most cities, landscape patches were more regular in the inter buffers due to mature urban development. With increasing distance from the city center, new urban patches appeared, so landscape complexity increased to a peak. The largest value occurred in the third to fifth buffers for Chuxiong, the second to fifth for Lijiang, the second to eighth for Xichang, the second buffers for Shangri-La and Barkam, the second to sixth for Dali, and the second to third for Dali Old City. Then, towards the outer edge, the curve exhibited a wave-like pattern. Three cities did not follow this trend. The peak appeared in the eighth to the tenth buffers and the ninth buffer of Panzhihua Eastern and Western Cities, respectively, which can be ascribed to the small percentage in each buffer increase the complexity. The similar pattern of Kangding was primarily related to the construction of the buffer zone.
In terms of SHDI, the innermost buffer possessed the lowest diversity, with a value below 0.7 for most cities other than Panzhihua Western City (Figure 6d). Landscape diversity increased along the gradient as other land types appeared. The highest value appeared in the third to fourth buffers of Chuxiong, Lijiang, Shangri-La, and Dali, the fourth to sixth buffers of Xichang and Dali Old City, the third to sixth buffers of Panzhihua Eastern City and Kangding, the third buffer of Panzhihua Western City, and the third to fifth buffers of Barkam. Outwards towards the rural area, the artificial system became occupied by natural land types, reducing landscape diversity.

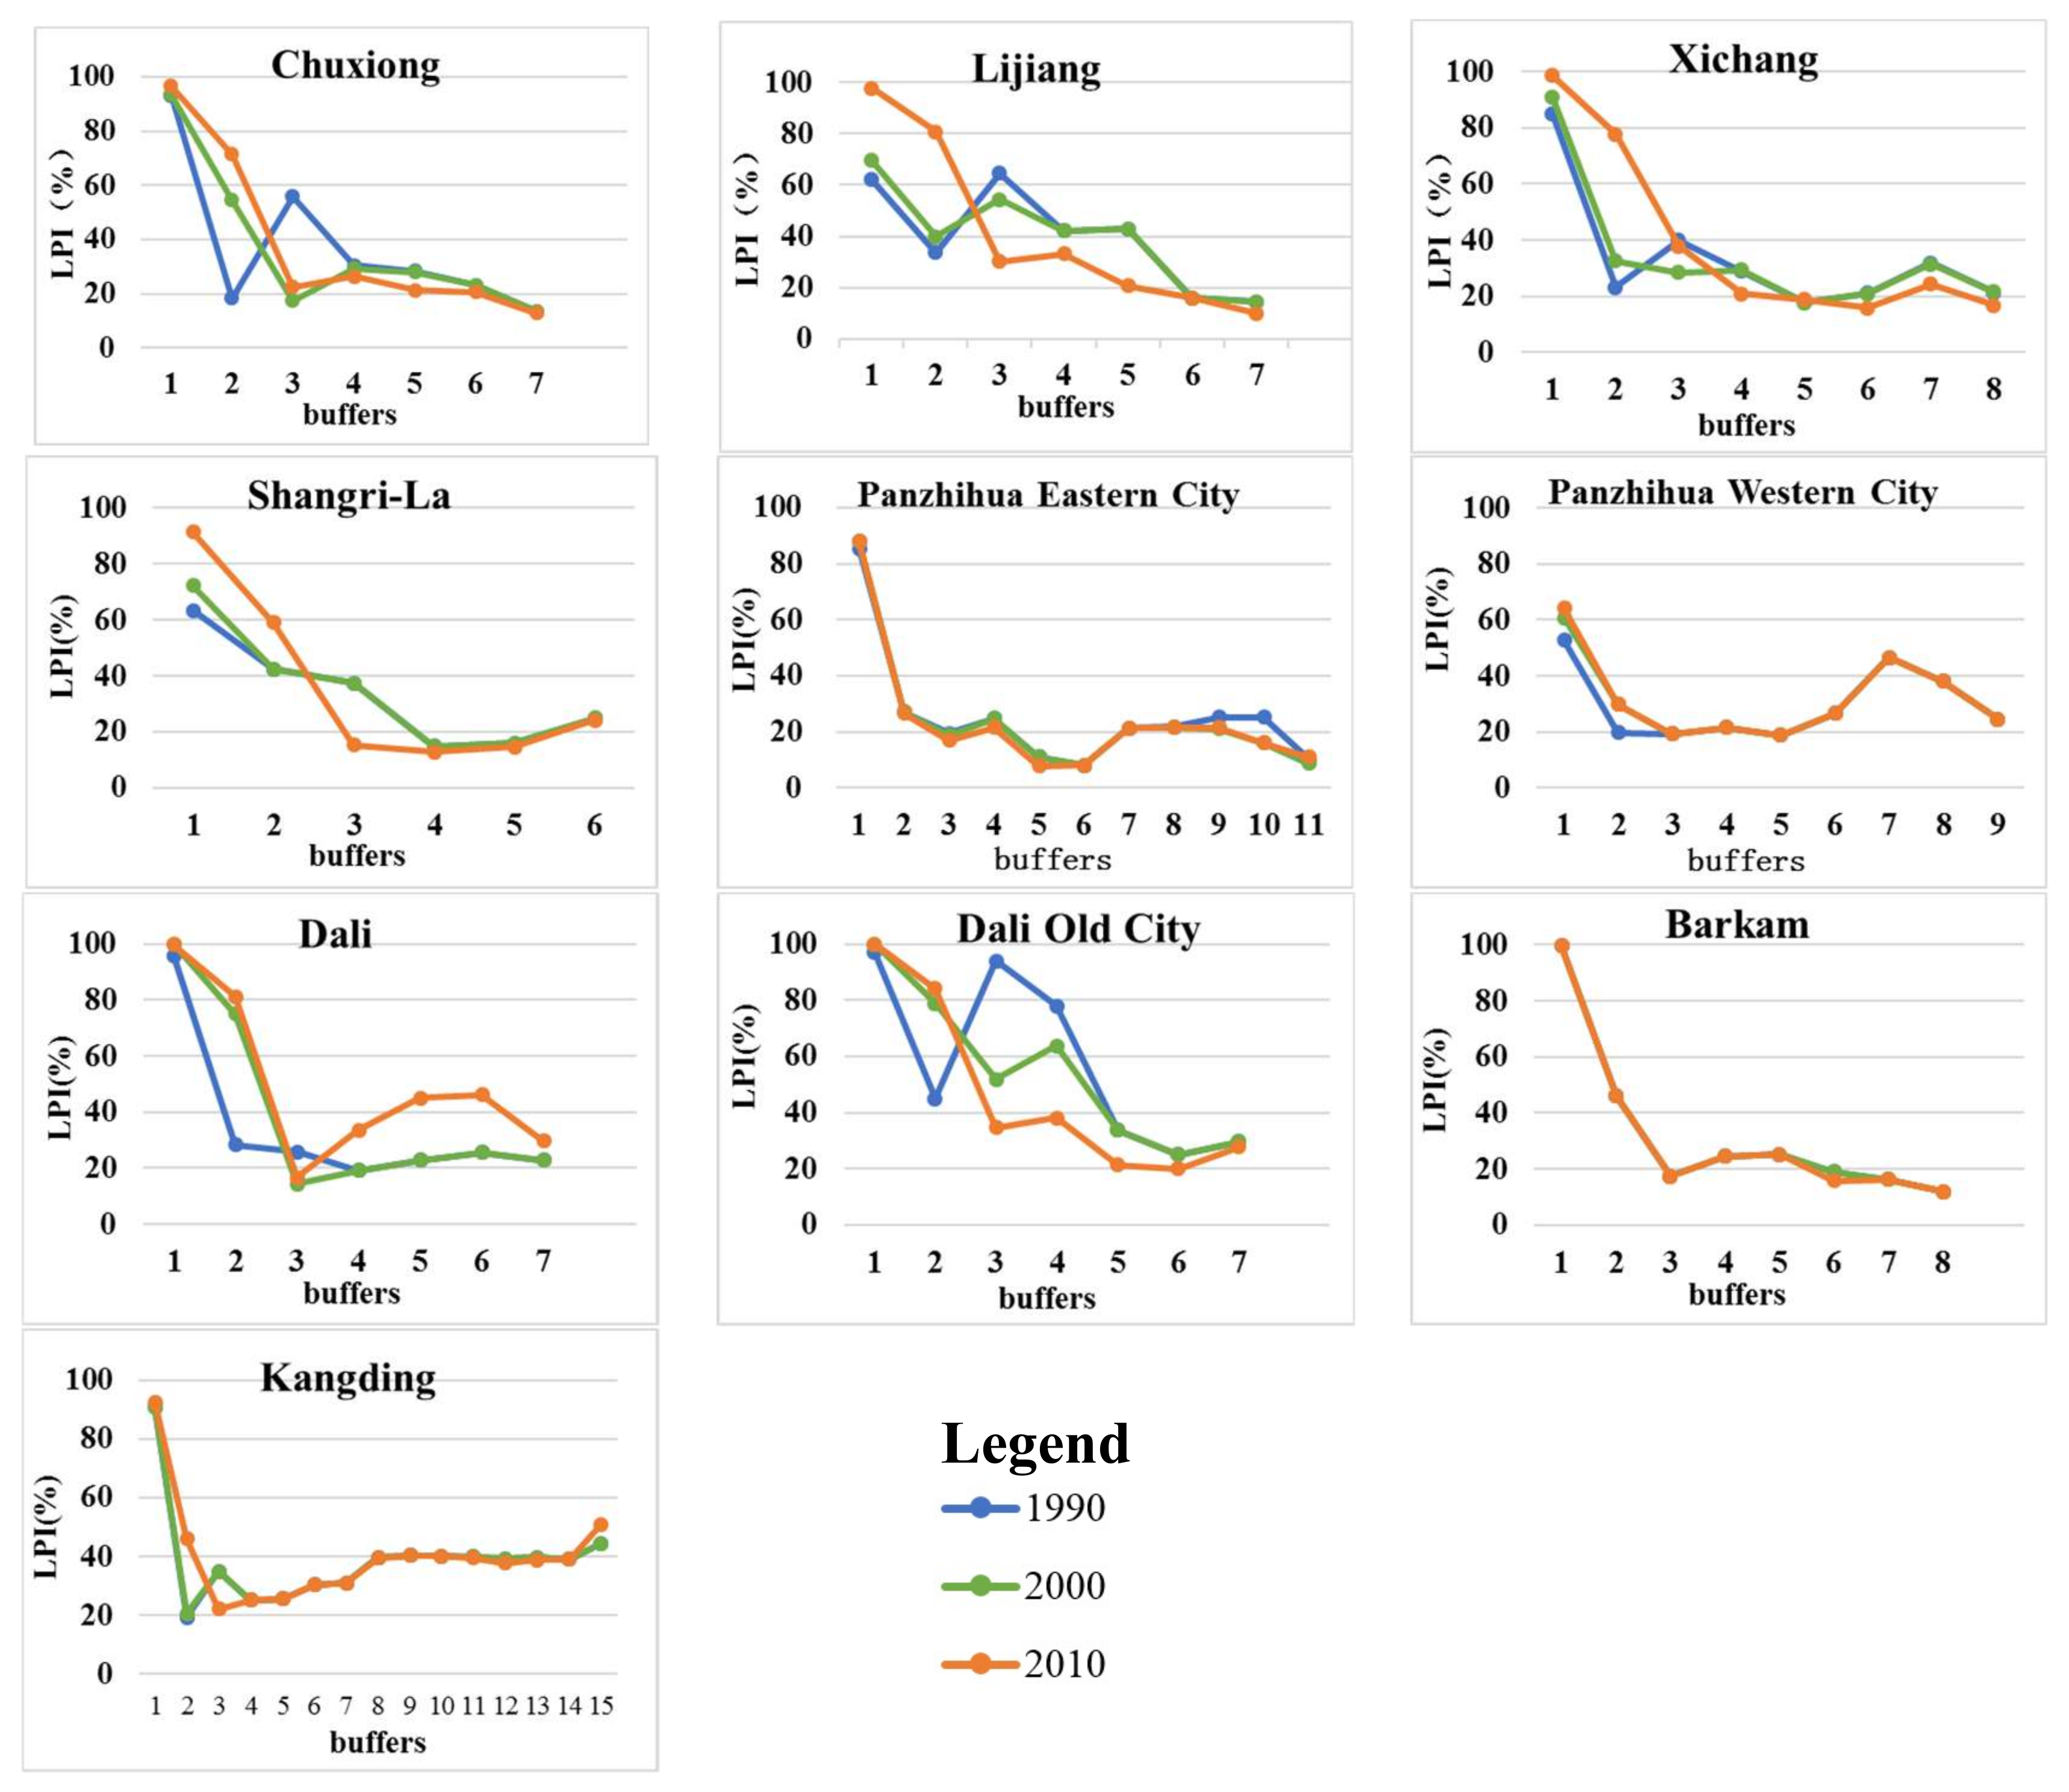
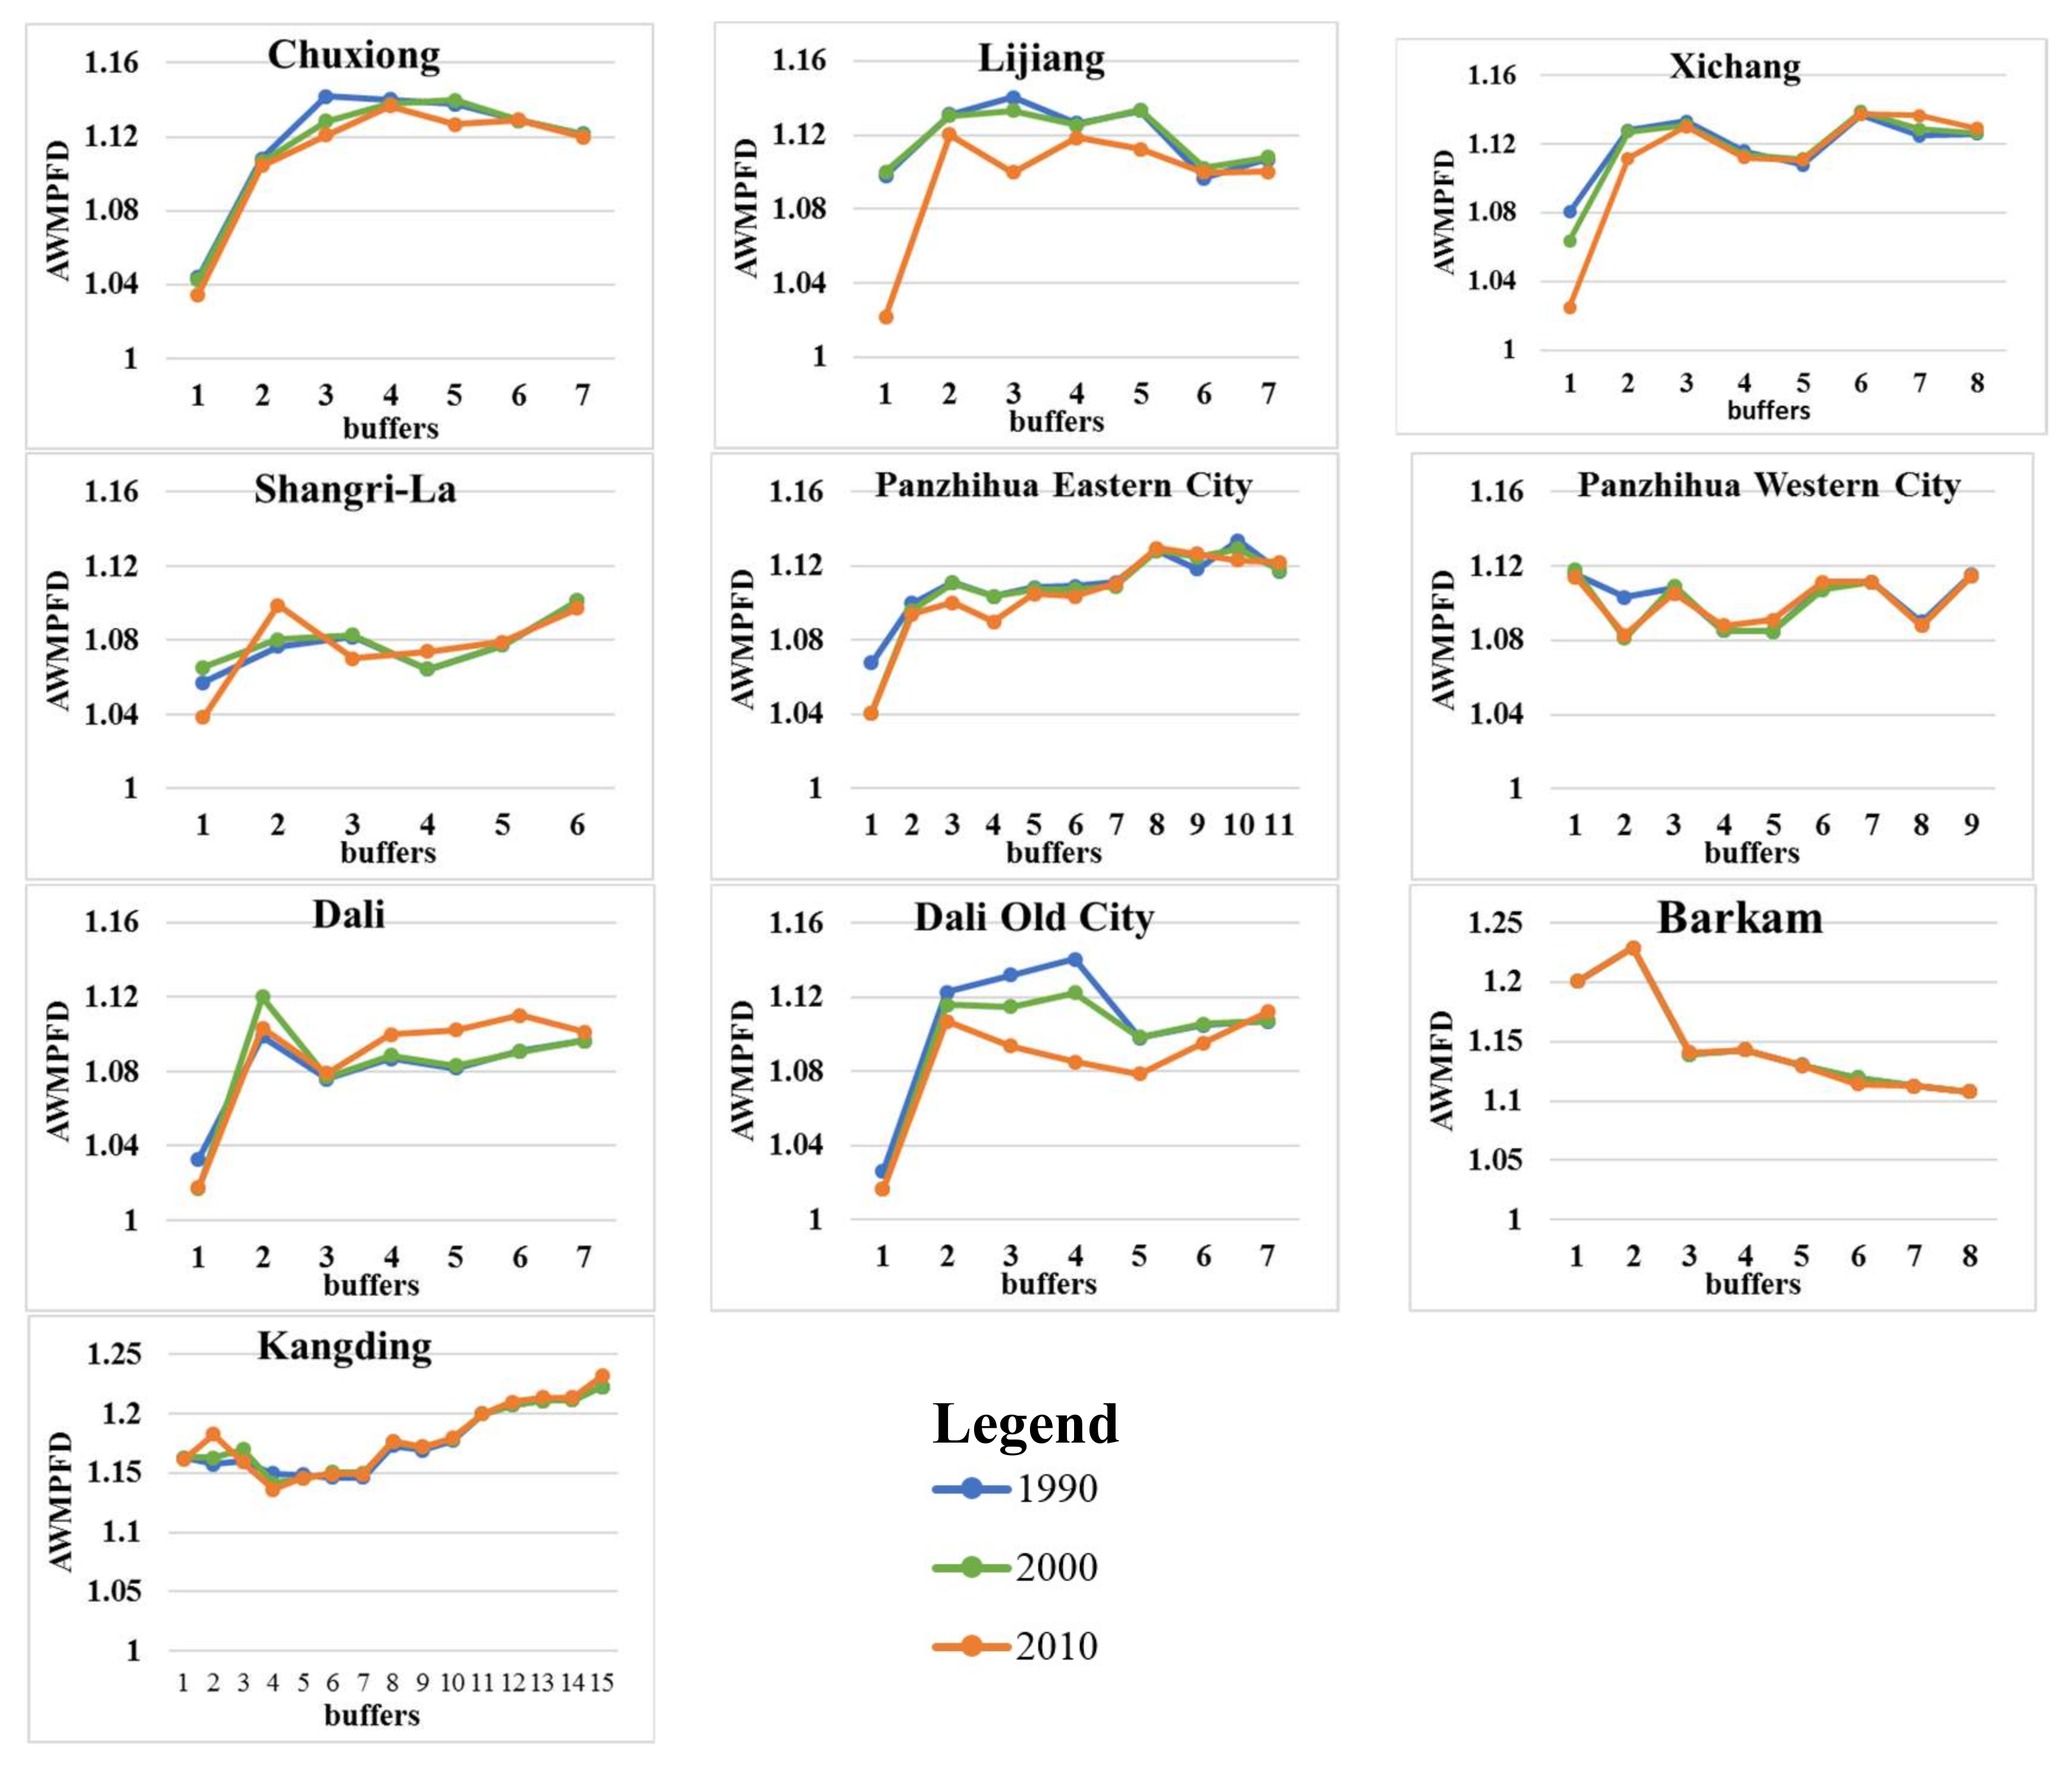
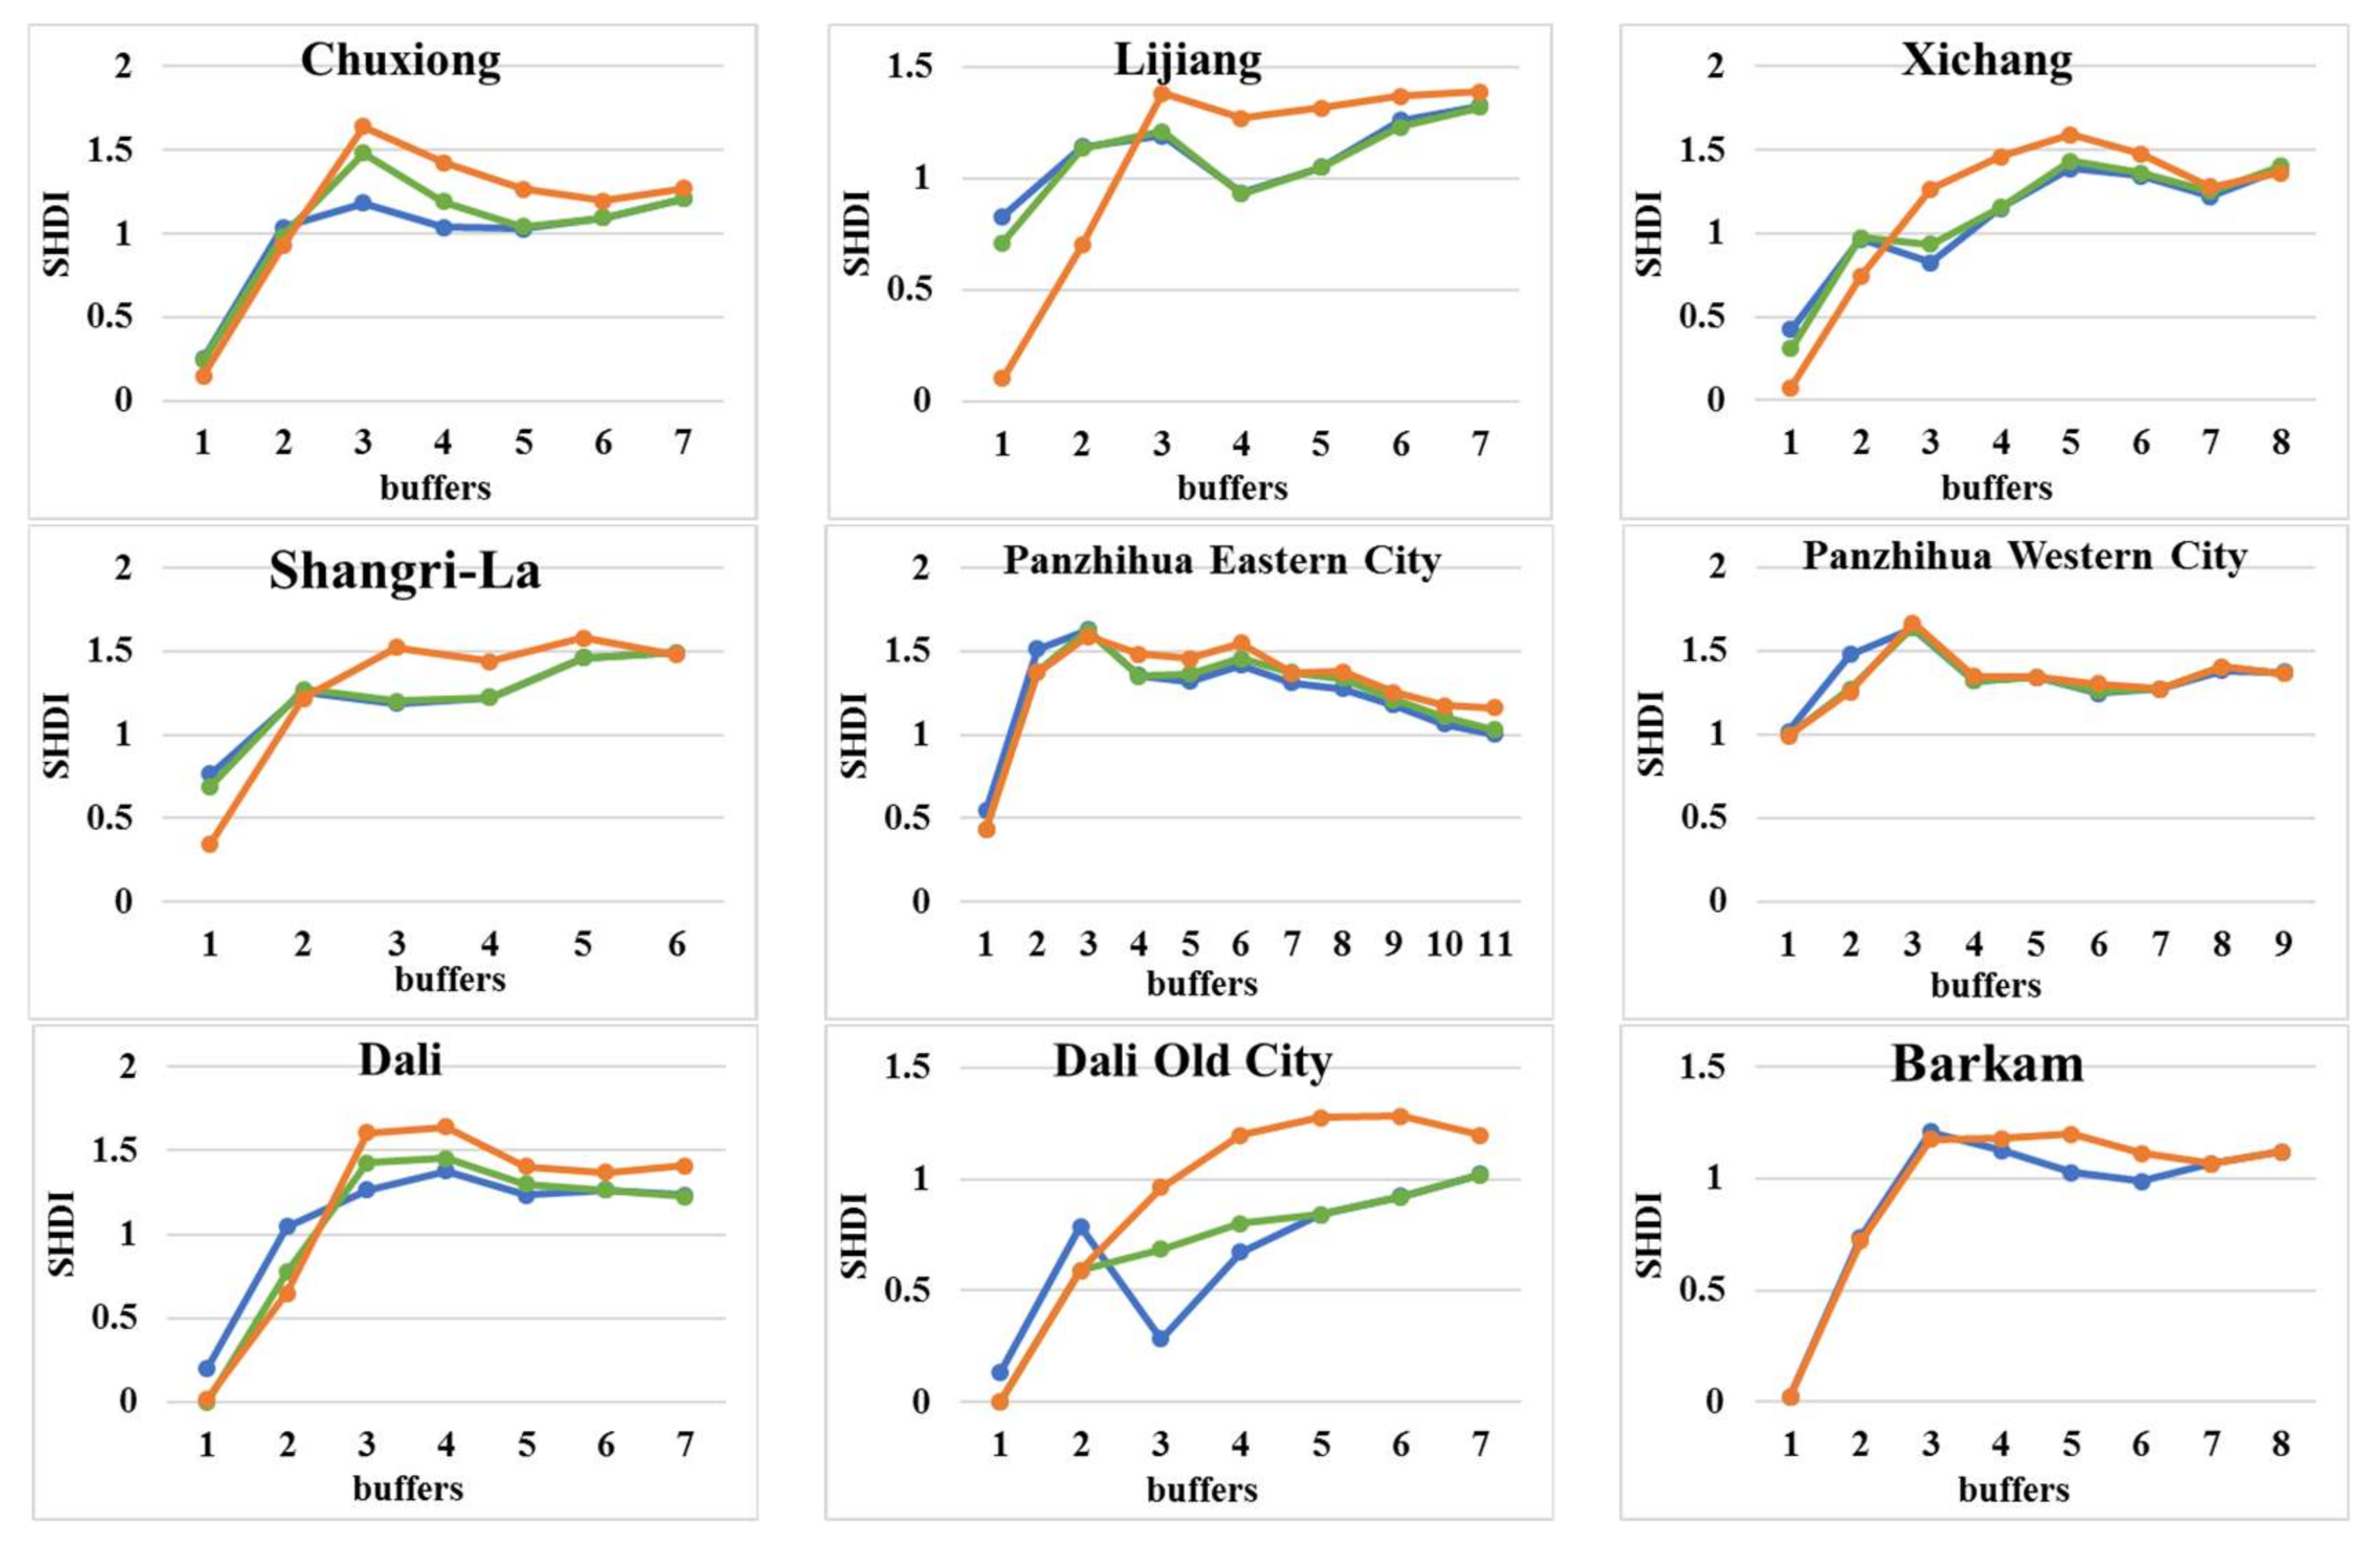
3.4. Temporal Changes of Landscape Patterns around Cities

Other land types were gradually replaced by urban land in each buffer around cities with urbanization over the past 20 years. To explore the characteristics of landscape changes, we charted the four landscape metrics of each buffer in 1990, 2000, and 2010 for the eight cities in the Hengduan Mountain region (Figure 7, Figure 8, Figure 9 and Figure 10).
For LPI, there was an inverse temporal change in the inner and outer buffers of most cities, excluding Barkam (Figure 7). During 1990–2010, continuous expansion of urban land increased LPI in the first to second buffers of Chuxiong, Lijiang, Xichang, Shangri-La, Panzhihua Western City, Dali, Dali Old City, and Kangding. Towards the third buffer, LPI in Chuxiong and Xichang initially decreased and then increased. Towards the outer buffers, many small urban land patches grew, and the whole landscape dominance degree decreased. Specifically, the declining trend occurred in the fifth buffer of Chuxiong, the third to fifth buffers of Lijiang, the fourth to eighth buffers of Xichang, the third buffer of Shangri-La, Dali, and Kangding, the fifth to sixth buffers of Panzhihua Eastern City, and the third to sixth buffers of Dali Old City.
The changes in the CONTAG metric were similar to those of LPI (Figure 8). In the buffers close to the city center, the CONTAG value increased, while it decreased in those further from the city center. The increased regions contained the first and second buffers of Chuxiong, Lijiang, Xichang, Shangri-La, Panzhihua Western City, Dali, Dali Old City, and Kangding, and the third buffer of Panzhihua Eastern City. Landscape connectivity was destroyed due to sparse outlying growth of urban land in regions close to rural areas, such as the third to fourth buffer of Chuxiong and Xichang, the fourth to fifth buffer of Lijiang, the fourth to sixth buffer of Panzhihua Eastern City, the third buffer of Dali and Dali Old City, and the third to fifth buffers of Kangding.
Changes AWMPFD were characterized by a decreasing trend in the buffers close to the city center due to increasing regularity of patch shapes (Figure 9). During 1990–2010, the value continuously decreased in the first to third buffers of Chuxiong and Lijiang, the first to second buffers of Xichang, the first to fourth buffers of Panzhihua Eastern City and Dali Old City, and the second buffer of Panzhihua Western City. In Shangri-La, the patch shape complexity of the first buffer increased in 1990–2000 and decreased in 2000–2010, while it continuously increased in the second buffer during 1990–2010. The value in Dali initially declined and then remained constant in the first buffer, while it increased and then decreased in the second buffer.
With the different expanding type of urban land, the trend of the SHDI value differed between buffers closer to and further from the city center (Figure 10). The value consistently decreased in the inner buffers, such as the first to second buffers of Chuxiong, Lijiang, Xichang, Panzhihua Eastern City, Dali, Dali Old City, and Kangding, the first buffer of Shangri-La, and the second buffer of Panzhihua Western City. Towards the rural areas, landscape diversity increased as the appearance of other land types enriches the whole landscape.

4. Discussion

4.1. Scale and Sprawl of Mountain Cities

The complex topography and division of the land by the canyon caused limited land availability, and the cities and population are, therefore, concentrated in extremely limited mountain basins or narrow valleys. Thus, cities or counties in mountain regions are often smaller and possess various morphologies in comparison with those in plain areas. In this study, Panzhihua Eastern City had the largest urban area, which was approximately 27.2 km2. Cities of the same administrative level, such as Zhongshan, Jiangmen, and Huizhou located in the Pearl River Delta Plain, have urban areas of 106 km2, 158 km2, and 237 km2, respectively, and Cangzhou and Qinhuangdao in the North China plain cover approximately 64 km2 and 97 km2, respectively [64], which are approximately 2 to 10 times the size of cities in the Hengduan Mountain region. Unlike plain cities, large gaps in the urban form and its expansion in different directions of mountain cities can be attributed to naturally restricting conditions, such as landforms or rivers. In the early development stage, without the restriction of landform, mountain cities follow plain city development patterns, characterized by almost even expansion in different directions resulting in a focal form. When urban land expansion is restricted by topography in certain directions, the city tends to follow the terrain to expand, leading to an uneven focal or liner form. For example, the urban land of Chuxiong exhibited a focal shape with a bulge in the northeast, and Kangding exhibited a notable north to south-stretching linear form. In addition to the limitations of terrain, mountain city development is also influenced by economic factors and local land policies. For example, instead of growing in an eastwards direction with a low ‘relief degree of land surface’ value, Dali Old City mainly extended to the southwest due to the ‘protecting cultivated land’ policy covering the eastern direction. Kangding city did not continue to grow to the north or south, but it extended to the east and west in the later development stage because it would have been unreasonable to build a long city due to difficulties in urban infrastructure layout and development.
In the Hengduan Mountain region, the urban land area of small mountain cities or counties has increased greatly with the development of the mountain economy during the past 20 years, particularly since the implementation of the ‘develop the west’ policy [65]. In the future, with increasing population and urbanization, contradictions between humans and the environment will become more prominent. To protect high quality cultivated land, and to create adequate construction land, some mountain cities have proposed the ‘propelling the urban land to gentle rolling hills’ strategy. However, mountain urbanization is both a socioeconomic and an ecological process. Mountain regions are not only the upper reaches of rivers, but they are also diversity hotspots requiring protection. These regions are also ecologically fragile areas for human activities and are characterized by land degradation, soil erosion, and natural disasters. Thus, this strategy is not universally applicable for all mountain cities, and intensive development on limited land is the principle that should always be followed during urbanization of mountain cities with scarce land resources. Urbanization of mountain areas should not only follow the general laws of urbanization, but also should consider the unique natural and socioeconomic characteristics of the area.

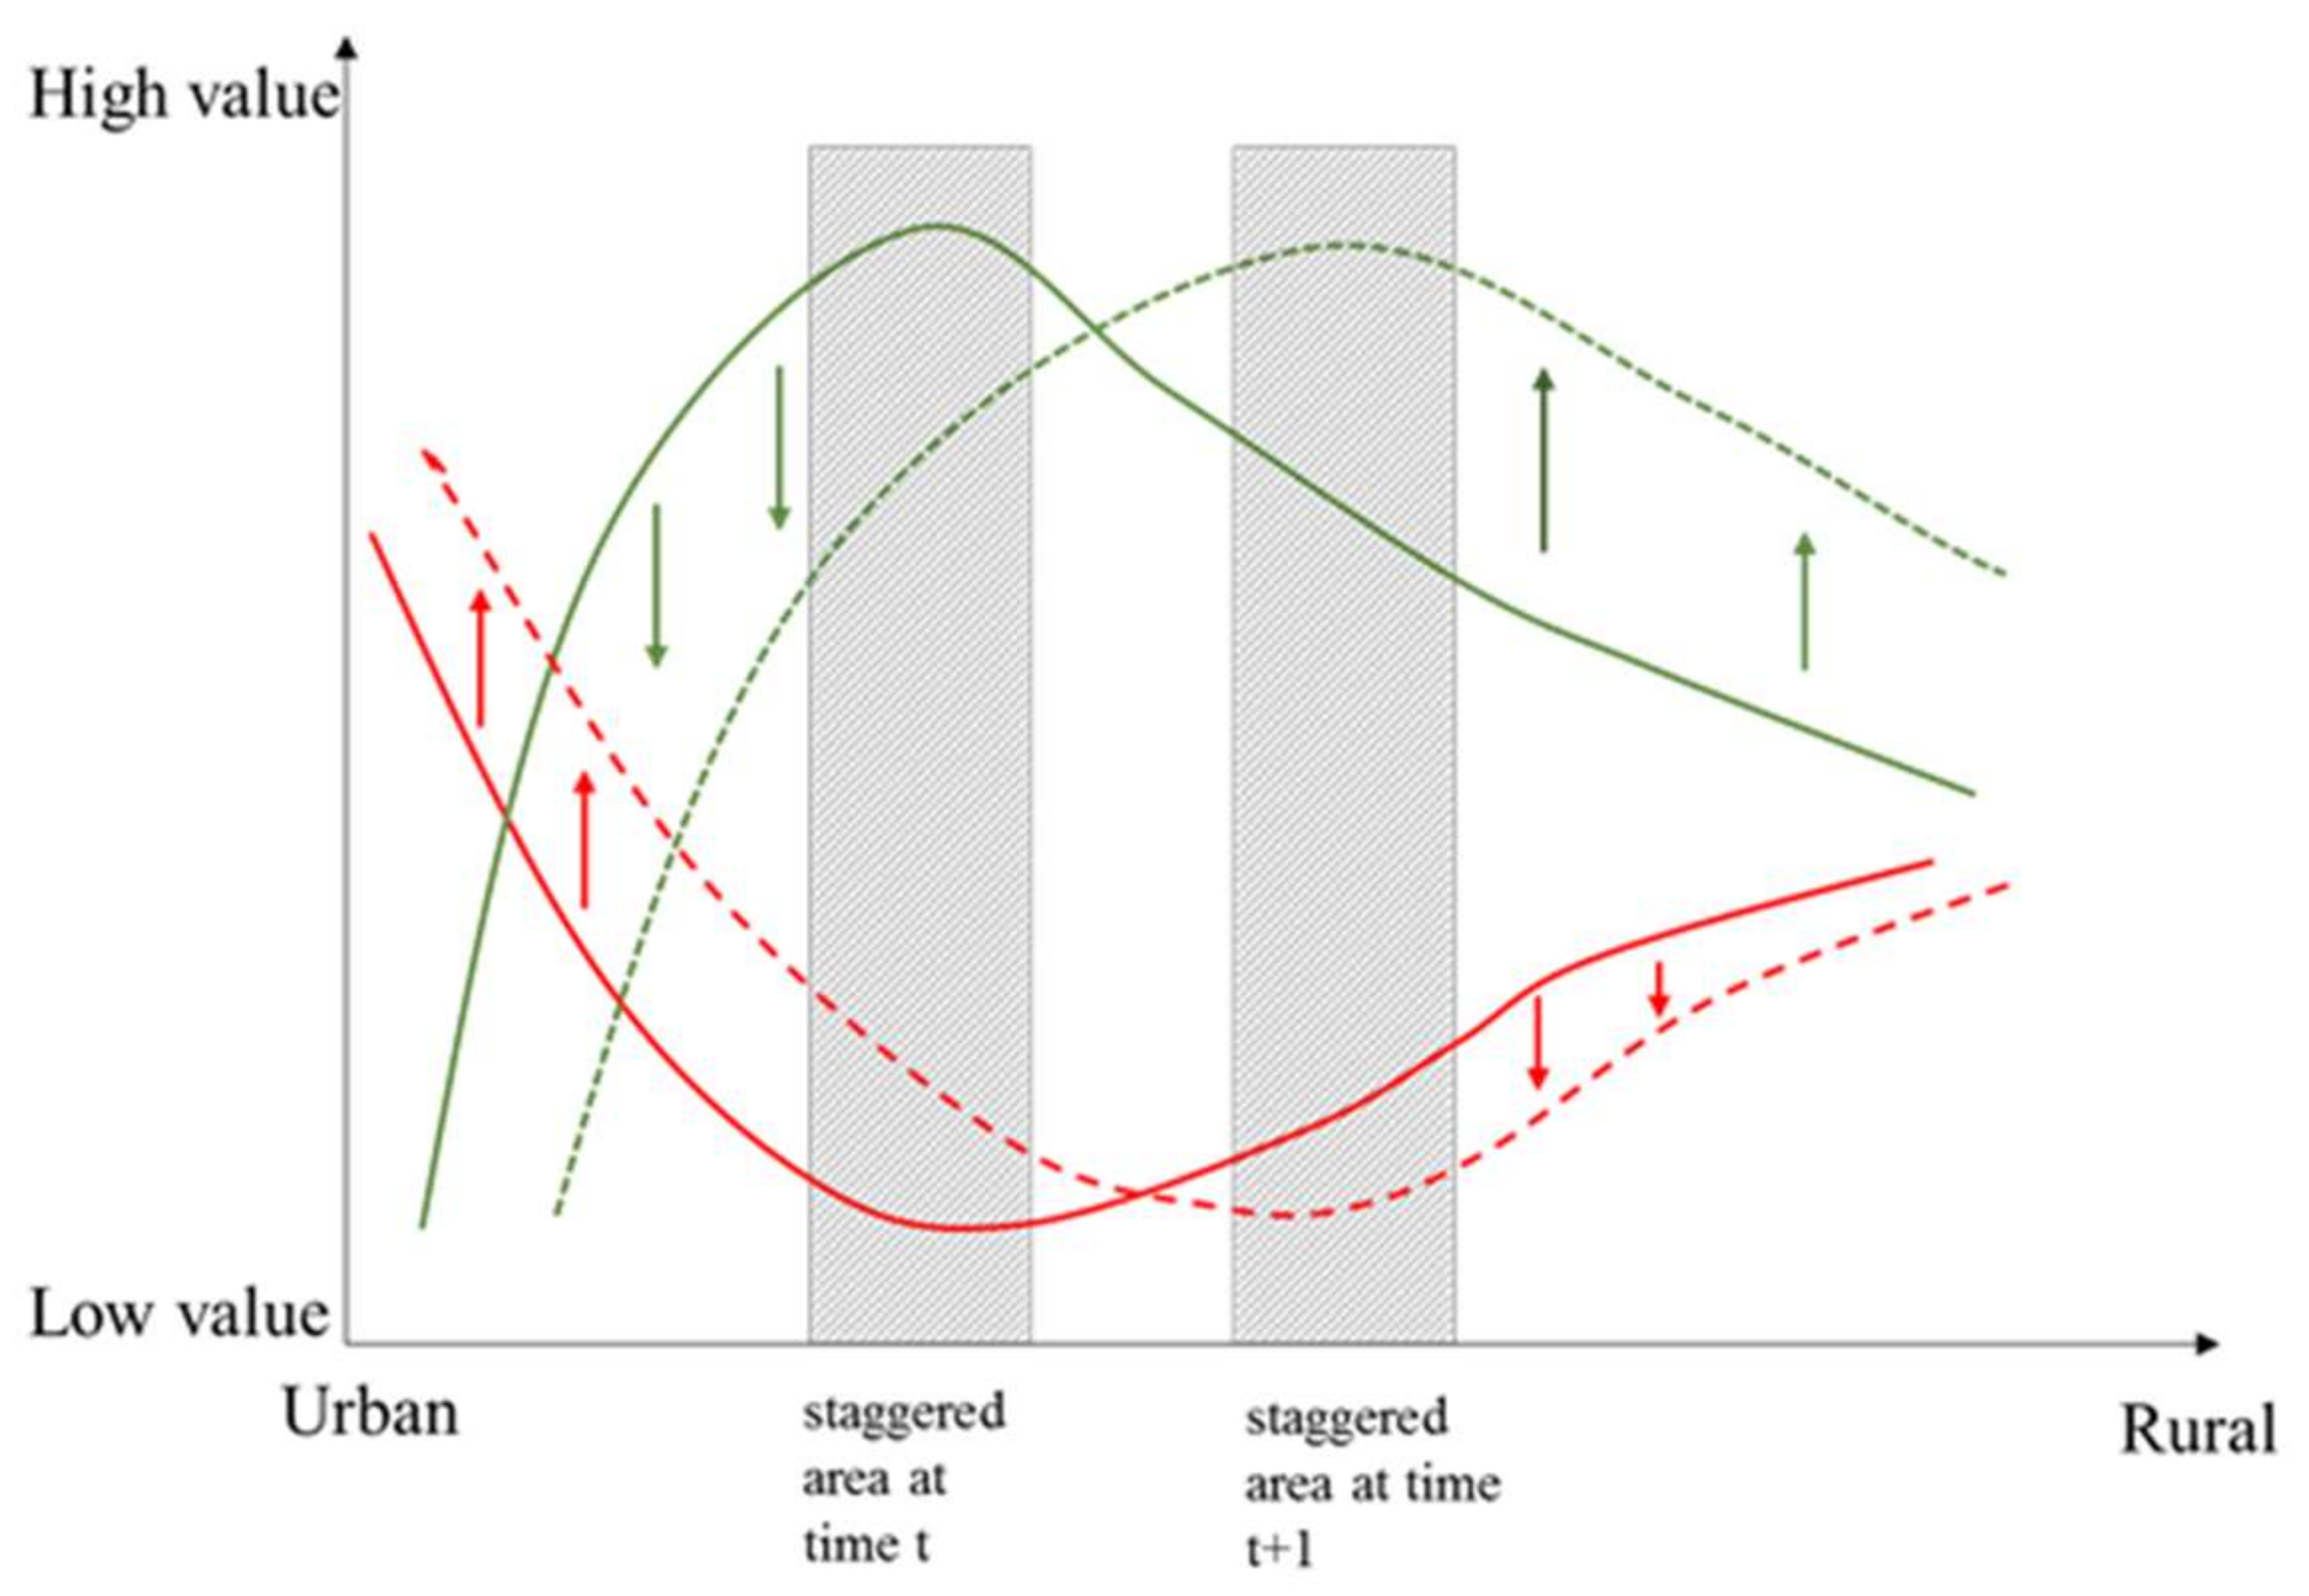
4.2. Landscape Changes along the ‘Urban-Rural’ Gradient

Landscape patterns were correlated with the spatial indices [66]. Several studies have shown that the landscape patterns around big cities in China’s Pearl River Delta Plain and Jing-Jin-Ji agglomeration exhibited a significantly circular shape [1,2]. In this study, the landscape around cities in the Hengduan Mountain region also exhibited a similar pattern, characterized by regular changes in landscape metrics along the ‘urban-rural’ gradient. Specifically, the landscape changes can be summarized as follows (Figure 11): (1) from the city center to the suburb, the LPI and CONTAG values decreased to the lowest value at a certain buffer and then began to increase, while the SHDI followed inverse trends, and the AWMPFD increased first and then presented wave-liked pattern; (2) The lowest LPI and CONTAG vales and the peak point of the AWMPFD and SHDI curves are spatially coincident in areas where the urban land and other land types were intertwined, such as the transition zone between urban and rural areas.
Yu et al. study [67] of the landscape pattern gradient in Panyu district of Guangzhou city showed that LPI decreases sharply in the region within 2–6 km from the city center and tends to be flat in the region within 8–14 km. Further, the CONTAG index decreases within 8 km and then increases. The SHDI index first increases and then decreases with higher values occurring within 4–8 km. These results are consistent with our findings, which confirm the credibility and correctness of our results. However, a similar study of Shanghai [40] shows the complexity of landscape diversity changes along the urban-rural gradient. It highlighted that the SHDI index shows multiple peaks and fluctuations. Further, the work by Li et al. [41] also proves this theory and the landscape index mainly shows a W- or M-shaped pattern. We believe that the above conclusions are reasonable, despite the inconsistent presentation of the landscape index. These differences mainly arise owing to different understandings among scholars, specifically the differences in the classification frame of land use. In our study as well as that of Yu et al. [67], land use was divided into cultivated land, forest, grassland, water body, urban land, etc., and urban land use was studied as one category. However, in the studies of Zhang et al. [40] and Li et al. [41], the urban land was subdivided into public facilities, residential, industrial, and transportation lands.
The distribution of urban land along the ‘urban-rural’ gradient is the main reason for landscape heterogeneity surrounding cities in the Hengduan Mountain region. The space around cities can be divided into four parts according to changes in four landscape metrics (Figure 12): (1) In the first region (inner buffers) nearest to the city center, the landscape contains a few different land types, and urban land is the dominant type and covering a large area. The shapes of patches are regular due to intensive human activities, and urban land has good connectivity with other land types. Thus, the landscape possesses higher LPI and CONTAG values, but lower AWMPFD and SHDI values (Figure 12a1); (2) In the second region, other land types began to appear in the landscape, while urban land is still dominant type, but with a decreased proportion compared to the former region. The shapes of patches become more irregular due to less intense human activities, and connectivity tends to decrease. Therefore, the LPI and CONTAG values decrease while the AWMPFD and SHDI metric values increase (Figure 12a2); (3) With increasing distance from the city center, the proportion of other land types continuously increase and urban land decreases. Up to the third region, the landscape contains diverse land types without one particularly dominant type. The shapes of the patches tend to be more complex than those in the second region, and the connectivity of the landscape decreases. Therefore, LPI and CONTAG were the lowest, while AWMPFD and SHDI were the highest. This region is typically characterized by a staggered distribution of urban and other land types (Figure 12a3); (4) Compared with the previous regions, in the outer buffers, other land types have replaced urban land to become the dominant type, and the proportion gradually increased. The disappearance of urban land decreases landscape diversity, while the connectivity increases. The LPI and CONTAG increased while SHDI decreased in comparison to the third region (Figure 12a4,a5).
Urbanization is a process in which urban land gradually replaces agricultural and natural land use [68,69], and the four areas on the urban-rural gradient that we summarized above (Figure 12) have verified this. Changes in the landscape pattern can affect the corresponding ecosystem services and human welfare [44]; this is also true for the landscape changes along the gradient. According to our general expectations, ecosystem services will increase as the distance from the city center increases. However, a study of the four major cities in Europe [70] dispels this inertial thinking of ours. The relationship between ecosystem services and landscape patterns around cities varies according to the ecosystem service types we select, land use classification, and data resolution. The scale issues and uncertainties between the two, on the urban-rural gradient, is an important aspect for exploring the impacts of landscape pattern changes.

4.3. Landscape Changes Responses to the Urban Sprawl

With different methods of urban land expansion, the landscape pattern (dominance, connectivity, patch shape complexity and landscape diversity) changes in each buffer, which can be summarized as a circular effect. In general, in the inner buffers closer to the city center (Figure 12b1–b3), continuous spatial expansion of urban land or urban land substitute other land types as the dominant type increase landscape dominance, and the shapes of patches tend to be regular. At the same time, landscape connectivity increased and diversity decreased. The four metrics can be expressed as an increase in LPI and CONTAG and a decrease in AWMPFD and SHDI over time. In the outer buffers (Figure 12b4,b5), urban land is typically not the dominant type. In these buffers, urban land development is characterized by small patches or point-based expansion, which would affect the original landscape structure and decrease landscape dominance and connectivity, while increasing landscape diversity. Therefore, LPI and CONTAG decreased while SHDI increased. The research results of Yu et al. [67] also showed the existence of a circular landscape pattern in terms of temporal changes. The results specifically showed that, during urbanization, the LPI and CONTAG indices exhibited an increase in the inner circle (within 8 km); and the SHDI index decreased in the inner circle (within 6 km) and increased in the outer circle (6–14 km). In addition, many studies have shown that the peak or vale value of each landscape index moves outward during urbanization [41,67].
To further understand temporal changes in landscape metrics along the gradient, we used the LPI metric for Chuxiong as an example. Specifically, in the first and second buffers along the ‘urban-rural’ gradient, dramatic edge-expansion growth of urban land cause it to dominate the landscape, further increasing landscape dominance and therefore the LPI metric (Figure 12a2,a3,b2,b3). Towards the third buffer, cultivated land was dominant in 1990 (Figure 12a5). From 1990 to 2000, although expansion of urban land changed the dominant type from cultivated to urban land, but with a low dominance, so LPI declined dramatically in this region (Figure 12a2). During the period of 2000 to 2010, urban land continued to expand as the dominant type in the landscape, increasing landscape dominance and subsequently LPI (Figure 12a1). Towards the fifth buffer, the dominant type is always cultivated land. During the second development stage (2000–2010), small patches or point expansion of urban land changed the landscape pattern, but not the dominant land type in this area. As a result, dominance was weakened and the LPI metric decreased (Figure 12a5,b5).
The diffusion-coalescence urban development hypothesis is a widely accepted theory. Our results about the changes in the landscape patterns around cities confirm this hypothesis. Dietzel et al. [71] highlighted that urban development begins with a small core. The early stage of urban development can be seen as an urban growth model in the city peripheral during the same period, such as a4–b4 and a5–b5 stages in Figure 12. With time, these small urban cores reach a joint stage through continuous outward development [71], and small patches are merged into big patches. This is similar to the growth model in the inner circle of the city (a2–b2 and a3–b3 stages). Both the temporal and spatial changes of landscape around cities reflect this diffusion-coalescence process. The relationship between urban land and other land types during urbanization can be considered as the landscape changing process from rural area to city center. At the same time, Li et al. [41] also believed that coalitions and diffusion occurred in the more and less developed regions, respectively, which is consistent with our findings.

4.4. Limitations and Caveats

In this study, the land-use data we use is interpreted based on the 30 m resolution images. A higher-resolution land-use data will be better to reflect the real conditions in the complex terrain areas; however, the 30 m resolution is sufficient for our study. As mentioned above, in this study, we consider urban land as a whole and not as subdivided residential or industrial land. In our future work, we will subdivide the urban land use and conduct the relative research. Our work will be more in line with those of Zhang et al. [40] and Li et al. [41] and will further reveal the similarities and differences in the development of mountainous and plain cities.
In addition, different gradient setting methods, including buffer shapes and spacing, will affect the results of the landscape index [67]. In this study, we have tried to construct the urban-rural gradient of mountainous cities according to certain criteria. The results show that the gradient reflects the temporal and spatial changes of the landscape around the cities to some extent. In our future research work, we expect to be able to construct a more reasonable gradient. A more accurate landscape pattern is our unremitting pursuit.
Finally, it is worth noting that the development of cities is affected by many factors, such as location, traffic, and socio-economic conditions. In this study, we only considered the relationship between the city development direction and terrain, which is biased. For a mountainous city, traffic plays an important role in the development of urban economy and culture. In addition, the development of cities must inevitably consider measures to avoid geological disasters, such as earthquakes, landslides, and mudslides. For instance, Hengduan Mountain is a region that suffered from serious geological disasters. In the future, climate changes will inevitably affect its frequency and scale to some extent. Considering the above factors comprehensively will be a great challenge to our study of urban development. The results of a change in landscape may be more complex, and the post-change structure will be more unbalanced. Under the influence of traffic and geological disasters, the landscape-staggered areas may move forward along the traffic and away from geological disaster sources.

5. Conclusions

Urban land expansion plays a significant role in affecting the supply capacity of different ecosystem services by altering landscape constitution and structure. With proceeding urbanization, the effects will become more far-reaching. To explore landscape patterns and their changes associated with urbanization around cities in mountain regions, we selected eight typical cities in the Hengduan Mountain region as the study areas. We established a suitable ‘urban-rural’ gradient for each city based on typical mountain city features, then combined it with landscape metrics to analyze the spatial-temporal characteristics of landscape patterns along the gradient and the reasons for this.
Our results showed that this is a suitable method of reflecting the urban sprawl process and its impacts on landscape pattern by combining landscape metrics and the ‘urban-rural’ gradient at a landscape level. Under topographic restrictions, urban land expansion in mountain cities share common features with plain cities, but also possess has unique characteristics. Specifically, the landscape pattern surrounding mountain cities can be summarized into two points, as follows: similar to plain cities, the landscape around mountain cities exhibits a circular structure. Spatially, with increasing distance from the city center, the degree of dominance and connectivity of the landscape decrease initially and then increase, while the diversity initially increased and then decreased, and the patches complexity increased first and then fluctuated. The change points of the four curves were spatially coincident in the transition areas between urban and other land types. In terms of temporal changes, different trends were observed in the inner and outer buffers along the ‘urban-rural’ gradient. In buffers closer to the city center, large-scale urban land edge-expansion growth lead to increased landscape dominance and connectivity, and the patches shape and diversity decreased. In the buffers further from the city center, urban land sprawl was characterized by small patches or point-based growth, which alters the original landscape pattern, therefore decreasing landscape dominance and connectivity but increasing diversity. With outward urban land sprawl, transition areas are also moved outwards. However, as it is restricted by complex terrain conditions, urban land sprawl in mountain cities is uneven different directions, either by expansion area or rate. Thus, the landscape around mountain cities exhibits an unbalanced, circular structure in different directions. In this study, we only considered the influence of topography on city morphology and expansion direction. However, urban sprawl is influenced by several other factors, such as culture, transportation, access to resources, or avoidance of natural disasters, thus, development is more complex. In future studies, factors other than topography should be considered, and the results would be more profound or even inverse with the results presented here.

Acknowledgments

This work was supported by National Key Basic Research Program of China (973Program) (2015CB452702), National Natural Science Foundation of China (41571098, 41530749), Key Programs of the Chinese Academy of Sciences (ZDRW-ZS-2016-6-4) and A Major Consulting Project of Strategic Development Institute, Chinese Academy of Sciences (Y02015003). We gratefully acknowledge the anonymous reviewers for spending their valuable time and providing constructive comments on this manuscript.

Author Contributions

Erfu Dai and Yahui Wang had the original idea for this study. Erfu Dai provided the necessary data, Yahui Wang was responsible for calculation, analysis and writing the manuscript. Erfu Dai and Zhuo Wu revised the manuscript. Liang Ma and Le Yin helped to process the relative data.

Conflicts of Interest

The authors declare no conflict of interest.

References

  1. Seto, K.C.; Fragkias, M. Quantifying spatiotemporal patterns of urban land-use change in four cities of China with time series landscape metrics. Landsc. Ecol. 2005, 20, 871–888. [Google Scholar] [CrossRef]
  2. Wu, W.; Zhao, S.; Zhu, C.; Jiang, J. A comparative study of urban expansion in Beijing, Tianjin and Shijiazhuang over the past three decades. Landsc. Urban Plan. 2015, 134, 93–106. [Google Scholar] [CrossRef]
  3. Anwar, B.; Xiao, Z.; Akter, S.; Rehman, R. Sustainable Urbanization and Development Goals Strategy through Public–Private Partnerships in a South-Asian Metropolis. Sustainability 2017, 9, 1940. [Google Scholar] [CrossRef]
  4. United Nations, Department of Economic and Social Affairs, Popolation Division. World Urbanization Prospects: The 2014 Revision, Highlights (ST/ESA/SER.A/352). 2014. Available online: http://www.urbangateway.org/system/files/documents/urbangateway/wup2014-highlights.pdf (accessed on 17 July 2017 ).
  5. National Bureau of Statistics of China. China Population and Employment Statistics Yearbook 2011; China Statistics Press: Beijing, China, 2012.
  6. Salman, S.M.A. Inter-states water disputes in India: An analysis of the settlement process. Water Policy 2002, 4, 223–237. [Google Scholar] [CrossRef]
  7. Al-Kharabsheh, A.; Ta’Any, R. Influence of urbanization on water quality deterioration during drought periods at South Jordan. J. Arid Environ. 2003, 53, 619–630. [Google Scholar] [CrossRef]
  8. Kim, D.S.; Mizuno, K.; Kobayashi, S. Analysis of urbanization characteristics causing farmland loss in a rapid growth area using GIS and RS. Paddy Water Environ. 2003, 1, 189–199. [Google Scholar] [CrossRef]
  9. Burak, S.; Dogˇan, E.; Gaziogˇlu, C. Impact of urbanization and tourism on coastal environment. Ocean Coast. Manag. 2004, 47, 515–527. [Google Scholar] [CrossRef]
  10. Güneralp, B.; Seto, K.C. Environmental impacts of urban growth from an integrated dynamic perspective: A case study of Shenzhen, South China. Global Environ. Change 2008, 18, 720–735. [Google Scholar] [CrossRef]
  11. Eigenbrod, F.; Bell, V.A.; Davies, H.N.; Heinemeyer, A.; Armsworth, P.R.; Gaston, K.J. The impact of projected increases in urbanization on ecosystem services. Proc. R. Soc. Lond. B Boil. Sci. 2011, 278, 3201–3208. [Google Scholar] [CrossRef] [PubMed]
  12. Seto, K.C.; Güneralp, B.; Hutyra, L.R. Global forecasts of urban expansion to 2030 and direct impacts on biodiversity and carbon pools. Proc. Natl. Acad. Sci. USA 2012, 109, 16083–16088. [Google Scholar] [CrossRef] [PubMed]
  13. Han, L.; Zhou, W.; Li, W. Increasing impact of urban fine particles (PM2.5) on areas surrounding Chinese cities. Sci. Rep. 2015, 5. [Google Scholar] [CrossRef] [PubMed]
  14. Huang, J.; Zhang, W.; Mo, J.M.; Wang, S.Z.; Liu, J.X.; Chen, H. Urbanization in China drives soil acidification of Pinus massoniana forests. Sci. Rep. 2015, 5. [Google Scholar] [CrossRef] [PubMed]
  15. Peng, J.; Shen, H.; Wu, W.H.; Liu, Y.X.; Wang, Y.L. Net primary productivity (NPP) dynamics and associated urbanization driving forces in metropolitan areas: A case study in Beijing City, China. Landsc. Ecol. 2016, 31, 1077–1092. [Google Scholar] [CrossRef]
  16. Tang, Z.; Sun, G.; Zhang, N.; He, J.; Wu, N. Impacts of Land-Use and Climate Change on Ecosystem Service in Eastern Tibetan Plateau, China. Sustainability 2018, 10, 467. [Google Scholar] [CrossRef]
  17. Mcdonald, R.I.; Kareiva, P.; Forman, R.T.T. The implications of current and future urbanization for global protected areas and biodiversity conservation. Biol. Conserv. 2008, 141, 1695–1703. [Google Scholar] [CrossRef]
  18. Mckinney, M.L. Effects of urbanization on species richness: A review of plants and animals. Urban Ecosyst. 2008, 11, 161–176. [Google Scholar] [CrossRef]
  19. McKinney, M.L. Urbanization as a major cause of biotic homogenization. Biol. Conserv. 2006, 127, 247–260. [Google Scholar] [CrossRef]
  20. Wratten, S.; Sandhu, H.; Cullen, R.; Costanza, R. Ecosystem Services in Agricultural and Urban Landscapes; Wiley: Hoboken, NJ, USA, 2013. [Google Scholar]
  21. Imhoff, M.L.; Bounoua, L.; Ricketts, T.; Loucks, C.; Harriss, R.; Lawrence, W.T. Global patterns in human consumption of net primary production. Nature 2004, 429, 870–873. [Google Scholar] [CrossRef] [PubMed]
  22. Grimm, N.B.; Faeth, S.H.; Golubiewski, N.E.; Redman, C.L.; Wu, J.; Bai, X.; Briggs, J.M. Global Change and the Ecology of Cities. Science 2008, 319, 756–760. [Google Scholar] [CrossRef] [PubMed]
  23. Cadavid Restrepo, A.M.; Yang, Y.R.; Hamm, N.A.S.; Gray, D.J.; Barnes, T.S.; Williams, G.M.; Soares Magalhães, R.J.; McManus, D.P.; Guo, D.; Clements, A.C.A. Land cover change during a period of extensive landscape restoration in Ningxia Hui Autonomous Region, China. Sci. Total Environ. 2017, 598, 669–679. [Google Scholar] [CrossRef] [PubMed]
  24. Kleemann, J.; Inkoom, J.N.; Thiel, M.; Shankar, S.; Lautenbach, S.; Fürst, C. Peri-urban land use pattern and its relation to land use planning in Ghana, West Africa. Landsc. Urban Plan. 2017, 165, 280–294. [Google Scholar] [CrossRef]
  25. Li, Y.; Sulla-Menashe, D.; Motesharrei, S.; Song, X.P.; Kalnay, E.; Ying, Q.; Li, S.C.; Ma, Z. Inconsistent estimates of forest cover change in China between 2000 and 2013 from multiple datasets: Differences in parameters, spatial resolution, and definitions. Sci. Rep. 2017, 7. [Google Scholar] [CrossRef] [PubMed]
  26. Rodríguez-González, P.M.; Albuquerque, A.; Martínez-Almarza, M.; Díaz-Delgado, R. Long-term monitoring for conservation management: Lessons from a case study integrating remote sensing and field approaches in floodplain forests. J. Environ. Manag. 2017, 202, 392–402. [Google Scholar] [CrossRef] [PubMed]
  27. Scharsich, V.; Mtata, K.; Hauhs, M.; Lange, H.; Bogner, C. Analysing land cover and land use change in the Matobo National Park and surroundings in Zimbabwe. Remote Sens. Environ. 2017, 194, 278–286. [Google Scholar] [CrossRef]
  28. Luck, M.; Wu, J. A gradient analysis of urban landscape pattern: A case study from the Phoenix metropolitan region, Arizona, USA. Landsc. Ecol. 2002, 17, 327–339. [Google Scholar] [CrossRef]
  29. Berling-Wolff, S.; Wu, J. Modeling urban landscape dynamics: A review. Ecol. Res. 2004, 19, 119–129. [Google Scholar] [CrossRef]
  30. Ahern, J. Urban landscape sustainability and resilience: The promise and challenges of integrating ecology with urban planning and design. Landsc. Ecol. 2013, 28, 1203–1212. [Google Scholar] [CrossRef]
  31. Lausch, A.; Herzog, F. Applicability of landscape metrics for the monitoring of landscape change: Issues of scale, resolution and interpretability. Ecol. Indic. 2002, 2, 3–15. [Google Scholar] [CrossRef]
  32. Uuemaa, E.; Mander, Ü.; Marja, R. Trends in the use of landscape spatial metrics as landscape indicators: A review. Ecol. Indic. 2013, 28, 100–106. [Google Scholar] [CrossRef]
  33. Mõisja, K.; Uuemaa, E.; Oja, T. Integrating small-scale landscape elements into land use/cover: The impact on landscape metrics’ values. Ecol. Indic. 2016, 67, 714–722. [Google Scholar] [CrossRef]
  34. Fang, S.; Zhao, Y.; Han, L.; Ma, C. Analysis of Landscape Patterns of Arid Valleys in China, Based on Grain Size Effect. Sustainability 2017, 9, 2263. [Google Scholar] [CrossRef]
  35. Mcdonnell, M.J.; Pickett, S.T.A. Ecosystem Structure and Function along Urban-Rural Gradients: An Unexploited Opportunity for Ecology. Ecology 1990, 71, 1232–1237. [Google Scholar] [CrossRef]
  36. López, E.; Bocco, G.; Mendoza, M.; Duhau, E. Predicting land-cover and land-use change in the urban fringe: A case in Morelia city, Mexico. Landsc. Urban Plan. 2001, 55, 271–285. [Google Scholar] [CrossRef]
  37. McDonnell, M.J.; Hahs, A.K. The use of gradient analysis studies in advancing our understanding of the ecology of urbanizing landscapes: Current status and future directions. Landsc. Ecol. 2008, 23, 1143–1155. [Google Scholar] [CrossRef]
  38. Haase, D.; Nuissl, H. The urban-to-rural gradient of land use change and impervious cover: A long-term trajectory for the city of Leipzig. J. Land Use Sci. 2010, 5, 123–141. [Google Scholar] [CrossRef]
  39. Qureshi, S.; Haase, D.; Coles, R. The Theorized Urban Gradient (TUG) method—A conceptual framework for socio-ecological sampling in complex urban agglomerations. Ecol. Indic. 2014, 36, 100–110. [Google Scholar] [CrossRef]
  40. Zhang, Z.; Tu, Y.; Li, X. Quantifying the Spatiotemporal Patterns of Urbanization along Urban-Rural Gradient with a Roadscape Transect Approach: A Case Study in Shanghai, China. Sustainability 2016, 8, 862. [Google Scholar] [CrossRef]
  41. Li, J.; Li, C.; Zhu, F.; Song, C.; Wu, J. Spatiotemporal pattern of urbanization in Shanghai, China between 1989 and 2005. Landsc. Ecol. 2013, 28, 1545–1565. [Google Scholar] [CrossRef]
  42. Fan, F.; Fan, W. Understanding spatial-temporal urban expansion pattern (1990–2009) using impervious surface data and landscape indexes: A case study in Guangzhou (China). J. Appl. Remote Sens. 2014, 8, 083609. [Google Scholar] [CrossRef]
  43. Peng, L.; Chen, T.; Liu, S. Spatiotemporal Dynamics and Drivers of Farmland Changes in Panxi Mountainous Region, China. Sustainability 2016, 8, 1209. [Google Scholar] [CrossRef]
  44. Millennium Ecosystem Assessment (MEA). Ecosystems and Human Well-Being: Synthesis; Island Press: Washington, DC, USA, 2005. [Google Scholar]
  45. The Economics of Ecosystems and Biodiversity (TEEB). The Economics of Ecosystems and Biodiversity: Ecological and Economic Foundations; Earthscan: London, UK, 2010. [Google Scholar]
  46. Grêt-Regamey, A.; Brunner, S.H.; Kienast, F. Mountain Ecosystem Services: Who Cares? Mt. Res. Dev. 2012, 32, S23–S34. [Google Scholar] [CrossRef]
  47. Zhong, H.X. Study of protection and construction of mountain ecological security barrier in China. J. Mt. Sci. 2008, 26, 2–11. (In Chinese) [Google Scholar]
  48. Zhang, B.; Mo, S.; Tan, Y.; Xiao, F.; Wu, H. Urbanization and de-urbanization in mountain regions of China. Mt. Res. Dev. 2004, 24, 206–209. [Google Scholar]
  49. Deng, W.; Tang, W. General directions and countermeasures for urbanization development in mountain areas of China. J. Mt. Sci. 2013, 31, 168–173. [Google Scholar]
  50. Deng, W.; Xiong, Y.; Zhao, J.; Qiu, D.; Zhang, Z.; Wen, A. Enlightenment from internationa mountain research projects. J. Mt. Sci. 2013, 31, 377–384. [Google Scholar]
  51. Deng, W.; Fang, Y.; Tang, W. The strategic effect and genera directions of urbanization in mountain areas of China. Bull. Chin. Acad. Sci. 2013, 28, 66–73. (In Chinese) [Google Scholar]
  52. Deng, W. Discussion on mountain area resource and environment carrying capacity. Geogr. Res. 2010, 29, 959–969. (In Chinese) [Google Scholar]
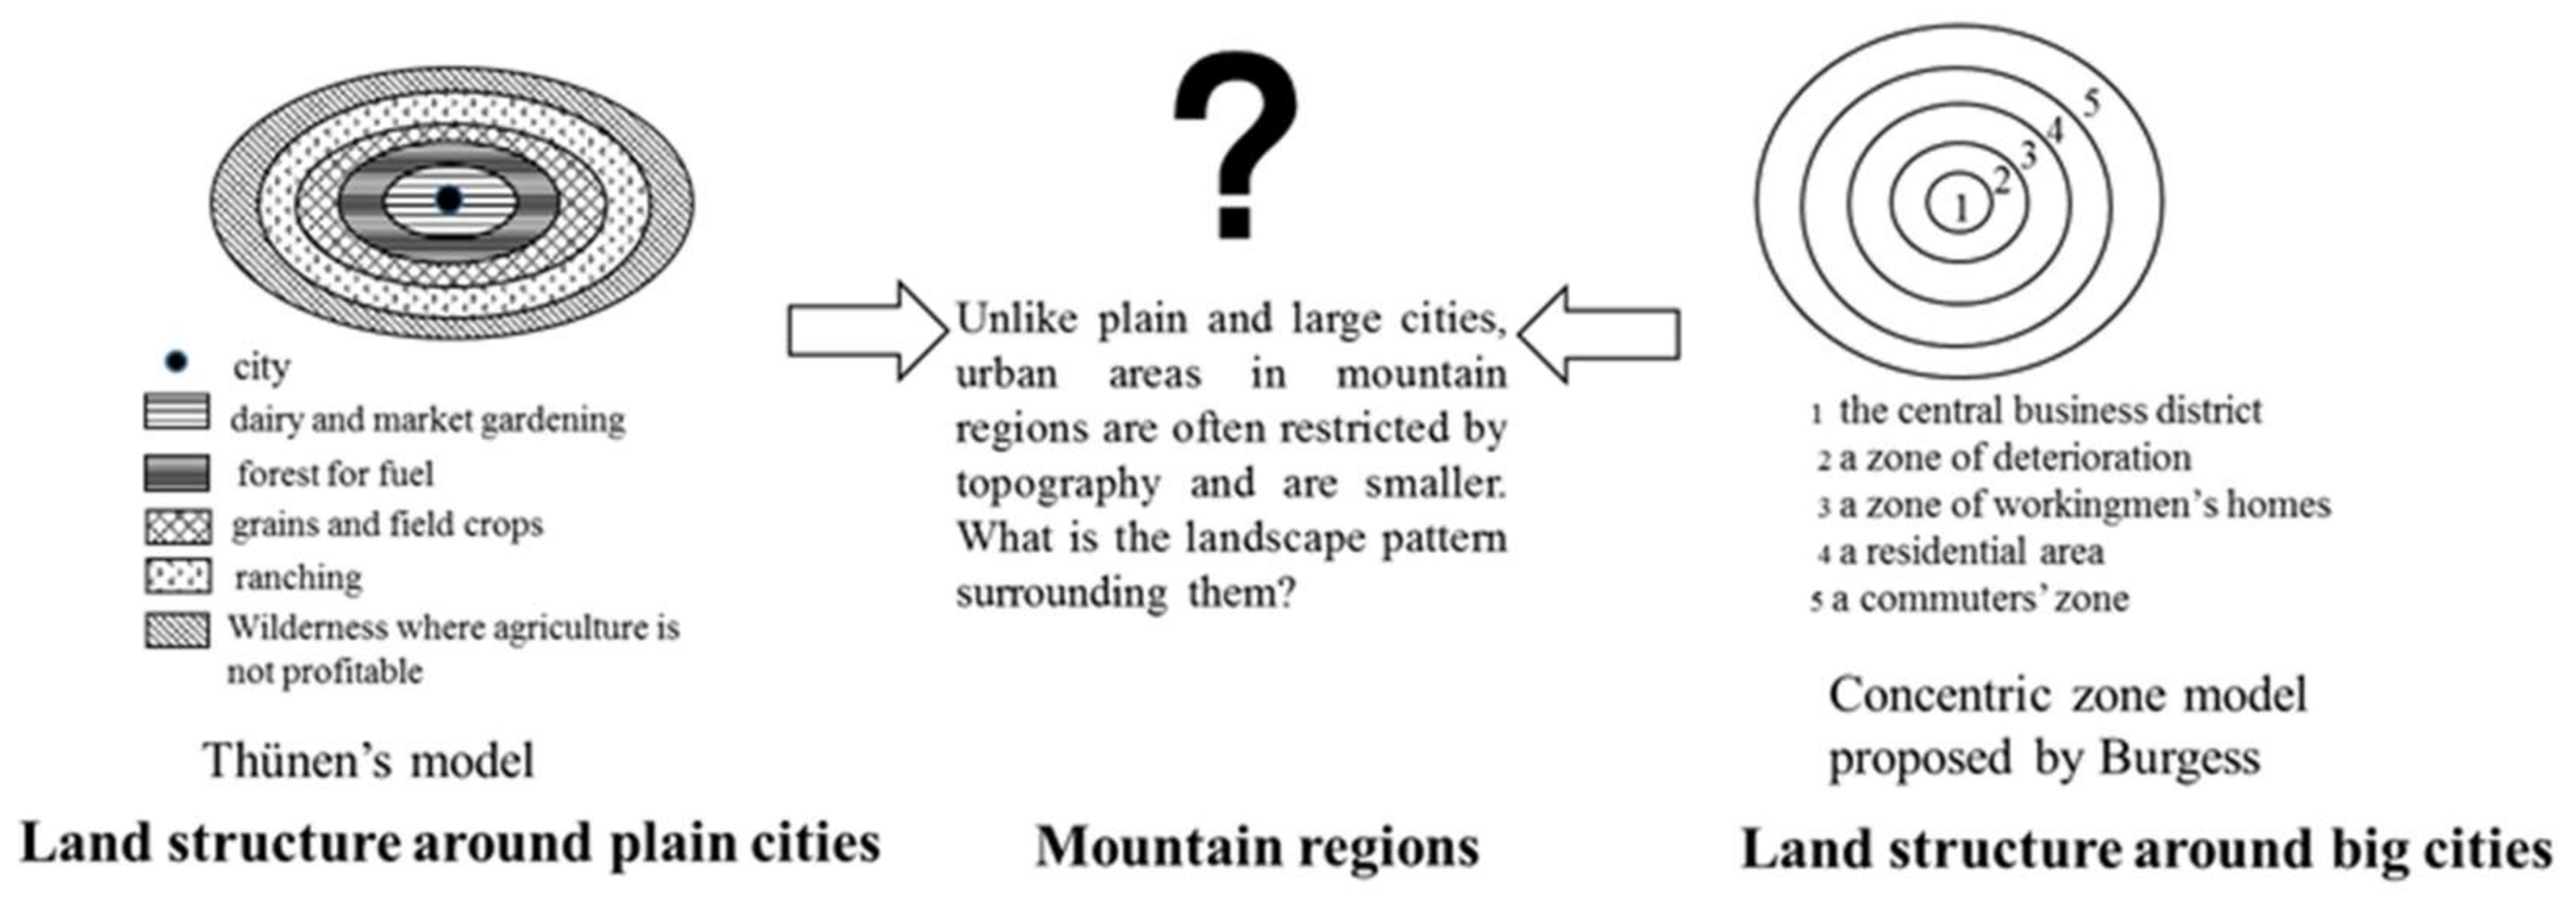
  53. Thünen, J.H.V. Der Isolierte Staat in Beziehung auf Landwirtshaft und Nationalökonomie; Fr. Derthes: Hamburg/Rostock, Germany, 1825. [Google Scholar]
  54. Burgess, E.W. The growth of the city: An introduction to a research project. In The City; Park, R.E., Burgess, E.W., McKenzie, R., Eds.; University of Chicago Press: Chicago, IL, USA, 1925. [Google Scholar]
  55. Balakrishnan, T.R.; Jarvis, G.K. Is the Burgess concentric zonal theory of spatial differentiation still applicable to urban Canada? Can. Rev. Sociol. 1991, 28, 526–539. [Google Scholar] [CrossRef]
  56. Meyer, W.B. The other Burgess model. Urban Geogr. 2000, 21, 261–270. [Google Scholar] [CrossRef]
  57. Pan, T.; Wu, S.; He, D.; Dai, E.; Liu, Y. Ecological effects of Longitudinal Range-Gorge land surface pattern and its regional differentiation. Acta Geogr. Sin. 2012, 67, 13–26. (In Chinese) [Google Scholar]
  58. The Comprehensive Scientific Expedition to the Qinghai-Xizang Plateau, CAS. Physical Geography of Hengduan Mountains; Science Press: Beijing, China, 1997. [Google Scholar]
  59. Liu, J.; Zhang, Z.; Xu, X.; Kuang, W.; Zhuo, W.; Zhang, S.; Li, R.; Yan, C.; Yu, D.; Wu, S.; et al. Spatial patterns and driving forces of land use change in China during the early 21st century. J. Geogr. Sci. 2010, 20, 483–494. [Google Scholar] [CrossRef]
  60. Turner, M.G. Spatial and temporal analysis of landscape patterns. Landsc. Ecol. 1990, 4, 21–30. [Google Scholar] [CrossRef]
  61. Baker, W.L.; Cai, Y. The r.le programs for multiscale analysis of landscape structure using the GRASS geographical information system. Landsc. Ecol. 1992, 7, 291–302. [Google Scholar] [CrossRef]
  62. Wu, J. Landscape Ecology: Pattern, Process, Scale and Hierarchy; Higher Education Press: Beijing, China, 2000. (In Chinese) [Google Scholar]
  63. Feng, Z.; Tang, Y.; Yang, Y.; Zhang, D. Relief degree of land surface and its influence on population distribution in China. J. Geogr. Sci. 2008, 18, 237–246. [Google Scholar] [CrossRef]
  64. National Bureau of Statistics of China. China Statistical Yearbook; China Statistics Press: Beijing, China, 2012.
  65. Hu, H.; Wei, H.; Yan, S. Research on the Optimization of Spatial Structure of Urbanization in Western China. Res. Dev. 2015, 5, 1–7. [Google Scholar]
  66. Wu, J. Effects of changing scale on landscape pattern analysis: Scaling relations. Landsc. Ecol. 2004, 19, 125–138. [Google Scholar] [CrossRef]
  67. Yu, L.; Fu, Y.; Yu, H.; Li, Z. Landscape pattern gradient dynamics and desakota features in rapid urbanization area: A case study in Panyu of Guangzhou. Chin. J. Appl. Ecol. 2011, 22, 171–180. (In Chinese) [Google Scholar]
  68. Deng, J.S.; Wang, K.; Hong, Y.; Qi, J.G. Spatio-temporal dynamics and evolution of land use change and landscape pattern in response to rapid urbanization. Landsc. Urban Plan. 2009, 92, 187–198. [Google Scholar] [CrossRef]
  69. Ma, X.; Jin, Y. Study on Counteractive Mechanism between Urban Land Use Change and Tourism Development. Tour. Trib. 2014, 29, 87–96. (In Chinese) [Google Scholar]
  70. Larondelle, N.; Haase, D. Urban ecosystem services assessment along a rural–urban gradient: A cross-analysis of European cities. Ecol. Indic. 2013, 29, 179–190. [Google Scholar] [CrossRef]
  71. Dietzel, C.; Herold, M.; Hemphill, J.J.; Clarke, K.C. Spatio-temporal dynamics in California’s Central Valley: Empirical links to urban theory. Int. J. Geogr. Inf. Sci. 2005, 19, 175–195. [Google Scholar] [CrossRef]
Figure 1. Landscape circular structure theories.
Sustainability 10 01019 g001
Figure 2. Location of Hengduan Mountain region and land use for each city in 1990. The black lines indicate the buffers established for each city in study area.
Sustainability 10 01019 g002
Figure 3. Framework for gradient analysis of landscape changes around cities in the Hengduan Mountain region.
Sustainability 10 01019 g003
Figure 4. Landscape pattern around each city and its changes.
Sustainability 10 01019 g004
Figure 5. Urban Percentage of Landscape (PLAND) index and relief degree of land surface (RDLS) of cities in the Hengduan Mountain region in eight directions from 1990 to 2010. The blue, purple, and green solid lines represent the value of urban PLAND in 1990, 2000, and 2010 respectively, and the yellow dashed line is RDLS in different directions. Urban PLAND has an inverse relationship with the RDLS value.
Sustainability 10 01019 g005
Figure 6. Spatial changes in different landscape metrics along the ‘urban-rural’ gradient (a) changes of Largest Patch Index (LPI) metric; (b) changes of Area Weighted Mean Patch Fractal Dimension (AWMPFD) metric; (c) changes of Contagion Index (CONTAG) (d) changes of Shannon’s diversity index (SHDI) metric).
Sustainability 10 01019 g006
Figure 7. Temporal changes of LPI in the buffers of each city in the Hengduan Mountain region.
Sustainability 10 01019 g007
Figure 8. Temporal changes of CONTAG in the buffers of each city in the Hengduan Mountain region.
Sustainability 10 01019 g008
Figure 9. Temporal changes in AWMPFD in the buffers of each city in the Hengduan Mountain region.
Sustainability 10 01019 g009
Figure 10. Temporal changes of SHDI in the buffers of each city in the Hengduan Mountain region.
Sustainability 10 01019 g010aSustainability 10 01019 g010b
Figure 11. Spatial-temporal changes of different landscape metrics along the ‘urban-rural’ gradient. The red line represented the LPI and CONTAG metrics, and the green line represented the AWMPFD and SHDI curves, although the inverted –U shape of AWMPFD is not very clear. The solid and dashed lines indicate the spatial changes of landscape metrics at time t and t + 1, respectively. The shaded part indicates the staggered areas between urban and other land types. The red arrow indicates the changes in LPI and CONTAG metrics from time t to time t + 1, and the green arrow indicates those of AWMPFD and SHDI. While the upward arrow indicates an increase in the metrics’ values, the downward arrow indicates a decrease in the values. The staggered area moved outwards from urban to rural land, and the areas with the peak and low values moved outwards correspondingly.
Sustainability 10 01019 g011
Figure 12. Spatial and temporal changes in landscape patterns around cities in the Hengduan Mountain region. (a) landscape pattern heterogeneity along the ‘urban-rural’ gradient at time t; a1 to a5 represent landscape patterns in different buffers along the gradient; (b) the landscape pattern along the gradient at time t + 1. In the same column, (a,b) indicates temporal landscape changes for each buffer along the gradient. Mountain cities are developed from small to large in a continuous process, and temporal and spatial changes are relatively consistent. Spatial changes in landscape patterns from urban to rural areas can be regarded as the reverse process of landscape pattern changes accompanying urbanization, and temporal landscape pattern changes follow the pattern of a5 to a1.
Sustainability 10 01019 g012
Table 1. Details of the gradients for each city in the Hengduan Mountain Region.
CityThe Smallest Circle That Contains All of the Urban Land in 2010The Number of the Outermost BufferInterval Width
Chuxiong571 km
Lijiang571 km
Xichang881 km
Shangri-La461 km
Panzhihua Eastern City11111 km
Panzhihua Western City991 km
Dali671 km
Dali Old City670.5 km
Barkam680.1 km
Kangding14150.1 km
Note: for Barkam, the innermost buffer was increased by 50 m.
Table 2. Landscape metrics used in this study (based on FRAGSTATS 4.2).
Landscape MetricsCategoryRangeDescription
LPIAreaRange: 0 < LPI ≤ 100The percentage of total landscape area comprised by the largest patch. It is a simple measure of dominance. The more noticeable the dominance, the higher the LPI value.
AWMPFDShape1 ≤ AWMPFD ≤ 2Describes the irregularities or complexity of patch shapes. Values closer to 1 indicate simple shapes.
CONTAGAggregation0 < CONTAG ≤ 100The value approaches 0 when the patch types are as disaggregated or interspersed as possible.
SHDIDiversitySHDI ≥ 0Reflect the diversity of the landscape. The SHDI value increases as the number of different patch types increases.
PLANDArea0 < PLAND ≤ 100The percentage of the total landscape occupied by each patch type. When the value approaches 100, the area of the corresponding patch type increases in the landscape.

