Article

Impact of the Surrounding Built Environment on Energy Consumption in Mixed-Use Building

School of Urban and Environmental Engineering, Ulsan National Institute of Science and Technology, 50 UNIST-gil, Ulju-gun, Ulsan 44919, Korea
*
Author to whom correspondence should be addressed.
Sustainability 2018, 10(3), 832; https://doi.org/10.3390/su10030832
Submission received: 13 February 2018 / Revised: 1 March 2018 / Accepted: 2 March 2018 / Published: 15 March 2018
(This article belongs to the Section Energy Sustainability)

Abstract

:
While a mixture of residential and non-residential uses in urban development has advantages in reducing transportation energy consumption and improving efficiency of land utilization, the patterns of energy consumption in mixed-use buildings are largely unknown. To understand associations between the built environment and energy consumption and to find effective strategies for energy saving, this study aims to examine how the gas and electricity energy consumption of mixed-use properties is influenced by the characteristics of the immediate surroundings of the building as well as by the building’s attributes. The sample for this study is 22,109 mixed-use buildings in Seoul, Korea and the main source of outcome is electricity and gas energy consumption data retrieved from the open system of building data in 2015 and 2016. The regression results showed that a higher proportion of non-residential uses in mixed-use buildings was positively associated with higher electricity consumption overall but that it reduced gas energy use during the winter. In particular, increased restaurant and service use significantly influenced electricity consumption in the buildings. With regard to surrounding built environment, higher impervious surfaces and dense development near the buildings increased the electricity consumption of the buildings but it reduced gas energy consumption. Our results imply that, through the mediating effects of UHIs, the built environment characteristics of immediate surroundings may have indirect effects on energy consumption in mixed-use buildings.

1. Introduction

There is growing concern about climate change, increasing energy consumption and associated greenhouse gas emissions [1]. In particular, energy demand in nations with emerging economies is increasing much faster than that in developed countries [2]. Over the last 20 years, for example, the total energy consumption of China has tripled. Total per capita energy consumption in Korea reached 5.6 toe in 2016, which is substantially higher than 3.1 toe for the European Union [3]. Approximately 30% of the energy consumed worldwide is consumed in the residential sector [1]. Although a substantial amount of energy is consumed in the residential sector, the patterns of residential energy consumption have not been well understood because residential buildings have a wide variety of structure and materials, occupants’ behaviors vary widely and privacy issues hinder the collection of household energy consumption data [1].
Despite these difficulties, previous researchers have developed various modeling techniques for identifying residential sector energy consumption and finding effective energy conservation strategies. One of the dominant approaches in those studies has been a disaggregated method used to investigate the impact of different housing attributes and household characteristics on the energy consumption of a residential building unit using statistical or engineering techniques [4,5]. These studies have found that the insulation of walls, roofs or windows [6,7], the shape of buildings [8] and household characteristics, such as number of family members or income [9,10,11] were significantly associated with residential energy consumption.
Studies on energy consumption in non-residential buildings have adopted a similar approach. These non-residential building studies have examined the energy consumption of religious facilities [12], bank [13], public buildings [14] and commercial buildings [15,16] and building attributes associated with energy consumption. While the energy consumption intensities of these buildings varied based upon their structural features, the occupants’ characteristics and attitude, the weather conditions and the study’s context [4,17,18,19,20], studies of building energy consumption, commonly, have defined a specific building use of interest and analyzed the associations between building attributes and energy consumption using statistical or engineering techniques.
Meanwhile, from an urban planning perspective, mixed-land use development has been understood as one of the key strategies for achieving an energy efficient, sustainable and healthy environment. Mixed land use development pursues a residential neighborhood incorporating commercial, office, retail and industrial uses; this, in turn, reduces the travel distances and energy consumption associated with accessing such facilities [21]. Although previous studies have reported that mixed-land use development encourages non-motorized travel and reduces transportation energy consumption [22,23,24], the patterns of energy consumption in mixed-use buildings are largely unknown.
Unlike in a North American context, in Korea, buildings with mixed residential and non-residential use are one of the dominant types of residential occupancies. Various types of non-residential uses for improving occupants’ convenience are incorporated into Korean residential buildings. The 2010 building census survey showed that out of 2.5 million residential buildings in Seoul, 0.4 million were single-family residential buildings [25]. In 2010, the number of mixed-use residential buildings in Seoul was approximately 47,000, corresponding to 11% of single-family residential buildings.
Another research gap that we want to address in the present study is the influence of the immediate surroundings of the buildings on a building’s energy consumption. Hypothetically, the built environment may influence the microclimate of an urban environment, which results in a change of energy consumption in mixed-use properties. Previous studies have shown that the proportion of green space and building areas [26,27], or the distance to heat sources and sinks—such as bodies of water or large green spaces [28,29] were strongly associated with the microclimates of urban spaces, especially UHI formation. However, studies on the energy consumption of residential buildings have focused predominantly on the structural attributes of the buildings and neglected the potential influences of the surrounding environment.
The current study investigates the influence of mixed-use buildings and their surrounding built environment on electricity and gas energy consumption. Compared to earlier work on energy consumption of residential buildings, this research is original in two respects. First, the main subjects of the analyses are vertically mixed-use properties. While, at an aggregated ZIP code level, Howard et al. [18] built a model to estimate energy consumption by building use in New York City, the study examined the associations between mixed-use characteristics and energy consumption in a building is rare. Second, we accounted for surrounding built environment along with building attributes to understand their patterns of energy consumption. Our study examines how much of the electricity and gas consumption of buildings can be explained by surrounding built environment characteristics and building attributes, respectively.

2. Materials and Methods

2.1. Study Area and Samples

The subjects of the current study are mixed-use buildings in Seoul with non-residential and residential uses. The main source of energy consumption data was the monthly gas and electricity consumption of the buildings, provided by Korea Building Data Private Open System (KBDPOS). KBDPOS is a service system that provides administrative construction information related to residential and economic activities in the private sector. Information on buildings’ electricity/gas energy usage has been provided at a parcel level since January of 2011.
The specific building use and structural features of a building—such as their size or construction materials—were identified based on Korea’s 2016 building registers. The final subjects of the study were selected by spatially matching the addresses of the parcels in KBDPOS with the addresses on the building registers. One of the difficulties with determining the most appropriate samples for our analysis was the wide variety of mixed-use properties, in term of size and composition of households, available to us. Often, several households resided in a mixed-use building but we intentionally chose single household dwellings within a building. Since information on detailed household attributes was not available in mixed-use properties, we had to control the variations explained by household attributes and narrow the focus of our analysis to small- and medium-sized mixed-use properties. Among the selected samples, 93% of them are buildings with five stories or less. With regard to building use, the selected buildings were characterized by higher proportion of floor areas for retail, office and restaurant uses. The time range of this study is 12 months, from November 2015 to October 2016. We excluded samples, which did not provide more than 3 months of electricity or gas energy usage data.
Non–residential uses were classified into six categories: restaurant, accommodation, retail, service, office and manufacturing. Table 1 shows more details about the building uses classified in each category. For the analysis, we excluded buildings with registers that did not specify the building’s uses and samples that did not provide a land price in 2016. Through this process, 22,109 samples were selected for our analysis. Figure 1 shows the spatial distribution of the selected buildings in the study area. The average number of samples in each census dong was 47.3 (SD: 100.9). In general, the samples were distributed evenly throughout the study area, except in the downtown and commercial areas. Relatively large samples were selected in the high-density southern and eastern regions of the residential area.

2.2. Variables

2.2.1. Dependent Variables

We used four dependent variables: average monthly electricity consumption, average monthly gas energy consumption, average increase in electricity consumption during the summer and average increase in gas energy consumption during the winter. Average monthly electricity and gas energy consumption are the averages of electricity and gas energy consumption in each building for 12 months, from November 2015 to October 2016. According to the Korean energy usage survey in 2014 [30], energy carriers of residential energy consumption consist of gas (53.5%), electricity (25.1%), petroleum (11.2%) and others (10.3%). Meanwhile, the main energy carriers of commercial and public buildings are electricity (65.8%), gas (24.4%), petroleum (7.4%) and others (2.3%). Petroleum and other forms of energy consumption data are not provided in building level. With regard to commercial and public use energy consumption, 52.5% is used for heating purposes, 18.6% is used for cooling and 28.9% is used for cooking purposes. Electricity is used for various purposes; 23.5% for heating, 29.5% for cooling, 15.6% for power, 18.1% for lighting and 13.3% for cooking purposes.
Figure 2 shows seasonal variations in the energy consumption of the selected 22,109 buildings. Since a substantial part of the gas energy is consumed for heating, average monthly temperature is a dominant factor in explaining the variations of gas energy consumption. The months with the highest gas use were January, February and December and those with the lowest gas use were during summer period. On the other hand, the highest usage of electricity energy consumption was during the summer, when the cooling load is the highest. During the winter, since the demand for electrical heating increases, higher-than-the average monthly electricity consumption was found. Since the KBDPOS does not provide a target end-use for energy consumption, we defined two proxy variables that indicate heating demand in the winter and cooling energy consumption in the summer. To represent heating demand in the winter, the average increase in gas energy consumption during the winter was calculated by subtracting average monthly gas energy consumption from average gas energy consumption in December, January and February. Likewise, an increase in electricity consumption during the summer was calculated by subtracting average monthly electricity consumption from average electricity consumption of July, August and September, resulting in a secondary indicator of cooling demand in the summer.

2.2.2. Building Attributes

Building attribute variables were derived from 2016 building register of Korea, land prices of Seoul Open Data Plaza and GIS data. The building attributes examined included total floor area, the age of the building, the type of building structure, the type of roof structure and the shape index, indicating the degree of the non-square shape of the building’s floor. The building’s age indicates its general level of structural deterioration [4,17]. The estimated shape index of the building is the square of the perimeter of the building’s footprint divided by the footprint area of the building. The larger the shape index, the more irregular the shape the building is. Since irregular shapes can increase the outer lengths of buildings at a given floor area of that building, the energy efficiency of irregularly shaped structures tends to be lower than that of regularly shaped buildings [31]. The wall and roof structures of buildings are also expected to affect their thermal insulation [6,7].
Building use was defined as the proportion of six non-residential uses to the total floor area of a building. This variable captures energy consumption changes resulting from the non-residential occupancy of a building. The occupancy rates for different non-residential uses might have a significant effect on the energy consumption patterns of mixed-use buildings. For instance, a restaurant may have high gas energy consumption attributable to the energy requirements of cooking. The current study will identify the relationship between non-residential uses in a mixed-use building and energy consumption by analyzing the influence of different building-use compositions on four outcome variables. Household income is one of the factors influential in determining building energy consumption [4,17]. Since we could not obtain household income data, we used official land price per square meter for each property as a secondary indicator of household income. Presumably, those who live in a property with higher land price per unit area are likely to earn more or, at least, to be an economically affluent group of people.

2.2.3. Surrounding Built Environment

In this study, the surrounding built environment of mixed-use buildings were constructed using ArcGIS 10.4. While the size and definition of surrounding built environments varies widely, depending on the purpose of the studies, we defined it as 100 m buffered area from the parcels at which the building was located. The built environment of the immediate surroundings affects the urban/micro-urban climate [32]. Previous studies taking a field measurement approach have examined the influence of the geometric features of streets or the land cover characteristics of surrounding parcels on the Urban Heat Island (UHI) phenomenon and found that the presence of green space and water bodies had a cooling effect on the surrounding areas [33,34,35]. For instance, Park and Cho [35] reported that the cooling distance of green space was found within 120m of a green area and that the maximum intensity of the cooling effect was 3.0 K. We supposed that such a cooling effect may influence the energy consumption of mixed-use buildings. Indeed, Wong et al. [32] have shown that the presence of greenery near a single-family housing development reduced the energy consumption of those buildings. The width of entrance roads and their density variables indicate the number of impervious surfaces and hence the development intensity, near the building, which may affect the micro-urban climate, including wind, insolation or temperature [32]. The spatial unit used for population density is the census unit in which the building was located. The details about variables used in the models are described in Table 2.

2.3. Method of Analysis

We used a regression model to analyze the relationship between energy consumption and mixed-use buildings. A regression model is a statistical technique that can estimate the effects of one or more independent variables on dependent variables. In this study, since the distributions of all energy consumption outcomes were highly skewed positively, a double log model was used to estimate the impact of the variables on four energy consumption outcomes. A logarithmic transformation of predicted variable and predictors greatly improves performance of regression models in estimating energy consumption [36,37]
Ln ( E i ) = α + j β i j X i j + k ln ( β i k X i k ) + ε i
The dependent variables are a natural logarithm of the electricity and gas energy usage (kWh) of the mixed-use building i. Xij are the dummy variables and the proportion of non-residential use areas. Therefore, j includes the building and roof structure, the presence of the green area and the water body within the 100 m and the proportion of each non-residential use area. Xik are the continuous, independent variables of a mixed-use building, i, besides the proportion of non-residential use area. The variable k includes the total floor area, building age, the shape index, the land price and the width of the building’s entrance road. The building density within 100 m from building i and the population density where building i is located, were also included in k. The regression coefficient of the continuous variables implies the percentage increase of the dependent variable when the corresponding continuous variable increases by 1%. Since the occupancy rates of non-residential use buildings was measured using area proportion, the estimated coefficient also indicates the percentage increase of the building energy consumption when the floor area of corresponding non-residential uses increases by 1%. For diagnosing potential risk of multi-collinearity, we assessed the variance inflation factors (VIF). In general, higher than 10 of VIF implies weak reliability of estimated parameters owing to the multi-collinearity between the independent variables [36].
Of the 22,109 samples selected, 140 and 3525 buildings had a negative value change in gas energy consumption during the winter and an increase in electricity consumption during the summer, respectively. Excluding these properties, our model for measuring increases in gas use and electricity consumption utilized 21,969 and 18,584 samples, respectively.

3. Results

3.1. Descriptive Statistics

Table 2 represents the descriptive statistics for the selected variables. The average monthly electricity and gas energy consumption per building was 4340 kWh and 4645 kWh, respectively. The average increase in gas energy consumption during the winter was 4024 kWh, which implies that a substantial amount of gas energy is spent during the winter for heating.
The average floor area of the mixed-use properties was 545.3 m2, which is considerably larger than the size of typical residential buildings reported in other studies [4,17]. This difference is mainly due to the sizes of the non-residential uses added to the residential space. The average proportion of residential use area in our samples was approximately 29%, which corresponds to 158 m2. The largest proportion of non-residential uses were office and retail uses. On average, 25.8% of the floor area of the buildings was occupied for office use and 20.9% of the area was used for retail. The proportion of area for manufacturing and accommodation use was less than 3% of the total floor space of the buildings. Among the selected samples, 71.4% of the buildings included office use and 69.7% of the buildings included retail uses. The proportion of the buildings that included manufacturing and accommodation use was 5.6% and 4.1%, respectively.
Meanwhile, the electricity consumption intensity of mixed-use properties is much higher than that of residential building units. Our samples show that the annual electricity consumption intensity was approximately 95.6 kWh/m2, while other studies conducted in the Netherlands [17] and Sweden [4] showed that the electricity consumption intensity of a residential building was 28.6 kWh/m2 and 33.9 kWh/m2, respectively. This difference is largely due to the high electricity consumption intensity required of non-residential uses. Howard et al. [18], estimating annual electricity consumption intensity by building use in New York City, found that residential units with 1–4 households had the lowest intensity (49.3 kWh/m2) and those reserved for non-residential uses such as offices (276 kWh/m2) and stores (180 kWh/m2) had a much higher electricity consumption intensity. Similarly, a study on energy consumption the building stock of Greater London [38] showed that median energy intensity of non-residential building besides education building type was higher than 250 kWh/m2.
In summary, both the sizes and electricity consumption intensity of mixed-use buildings were substantially higher than those of typical residential buildings.

3.2. Regression Analysis

3.2.1. Electricity Energy Consumption

Table 3 presents the regression estimates for electricity consumption. The models explain 50% of the variations in average monthly electricity consumption and 25% of the variations in increased electricity consumption during the summer. Average monthly electricity consumption and an increase in electricity consumption during the summer were both found to be significantly influenced by the building’s attributes. When the total floor area increased by 10%, overall electricity consumption increased by 7.5% and electricity consumption during the summer increased by 6.8%. While electricity consumption was not affected by the age of the building, electricity consumption during the summer was lower when the age of the building increased. A higher shape index—i.e., the more irregular the shape of the building’s footprint—significantly increased a building’s electricity consumption. At a 10% increase in the shape index of buildings, average monthly electricity consumption and electricity consumption during the summer increased by 2% and 1.5%, respectively. Buildings with concrete walls and roofs had reduced average electricity consumption. A higher land price was positively associated with increases in both electricity consumption outcomes. When land prices increased by 10%, average monthly electricity consumption increased by 5.5% and summer electricity consumption increased by 7.0%. With regard to building use, electricity consumption increased when the proportion of area used for non-residential purposes increased. In particular, an increase in restaurant and service uses greatly increased the electricity consumption of the buildings. The relative proportion of manufacturing and office uses had a moderate influence on both electricity consumption outcomes.
Electricity consumption also increased when the width of the entrance road increased. A considerable area of the impervious surfaces in urban areas comprise roads covered by concrete or asphalt and the high radiant temperatures of these road surfaces is one of the major UHI heat sources [35]. Furthermore, wide roads with extensive impervious surfaces reduce evapotranspiration from soil-vegetation systems and their high traffic volumes may cause higher anthropogenic heat emissions. Such features of entrance road may increase cooling demand of the mixed-use building. The presence of a water body in surrounding areas was not associated with electricity consumption, while the proximity of green spaces reduced the electricity consumption of adjacent buildings. Green spaces and the water spaces are known to be the main heat sinks in the inner city [39,40] but the present study found no significant influence of a nearby body of water on a building’s electricity consumption. The presence of green space in the immediate surroundings, however, may reduce the energy demanded for cooling a building by reducing the ambient temperature [41]. Further, placing large open spaces around a building may decrease the amount of energy that it requires for lighting. An obstruction angle to building facades is one of the main factors with a direct influence on indoor daylight levels and lighting energy demands [21].
Population and building density increased the use of electricity but these factors did not result in increased electricity consumption during the summer. Studies focusing on the relationship between density and energy consumption have reported different results for different spatial scales [22], dwelling types [42] and neighborhood land-use [43]. At a city scale, an increase in housing density tends to reduce per capita energy consumption [22]. In commercial neighborhoods, higher density leads to lower energy use intensity of the buildings [43]. However, studies conducted on neighborhood or building unit scales [18,21,44] showed generally positive associations between development density and household energy consumption. In particular, high building densities can reduce the amount of light that buildings receive, thus increasing their energy demands for lighting [21]. In addition, the mediating effects of the UHIs of compact development on residential energy consumption [44] increase the demand for cooling since the increased density of the urban center affects radiant surface and air temperatures. Our results showed that a 10% increase in population and building density in the surrounding increased the average monthly electricity consumption of the adjacent buildings by 2.9% and 5.7%.

3.2.2. Gas Energy Consumption

Two regression models for gas energy consumption (Table 4) explained 26% of the variations that we found in average monthly gas energy consumption and 30% of the increased gas energy consumption during winter. The effect of the building attributes on gas energy consumption was similar to the associations between building attributes and electricity consumption: gas energy consumption tended to decrease when the buildings had the attributes of regular-shaped, old and concrete structures.
On the other hand, the influence of non-residential occupancy on gas energy consumption was substantially different from its influence on electricity consumption. A higher proportion of areas used for accommodations and services increased gas energy consumption but a higher proportion of retail, office and manufacturing uses reduced the gas energy consumption of the buildings. In particular, the increase in gas energy consumption during the winter was lower when the proportion of all but one (accommodation) of non-residential uses increased. This result is due primarily to a high dependency on electrical heating for non-residential uses compared to residential uses. According to an energy consumption survey in 2014 [30], hotels and hospitals had relatively high dependency on gas energy consumption for heating demands, while other non-residential uses—such as offices, stores and public buildings—had very low gas energy consumption for heating. When land prices increased by 10%, average gas energy consumption increased by 1% and the overall increase in gas energy consumption during the winter decreased by 1%. The land price of mixed-use properties was positively associated with their proportional area for non-residential uses (ρ = 0.192), which implies that mixed-use buildings with higher occupancies for non-residential uses tended to be located at places with higher land prices. Since non-residential uses had smaller seasonal variations in gas energy consumption than residential uses [44], an increase in gas energy consumption during the winter decreased, when the proportional area of non-residential uses and the land prices increased.
Unlike the result for electricity consumption, the width of entrance roads was negatively associated with average monthly gas energy consumption and increased gas energy consumption during the winter. The high radiant temperatures and anthropogenic heat emissions emanating from wide entrance roads might reduce the heating demands of the building. While the presence of a water body did not affect gas energy consumption, the presence of a green area reduced the average monthly gas energy consumption of the buildings but was not associated with increased gas energy consumption during the winter.
Higher densities also reduced the gas energy consumption of buildings and, at a significance level of 6%, also reduced gas energy consumption during the winter. The relationship between density and gas energy consumption was mixed, but, unlike the results of electricity consumption, higher development densities near mixed-use buildings seemed to decrease their gas energy consumption. Similarly, in a study of the greater Dublin region, Liu and Sweeney [45] found a strong negative association between household density and heating energy demand and Ewing and Rong [44] reported that compact development leads to a reduction in annual heating degree-days. Since gas energy consumption in buildings is highly related to air temperature, higher development densities near the buildings may result in warmer urban climates in the winter, thereby reducing the heating demand of the building.

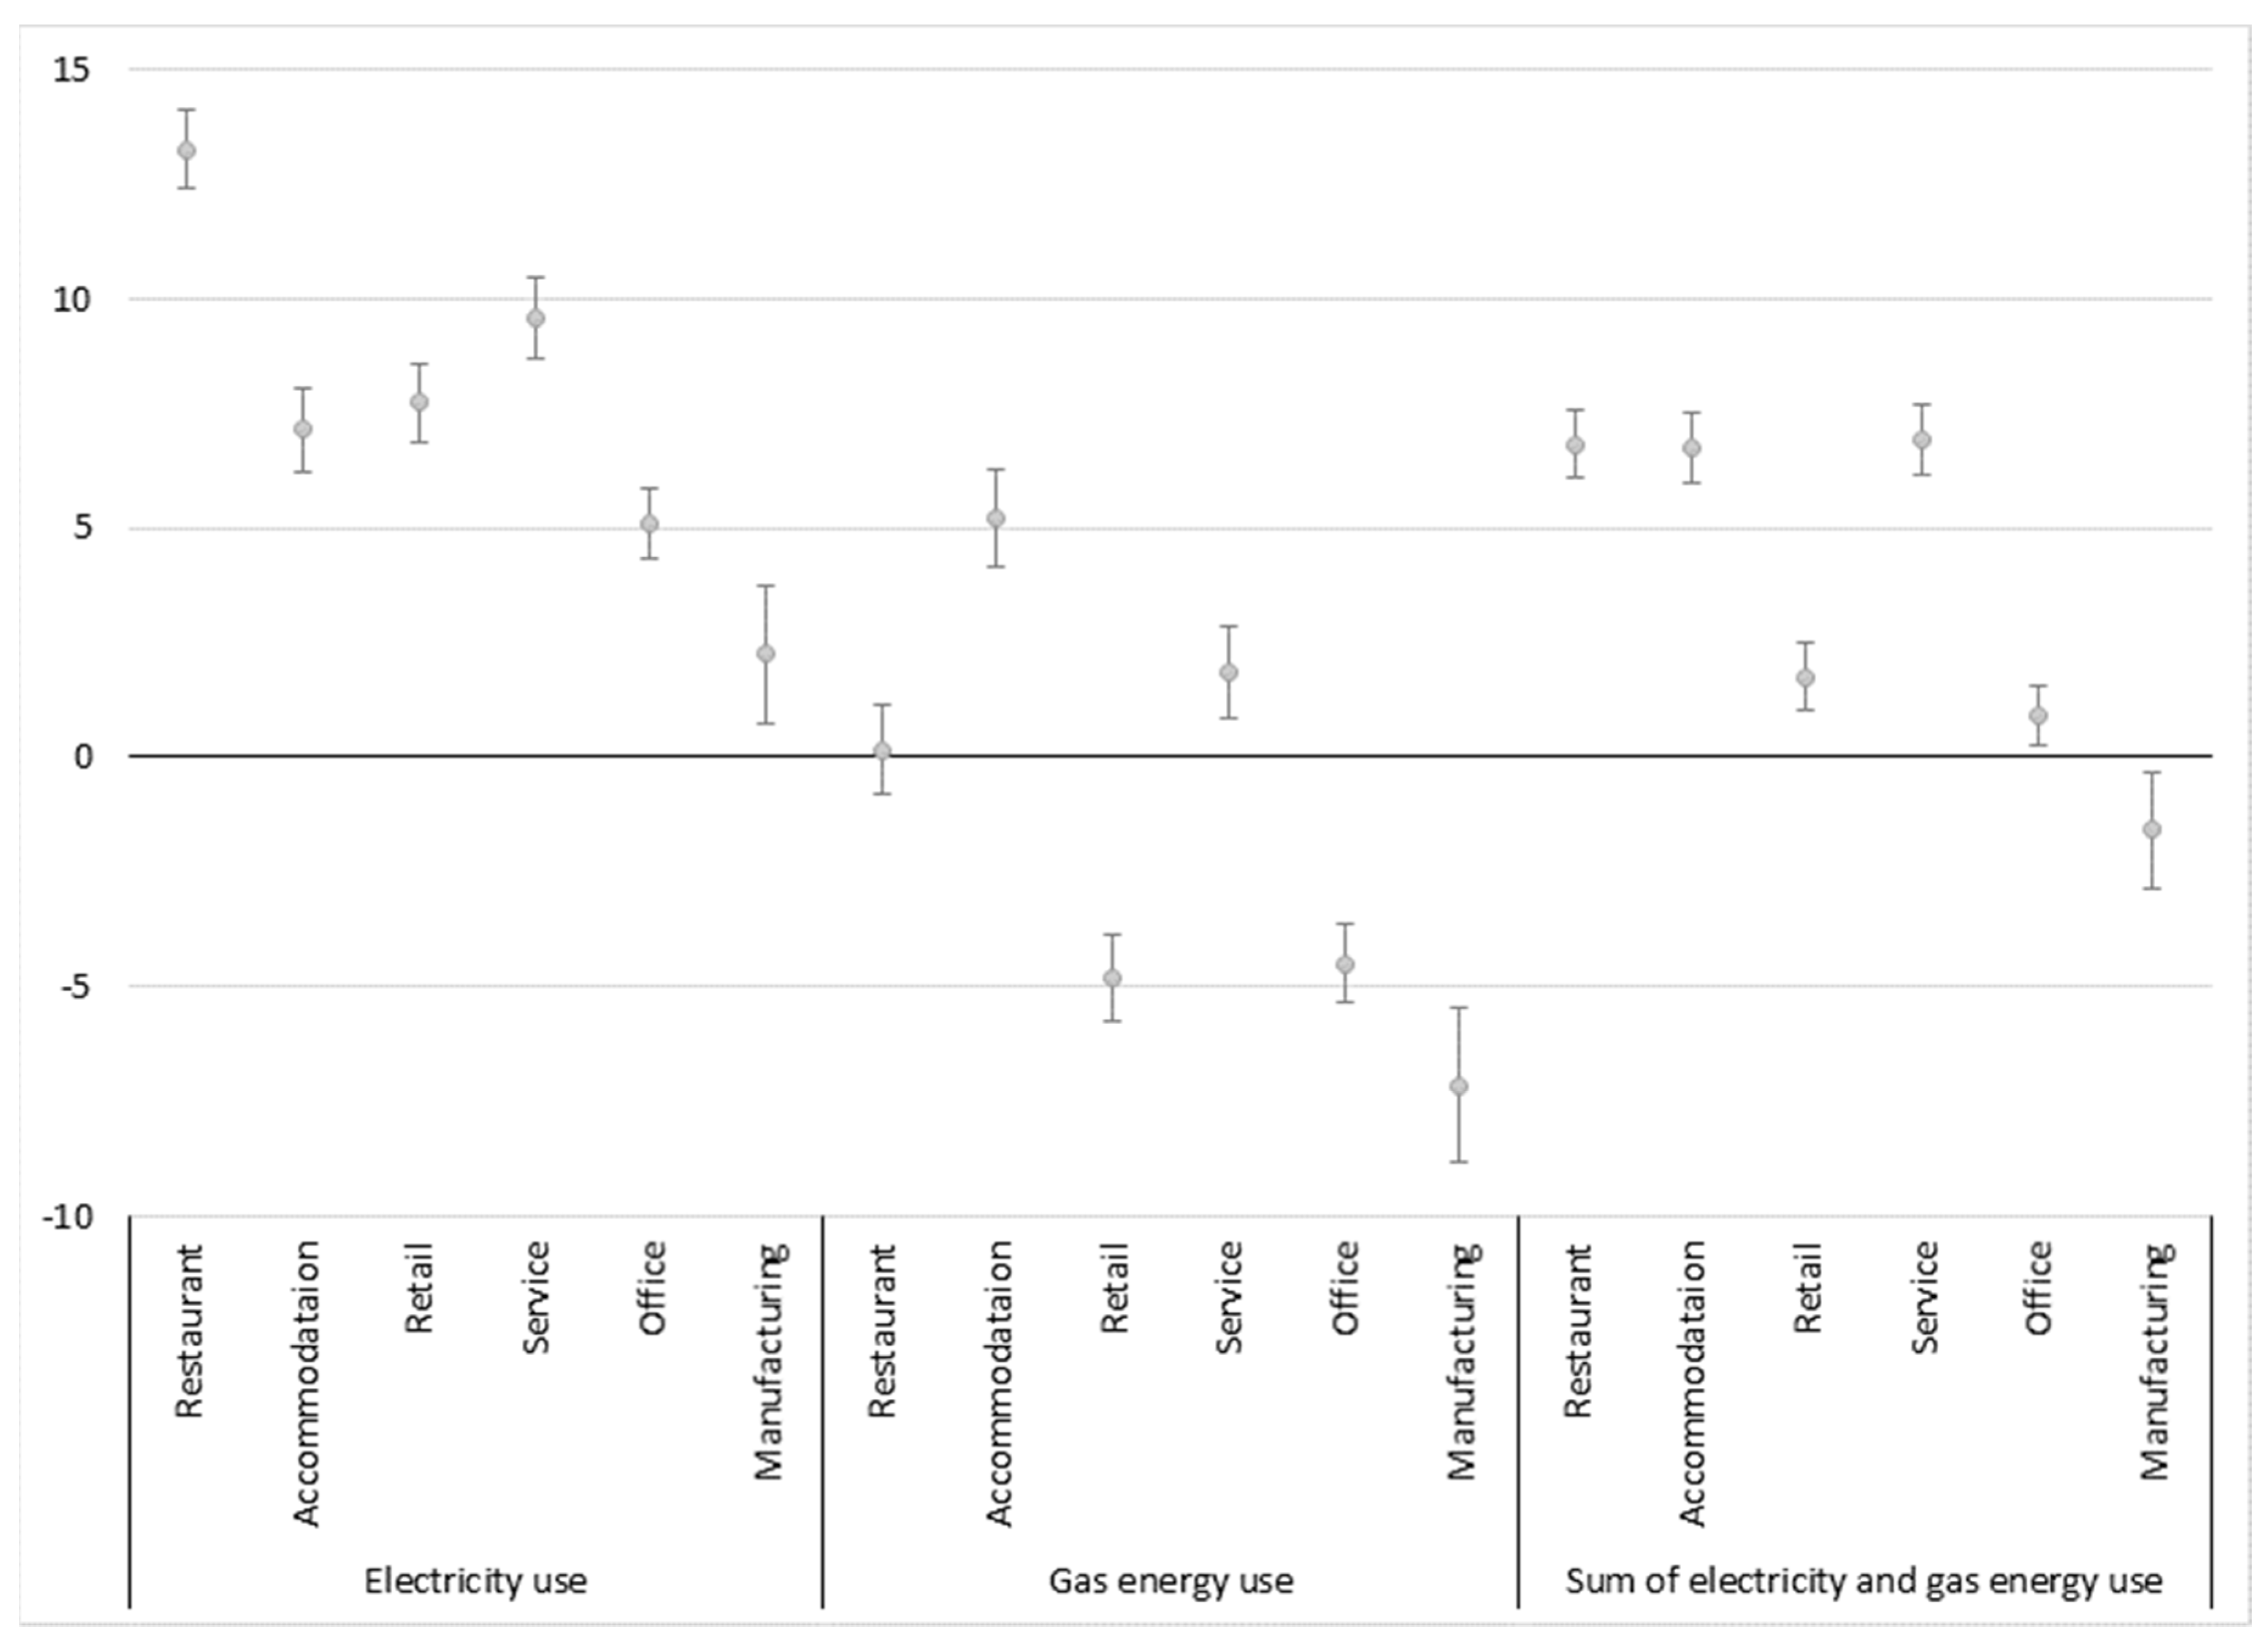
3.2.3. Energy Consumption by Building Use

Figure 3 represents estimated changes in electricity and gas energy consumption at 95% confidence intervals when the proportion of each non-residential use area increases by 10%. For the purpose of identifying the influence of non-residential uses on total energy consumption, the results of an additional model for sum of electricity and gas energy consumption were included (see Figure 3).
For electricity consumption, 10% increases in the proportion used for restaurants and services increased electricity consumption in the building by approximately 13% and 9.6%, respectively. A 10% increase in manufacturing use increased electrical energy consumption by 2.3%. Meanwhile, with regard to gas energy consumption, only accommodation and service uses were associated with increased gas energy consumption. A 10% increase in the proportion for accommodation and service use increased gas energy consumption by approximately 5.2% and 1.9%, respectively. Gas energy consumption decreased when the proportion of retail, office and manufacturing uses increased. As the graph shows, increases in the proportion of restaurant, accommodation and service uses in a building substantially increased the total electricity and gas energy consumption in that building: a 10% increase in proportion of restaurant, accommodation and service use increased total energy consumption in the building by 6.8%, 6.7% and 6.9%, respectively. Increases in retail and office uses slightly increased total energy consumption, while an increase in manufacturing occupancy decreased total energy consumption.
In mixed-use buildings, non-residential occupancy had higher energy consumption intensity than residential use occupancy. Higher accommodation occupancy increased both electricity and gas energy consumption and higher restaurant and service occupancy substantially increased the electricity consumption of a mixed-use building.

4. Discussion

Electricity and gas energy consumption in mixed-use buildings were influenced by the building’s attributes, the proportion of the building’s uses and the surrounding built environment. The building’s attributes that increased electricity consumption were similar to those that increased gas energy consumption but proportion of building use and the surrounding built environment had different effects on electrical energy consumption and on gas energy consumption.
Higher proportions of non-residential uses increase electrical energy consumption. Howard et al. [18] analyzed the energy consumption of the census block group in New York and found that residential electricity energy intensity remained at about 15–30% of non-residential use, while the increase in residential uses reduced the energy consumption of the census block group. On the other hand, the results of gas energy consumption appear to be somewhat mixed. All non-residential uses except for accommodation reduced gas energy consumption in general. Higher proportions of non-residential use reduced the increase in gas energy consumption during the winter since seasonal variations in gas energy usage in non-residential buildings is smaller than the variations in residential usage. For instance, an increase in restaurant use was not associated with average gas energy consumption but it greatly reduced the increase in gas energy consumption during the winter. Since restaurants consume large amounts of gas energy for cooking, cold air temperatures during the winter did not make large increase in gas energy consumption during winter. Another important factor is energy price policy. In Korea, gas and electricity energy prices vary according to building use and season. In particular, the price of electricity for residential use is much higher than that for non-residential use. In 2017, the price of gas energy for residential use is approximately 9.5% higher than that of commercial and public uses. However, the price of electricity energy for residential use is 2.02 times the electricity price for commercial use in winter period. When more than 400 kWh of electricity energy is consumed, the residential electricity price is 3.02 times of the non-residential electricity price. Because of the price gap between gas and electricity cost during winter, the heating energy for residential use largely depends on the gas energy.
The regression results showed that a wide entrance road and compact development increased electricity consumption and decreased gas energy consumption. Previous studies on urban heat islands have reported complementary relationships between cooling and heating demanded by the geographical locations. Santamouris et al. [46] found that the cooling loads of buildings in urban centers were doubled compared to the buildings located at rural sites but during the winter, the heating load of the buildings was reduced by up to 30%. A heating and cooling energy demand simulation [47] showed that the annual heating load of the office building at the center of London was 22% less than the heating load of rural site while the cooling load of the buildings steadily increased as the distance from the city center decreased. Our results imply that a high density of impervious surfaces within the urban area may affect the micro-urban climate; this, in turn, increases the cooling demands and reduces the heating demands of the buildings.
The presence of green areas near mixed-use buildings reduced the use of electricity and gas energy. Previous studies that have investigated the effects of green areas on temperature showed the cooling effects of open green spaces [48,49] but the relationship between green spaces and gas energy consumption has not been well documented. We speculate that placing open green spaces near the building may reduce the area in which the shadows of the surrounding buildings are exposed, which would affect the building’s heating demand. Finding ways to determine the relationship between green area and gas energy consumption more accurately needs to be investigated through a building-level simulation study that takes into account the end use of gas energy as well as the detailed attributes of the built environment. While bodies of water located in urban areas have been known as important heat sinks [26,50], we did not find any association between the presence of bodies of water and energy consumption in mixed-use buildings. This result suggests that the presence of water bodies has a relatively small effect on temperature compared to the presence of green areas. It is noteworthy that the buildings that had water bodies within 100m accounted for only 3.7% of the samples in the current study, implying that the number of samples with the presence of water bodies might be too small to accurately identify the effect of water body on energy consumption.
Some results seem to be affected by higher-than-moderate levels of correlation between variables. The age of the building decreased electricity consumption during the summer and average gas energy consumption. This result may be attributed to the unique features of Korean buildings: recently-constructed buildings in Korea are relatively large in size (ρ = 0.232) and provide for a higher proportion of non-residential uses (ρ = 0.244). Similarly, an increase in gas energy consumption during the winter had a negative relationship with land prices, which seems to reflect a tendency of the buildings with a higher proportion of non-residential uses to have higher land prices.
The current study has some limitations in the data. First, we used the monthly electricity and gas energy consumption of the buildings in total but we did not obtain specific end-use information. While gas energy was mainly consumed for heating purposes in these buildings, electricity has a variety of uses such as cooling, heating, hot water supply, lighting and kitchen appliances. Without this information, we could not conduct analyses to identify a more accurate relationship between surrounding built environment and the end uses of electricity. Second, our analyses did not account for household attributes. Occupants’ behaviors and attitudes influence the energy consumption of residential buildings [9,10,11,20]. Since the subject of this study was mixed-use properties with residential and non-residential uses, we did not obtain the socio-demographic attributes of occupants at the household level.

5. Conclusions

Mixed-use development is understood as crucial to achieving a “compact city” and a viable urban environment in the urban planning field but the relationship between mixed-use buildings and energy consumption is rarely known. The purpose of the present study was to examine how the electricity and gas energy consumption of the mixed-use properties is influenced by the composition of their non-residential uses and the characteristics of the building’s immediate surroundings.
The findings showed that a higher proportion of non-residential uses resulted in increased electricity consumption but decreased gas energy consumption during the winter, largely due to a high dependency on electrical heating in non-residential building spaces. In areas where commercial development pressure is increasing, the conversion from single-family houses to mixed-use buildings tends to be concentrated and these changes are likely to increase the electricity consumption in the area significantly. Understanding the relationship between the spatial arrangements of mixed-use buildings and their electricity demands will assist urban planners and policy makers to provide efficient urban energy infrastructures and improve energy efficiency.
The impervious surface and high development densities that cause the UHI phenomenon were identified as increasing electricity consumption in building units, while the same factor has been shown to reduce gas energy consumption in buildings. Most studies on UHI have examined associations between the built environment and climate characteristics at the city scale but our results imply that the immediate surroundings of a building may affect the micro-urban climate in addition to the cooling and heating demands of the building. Providing green spaces around buildings has the advantages of reducing both UHI and the obstruction angle of the building facades, thereby reducing both electricity and gas energy consumption.
The contribution of this study lies in its empirical analyses of energy consumption in mixed-use buildings and its correlates with non-residential uses and the building’s immediate surroundings. In order to confirm the findings of the current study, further research needs to develop specific theories that explain the energy consumption patterns of mixed-use buildings and to conduct more sophisticated empirical analyses of the relationships between the features of mixed-use buildings, the composition of building use and the surrounding environment, accounting for the energy balance of each building, seasonal air temperature and lighting.

Acknowledgments

This work was supported by the National Research Foundation of Korea (NRF) Grant funded by the Korean Government (MSIP) (No. NRF-2015R1A5A7037825).

Author Contributions

Young-Eun Woo was responsible for data analysis and drafted the manuscript. Gi-Hyoug Cho supervised the overall research and critically revised the manuscript. All authors read and approved the final manuscript for submission.

Conflicts of Interest

The authors declare no conflict of interest

References

  1. Swan, L.G.; Ugursal, V.I. Modeling of end-use energy consumption in the residential sector: A review of modeling techniques. Renew. Sustain. Energy Rev. 2009, 13, 1819–1835. [Google Scholar] [CrossRef]
  2. Pérez-Lombard, L.; Ortiz, J.; Pout, C. A review on buildings energy consumption information. Energy Build. 2008, 40, 394–398. [Google Scholar] [CrossRef]
  3. Enerdata South Korea Energy Report. Available online: https://estore.enerdata.ne (accessed on 13 August 2017).
  4. Wahlström, M.H.; Hårsman, B. Residential energy consumption and conservation. Energy Build. 2015, 102, 58–66. [Google Scholar] [CrossRef]
  5. Kavgic, M.; Mavrogianni, A.; Mumovic, D.; Summerfield, A.; Stevanovic, Z.; Djurovic-Petrovic, M. A review of bottom-up building stock models for energy consumption in the residential sector. Build. Environ. 2010, 45, 1683–1697. [Google Scholar] [CrossRef]
  6. Pardo, N.; Thiel, C. Evaluation of several measures to improve the energy efficiency and CO2 emission in the European single-family houses. Energy Build. 2012, 49, 619–630. [Google Scholar] [CrossRef]
  7. Toguyeni, D.Y.; Coulibaly, O.; Ouedraogo, A.; Koulidiati, J.; Dutil, Y.; Rousse, D. Study of the influence of roof insulation involving local materials on cooling loads of houses built of clay and straw. Energy Build. 2012, 50, 74–80. [Google Scholar] [CrossRef]
  8. Choi, I.Y.; Cho, S.H.; Kim, J.T. Energy consumption characteristics of high-rise apartment buildings according to building shape and mixed-use development. Energy Build. 2012, 46, 123–131. [Google Scholar] [CrossRef]
  9. Kavousian, A.; Rajagopal, R.; Fischer, M. Determinants of residential electricity consumption: Using smart meter data to examine the effect of climate, building characteristics, appliance stock and occupants’ behavior. Energy 2013, 55, 184–194. [Google Scholar] [CrossRef]
  10. Pachauri, S. An analysis of cross-sectional variations in total household energy requirements in India using micro survey data. Energy Policy 2004, 32, 1723–1735. [Google Scholar] [CrossRef]
  11. Seryak, J.; Kissock, K. Occupancy and behavioral affects on residential energy use. In Proceedings of the Solar Conference (American Solar Energy Society), Austin, TX, USA, 21–26 June 2003; pp. 717–722. [Google Scholar]
  12. Mushtaha, E.; Helmy, O. Impact of building forms on thermal performance and thermal comfort conditions in religious buildings in hot climates: a case study in Sharjah city. Int. J. Sustain. Energy 2016, 36, 926–944. [Google Scholar] [CrossRef]
  13. Aranda, A.; Ferreira, G.; Mainar-Toledo, M.D.; Scarpellini, S.; Llera Sastresa, E. Multiple regression models to predict the annual energy consumption in the Spanish banking sector. Energy Build. 2012, 49, 380–387. [Google Scholar] [CrossRef]
  14. Kong, X.; Lu, S.; Gao, P.; Zhu, N.; Wu, W.; Cao, X. Research on the energy performance and indoor environment quality of typical public buildings in the tropical areas of China. Energy Build. 2012, 48, 155–167. [Google Scholar] [CrossRef]
  15. Chung, W.; Hui, Y.V.; Lam, Y.M. Benchmarking the energy efficiency of commercial buildings. Appl. Energy 2006, 83, 1–14. [Google Scholar] [CrossRef]
  16. Ng, L.C.; Ojeda Quiles, N.; Dols, W.S.; Emmerich, S.J. Weather correlations to calculate infiltration rates for U. S. commercial building energy models. Build. Environ. 2018, 127, 47–57. [Google Scholar] [CrossRef] [PubMed]
  17. Brounen, D.; Kok, N.; Quigley, J.M. Residential energy use and conservation: Economics and demographics. Eur. Econ. Rev. 2012, 56, 931–945. [Google Scholar] [CrossRef]
  18. Howard, B.; Parshall, L.; Thompson, J.; Hammer, S.; Dickinson, J.; Modi, V. Spatial distribution of urban building energy consumption by end use. Energy Build. 2012, 45, 141–151. [Google Scholar] [CrossRef]
  19. Tavakoli, E.; Montazerin, N. Stochastic analysis of natural gas consumption in residential and commercial buildings. Energy Build. 2011, 43, 2289–2297. [Google Scholar] [CrossRef]
  20. Schaffner, D.; Ohnmacht, T.; Weibel, C.; Mahrer, M. Moving into energy-efficient homes: A dynamic approach to understanding residents’ decision-making. Build. Environ. 2017, 123, 211–222. [Google Scholar] [CrossRef]
  21. Steemers, K. Energy and the city: Density, buildings and transport. Energy build. 2003, 35, 3–14. [Google Scholar] [CrossRef]
  22. Lariviere, I.; Lafrance, G. Modelling the electricity consumption of cities: Effect of urban density. Energy Econ. 1999, 21, 53–66. [Google Scholar] [CrossRef]
  23. Liu, C.; Shen, Q. An empirical analysis of the influence of urban form on household travel and energy consumption. Comput. Environ. Urban Syst. 2011, 35, 347–357. [Google Scholar] [CrossRef]
  24. Zhang, L.; Hong, J.; Nasri, A.; Shen, Q. How built environment affects travel behavior: A comparative analysis of the con-nections between land use and vehicle miles traveled in US cities. J. Transp. Land Use 2012, 5, 40–52. [Google Scholar] [CrossRef]
  25. Korea, S. Population Census; Book Population Census. 2010. Available online: http://kosis.kr (accessed on 7 March 2018).
  26. Coseo, P.; Larsen, L. How factors of land use/land cover, building configuration and adjacent heat sources and sinks explain Urban Heat Islands in Chicago. Landsc. Urban Plan. 2014, 125, 117–129. [Google Scholar] [CrossRef]
  27. Hwang, Y.H.; Lum, Q.J.G.; Chan, Y.K.D. Micro-scale thermal performance of tropical urban parks in Singapore. Build. Environ. 2015, 94, 467–476. [Google Scholar] [CrossRef]
  28. Oswald, E.M.; Rood, R.B.; Zhang, K.; Gronlund, C.J.; O’Neill, M.S.; White-Newsome, J.L.; Brines, S.J.; Brown, D.G. An investigation into the spatial variability of near-surface air temperatures in the Detroit, Michigan, Metropolitan region. J. Appl. Meteorol. Climatol. 2012, 51, 1290–1304. [Google Scholar] [CrossRef]
  29. Schatz, J.; Kucharik, C.J. Seasonality of the urban heat island effect in Madison, Wisconsin. J. Appl. Meteorol. Climatol. 2014, 53, 2371–2386. [Google Scholar] [CrossRef]
  30. Institute, K.E.E. 2014 Energy Consumption Survey; Ministgry of Trade, Industry & Energy: Sejong, Korea, 2015.
  31. Choi, W.-K.; Kim, H.-J.; Suh, S.-J. A study on the analysis of energy consumption patterns according to the building shapes with the same volume. J. Korean Sol. Energy Soc. 2007, 27, 103–109. [Google Scholar]
  32. Wong, N.H.; Jusuf, S.K.; Syafii, N.I.; Chen, Y.; Hajadi, N.; Sathyanarayanan, H.; Manickavasagam, Y.V. Evaluation of the impact of the surrounding urban morphology on building energy consumption. Sol. Energy 2011, 85, 57–71. [Google Scholar] [CrossRef]
  33. Cao, X.; Onishi, A.; Chen, J.; Imura, H. Quantifying the cool island intensity of urban parks using ASTER and IKONOS data. Landsc. Urban Plan. 2010, 96, 224–231. [Google Scholar] [CrossRef]
  34. Hathway, E.; Sharples, S. The interaction of rivers and urban form in mitigating the Urban Heat Island effect: A UK case study. Build. Environ. 2012, 58, 14–22. [Google Scholar] [CrossRef]
  35. Park, J.-H.; Cho, G.-H. Examining the Association between Physical Characteristics of Green Space and Land Surface Temperature: A Case Study of Ulsan, Korea. Sustainability 2016, 8, 777. [Google Scholar] [CrossRef]
  36. Schüler, N.; Mastrucci, A.; Bertrand, A.; Page, J.; Maréchal, F. Heat demand estimation for different building types at regional scale considering building parameters and urban topography. Energy Proced. 2015, 78, 3403–3409. [Google Scholar] [CrossRef]
  37. Kolter, J.Z.; Ferreira, J., Jr. A Large-Scale Study on Predicting and Contextualizing Building Energy Usage. In Proceedings of the Twenty-Fifth AAAI Conference on Artificial Intelligence, AAAI 2011, San Francisco, CA, USA, 7–11 August 2011. [Google Scholar]
  38. Choudhary, R. Energy analysis of the non-domestic building stock of Greater London. Build. Environ. 2012, 51, 243–254. [Google Scholar] [CrossRef]
  39. Givoni, B.; La Roche, P. Indirect evaporative cooling with an outdoor pond. Proceed. Archit. City Environ. PLEA 2000, 310–311. [Google Scholar]
  40. Robitu, M.; Musy, M.; Inard, C.; Groleau, D. Modeling the influence of vegetation and water pond on urban microclimate. Sol. Energy 2006, 80, 435–447. [Google Scholar] [CrossRef]
  41. Akbari, H.; Taha, H. The impact of trees and white surfaces on residential heating and cooling energy use in four Canadian cities. Energy 1992, 17, 141–149. [Google Scholar] [CrossRef]
  42. Li, C.; Song, Y.; Kaza, N. Urban form and household electricity consumption: A multilevel study. Energy Build. 2018, 158, 181–193. [Google Scholar] [CrossRef]
  43. Quan, S.J.; Wu, J.; Wang, Y.; Shi, Z.; Yang, T.; Yang, P.P.J. Urban Form and Building Energy Performance in Shanghai Neighborhoods. Energy Proced. 2016, 88, 126–132. [Google Scholar] [CrossRef]
  44. Ewing, R.; Rong, F. The impact of urban form on US residential energy use. Hous. Policy Debate 2008, 19, 1–30. [Google Scholar] [CrossRef]
  45. Liu, X.; Sweeney, J. Modelling the impact of urban form on household energy demand and related CO2 emissions in the Greater Dublin Region. Energy Policy 2012, 46, 359–369. [Google Scholar] [CrossRef]
  46. Santamouris, M.; Papanikolaou, N.; Livada, I.; Koronakis, I.; Georgakis, C.; Argiriou, A.; Assimakopoulos, D. On the impact of urban climate on the energy consumption of buildings. Sol. Energy 2001, 70, 201–216. [Google Scholar] [CrossRef]
  47. Watkins, R.; Palmer, J.; Kolokotroni, M.; Littlefair, P. The balance of the annual heating and cooling demand within the London urban heat island. Build. Serv. Eng. Res. Technol. 2002, 23, 207–213. [Google Scholar] [CrossRef]
  48. Honjo, T.; Takakura, T. Simulation of thermal effects of urban green areas on their surrounding areas. Energy Build. 1990, 15, 443–446. [Google Scholar] [CrossRef]
  49. Yu, C.; Hien, W.N. Thermal benefits of city parks. Energy Build. 2006, 38, 105–120. [Google Scholar] [CrossRef]
  50. Gunawardena, K.; Wells, M.; Kershaw, T. Utilising green and bluespace to mitigate urban heat island intensity. Sci. Total Environ. 2017, 584, 1040–1055. [Google Scholar] [CrossRef] [PubMed]
Figure 1. Number of selected samples in the study area.
Sustainability 10 00832 g001
Figure 2. Seasonal variations of electricity and gas energy consumption.
Sustainability 10 00832 g002
Figure 3. Changes in electricity and gas energy consumption when the proportion of each non-residential use increases by 10%.
Sustainability 10 00832 g003
Table 1. Classification of building use.
ClassificationSpecific Building Use
RestaurantRestaurants, coffee shops, teahouse, pub, bar
AccommodationInn, motel
RetailSupermarket, pharmacy, grocery store, stationery, bookstore
ServiceBeauty shop, theater, laundry, PC room, repair shop, day care center
OfficeLaboratory, academy, religious facilities, a clinic, real estate office
ManufacturingWorkshops, bakery, printing house, Tofu factory
Table 2. Descriptive statistics of model variables.
Outcome VariablesMeanStd.devMinMax
Average monthly electricity consumption (KWh)434045997.25123,092
Average monthly gas energy consumption (KWh)4645556015208,970
Increase in electricity consumption during summer (KWh)99613000.1733,929
Increase in gas energy consumption during winter (KWh)40243573194,329
Independent Variables
Building attributesStructureTotal floor area (m2)545.3391.824.7922,494
Age of the building25.59.0187
Shape index17.572.11214.3861.05
Structure (dummy) *0.8840.32101
Roof structure (dummy) **0.9570.20201
Building use ***Restaurant0.1190.16300.926
Accommodation0.0260.13200.966
Retail0.2090.20000.971
Service0.0540.14200.941
Office0.2580.22300.985
Manufacturing0.0130.06200.825
EconomyLand price (US dollar/m2)387617462922,713
Surrounding built environmentWidth of entrance road (m)7.144.97173
Water body (dummy) ****0.0370.18901
Green space (dummy) *****0.3390.47301
Population density (person/km2)25,57411,45492365,550
Building density (m2)457.9372.328.221,818
Note. * Concrete structure = 1, others = 0; ** Concrete structure of roof = 1, others = 0; *** Total floor area of each non-residential use/total floor area; **** Presence of water body within 100m = 1; ***** Presence of green space within 100m = 1.
Table 3. Electricity consumption of mixed-use building explained by building and surrounding built environment attributes.
VariablesAverage Monthly Electricity Consumption Increase in Electricity Consumption during Summer
Coef.tVIFCoef.tVIF
Building attributesStructureTotal floor area0.74581.16 ***1.920.68336.92 ***1.89
Age of the building0.0151.391.45−0.093−4.28 ***1.50
Shape index0.1994.97 ***1.050.1491.86 *1.05
Structure−0.126−8.03 ***1.49−0.176−5.51 ***1.48
Roof structure−0.023−1.071.08−0.103−2.43 ***1.08
Building useRestaurant1.33230.08 ***3.062.14524.20 ***3.17
Accommodation0.72015.14 ***2.321.46615.69 ***2.50
Retail0.77917.90 ***4.461.19113.57 ***4.49
Service0.96421.17 ***2.461.55817.14 ***2.46
Office0.52013.29 ***4.470.81210.30 ***4.47
Manufacturing0.2313.03 ***1.300.7464.81 ***1.30
EconomyLand price0.54646.77 ***1.230.69729.56 ***1.24
Surrounding built environmentWidth of entrance road0.0212.81 ***1.070.0171.111.07
Water body−0.032−1.491.010.0220.501.01
Green space−0.037−4.28 ***1.02−0.049−2.80 ***1.02
Population density0.0294.47 ***1.030.0090.701.03
Building density0.0576.77 ***1.270.0271.621.27
Number of Observations22,109 18,584
Adjusted R20.4965 0.2521
Note. *** Significant at 1%; * significant at 10%.
Table 4. Gas consumption of mixed-use building explained by building and surrounding built environment attributes.
VariablesAverage Monthly Gas Consumption Increase in Gas Consumption during Winter
Coef.tVIFCoef.tVIF
Building attributesStructureTotal floor area0.58456.73 ***1.920.62666.49 ***1.91
Age of the building−0.031−2.52 ***1.45−0.065−5.78 ***1.46
Shape index0.2856.34 ***1.050.1423.45 ***1.05
Structure−0.085−4.86 ***1.49−0.049−3.05 ***1.48
Roof structure−0.069−2.90 ***1.08−0.037−1.69 *1.08
Building useRestaurant0.0080.173.06−0.926−20.35 ***3.04
Accommodation0.5159.65 ***2.320.1462.99 ***2.33
Retail−0.489−10.02 ***4.46−0.875−19.62 ***4.46
Service0.1783.48 ***2.46−0.271−5.80 ***2.46
Office−0.457−10.40 ***4.47−0.659−16.43 ***4.47
Manufacturing−0.724−8.43 ***1.3−1.120−14.27 ***1.3
EconomyLand price0.1058.02 ***1.23−0.100−8.36 ***1.23
Surrounding built environmentWidth of entrance road−0.031−3.65 ***1.07−0.027−3.50 ***1.07
Water body0.0240.991.010.0411.83 *1.01
Green space−0.024−2.41 ***1.020.000−0.011.02
Population density−0.052−7.19 ***1.03−0.047−7.06 ***1.03
Building density0.0282.97 ***1.27−0.016−1.89 *1.27
Number of Observations22,109 21,969
Adjusted R20.2616 0.2978
Note. *** Significant at 1%; * significant at 10%.

