Evaluating Renewable Energy Sustainability by Composite Index
by
 , and
, and
Stefan Dragos Cîrstea
1,* ,
,
Calin Moldovan-Teselios
2,
Andreea Cîrstea
3,
Antoniu Claudiu Turcu
1 and
Cosmin Pompei Darab
1 1
Electrical Power Systems and Management Department, Faculty of Electrical Engineering, Technical University of Cluj Napoca, 26-28 Baritiu Street, 400027 Cluj-Napoca, Romania
2
Sociology Department, Faculty of Sociology and Social Work, Babes-Bolyai University, Anghel Saligny Street, 400609 Cluj-Napoca, Romania
3
Accounting and Audit Department, Faculty of Economics and Business Administration, Babes-Bolyai University, 58-60 Theodor Mihaly, 400591 Cluj-Napoca, Romania
*
Author to whom correspondence should be addressed.
Sustainability 2018, 10(3), 811; https://doi.org/10.3390/su10030811
Submission received: 18 February 2018
/
Revised: 5 March 2018
/
Accepted: 5 March 2018
/
Published: 14 March 2018
Abstract
:Renewable energy is a global interest area in achieving sustainable development. Renewable energy sustainability has been assessed using the most commonly used dimensions of this concept: economic, environmental, social, and institutional dimensions. In this paper, we designed a composite index named the Renewable Energy Sustainability Index. The proposed index may represent a national monitoring mechanism that points out the strengths and weaknesses of a state in terms of renewable energy. The data were normalized by calculating the z-score. We tested the proposed index on a selection of 15 European countries ranked by final energy consumption and with different levels of development. The Kayser-Mayer-Olkin values were above the 0.700 limit, which indicates the robustness of each dimension. The proposed index reveals the development stages of renewable energy sustainability and can provide solutions to increase the sustainability of a country by improving positive impact indicators and mitigating negative impact indicators.

1. Introduction
Beginning with Rio+20, the Conference on Sustainable Development, in 2012, a journey toward developing global sustainable development goals was started. One of the first definitions of the concept of sustainable development, which is based on the harmonization of economic development with the need to preserve the environment and solidarity between generations, was given in the Brundtland Report, known as “Our common future.” Sustainable development is defined as the development used to “ensure that it meets the needs of the present without compromising the ability of future generations to meet their own needs” [1].
Regardless of the polemics caused by this definition due to insufficient explanation of the needs and aspirations of the concept, the impact of the report is significant as it highlights issues such as poverty, ecological balance, the need for environmental protection, and the need to harmonize socio-economic and environmental capabilities while avoiding economic, social, and environmental risks and crises.
Sustainability has always represented a complex and multidimensional concept that strives to create a dynamic balance between ecological, social, and economic dimensions, and it is now becoming the challenge of our times [2,3].
In order to respond to this challenge, the Science of Sustainable Development [4,5]—a transdisciplinary science focused on the dynamic relationship between society and nature on a local, regional and global scale—has rapidly strengthened over the past decade, becoming an intellectually courageous action worldwide [4,5,6,7,8]. Providing adequate and reliable energy services at affordable costs in a safe and environmentally friendly manner and in accordance with the needs of social and economic development is an essential element of sustainable development. Energy is vital for eradicating poverty, improving human well-being, and raising living standards.
The 2000 World Energy Assessment publication [9] thoroughly analyzed the relationships between energy, social issues, health, and environment; approaches issues related to energy security, resource availability, end-use efficiency, renewable, and advanced supply technologies; pays particular attention to the fundamental issue of rural energy in developing countries and the role of energy in economic prosperity; and describes energy scenarios for the 21st century.
In September 2015, United Nations (UN) countries adopted a new set of targets to end poverty, protect the planet, and ensure prosperity for all as part of a new sustainable development agenda. Each objective has specific targets to be achieved over the next 15 years. To achieve these goals, each has to make its contribution: governments, the private sector, civil society, and ordinary people. For this reason, the objectives of sustainable development should be targets and challenges for all countries—not what the rich should do for the poor, but what should all countries do for the global well-being of this generation and those who will come after.
Sustainable development is an approach that most frequently refers to the use of renewable energy sources as well as sustainable agriculture and sustainable forestry practices, thus creating a system that can continue indefinitely in the future [10].
Of the 17 objectives for sustainable development, the research will focus only on two of these goals that have a significant impact on the whole of humanity, without minimizing the impact of the other objectives on the development of humanity. These are Goal 7—Ensure access to affordable, reliable, sustainable and modern energy for all—and Goal 13—Take urgent action to combat climate change and its impacts. Even if they approach different segments, the effects they produce are similar. Combating climate change can be achieved much more easily with clean and affordable energy, given that “energy is the main contributor to climate change, accounting for about 60 percent of total global greenhouse gas (GHG) emissions” [11].
Renewable Energy for Sustainable Development
The UN [11] mentions in a brief presentation of Goal 7 that the world must triple its investment in sustainable energy infrastructure per year, from about $400 billion today to $1.25 trillion by 2030. Also, Neves and Leal [12] underlined that energy contributes to meeting human needs and aspirations, the major goal of development. The variety of energy services provided by energy resources is enormous, which leads to increased access to basic commodities that improve human well-being.
Renewable energy has become a highly discussed subject, both in terms of the positive effects it generates and the negative effects it entails. Renewable energy issues have a particular focus on the past decade. A number of researchers have given great importance to the way this segment develops in their own countries [13,14]. Singh [15] attempted to identify factors responsible for the slow development of renewable energy sector in the Pacific Islands and to suggest ways to overcome them. Wang and Li [13] highlighted some feasible measures to solve the problems faced in the development of renewable energy in China and to promote the industrial development of renewable energy in China. They appreciated that most of China’s renewable energy technologies are still in the transition from research and development to industrial production. Regarding the production of renewable energy in the US, Daim et al. [14] show that biomass-based energy production is rising the fastest, followed by geothermal and wind power. In addition, the forecasts for solar energy production are underperforming over the next two decades.
The contribution of renewable energy to energy supply varies by country and region due to the diversified geographic distribution of production, use, and export. From developed countries, widespread acceptance and use of renewable energy are now moving toward developing nations, especially in Asia, including China, India, and so on [16]. China is now one of the largest producers and exporters of solar thermal panels for hot-water production, the largest investor in thermal heating installations, and the third largest producer of bioethanol [17].
The Renewables 2017 Global Status Report [18] points out that, in 2016, there have been a number of trends that have a significant impact on renewable energy, including the continued low global fossil fuel prices, the dramatically decrease of the prices of several technologies in the field of renewable energy, and a continuous increase of attention to energy storage. In terms of employment, in 2016, an increase of 1.1% compared to 2015 was recorded, reaching 9.8 million people employed in this sector. So, in the renewable energy sector, 3.1 million are employed in solar photovoltaic, 1.72 million works in liquid biofuels, 1.52 in large hydropower plants, and 1.16 in wind energy. The heating/cooling and solid biomass sectors contribute only 1.55 million to the total number of employees. Other technologies (biogas, small hydropower, geothermal, and CSP) account for only 0.75 million people [18].
Depending on the production technology, solar, photovoltaic, and biofuels have provided the largest number of jobs. China leads the sector with 40.3% of jobs in the renewable energy sector, followed by the EU with 12.3%, and Brazil with 10.8%.
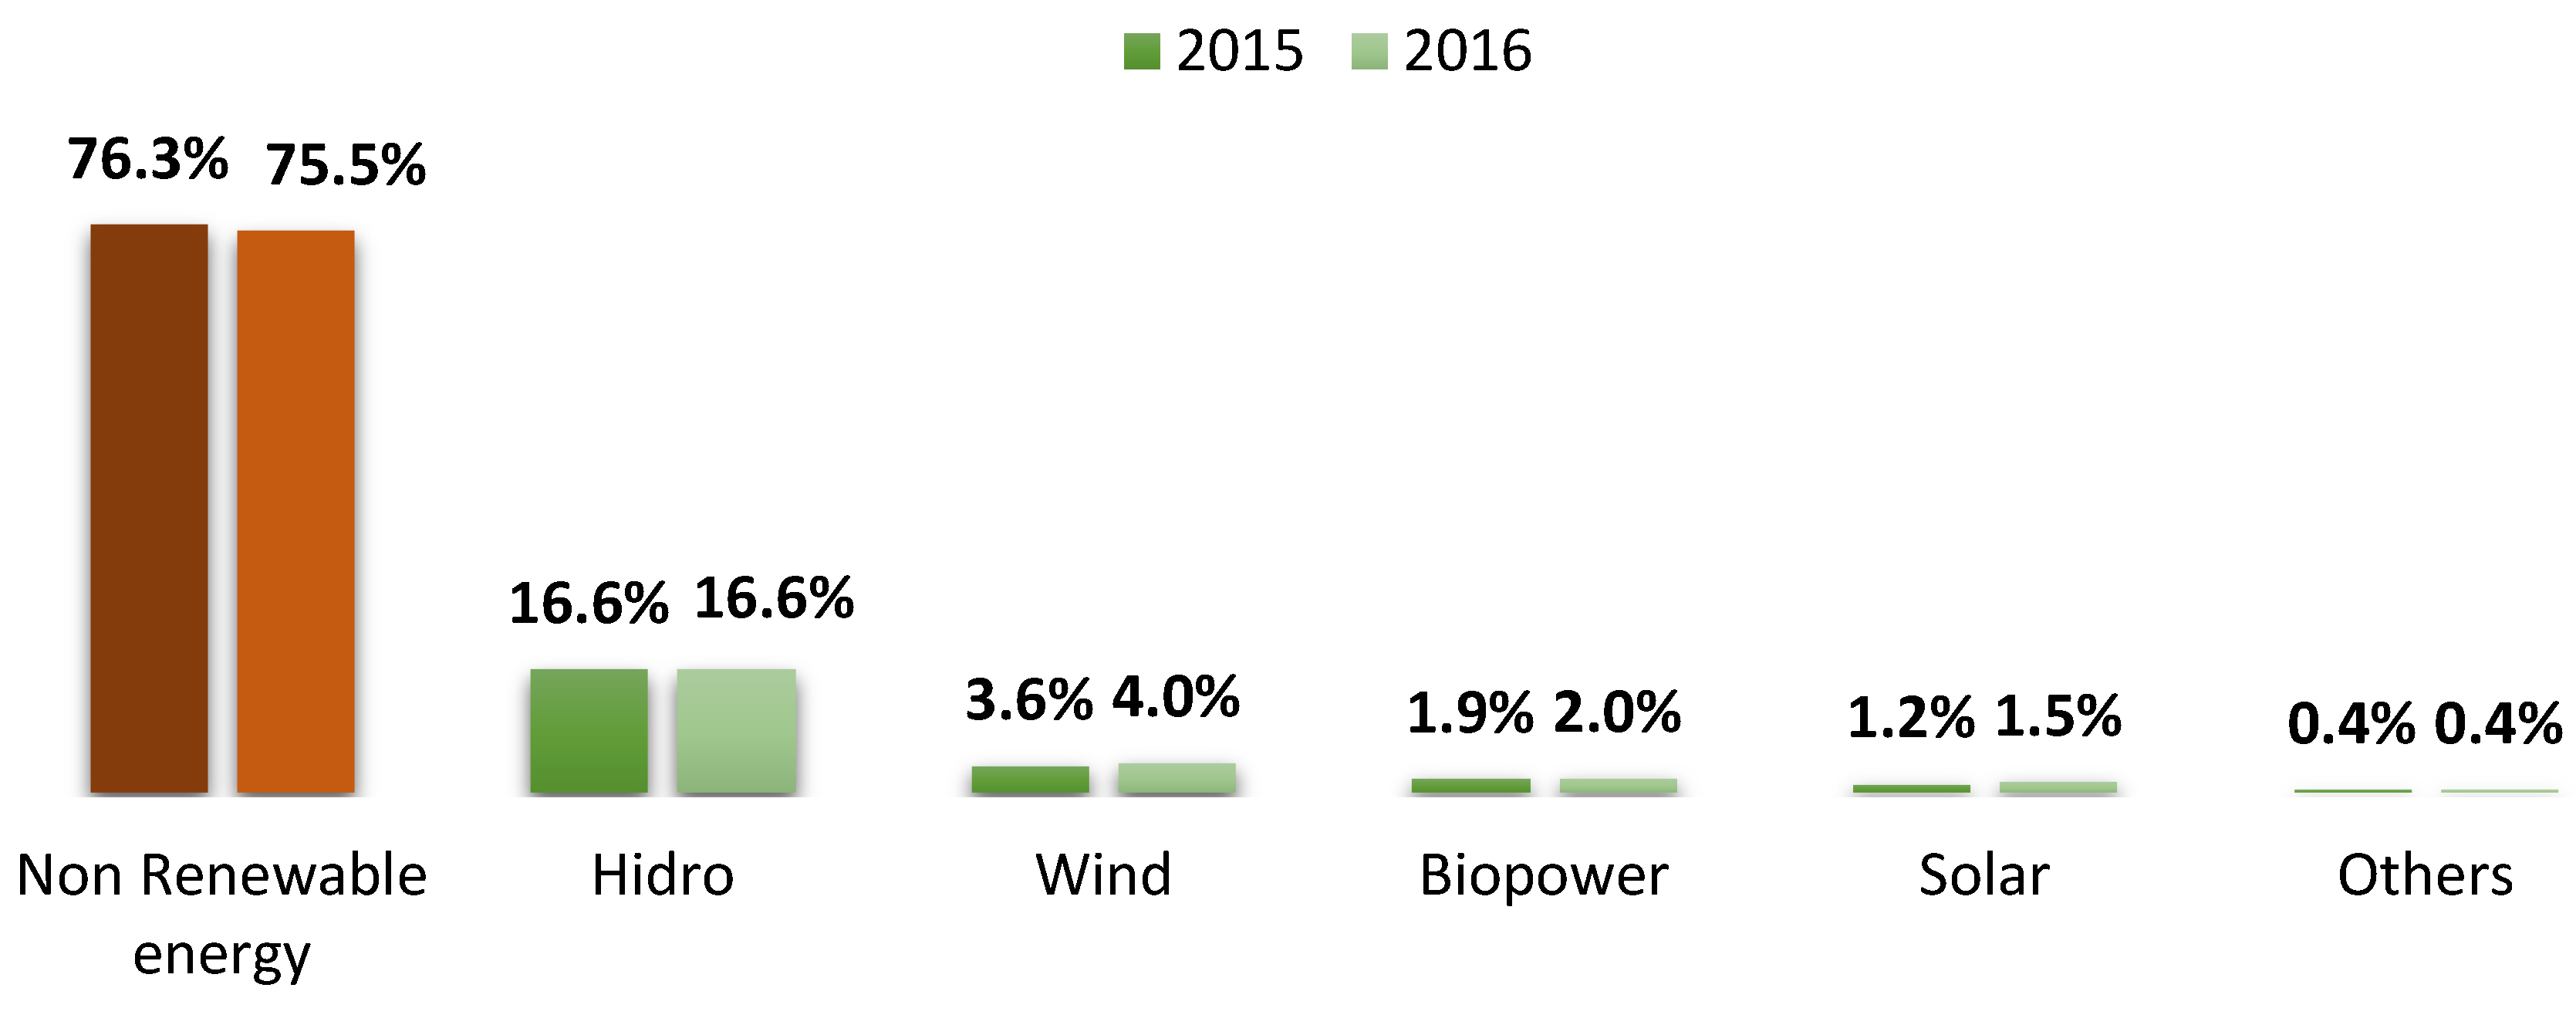
The global renewable energy sector is on an upward trend. The share of renewable energy in total energy production increased from 23.7% in 2015 to 24.5% in 2016.
Also, depending on the technology used, changes in their share in the total renewable energy mix can be observed. The overall growth is based on the increase registered by wind, solar, and biopower energies. Hydro and other technologies maintained the level of 2015 in 2016 (Figure 1).
However, the renewable energy sector faces a number of problems ranging from difficulties in storage to the lack of predictability of investment in this sector. Although there are a lot of analysis tools, many investors are sceptical about addressing different countries or regions.
Renewable energy technologies increase their influence over emerging economies throughout the year. For the third consecutive year, global CO2 emissions from fossil and industrial fuels were almost flat in 2016, mostly due to a worldwide decrease in coal use but also due to improved energy efficiency and increased use of renewable energy. So, replacing fossil fuel-based energy sources with renewable energy sources—which include direct solar energy, wind and ocean energy, bioenergy, geothermal energy, hydropower—would help the world achieve the idea of sustainability. Energy indicators and synthetic indexes could be useful for monitoring progress toward sustainability as well as communicating information to policy makers [19]. However, the issue of index construction has been widely researched in different topics, such as sustainable economic welfare [20], responsible investment [21], sustainability measurement [22], quality of life [23], assessment of air quality [24], and energy sustainability of rural communities [25]. Also, renewable energy was a key sector for designing indexes identified in literature as FFSI [26], AESPI [27], RECAI [28], EPI [29], RERII [21], SSEI [30], and GSI [31].
In the context of the above, we consider it appropriate to create an index that measures the sustainability of renewable energy in each country. The need for an index to measure renewable energy sustainability is driven by the accelerated economic changes in the contemporary period. Given the dynamics of this sector, major interest groups need practical tools to monitor and assess the sector trends. This index is also an important tool in assessing business potential, development directions and practical support in long-term decisions. Creating the index on six factors that build an overview of a country partially removes the possibility that some important aspects of decision-making may be omitted.
2. Building a Renewable Energy Sustainability Index
To capture the complexity of sustainable development, sustainability assessments often require the integration of several indicators to form composite indicators or index [32,33].
From the desire to provide a new analytical tool to the economic environment, we will propose an aggregate indicator in order to ease the decisional problems in this sector. An index for renewable energy is created to measure the sustainability of this sector in a reliable way. At the same time, the main objective of a sustainability index is to provide a comprehensive and scalable architecture based on information on adequate sustainability assessment [34].
Depending on the method of construction and aggregation, a number of features can be identified, such as
- indicator: processing and interpreting of primary data;
- aggregate indicator: combines a number of components (data or sub-indicators) defined in the same measurement units;
- composite indicator: combines various aspects of a phenomenon, based on a concept, sometimes complex, in a single number with a common measure unit;
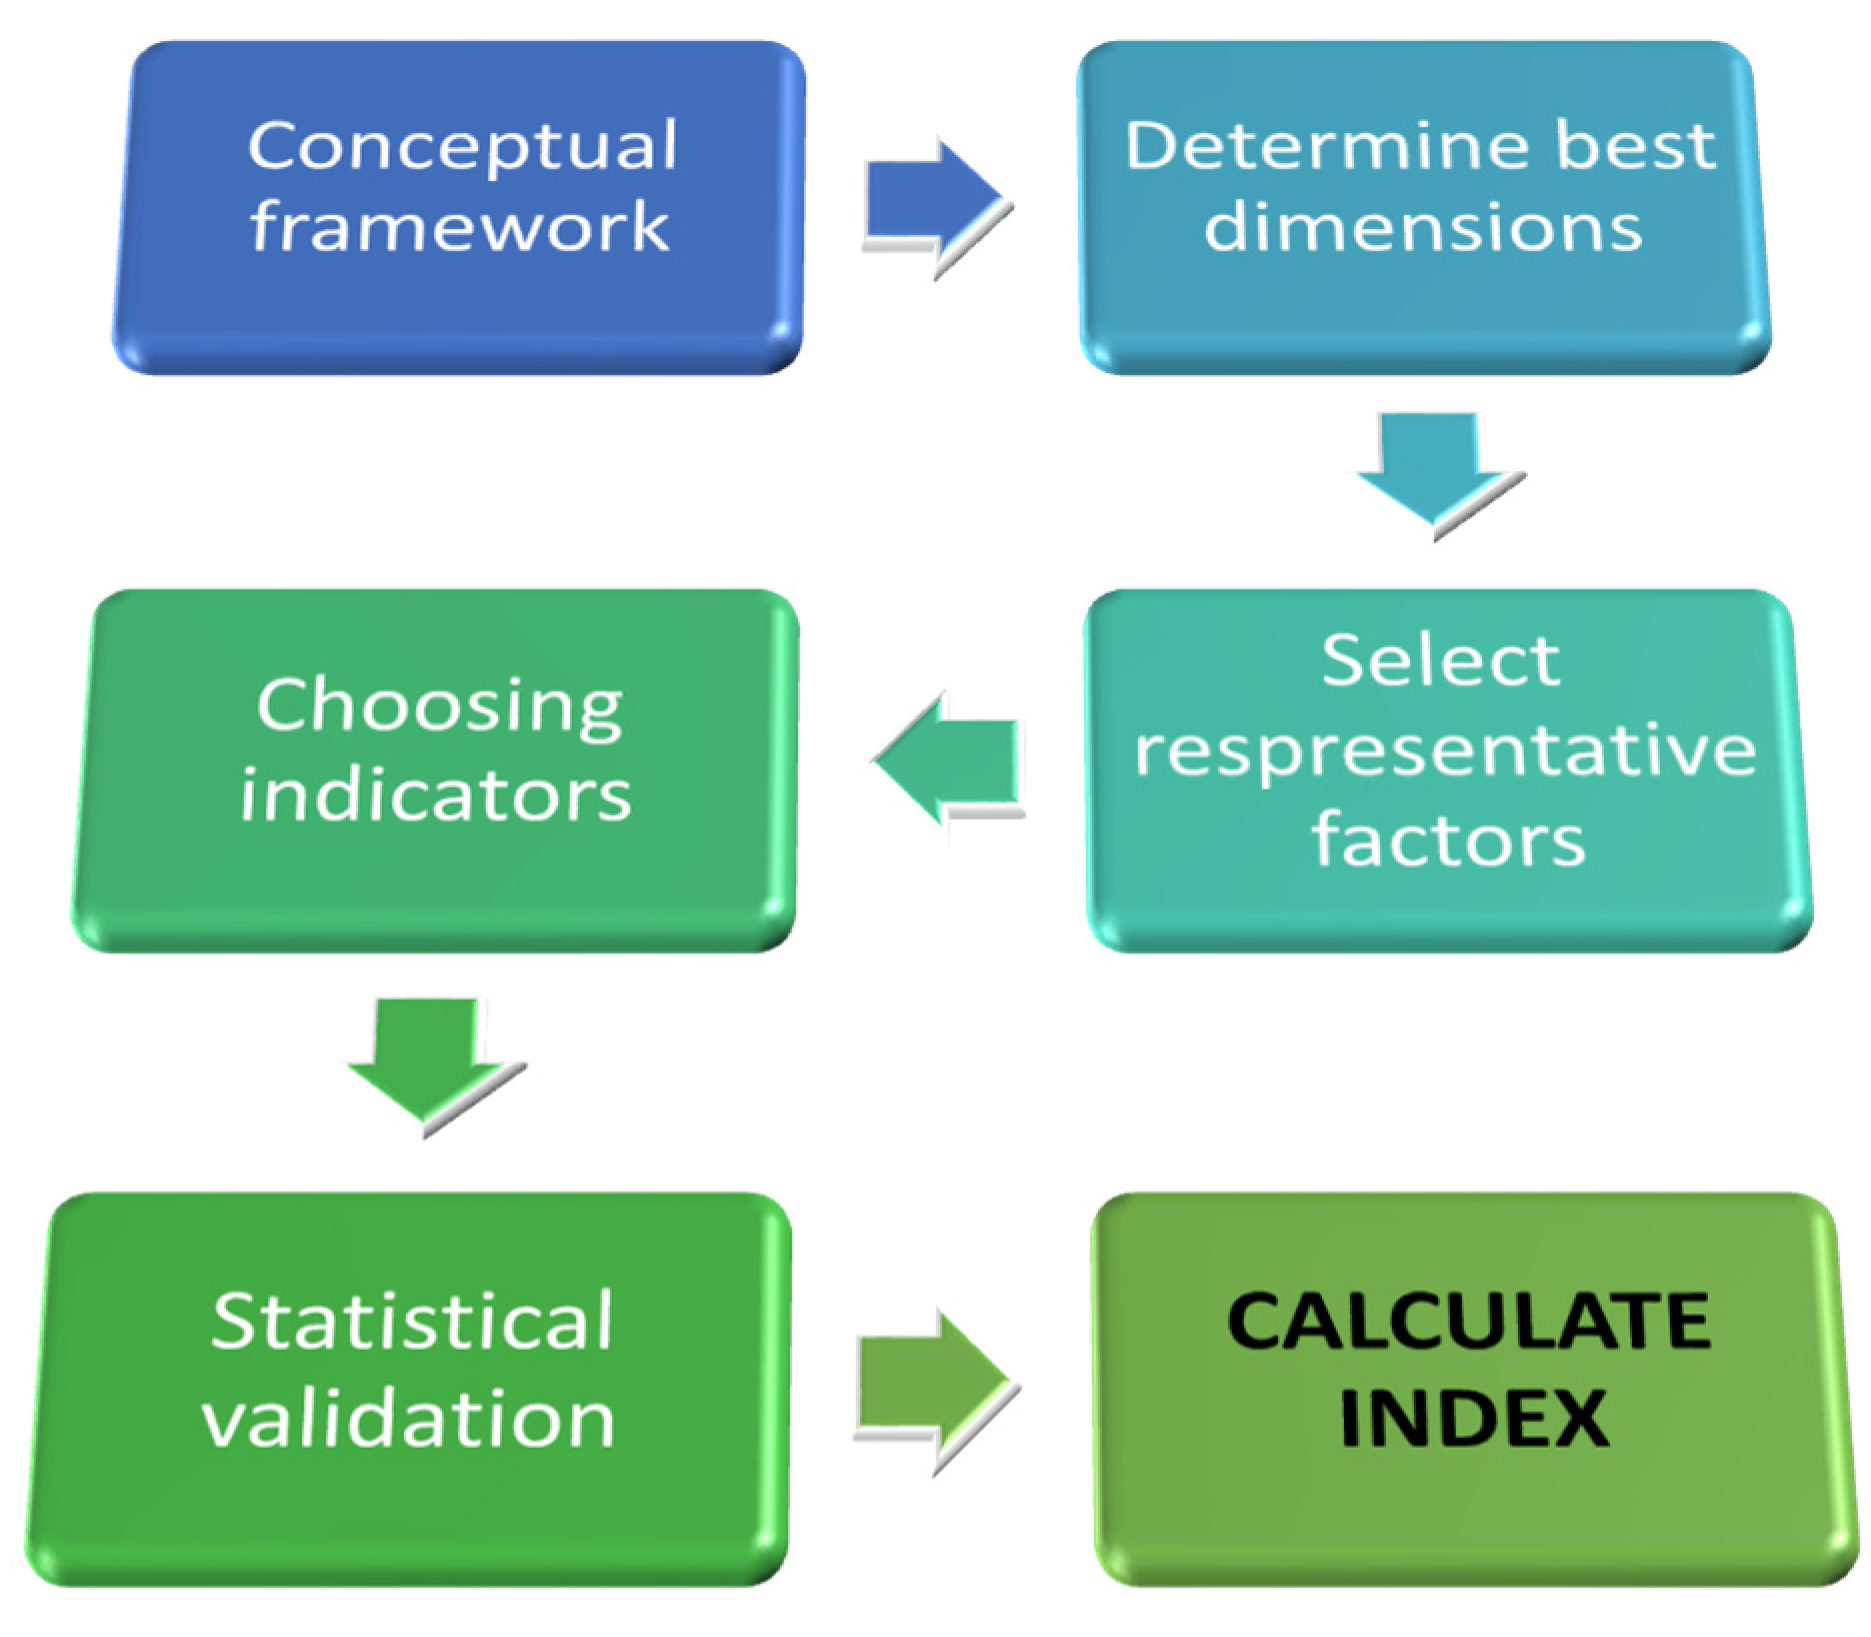
- index: takes the form of a number and requires a data transformation to generate a single value (Figure 2).
In Table 1, we have synthesized a series of indicators of sustainable development within the energy sector identified in the literature.
A composite index is a quantitative or qualitative indicator derived from multidimensional factors that can reveal the relative performance of a country in a particular aspect. Ideally, a composite index is a simple mathematical value by aggregating a series of complex facts [21].
2.1. Determining Dimensions
Sustainable development consists essentially in improving the quality of life in a way that can be sustained, economically and ecologically, in the long run supported by the country's institutional structure (Figure 3 [39,40]).
The first step in shaping the index is to choose the dimensions that the index is based on. Given that a sustainability index must be governed by the principles of sustainable development, Neves and Leal [12] highlights the dimensions that need to be simultaneously met, such as
- Environmental dimension: characterized by reducing the side effects of GHG, sustained impact of renewable energy, environmental sustainability, and quality and variety of resources. The generation, distribution, and use of energy create pressure on the environment in the household, workplace, and community at the national, regional, and global level. By supporting the objective of sustainable development to reduce the environmental impact of energy systems, renewable energy technologies can provide significant benefits in comparison to fossil fuels, especially in terms of GHG emissions.
- Economic dimension: determined by macroeconomic solidity, competitiveness of the renewable energy prices, or the energy performance of the studied units. As IEA highlighted in World Energy Outlook 2008 [40], accelerating economic growth in many developing countries will likely increase global energy demand, which could shorten the lifespan of remaining fossil fuel resources.
- Social dimension: maximizing quality of life, availability of the latest in technology, and innovation. The energy sector has a very high potential for reducing poverty and increasing quality of life. Energy availability has a direct impact on employment, education, demographic transition, indoor pollution, and health opportunities, and has gender and age implications.
- Institutional dimension: increasing transparency in regulation, quality of regulatory acts, political stability, or GDP per capita. Renewable energy policies are taken into account to measure the existence of policies that support, encourage, and enable the development of renewable energy. The most common obstacles to the development of renewable energy are economic and political issues such as high frontier cost, long repayment periods, and large subsidies to the oil and gas industry taxation [41].
These four dimensions form a complete picture both from the perspective of the effects of renewable energy and the sustainability of an economic sector.
2.2. Choosing Representative Indicators
As we have previously shown, Renewable Energy Sustainability Index (RESI) indicators are divided into four dimensions: economic, environmental, social, and institutional. Selecting indicators in order to provide a complete picture is a challenge because there are a substantial number of potential indicators, and each indicator is just an abstraction that reflects a partial story [42]. As a result, selecting a marker always creates a dilemma.
Several specific criteria for the selection and evaluation of sustainability indicators have been frequently discussed in the literature [34,43,44,45]. Meadows [33] states that “indicators arise from values and they create values,” mentioning the “scientific credibility” and “political credibility,” while Hak et al. [34] speaks of “scientific relevance” and “public relevance” of sustainable indicators. At the same time, the search for adequate and effective indicators of sustainability is an evolutionary and learning process [43]. The most effective sustainability measures are often highly aggregated indices that are easy to understand and directly related to the environment and human well-being [44]. Indicators need to be clear and unambiguous; clarity of purpose and audience will instruct indicator clarity [45]. Lee & Zhong [21] list the main features that indicators should have: relevancy, accuracy, timeliness, accessibility, and coherence.
Sustainability indicators are indicators that provide information on the state, dynamics, and basic guiding forces of human and environmental systems. Generally, indicators become indicators of sustainability (or unsustainability) when size, boundaries, or time targets are associated with them [43].
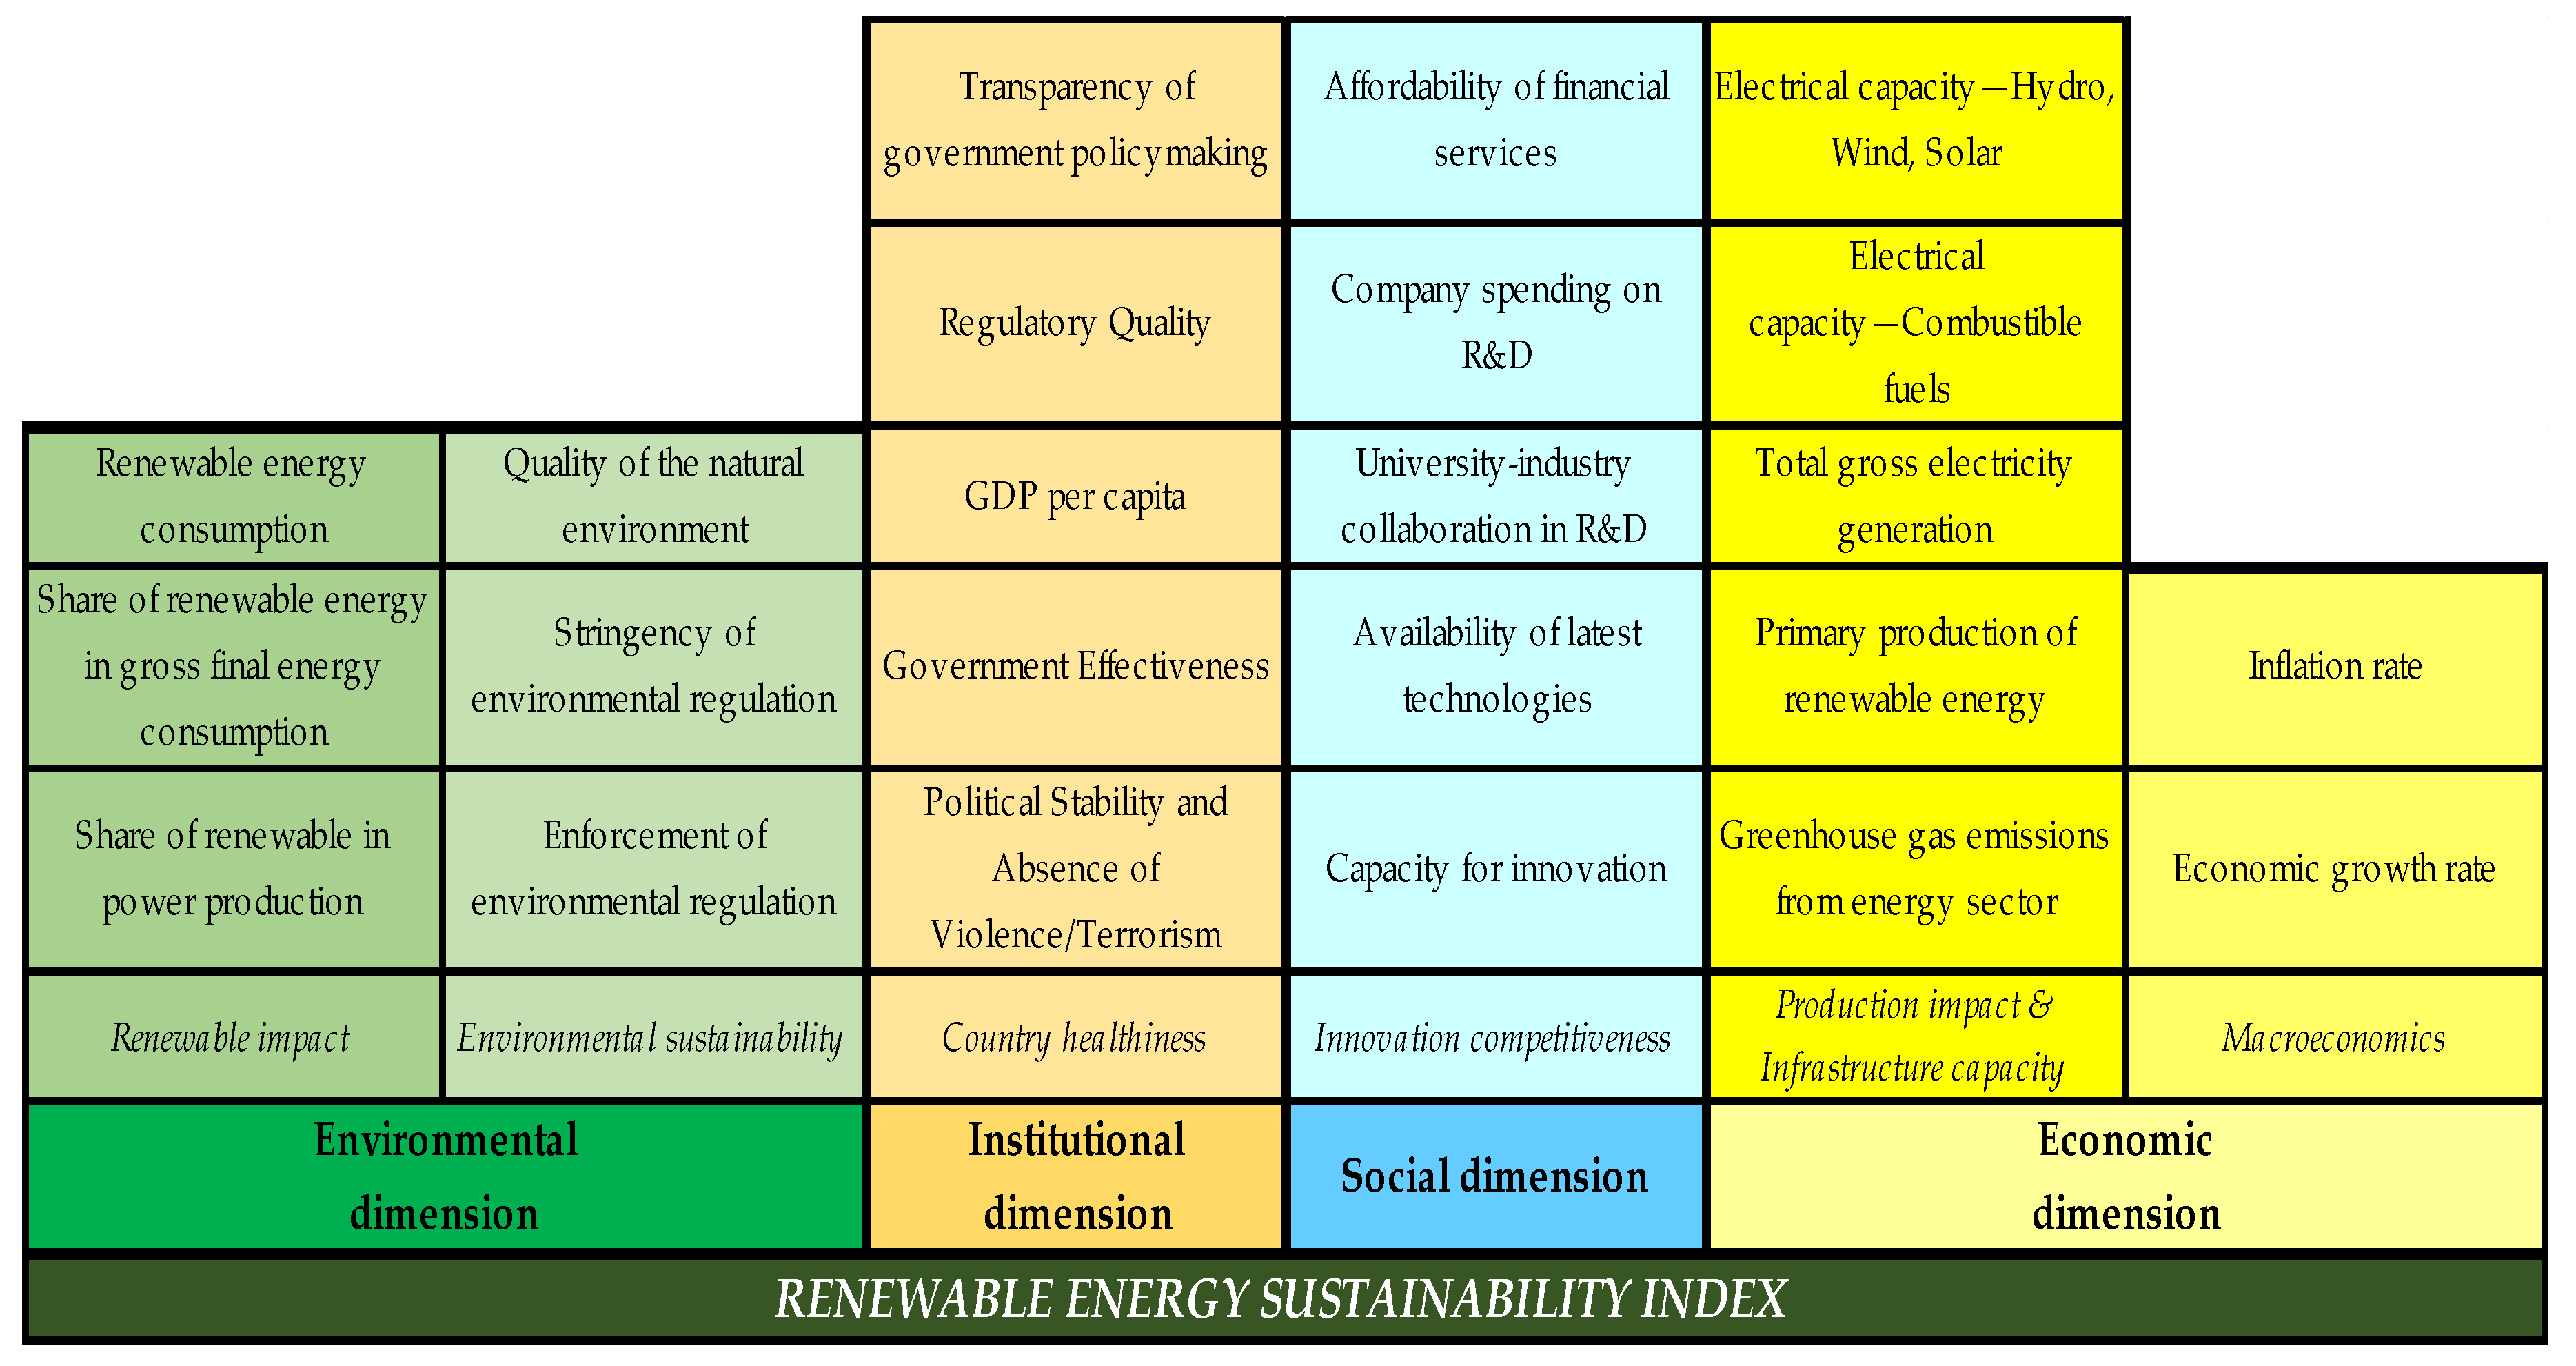
In Table 2, we highlight how the proposed index is constructed on the four fundamental dimensions and that are the specific indicators for each dimension and constituent factor.
With the six constructed factors, we get an overview of the sustainability of renewable energy in the country (Figure 4). Each of these factors approaches important issues for each dimension.
Renewable impact—this factor shows the influence of renewable energy both on consumption and production. At the same time, economic growth has a positive effect on the consumption of renewable energy. In recent years, we can see a declining pattern for traditional energies and a moderate increase in renewable energy consumption.
Environmental sustainability—reflects the ability of society to improve its environmental performance over time. In our paper, we include factors such as the quality of the natural environment, the string of environmental regulations, or the application of environmental regulations. Through such indicators, we want to measure how the country is trying to increase the environmental sustainability capacity.
Country healthiness—measures the stability of that country, the ability of the government to formulate and implement effective regulatory policies, and the relative performance of countries through indicators such as government efficiency, quality of regulations, or GDP per capita.
Innovation competitiveness—identifies the extent to which a particular country is inclined toward innovation and how innovation is approached. Indicators such as the capacity to innovate, university-industry collaboration in R&D, or the availability of the latest technologies create a complete picture of a country in terms of competitiveness of this segment.
Production impact and infrastructure capacity—establish storage capacities as well as the concern for renewable energy production. One of the main challenges of the future is how countries will store the energy they produce to become energy-independent. Also, this factor measures the impact that renewable energy production and storage infrastructure create on the environment. This impact is assessed by the GHG produced by the energy sector.
Macroeconomics—are designed to complete a country’s overall sustainability by two indicators—economic growth rate and inflation rate—used in the literature for the construction of year index. They also assess the economic security of a country, as well as its future development trends.
A single sustainability indicator defines a key issue that characterizes a certain aspect of sustainability in the observed system. Sustainability indicators capture the complexity and order of systems and provide new knowledge about the system that can be communicated to the general public [30]. Each of the 23 indicators, selected for the proposed model, has an impact on the index. The impact of each indicator is shown in Table 3.
Any increase of the positive impact indicators will determine an increase of RESI, while any growth of negative impact indicators will lead to a decrease of RESI. GHG produced by the energy sector are an indicator whose growth leads to a significant decrease of the index.
3. Research Methodology
Creating an index involves a complex activity, staged in a set of steps that begins with a conceptual deconstruction of what we want to represent in that index. Practically, the operationalization of the quantified subject implies the identification of the dimensions that define it and the indicators that represent them, developing a complex conceptual framework based on the specialized literature. This framework is intended to provide information later used in the hierarchy of the entities to which this index is assigned in monitoring the evolution of this hierarchy, in decision making, and in benchmarking [21].
Once this step has been achieved, indicators are selected in relation to certain key conditions [31].
- Relevance. The relevant indicators for the identified dimensions are selected; indicators that better explain the variance of those dimensions.
- Reliability. Indicators are selected carefully after well-defined methodologies, which have not changed significantly over time and that are reliable and provide data with high accuracy.
- Accessibility. Indicators that are accessible, measured in the longest time series, and that can provide continuity in the further development of the index are selected.
It is also important, in the preliminary stages of the design of an index, to define a period of time for which to select the data, a period to be covered by all the included indicators. Once the relevant indicators have been selected for each dimension, the data can be extracted and eventually computed (in the case of indicators involving such a procedure). The different periodicity of the measurement of certain indicators (biannual, annual, multiannual) is a particular issue that should be taken into account. This aspect usually derives from the use of a larger number of data sources, which can usually be corrected by calculating estimated averages or values of regression equations for uncovered periods.
Once a complete, clean data set is obtained, an analysis procedure for each indicator follows by calculating the average and dispersion values and identifying the outliers of those values that deviate greatly from a normal distribution. The analysis of the outliers involves reviewing certain situations and identifying the explanatory factors that have led to values beyond the expected range of variation. Subsequent to this stage, a multivariate data analysis is performed to evaluate the structure of the database and make some methodological selections for weighting and aggregation [21]. Also, the analysis of the correlation between the various indicators can reduce redundancy and provide a simplified model with relatively similar explanatory power [46].
Data normalization is the final step in data preparation. Since the construction of an index involves aggregating data with different units of measure, their dimensionless, removing these measure units will allow them to compare each input's contribution to the final model. Normalization also identifies how certain indicators correlate positively or negatively with the index which is going to be calculated [47]. Typically used methods include ranking, standardization (z-score calculation), re-scaling or min-max normalization, and indicization (index number transformation or “distance: to a reference).
Following the normalization, the data aggregation step follows, which involves the selection of an appropriate aggregation method, depending on the characteristics of the indicators, the way they are compared, or the weighting method. Ideal computing models of the indexes suppose the simple mathematical aggregation of a data set. In reality, each dimension plays a different role in the final construction of the index and, as such, has a different weight in aggregation. Weighing data can generally be done in three great ways [48].
- -
- equal weight, where each dimension or indicator having the same weight in the index calculation;
- -
- statistically determined weighting, through various statistical procedures, each dimension or indicator having a specific weight in the index calculation;
- -
- weighting based on the opinion and valuations of experts, their experience, which also assigns different weights to data used in the construction of the index.
Data aggregation methods are usually performed in relation to the type of indicators used. For the compensatory indicators (those indicators that can offset each other, substitutable, whose deficit may be covered by other indicators [47]), the aggregation methods are additive type (e.g., mathematical average) or, sometimes, multiplicative, non-linear one (e.g., geometric mean). For non-compensatory indicators (those whose deficit is not offset by other indicators), the multicriteria analysis is used. Aggregation methods can also be simple, based on simple mathematical functions or complex ones, based on a set of complicated computation procedures such as Factor Analysis—Principal Component Analysis (FA-PCA). Once data is aggregated in order to assess the robustness of the composite index, an uncertainty analysis and a sensitivity analysis is performed [21].
The last step was to test the robustness of the index. In order to analyze the robustness of the index, a method of analyzing the ranking variation was used in order to obtain an image of the stability of the index over time. The smaller the rank variation is, even in the context of a significant variation in the indicators value, the more stable is the index. Also, the index calculation method is a robust one, resistant to the annual changes in main indicators values. We used the Lee and Zhong index robustness calculation formula [21].
where:
Shiftassumptioni—average shift due to assumption I n—total number of countries
Rankoriginal(c)—Original rank of country c Ranknew(c)—New rank of country c
To test the proposed model, we used a sample of the top 15 European countries ranked by final energy consumption at the end of 2016 (Table 4). Final energy consumption measures the total energy demand of a country, excluding any non-energy use of energy carriers (e.g., natural gas used not for combustion but for the production of chemicals). This indicator only covers energy consumed by end-users such as industry, transport, households, services, and agriculture but excludes energy consumption of the energy sector itself and losses occurring during energy transformation and distribution [49].
Index Statistical Validation
The proposed renewable energy sustainability index model has been designed starting from a set of four major dimensions (Economic, Environment, Social, and Institutional) containing 23 indicators during a period of three years (2013–2015). After extracting the data from the above-mentioned sources, the data set was cleared and then normalized by the z-score calculation.
where μ is the mean of the population and σ is the standard deviation of the population.
After the standardization of the scores for all 23 indicators, using FA-PCA, the aggregation modes of the indicators in the six factors were analyzed, as shown in Table 5. The Kayser-Mayer-Olkin (KMO) values were above the 0.700 limit, which indicates the robustness of each dimension.
The above-mentioned data indicates the robustness and suitability of each factor.
Once the six factors were obtained, we reapplied the FA-PCA, including them into the analysis in order to obtain a factor that is later converted to the index. The KMO values for the three-year models were in two out of three cases, above the threshold of 0.7, indicating a good suitability for the designed index (Table 6).
Each factor weight in the construction of the index, as well as the positive or negative contribution of the data, is shown in Table 7. We note good data stability over the three years.
Transforming these weights into a factor with values from 0 to 100 was done by re-scaling, reporting to the absolute minimum and maximum values.
where xi is the range of values, with minimum ( and maximum (, and absolute minimum ( and absolute maximum ( are the extreme values that indicators can take.
4. Results and Discussion
At the level of 2013, Norway is first in the ranking of the sustainability index of renewable energy with a score of 66. This score was determined by the high values obtained from factors such as country healthiness (91), environmental sustainability (86), and innovation competitiveness (77). Hydro, wind, and solar electrical capacity (30GW), primary production of renewable energy, quality of natural environment, and share of renewable in power production (98.1%) make Norway an example to follow in terms of sustainability of renewable energy and economic development. The ranking is completed by Finland (65) and Sweden (64) (Table 8).
If, for Finland, the factors that guarantee its success are identical to those of Norway (Table 9), in the case of Sweden, we can notice the score obtained for the Renewable Energy Impact (55). Finland remarks for its environmental sustainability generated by the quality of the natural environment (6.6) and enforcement of environmental regulation (6.4). As shown in the Travel & Tourism Competitiveness Reports issued by the World Economic Forum, Finland, many years consecutively, is ranked first worldwide regarding the enforcement of environmental regulation. Sweden follows the pattern of Nordic countries in terms of sustainability and renewable energy. The sustainability of renewable energy of Sweden is strengthened by a 0 inflation rate and 1.24 economic growth rate. All three countries mentioned above have an excellent Availability of latest technologies and a very good university–industry collaboration in R&D.
Romania (23) and Turkey (18) are the last ranked. For Romania, the strength is innovation competitiveness (53), and the weakness is production impact and infrastructure capacity (6). Turkey’s strength is macroeconomics (80), and its weakness is country healthiness (9).
For the year 2013, the strength factors of the analyzed countries are environmental sustainability, country healthiness, and innovation competitiveness, and the weak factor for more than 2/3 of the states is production impact and infrastructure capacity. Norway, Sweden, and Austria paid special attention to the renewable impact. There are some countries that were remarkable for their environmental sustainability (Finland, Austria, Germany, Sweden, Norway, and the Netherlands), which obtain scores above 80.
We can observe that innovation competitiveness was a key factor for all the analyzed countries. In case of this factor, at the top of the ranking, we find Finland (86), Sweden (80), and Germany (80), and at the end ranks, we find Italy (57), Poland (54), and Romania (53).
From an institutional perspective, Turkey and Romania are ranked at the bottom of the standings. In the case of Turkey, the low score is based on its average transparency of government policymaking and its very low political stability and absence of violence/terrorism. For Romania, the indicators that affect country healthiness are a weak transparency of government policymaking and a very low GDP per capita.
From a social perspective, a weak score is obtained by Romania and Poland. In both countries, the weak indicator is company spending on R&D. The highest score was obtained for availability of latest technologies (4.6) in case of Romania and for affordability of financial services (4.8) in case of Poland.
For 2014, the order of the first three remains unchanged, but the index has decreased for Norway to 65 and Sweden to 61 (Table 10). This decline is due to the slight changes in country healthiness both in Norway and Sweden. This change is mainly due to the decrease in GDP for the two countries. In terms of renewable impact, Norway increases its share of renewable energy in gross final energy consumption from 66.7 in 2013 to 69.4 in 2014 and maintains almost unchanged renewable energy consumption and share of renewables in power production. One of the reasons that led to the decline of the index was a very light decrease of environmental sustainability.
Romania records an increase of the index from 23 in 2013 up to 27 in 2014. Main improvements were identified in renewable impact based on the increase of all three indicators that compose the factor. Romania had a slight increase of renewable energy consumption (23.09 → 24.34), of share of renewable energy in gross final energy consumption (23.9 → 24.8), and it had a significant increase in share of renewables in power production (25.7 → 34.8). At the bottom of the ranking, Italy (33) goes ahead Poland, whose RESI drops from 34 to 33. Italy’s improvement in the score was driven both by the decrease of the inflation rate from 1.2 in 2013 to 0.2 in 2014 and by the changes of economic growth rate that increased from −1.73 in 2013 to 0.11 in 2014 (Table 11).
Referring to the year 2014, we observed a high decrease of country healthiness, 13 out of 15 countries registered an average reduction of 2 points for this factor. Also, macroeconomics had a small decrease for 10 out of 15 states. Sweden was the only country that had a slight drop of renewable impact. All the other countries recorded a slight increase of this factor.
Also, we can outline a light degradation of Environmental Sustainability. For this factor, only Italy (+1), Romania (+4), and Turkey (+2) recorded an increase. Finland, Austria, Germany, and Sweden maintained their high rankings. At the level of the year 2014, Romania (−16) had a strong fall of macroeconomics, while Czech Republic (+8) and Sweden (+6) improved in that factor. These changes of macroeconomics were caused by the slowdown of the economic growth for Romania and by the increase of the economic growth rate for Czech Republic and Sweden. In the case of Sweden, it is important to underline the transition from inflation to deflation.
All the countries, except Turkey, had recorded an increase of their renewable impact in 2014. The increase of renewable energy consumption varies between 1.2% in case of Poland and 23.6% in case of the UK. The increase of share of renewable energy in gross final energy consumption was between 0.9% in case of Poland to 24.6% in case of the UK.
Another factor that had a positive trend was innovation competitiveness. Capacity for innovation and company spending on R&D were the indicators that sustain this increase. University–industry collaboration in R&D and affordability of financial services remain unchanged, except in Finland, where the latter decreased.
Likewise, the increasing trend of production impact and infrastructure capacity for all countries in the year 2014 should be remarked upon. Important improvements of electrical capacity—hydro, wind, solar can be highlighted in case of the UK (+24%) and the Netherlands (+14%). Also, almost all the countries continue to mitigate GHG emissions. For example, France reduces its GHG emission by 9%, while Spain did so by just 0.4%.
The year 2015 comes with RESI declines in most of the studied countries. The only countries that recorded index increases were Romania and Italy (Table 12). The drop in scores was determined, for more than half of the countries, by a decline in country healthiness. Also, macroeconomics was the second factor that recorded a small diminution. This drop was caused by the reduction of GDP per capita for all selected countries with percentages between 5.3% in case of the UK up to 23.2% in case of Norway. In case of Turkey, we can be observe a 24% fall of political stability and absence of violence/terrorism. The other two countries that had important variations of the political stability and absence of violence/terrorism were Germany and France. The main reasons of this decrease could be the terrorist attacks and the refugees’ problem.
In the cases of Romania and Italy, the index growth is due to the slight improvement in renewable impact, environmental sustainability, and country healthiness.
Between 2013 and 2015, the greatest increase in RESI was recorded by Romania from 23 in 2013 to 28 in 2015. The highest RESI decrease was in Sweden, which reached a score of 56 in 2015, starting from 64 in 2013. Slight decreases (−1) were registered by Spain and the United Kingdom. In the case of the other studied countries, there were no major changes of the ranking positions.
For the UK, we can also remark a decline in macroeconomics as compared to 2014 driven by a decline in economic growth from 3.07 to 2.19 (Table 13).
The biggest drop of country healthiness was that of Finland from 81 in 2014 to 59 in 2015, a decline determined by the decrease of GDP of almost 15% and the decrease in political stability and the absence of violence/terrorism by about 10% (Table 13).
All the results presented in the section come to demonstrate the contribution of the studied countries in the achievement of sustainable development goals and targets. Efforts are often related to economic and financial capacity of the country and the availability of resources to accomplish the goals set by national and international strategies.
It is important to underline that the existing trend in the renewable energy sector can have a significant effect on the achievement of specific objectives, both for GHG reduction or mitigating climate change, as well as for clean, affordable, sustainable, and modern energy
Robustness Test
The robustness of the index was also measured by analyzing the ranking of the 15 states [21]. Thus, for every two consecutive years, the absolute differences of ranking were measured and then the average for all 15 states was computed. As can be seen in Table 14, between consecutive years, only four of the 15 states have changed their rank, and in the two-year variation, only six states out of 15 have changed their position in the rankings. In all cases, there are no larger variations of a position, which means that the index does not induce major ranking distortions.
Ranking variation is low, being below 0.500, which indicates good index stability over time. Of course, computing it in extenso, for a larger number of states, will allow us to better test its robustness.
5. Conclusions
In our paper, a framework was built in order to develop an index of renewable energy sustainability. The aim of this index is to provide a reference tool for responsible investors in the renewable energy sector to proactively and effectively determine investment decisions. RESI provides comprehensive information on the past and current state of the economic, environmental, social, and institutional aspects of different countries with different levels of development.
The proposed index may represent a nationwide monitoring mechanism that points out the strengths and weaknesses of a state from the renewable energy sustainability point of view. It can provide solutions to increase the sustainability of a country by improving positive impact indicators and mitigating negative impact indicators. It also indicates the level of development of the renewable energy sector and can help attract new investments in this sector, creating a competitive field between states.
At the same time, the ranking reveals the European countries with high sustainability in terms of renewable energy and the countries that are making progress in this area. Norway, Finland, and Sweden have proven significant results in obtaining long-term sustainability, being considered as main performers in renewable energy sustainability. From a renewable impact perspective, significant scores were obtained by Norway (74), Sweden (55), and Austria (48). Regarding innovation competitiveness, besides Finland (84) and Sweden (82), the contribution of Germany (80) and the UK (80) can be underlined. Environmental sustainability is a key factor for Finland (91), Austria (90), Norway (87), and Germany (80).
Even though most of the studied countries registered RESI declines, at factor level, we were able to see slight increases in the factors with significant weight in the evaluation of the renewable energy sustainability. Apart from Turkey, in all other countries, we noticed that the renewable impact has continuous growth, which indicates the awareness of the concept of sustainable development and the transition toward renewable energies. Also, we observed that more than 90% of the analyzed countries are concerned about innovation competitiveness. At the same time, we noticed that most states are still deficient in impact of production and storage infrastructure capacity, only four of them having improved this factor.
From an investment point of view, the data reflects that although country healthiness is in a slight decline due to geopolitical volatility and global situation, the renewable energy sector is reconfirmed as a good economic segment for long-term investment. In conjunction with the results for renewable impact and innovation competitiveness, the investment decisions in the renewable energy sector are recommended directions for the future. Innovation competitiveness was a key factor for all the analyzed countries. In case of this factor, at the top of the ranking, we find Finland (86), Sweden (80), and Germany (80)
The research conducted highlights a positive trend concerning the contribution of renewable energy sector in achieving sustainable development goals such as ensure access to affordable, reliable, sustainable, and modern energy for all or combating climate change and its impacts for humanity.
As future perspectives of the research, the number of studied countries can be enriched. The inclusion of new countries may lead to the discovery of certain patterns of the approach of renewable energy sustainability.
Author Contributions
Stefan Cîrstea proposed the initial idea, conceived and designed the research, constructed the index, select the indicators, participate to data analysis and made the revision; Calin Moldovan-Teselios built the research methodology and made the statistical tests and interpretation; Andreea Cîrstea conducted the literature review, was responsible for the overall writing process and made the revision; Antoniu Turcu and Cosmin Darab performed data collection.
Conflicts of Interest
The authors declare no conflict of interest.
References
- Brundtland, G. Our Common Future; Report of the World Commission on Sustainable Development; United Nations: Geneva, Switzerland, 1987. [Google Scholar]
- Sachs, J.D. The Age of Sustainable Development; Columbia University Press: New York, NY, USA, 2015. [Google Scholar]
- Wu, J. Landscape sustainability science: Ecosystem services and human well-being in changing landscapes. Landsc. Ecol. 2013, 28, 999–1023. [Google Scholar] [CrossRef]
- National Research Council (NRC). Our Common Journey: A Transition toward Sustainability; National Academy Press: Washington, DC, USA, 1999. [Google Scholar]
- Kates, R.W.; Clark, W.C.; Corell, R.; Hall, J.M.; Jaeger, C.C.; Lowe, I.; McCarthy, J.J.; Schellnhuber, H.J.; Bolin, B.; Dickson, N.M.; et al. Sustainability science. Science 2001, 292, 641–642. [Google Scholar] [CrossRef] [PubMed]
- Clark, W.C.; Dickson, N.M. Sustainability science: The emerging research program. Proc. Natl. Acad. Sci. USA 2003, 100, 8059–8061. [Google Scholar] [CrossRef] [PubMed]
- Bettencourt, L.M.A.; Kaur, J. Evolution and structure of sustainability science. Proc. Natl. Acad. Sci. USA 2011, 108, 19540–19545. [Google Scholar] [CrossRef] [PubMed]
- Kates, R.W. What kind of a science is sustainability science? Proc. Natl. Acad. Sci. USA 2011, 108, 19449–19450. [Google Scholar] [CrossRef] [PubMed]
- United Nations Development Programme; United Nations Department of Economic and Social Affairs; World Energy Council. World Energy Assessment—Energy and the Challenge of Sustainability; UNDP: New York, NY, USA, 2000. [Google Scholar]
- United Nations Environment Programme. Towards A Green Economy. Path-Way to Sustainable Development and Poverty Eradication; United Nations: New York, NY, USA, 2011. [Google Scholar]
- United Nations (UN). Transforming Our World: The 2030 Agenda for Sustainable Development; United Nations: New York, NY, USA, 2015. [Google Scholar]
- Neves, A.R.; Leal, V. Energy sustainability indicators for local energy planning: Review of current practices and derivation of a new framework. Renew. Sustain. Energy Rev. 2010, 14, 2723–2735. [Google Scholar] [CrossRef]
- Wang, Z.; Li, J. China’s renewable energy development. Int. J. Energy Sect. Manag. 2009, 3, 50–61. [Google Scholar] [CrossRef]
- Daim, T.; Harell, G.; Hogaboam, L. Forecasting renewable energy production in the US. Foresight 2012, 14, 225–241. [Google Scholar] [CrossRef]
- Singh, A. Renewable energy in the Pacific Island countries: Resources, policies and issues. Manag. Environ. Qual. Int. J. 2012, 23, 254–263. [Google Scholar] [CrossRef]
- Verbruggen, A.; Fischedick, M.; Moomaw, W.; Weir, T.; Nadai, A.; Nilsson, L.J.; Nyboe, R.J.; Sathaye, J. Renewable energy costs, potentials, barriers: Conceptual issues. Energy Policy 2010, 38, 850–861. [Google Scholar] [CrossRef]
- REN21. Renewables Global Status Report: 2009 Update; Renewable Energy Policy Network for the 21st Century Secretariat: Paris, France, 2009. [Google Scholar]
- REN21. Renewables 2017 Global Status Report; REN21 Secretariat: Paris, France, 2017. [Google Scholar]
- García-Álvarez, M.T.; Moreno, B.; Soares, I. Analyzing the sustainable energy development in the EU-15 by an aggregated synthetic index. Ecol. Indic. 2016, 60, 996–1007. [Google Scholar] [CrossRef]
- Menegaki, A.N.; Marques, A.C.; Fuinhas, J.A. Redefining the energy-growth nexus with an index for Sustainable Economic Welfare in Europe. Energy 2017, 141, 1254–1268. [Google Scholar] [CrossRef]
- Lee, C.W.; Zhong, J. Construction of a responsible investment composite index for renewable energy industry. Renew. Sustain. Energy Rev. 2015, 51, 288–303. [Google Scholar] [CrossRef]
- Imberger, J.; Mamouni, E.A.D.; Anderson, J.; Ng, M.L.; Nicol, S.; Veale, A. The index of sustainable functionality: A new adaptive, multicriteria measurement of sustainability? Application to Western Australia. Int. J. Environ. Sustain. Dev. 2007, 6, 323–355. [Google Scholar] [CrossRef]
- Mederly, P.; Novacek, P.; Topercer, J. Sustainable development assessment: Quality and sustainability of life indicators at global, national and regional level. Foresight 2003, 5, 42–49. [Google Scholar] [CrossRef]
- Palit, D.; Kar, D.; Misra, P.; Banerjee, A. Assessment of air quality using several bio monitors of selected sites of Durgapur, Burdwan district by air pollution tolerance index approach. Indian J. Sci. Res. 2013, 1, 149–152. [Google Scholar]
- Doukas, H.; Papadopoulou, A.; Savvakis, N.; Tsoutsos, T.; Psarras, J. Assessing energy sustainability of rural communities using Principal Component Analysis. Renew. Sustain. Energy Rev. 2012, 16, 1949–1957. [Google Scholar] [CrossRef]
- Ediger, V.Ş.; Hoşgör, E.; Sürmeli, A.N.; Tatlıdil, H. Fossil fuel sustainability index: An application of resource management. Energy Policy 2007, 35, 2969–2977. [Google Scholar] [CrossRef]
- Martchamadol, J.; Kumar, S. The Aggregated Energy Security Performance Indicator (AESPI) at national and provincial level. Appl. Energy 2014, 127, 219–238. [Google Scholar] [CrossRef]
- Warren, B. Renewable energy country attractiveness index (RECAI). Ernst Young 2015, 43, 35–37. [Google Scholar]
- Hsu, A.; Emerson, J.; Johnson, L.; Malik, O.; Schwartz, J.D.; Allison, A.; Coplin, K.; Guy, S.; Lujan, B.; Hawkins, N.; et al. 2014 Environmental Performance Index, Full Report and Analysis; Yale Center Environmental Law Policy: New Haven, CT, USA, 2014. [Google Scholar]
- Schlör, H.; Fischer, W.; Hak, J.F. Methods of measuring sustainable development of the German energy sector. Appl. Energy 2013, 101, 172–181. [Google Scholar] [CrossRef]
- Liu, G. Development of a general sustainability indicator for renewable energy systems: A review. Renew. Sustain. Energy Rev. 2014, 31, 611–621. [Google Scholar] [CrossRef]
- Özdemir, E.D.; Härdtlein, M.; Jenssen, T.; Zech, D.; Eltrop, L. A confusion of tongues or the art of aggregating indicators—Reflections on four projective methodologies on sustainability measurement. Renew. Sustain. Energy Rev. 2011, 15, 2385–2396. [Google Scholar] [CrossRef]
- Wu, J.; Wu, T. Sustainability indicators and indices: An Overview. In Handbook of Sustainable Management; Imperial College Press: London, UK, 2012; pp. 65–86. [Google Scholar]
- Hak, T.; Moldan, B.; Dahl, A.L. Sustainability Indicator: A Scientific Assessment; Island Press: Washington, DC, USA, 2007. [Google Scholar]
- Streimikiene, D.; Ciegis, R.; Grundey, D. Energy indicators for sustainable development in Baltic States. Renew. Sustain. Energy Rev. 2007, 11, 877–893. [Google Scholar] [CrossRef]
- Streimikiene, D.; Sivickas, G. The EU sustainable energy policy indicators framework. Environ. Int. 2008, 34, 1227–1240. [Google Scholar] [CrossRef] [PubMed]
- Tsai, W.T. Energy sustainability from analysis of sustainable development indicators: A case study in Taiwan. Renew. Sustain. Energy Rev. 2010, 14, 2131–2138. [Google Scholar] [CrossRef]
- Woo, C.; Chung, Y.; Chun, D.; Seo, H.; Hong, S. The static and dynamic environmental efficiency of renewable energy: A Malmquist index analysis of OECD countries. Renew. Sustain. Energy Rev. 2015, 47, 367–376. [Google Scholar] [CrossRef]
- International Atomic Energy Agency (IAEA); United Nations Department of Economic and Social Affairs (UNDESA); International Energy Agency (IEA); Eurostat; European Environment Agency (EEA). Energy Indicators for Sustainable Development: Methodologies and Guidelines; International Atomic Energy Agency (IAEA): Vienna, Austria, 2005. [Google Scholar]
- International Energy Agency (IEA). World Energy Outlook 2008; IEA Publications: Paris, France, 2008. [Google Scholar]
- Ayre, G.; Callway, R. Governance for Sustainable Development—A Foundation for the Future; Earthscan: London, UK, 2013. [Google Scholar]
- Castillo, H.; Pitfield, D.E. ELASTIC—A methodological framework for identifying and selecting sustainable transport indicators. Transp. Res. Part D Transp. Environ. 2010, 15, 179–188. [Google Scholar] [CrossRef] [Green Version]
- Meadows, D. (Ed.) Indicators and Information Systems for Sustainable Development; Sustainability Institute: Hartland Four Corners, VT, USA, 1998. [Google Scholar]
- Bell, S.; Morse, S. Measuring Sustainability: Learning by Doing; Earthscan: London, UK, 2003. [Google Scholar]
- United Nations (UN). Indicators of Sustainable Development: Guidelines and Methodologies, 3rd ed.; United Nations: New York, NY, USA, 2007. [Google Scholar]
- Salzman, J. Methodological Choices Encountered in the Construction of Composite Indices of Economic and Social Well-Being; Center for the Study of Living Standards: Ottawa, ON, Canada, 2003. [Google Scholar]
- Mazziotta, M.; Pareto, A. Methods for constructing composite indices: One for all or all for one? Riv. Ital. Econ. Demogr. Stat. 2013, 67, 67–80. [Google Scholar]
- Gan, X.; Fernandez, I.C.; Guoc, J.; Wilson, M.; Zhao, Y.; Zhou, B.; Wu, J. When to use what—Methods for weighting and aggregating sustainability indicators. Ecol. Indic. 2017, 81, 491–502. [Google Scholar] [CrossRef]
- Final Energy Consumption by Sector. Available online: http://ec.europa.eu/eurostat/web/products-datasets/-/tsdpc320 (accessed on 1 February 2018).
Figure 1.
Renewable energy mix share. Authors’ projection.

Figure 2.
Steps in index construction. Authors’ projection.

Figure 3.
Interrelationship among sustainability dimensions of the energy system (Authors’ projection adapted from [39,40]).

Figure 4.
Index construction. Authors’ projection.


Table 1.
Overview of sustainable development indicators related to energy.
| Type of Indicator | Author(s) | Region | Indicators/Index Identification | Result(s) |
|---|---|---|---|---|
| Simple | [35] | Baltic | Energy use per capita Energy intensity End-use intensities of economic sectors Energy security | Positive trends in relation to SD in energy sector |
| [36] | Baltic | Energy efficiency, End-use energy intensity of GDP, Energy efficiency in buildings, Energy efficiency in primary energy supply, Energy efficiency in cogeneration, Use of RES-E, Share of RES-E in primary energy supply, Share of RES-E in electricity generation, Share of RES-E in heat production, Share of RES-E in fuel used in transport, Security of supply, Energy independency, Atmospheric pollution reduction, Greenhouse gas emissions, Other emissions | Problems related to energy efficiency, use of RES-E and security of supply | |
| [37] | Taiwan | Energy use intensity Carbon dioxide per capita RES-E in electricity generation | Significant progress of energy sustainability | |
| Aggregated | [30] | Germany | Standardized sustainability energy index (SSEI) | Development of a suitable sustainable energy policy according to the goals established by the German Government |
| [31] | Theoretical framework | Generally sustainability indicator for renewable energy systems (GSI) | Proposal of a framework to develop a general sustainability indicator for RES-E | |
| [38] | 31 OECD countries | Malmquist productivity index | Estimate the average efficiency change from 2004 to 2011. Dynamic efficiency is influenced by the global financial crisis | |
| Composite | [21] | 50 countries | Renewable Energy Responsible Investment Index (RERII) | The index provides a comparative analysis of different Countries in terms of economic, environmental, social and governance aspects |
Authors’ projection.
Table 2.
Representative selected indicators.
| Dimension | Factor | Indicators | Unit | Database |
|---|---|---|---|---|
| Environmental | Environmental sustainability | Stringency of environmental regulation | Score 1–7 | Travel & Tourism Competitiveness Report |
| Enforcement of environmental regulation | Score 1–7 | Travel & Tourism Competitiveness Report | ||
| Quality of the natural environment | Score 1–7 | Travel & Tourism Competitiveness Report | ||
| Renewable impact | Renewable energy consumption | % of total final energy consumption | World Bank | |
| Share of renewable energy in gross final energy consumption | % | Eurostat | ||
| Share of renewable in power production | % | World Energy Council | ||
| Institutional | Country healthiness | Transparency of government policymaking | Score 1–7 | Global Competitiveness Report 2017 |
| Government Effectiveness | Percentile Rank | World Bank | ||
| Regulatory Quality | Percentile Rank | World Bank | ||
| Political Stability and Absence of Violence/Terrorism | Percentile Rank | World Bank | ||
| GDP per capita | % of income per capita | World Bank | ||
| Social | Innovation competitiveness | Availability of latest technologies | Score 1–7 | Global Competitiveness Report 2017 |
| Affordability of financial services | Score 1–7 | Global Competitiveness Report 2017 | ||
| Capacity for innovation | Score 1–7 | Global Competitiveness Report 2017 | ||
| Company spending on R&D | Score 1–7 | Global Competitiveness Report 2017 | ||
| University-industry collaboration in R&D | Score 1–7 | Global Competitiveness Report 2017 | ||
| Economic | Production impact & Infrastructure capacity | Total gross electricity generation | Gwh | Eurostat |
| Primary production of renewable energy | 1000 TOE * | Eurostat | ||
| Greenhouse gas emissions from energy sector | Thousand tonnes | Eurostat/EEA | ||
| Electrical capacity—Combustible fuels | MW | Eurostat | ||
| Electrical capacity—Hydro, Wind, Solar | MW | Eurostat | ||
| Macroeconomics | Inflation rate | % | World Bank | |
| Economic growth rate | % | World Bank |
* Tonnes of oil equivalent; (Authors’ projection).
Table 3.
Indicators impact.
| Dimension | Indicators | Impact |
|---|---|---|
| Environmental | Stringency of environmental regulation | Positive |
| Enforcement of environmental regulation | Positive | |
| Quality of the natural environment | Positive | |
| Renewable energy consumption | Positive | |
| Share of renewable energy in gross final energy consumption | Positive | |
| Share of renewable in power production | Positive | |
| Institutional | Transparency of government policymaking | Positive |
| Government Effectiveness | Positive | |
| Regulatory Quality | Positive | |
| Political Stability and Absence of Violence/Terrorism | Positive | |
| GDP per capita | Positive | |
| Social | Availability of latest technologies | Positive |
| Affordability of financial services | Positive | |
| Capacity for innovation | Positive | |
| Company spending on R&D | Positive | |
| University-industry collaboration in R&D | Positive | |
| Economic | Total gross electricity generation | Positive |
| Primary production of renewable energy | Positive | |
| Greenhouse gas emissions from energy sector | Negative | |
| Electrical capacity—Combustible fuels | Negative | |
| Electrical capacity—Hydro, Wind, Solar | Positive | |
| Inflation rate | Negative | |
| Economic growth rate | Positive |
Authors’ projection.
Table 4.
Selected countries ranking.
| Final Energy Consumption 2015 | |
|---|---|
| Country | Million Tonnes of Oil Equivalent (TOE) |
| Germany | 212.1 |
| France | 144.3 |
| United Kingdom | 130.3 |
| Italy | 116.4 |
| Spain | 80.5 |
| Turkey | 74.6 |
| Poland | 62.3 |
| Netherlands | 48.5 |
| Belgium | 35.8 |
| Sweden | 31.8 |
| Austria | 27.4 |
| Finland | 24.2 |
| Czech Republic | 24.1 |
| Romania | 21.9 |
| Norway | 18.6 |
Authors’ projection.
Table 5.
Kayser-Mayer-Olkin (KMO) values.
| Factor | KMO—2013 | KMO—2014 | KMO—2015 |
|---|---|---|---|
| Renewable impact | 0.728 | 0.723 | 0.714 |
| Environmental sustainability | 0.734 | 0.728 | 0.715 |
| Country healthiness | 0.734 | 0.743 | 0.767 |
| Innovation competitiveness | 0.825 | 0.855 | 0.853 |
| Production impact & Infrastructure capacity | 0.738 | 0.740 | 0.742 |
| Macroeconomics * | 0.500 | 0.500 | 0.500 |
* Macroeconomics is made up of two indicators, making the KMO value of 0.500. Authors’ projection.
Table 6.
KMO values after second Factor Analysis—Principal Component Analysis (FA-PCA) reapplication.
Table 6.
KMO values after second Factor Analysis—Principal Component Analysis (FA-PCA) reapplication.
| Factor | KMO—2013 | KMO—2014 | KMO—2015 |
|---|---|---|---|
| Index | 0.640 | 0.740 | 0.716 |
Authors’ projection.
Table 7.
Index weight.
| Factor | LOADS—2013 | LOADS—2014 | LOADS—2015 |
|---|---|---|---|
| Renewable impact | 0.552 | 0.547 | 0.533 |
| Environmental sustainability | 0.969 | 0.973 | 0.969 |
| Country healthiness | 0.983 | 0.974 | 0.971 |
| Innovation competitiveness | 0.902 | 0.918 | 0.932 |
| Production impact & Infrastructure capacity | −0.123 | −0.124 | −0.119 |
| Macroeconomics * | −0.544 | −0.532 | −0.585 |
* Macroeconomics is made up of two indicators, making the KMO value of 0.500; Authors’ projection.
Table 8.
RESI rankings 2013.
| Country | 2013 | |
|---|---|---|
| Score | Rank | |
| Norway | 66 | 1 |
| Finland | 65 | 2 |
| Sweden | 64 | 3 |
| Austria | 58 | 4 |
| Netherlands | 53 | 5 |
| Germany | 52 | 6 |
| Belgium | 49 | 7 |
| United Kingdom | 48 | 8 |
| France | 43 | 9 |
| Czech Republic | 40 | 10 |
| Spain | 37 | 11 |
| Poland | 34 | 12 |
| Italy | 32 | 13 |
| Romania | 23 | 14 |
| Turkey | 18 | 15 |
Authors’ projection.
Table 9.
2013 scoring for each calculated factor.
| Country | Renewables Impact | Environmental Sustainability | Country Healthiness | Innovation Competitiveness | Production Impact & Infrastructure Capacity | Macroeconomics |
|---|---|---|---|---|---|---|
| Turkey | 17 | 53 | 9 | 57 | 26 | 80 |
| Romania | 25 | 47 | 13 | 53 | 6 | 43 |
| Poland | 11 | 64 | 34 | 54 | 18 | 19 |
| Italy | 21 | 58 | 23 | 57 | 44 | 9 |
| Czech Republic | 12 | 68 | 40 | 64 | 6 | 14 |
| Spain | 20 | 67 | 34 | 57 | 35 | 10 |
| France | 14 | 71 | 50 | 72 | 40 | 15 |
| Belgium | 9 | 77 | 58 | 78 | 5 | 14 |
| United Kingdom | 7 | 77 | 65 | 79 | 33 | 29 |
| The Netherlands | 7 | 81 | 76 | 77 | 9 | 21 |
| Austria | 46 | 91 | 70 | 73 | 9 | 20 |
| Norway | 74 | 86 | 91 | 77 | 14 | 24 |
| Sweden | 55 | 88 | 81 | 80 | 15 | 13 |
| Germany | 15 | 89 | 65 | 80 | 75 | 18 |
| Finland | 40 | 93 | 84 | 86 | 7 | 14 |
| factor weight | 0.552 | 0.969 | 0.983 | 0.902 | −0.123 | −0.544 |
Authors’ projection.
Table 10.
Renewable Energy Sustainability Index (RESI) rankings 2014.
| Country | 2014 | |
|---|---|---|
| Score | Rank | |
| Norway | 65 | 1 |
| Finland | 65 | 2 |
| Sweden | 61 | 3 |
| Austria | 59 | 4 |
| Netherlands | 53 | 5 |
| Germany | 53 | 6 |
| United Kingdom | 48 | 7 |
| Belgium | 48 | 8 |
| France | 44 | 9 |
| Czech Republic | 39 | 10 |
| Spain | 38 | 11 |
| Italy | 33 | 12 |
| Poland | 33 | 13 |
| Romania | 27 | 14 |
| Turkey | 20 | 15 |
Authors’ projection.
Table 11.
2014 scoring for each calculated factor.
| Country | Renewables Impact | Environmental Sustainability | Country Healthiness | Innovation Competitiveness | Production Impact & Infrastructure Capacity | Macroeconomics |
|---|---|---|---|---|---|---|
| Turkey | 17 | 55 | 9 | 58 | 27 | 71 |
| Romania | 28 | 51 | 11 | 54 | 7 | 27 |
| Poland | 11 | 63 | 31 | 56 | 17 | 24 |
| Italy | 23 | 59 | 20 | 59 | 41 | 5 |
| Czech Republic | 13 | 68 | 39 | 67 | 7 | 22 |
| Spain | 23 | 66 | 34 | 59 | 34 | 11 |
| France | 15 | 71 | 46 | 73 | 37 | 11 |
| Belgium | 10 | 77 | 52 | 79 | 5 | 15 |
| United Kingdom | 9 | 76 | 65 | 80 | 31 | 28 |
| The Netherlands | 7 | 80 | 74 | 78 | 10 | 16 |
| Austria | 47 | 90 | 68 | 75 | 9 | 14 |
| Norway | 74 | 86 | 86 | 78 | 14 | 23 |
| Sweden | 54 | 87 | 76 | 81 | 15 | 19 |
| Germany | 17 | 87 | 67 | 80 | 74 | 17 |
| Finland | 40 | 92 | 81 | 85 | 7 | 4 |
| factor weight | 0.547 | 0.973 | 0.974 | 0.918 | −0.124 | −0.532 |
Authors’ projection.
Table 12.
RESI rankings 2015.
| Country | 2015 | |
|---|---|---|
| Score | Rank | |
| Norway | 60 | 1 |
| Finland | 59 | 2 |
| Sweden | 56 | 3 |
| Austria | 56 | 4 |
| Germany | 49 | 5 |
| Netherlands | 49 | 6 |
| United Kingdom | 47 | 7 |
| Belgium | 46 | 8 |
| France | 43 | 9 |
| Czech Republic | 37 | 10 |
| Spain | 36 | 11 |
| Italy | 34 | 12 |
| Poland | 32 | 13 |
| Romania | 28 | 14 |
| Turkey | 19 | 15 |
Authors’ projection.
Table 13.
2015 scoring for each calculated factor.
| Country | Renewables Impact | Environmental Sustainability | Country Healthiness | Innovation Competitiveness | Production Impact & Infrastructure Capacity | Macroeconomics |
|---|---|---|---|---|---|---|
| Turkey | 15 | 56 | 8 | 55 | 30 | 69 |
| Romania | 30 | 54 | 12 | 51 | 7 | 22 |
| Poland | 12 | 63 | 26 | 56 | 18 | 19 |
| Italy | 25 | 60 | 21 | 60 | 40 | 7 |
| Czech Republic | 14 | 68 | 33 | 67 | 7 | 29 |
| Spain | 23 | 65 | 31 | 60 | 33 | 18 |
| France | 15 | 72 | 38 | 75 | 37 | 9 |
| Belgium | 12 | 78 | 44 | 79 | 5 | 13 |
| United Kingdom | 11 | 75 | 54 | 80 | 32 | 15 |
| Netherlands | 8 | 80 | 58 | 79 | 11 | 16 |
| Austria | 48 | 90 | 53 | 78 | 9 | 12 |
| Norway | 74 | 87 | 66 | 77 | 13 | 21 |
| Sweden | 55 | 85 | 59 | 82 | 16 | 25 |
| Germany | 18 | 86 | 51 | 80 | 75 | 13 |
| Finland | 42 | 91 | 59 | 84 | 7 | 4 |
| factor weight | 0.533 | 0.969 | 0.971 | 0.932 | −0.119 | −0.585 |
Authors’ projection.
Table 14.
Index robustness.
| Country | Rank Variation 2013/2014 | Rank Variation 2014/2015 | Rank Variation 2013/2015 |
|---|---|---|---|
| Norway | 1 | 1 | 0 |
| Finland | 0 | 0 | 0 |
| Sweden | 0 | 1 | 1 |
| Austria | 0 | 0 | 0 |
| Netherlands | 1 | 0 | 1 |
| Germany | 0 | 0 | 0 |
| Belgium | 1 | 0 | 1 |
| United Kingdom | 0 | 1 | 1 |
| France | 0 | 0 | 0 |
| Czech Republic | 0 | 0 | 0 |
| Spain | 0 | 0 | 0 |
| Poland | 1 | 0 | 1 |
| Italy | 0 | 1 | 1 |
| Romania | 0 | 0 | 0 |
| Turkey | 0 | 0 | 0 |
| Total (sum of absolute differences) | 4 | 4 | 6 |
| Average of absolute differences | 0.267 | 0.267 | 0.400 |
Authors’ projection.
© 2018 by the authors. Licensee MDPI, Basel, Switzerland. This article is an open access article distributed under the terms and conditions of the Creative Commons Attribution (CC BY) license (http://creativecommons.org/licenses/by/4.0/).
Share and Cite
MDPI and ACS Style
Cîrstea, S.D.; Moldovan-Teselios, C.; Cîrstea, A.; Turcu, A.C.; Darab, C.P. Evaluating Renewable Energy Sustainability by Composite Index. Sustainability 2018, 10, 811. https://doi.org/10.3390/su10030811
AMA Style
Cîrstea SD, Moldovan-Teselios C, Cîrstea A, Turcu AC, Darab CP. Evaluating Renewable Energy Sustainability by Composite Index. Sustainability. 2018; 10(3):811. https://doi.org/10.3390/su10030811
Chicago/Turabian StyleCîrstea, Stefan Dragos, Calin Moldovan-Teselios, Andreea Cîrstea, Antoniu Claudiu Turcu, and Cosmin Pompei Darab. 2018. "Evaluating Renewable Energy Sustainability by Composite Index" Sustainability 10, no. 3: 811. https://doi.org/10.3390/su10030811
Note that from the first issue of 2016, this journal uses article numbers instead of page numbers. See further details here.