Mine Size Effects on Coal Pillar Stress and Their Application for Partial Extraction


1
School of Environment Science and Spatial Information, China University of Mining and Technology, Xuzhou 221116, China
2
Department of Civil and Environmental Engineering, University of North Carolina at Charlotte, 9201 University City Blvd., Charlotte, NC 28223, USA
*
Author to whom correspondence should be addressed.
Sustainability 2018, 10(3), 792; https://doi.org/10.3390/su10030792
Submission received: 30 January 2018
/
Revised: 7 March 2018
/
Accepted: 9 March 2018
/
Published: 13 March 2018
Abstract
:Coal is a nonrenewable resource. Hence, it is important to improve the coal recovery ratio and ensure the stability of coal mines for sustainable development of mining cities. Partial extraction techniques, such as strip pillar mining or room-and-pillar mining, are efficient methods to extract coal. Pillar stress is a critical property for pillar design and for the assessment of mine stability after partial extraction. Current pillar stress calculation methods can sometimes overestimate the pillar stress and unnecessarily large coal pillars may be left underground, which leads to a waste of coal resources. In this paper, the size effects of mining activity on the maximum vertical pillar stress were investigated using numerical simulations. Both strip pillar mining and room-and-pillar mining were considered as possible mining scenarios at different mining depths. The results show that the maximum pillar stress of a mine is primarily controlled by four factors: the mine size to mining depth ratio, the mining width to pillar width ratio, the overburden elastic modulus, and the mining depth. The maximum pillar stress of a mine gradually increases to an ultimate value as the mine size increases. Simplified formulas and methodology have been derived for stress calculations under consideration of mine size effects and, therefore, can reduce the waste of coal resources from the overestimation of pillar stress.
1. Introduction
Underground mining activities can result in severe ground subsidence and damage man-made structures (buildings, railways, or other infrastructure) on the surface [1,2,3,4,5]. Mining subsidence is an important factor that restricts the sustainable development of mining cities [5]. To reduce mining subsidence and protect surface and ground structures, partial extraction methods such as strip pillar mining or room-and-pillar mining are widely adopted [5,6,7]. Figure 1 shows typical layouts of room-and-pillar mining and strip pillar mining techniques. In a partial extraction operation, massive coal pillars will be left underground to support the overburden, where the effectiveness of subsidence control for the partial extraction will depend on the stability of these pillars. Additionally, the failure of a coal pillar may result in violent ground movements [8,9]. Therefore, the stability of the coal pillars in a partial extraction is very important during and after mining activities.
The pillar stress is a critical factor affecting pillar stability, and the pillar stress calculation is an important aspect of mine design. The stress calculation for room-and-pillar mining is a three-dimensional problem because both the pillar length and the pillar width are relatively small (Figure 1a), whereas the stress calculation for strip pillar mining can be simplified to a two-dimensional problem because the pillar length is usually far longer than the pillar width (Figure 1b). In coal mine design and pillar stability evaluation, the pillar stress is usually determined by using TAT (tributary area theory), PAT (pressure arch theory), or numerical simulations [5,10,11,12,13,14,15,16]. TAT assumes that the overburden load will be evenly distributed among coal pillars, and the overburden load above the mined room is equally shared by neighboring pillars [5]. On the other hand, PAT assumes that a pressure arch will form between large barrier pillars and carry most of overburden weight, the abutment angle is utilized to describe the shape of the pressure arch [5,15]. For narrow mine panels, TAT overestimates the pillar stresses since pressure arches may carry the weight of the overburden. In such cases, PAT is usually adopted to calculate pillar stress [5,14,15,16]. However, the abutment angle used by PAT is mostly summarized from longwall mining [5,10,11,12,13,14,15,16,17,18,19,20], which is not always accurate for partial extraction. On the other hand, the shape and height of the pressure arch may change during excavation [21], indicating that the portions of the overburden load that transfer to the pillars are affected by the mine size. Therefore, the existing methods fail to provide a reliable stress estimation for partial extraction. Inaccurate pillar stress calculations usually result in unnecessarily large coal pillars that are permanently left underground; the coal resource is wasted.
To address this issue, empirically established techniques and methodologies which estimate pillar stress have been suggested [22]. He et al. [23] observed that the mine subsidence and strata movement are affected by the mine size . Additionally, they found that the mine size to mining depth ratio (Figure 1c, ) is an important parameter to determine whether the subsidence can reach its peak value. This observation suggests that the deformation and stress of strata may be a function of the mine size . Roberts et al. [11] reported similar observations that the pillar stress is affected by and proposed a stress calculation formula for room-and-pillar mines that included mine size effects.
In this paper, the effects of mine size variation on coal pillar stress are investigated for both strip pillar mining and room-and-pillar mining using numerical software UDEC (Universal Distinct Element Code) and 3DEC (3 Dimension Distinct Element Code). Simulation of mines includes different pillar sizes and different mine depths. The mine size refers to the mined area of the coal seam with coal pillars and mined rooms (Figure 1c). Simple formulas to calculate the maximum pillar stress for different mine sizes are derived and proposed for mine design. Based on the proposed formulas, the recovery ratio may be improved if the mine size is not too large, and the waste of coal resource can be reduced.
2. Mine Modeling and Simulation
The discrete element modeling program, UDEC, is used in the current study. The scheme of the model is shown in Figure 1c. The ground surface and the coal seam are modeled as horizontal strata, where the thicknesses of the coal seam and the mine floor are modeled as 7 m and 20 m, respectively. The mining depth is varied from 100 m to 800 m; thus, the models included both shallow and deep mines. The pillar width is assumed to range from 7 m to 134 m. The mining width of strip pillar mining is usually 0.1 –0.25 to control the ground subsidence, thus, the pillars with very large sizes are proposed mainly for the theoretical analysis of strip pillar mining at deep depths. The ratio of mining width to pillar width is varied from 0.75 to 2. The geometric parameters of the models are listed in Table 1. Two boundary pillars with width of 200 m are reserved at both ends of the model. Other element sizes include 1 m for pillars, 2 m for the floor, 2 m for the roof (thickness is 20 m), and 4 m for other parts.
In the model, all non-coal strata are assumed to consist of one type of rock. The properties of non-coal strata are chosen to mimic sandstone except in Section 3.3. In Section 3.3, the elastic modulus and Poisson’s ratio are changed while the other properties of non-coal strata refer to sandstone to study the effect of different rock properties on pillar stress. Rock and coal properties are taken from the Yulin mine area in China and are listed in Table 2 [24]. The Mohr–Coulomb failure criterion is assumed for the models. Since the joint stiffness only affects the joint deformation, a large stiffness (5 × 10⁹ Pa) is assigned to the interface between non-coal strata and the coal seam, so that the maximum stresses in pillars can be calculated. The strength parameters of the interfaces are matched to the coal strength. The model base is fixed in the vertical direction and the lateral boundary of the model is fixed in the horizontal direction. Static equilibrium analysis is conducted with consideration of gravitational loads on the system. Every pillar contained one vertical observation line located at the pillar center. The model is mined one tunnel at a time and from the left-hand side until the mine reached the design size (Table 1). For each time the tunnel number (or mine size ) increases, the maximum vertical pillar stress of the whole mine is recorded.
3. Analysis of Simulation Results
Mine failures did not occur in all of the numerical simulations. The numerical simulation results indicate that the maximum vertical stress of a single pillar appeared at the pillar bottom, and the maximum vertical pillar stress of the mine is dominated by the mine size , the mining width to pillar width ratio and the overburden elastic modulus . In this study, the maximum vertical pillar stress of the mine is expressed by the stress concentration factor :
where is the acceleration due to gravity, and are the density of non-coal strata and the density of the coal seam, respectively; and are mining depth and pillar height, respectively, and is the maximum vertical pillar stress of the mine from the simulation.
3.1. Effects of the Mine Size on the Maximum Vertical Pillar Stress of the Mine
By fixing to unity, the mine size effect on was investigated. The results (Figure 2) show that there is an exponential relationship between and :
where is the ultimate stress concentration factor when the pillar stress is stable and reaches its peak value (Figure 2); is the natural base, and is a constant dependent on , , and .
Figure 2 shows examples of distribution (Figure 2a) and the regression results (Figure 2b) as a function of . Initially, increases when increases, and gradually, become stable and reaches its peak value when ≥3 to 4. Therefore, the parameter can be an indication to determine if the pillar stress in the mine reaches its maximum value; if <3 to 4, the pillar stress of the mine is not fully developed and will increase with further increase of . Otherwise, reaches its maximum value and will no longer increase with the increase of .
The parameters in Equation (2) are listed in Table 3, which indicates that is dependent on mining depth but is independent of the mining and pillar widths. For each mining depth, the mean value of can be used to estimate the maximum pillar stress (Table 4). It is shown in Figure 3 that the average coefficient increases as the mining depth increases.
It is found that the maximum pillar stress of the mine can be calculated by the TAT method when ≥3 to 4. Therefore, for a two-dimensional plane (Figure 1c), of coal pillars for a mine with ≥3 to 4 can be calculated as:
and Equation (2) can be expressed as:
3.2. Effects of on the Maximum Vertical Pillar Stress of the Mine
In order to control ground subsidence, the mining width for partial extraction is usually set between 0.1 and 0.25 [6]. To study the effects of , the mining width is assumed to be in this range, the mining depth is varied from 100 m to 400 m, and the is varied from 0.75 to 2. The results show that the curves for different values are similar to the curves shown in Figure 2. The parameters for Equation (2) under different are listed in Table 5. Table 3 and Table 5 indicate that the performance of the fit parameter is primarily dominated by , followed by the effect of mining depth. Furthermore, from Table 5, it is noticed that is approximately equal to 1 + , indicating that Equation (4) is valid.
As shown in Figure 3, the parameter increases by 0.06 when the mining depth increases by 100 m. In Table 5, the mining depth varies from 100 m to 400 m, thus, the maximum variation of induced by the change of mining depth is only 0.18. However, approximately varies from 0.4 to 2 in Table 5. This means that is mainly dominated by and the mining depth effect is negligible. In turn, the average values of and for each can be used to represent the effect, as shown in Table 6.
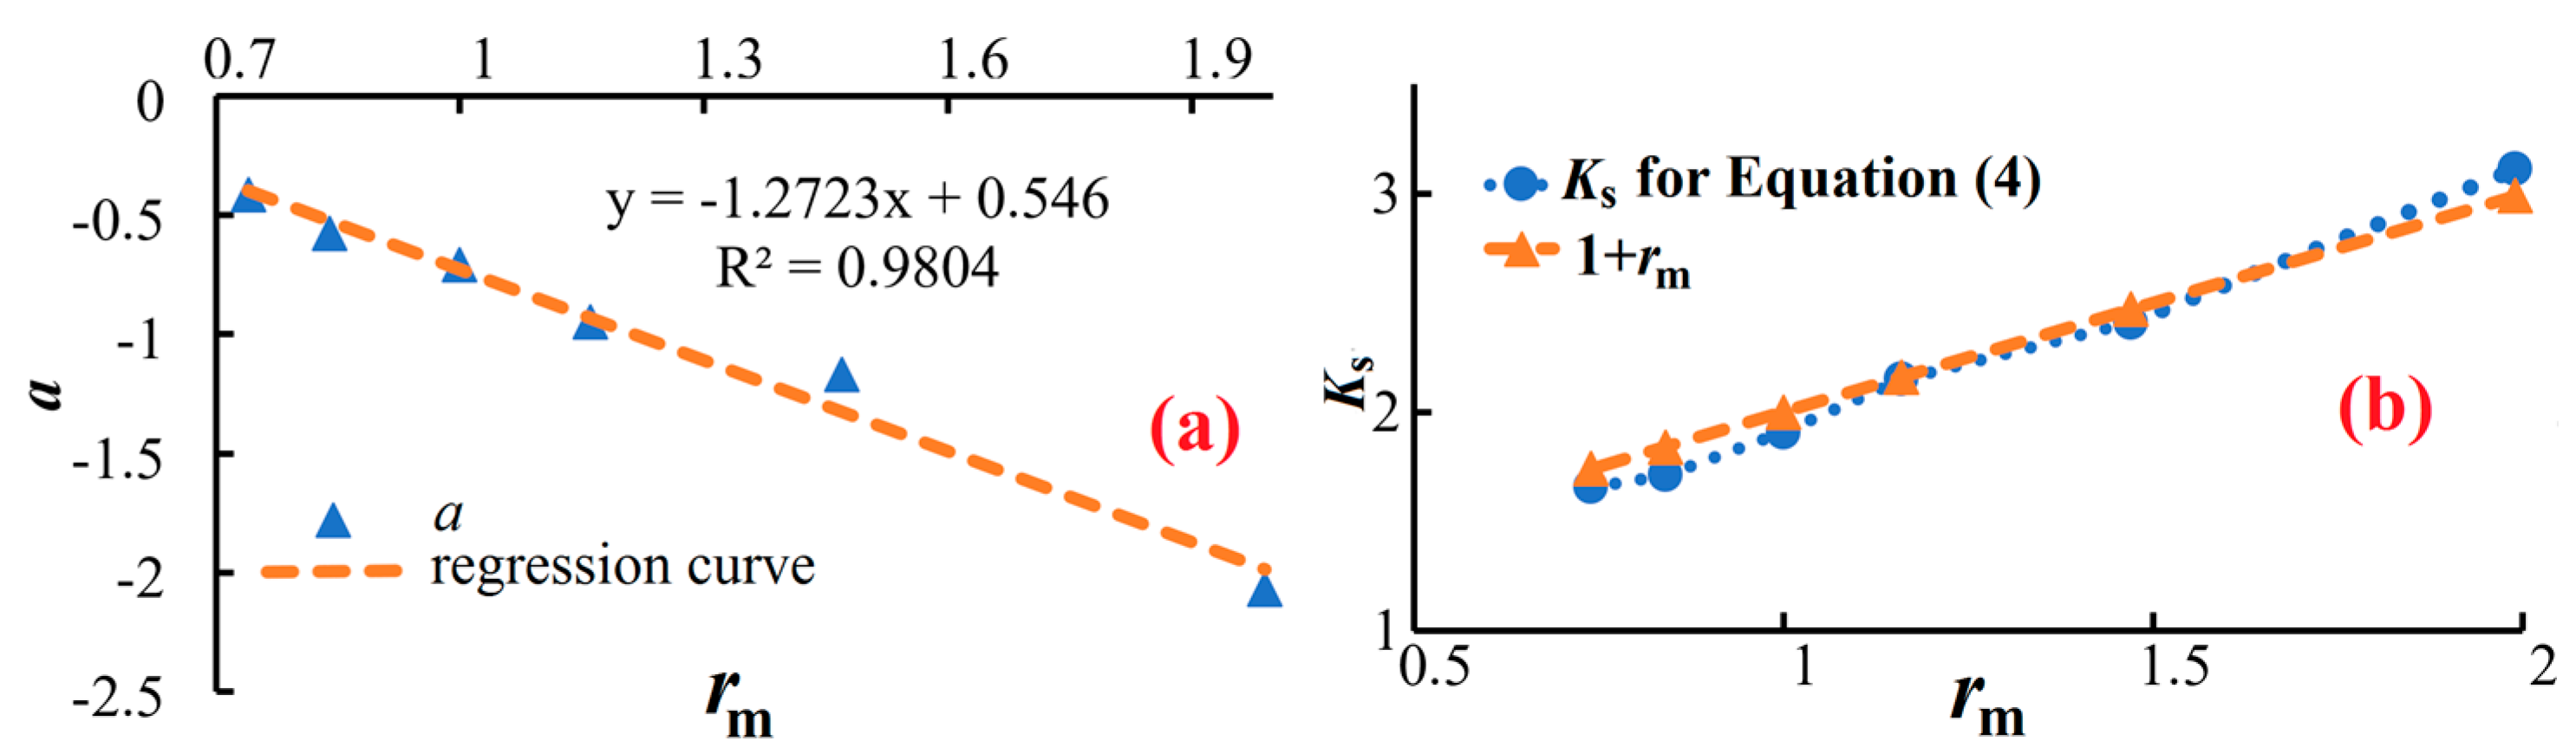
Figure 4 shows the relationship between and the average parameters and . An increase in results in an increase in but a decrease in . As the variation of is mainly controlled by , and the mining depth effect on can be neglected, Figure 4a shows that will increase by −1.2723 if increases by a value of 1. Theoretically, should be equal to 1 + . However, Figure 4b shows that when is small, is slightly smaller than 1 + ; and when is large, is slightly larger than 1 + . This is because the pillar stress is not uniformly distributed [5,10]. The outer parts of a pillar support more overburden load than the inner part of the pillar [10]. Thus, when is small, the vertical stress at the pillar center is smaller than the average stress on the pillar. When is large, the outer parts of the pillar may yield and lose capacity due to the large overburden load, and the effective pillar size decreases, leading to a situation where the stress at the pillar center is larger than the average pillar stress. As a result, is not totally equal to the theoretical value of 1 + .
3.3. Effects of Overburden Properties on the Maximum Vertical Pillar Stress of the Mine
To study the effects of overburden properties, the model with a mining depth of 200 m, a mining width of 20 m, and an of one (from Table 1) is selected. First, the overburden elastic modulus, is set at 15 GPa, and the Poisson’s ratio, , is varied from 0.1 to 0.49. Then is fixed at 0.15, and is varied from 2 GPa to 100 GPa. Simulation results show that for different overburden properties are consistent with Equation (2). Table 7 lists the parameters of Equation (2) for different overburden properties.
Figure 5 shows the effect of on and . When is small, and are strongly affected by and the overburden elastic modulus cannot be neglected.
According to Figure 5a, can be represented by as:
Combining Equations (4) and (5), can be calculated as:
Equation (6) is based on the model with = 1 and mining depth of 200 m. As shown in Figure 3 and Figure 4b, linearly increases by 0.0006 if increases by 1 m, and linearly increases by −1.273 if increases by 1. Thus, for different at different mining depth can be estimated by introducing the mining depth and effects into Equation (6):
Table 8 shows the relative errors of as calculated by Equation (7) when compared with the simulation results. It is found that when is large (i.e., = 2), Equation (7) may slightly underestimate the pillar stress. Otherwise, Equation (7) usually overestimates the pillar stress. As stated, this is due to the fact that the stress on the pillars is not uniformly distributed. The stress at the pillar center was acquired in the simulations, and there exist some differences between the stress calculated by Equation (7) and the simulated stress, as previously discussed. Although there exist some differences between calculated stress and simulated stress, the relative errors are small for most of the cases. Hence, Equation (7) can be used to quickly estimate the pillar stress for different mine sizes.
4. Mine Size Effect on 3D Partial Extraction
As UDEC is only a two-dimensional simulation software, Equation (7) is only suitable for strip pillar mining. For room-and-pillar mines, the coal pillars bear three-dimensional stresses. Therefore, 3DEC is utilized for three-dimensional stress studies. Figure 6 shows a horizontal coal seam in a three-dimensional model, and the coal seam is mined in the north–south and east–west directions. The mining depth is 200 m, and the mining width and pillar width are both 20 m. There are 20 pillars (820 m × 820 m horizontal mine) in both north and east directions if the coal seams are to be completely mined. Four 150 m boundary pillars are reserved at the model comers. The element sizes are 2 m (north) × 2 m (up) × 2 m (east) for the floor and the roof (thickness is 20 m), 3 m × 5 m × 3 m for the coal seam, and other non-coal strata components are tetrahedral with an average size of 50 m. Other conditions such as pillar height, floor thickness, model properties, etc., are the same as in the two-dimensional simulations in Section 3.1.
The coal seam is mined in the north and east directions simultaneously, beginning from the south-west corner of the model (Figure 6). Assume the mine size in the north direction is , the mine size in the east direction is . Two scenarios have been investigated: (1) >3 to 4 but <3 to 4 (Figure 6a). In this case, and increase simultaneously, and the increase in stops if five pillars form in the east direction, while the increase in stops if 20 pillars form in the north direction. It was found that =4.1 and =1.1 when the mining activity stopped. (2) >3 to 4 and >3 to 4 (Figure 6b). In this case, and increase simultaneously until 20 pillars are formed bi-directionally, and and >3 were found when mining activity stopped.
According to Equation (7), mining in the north direction will contribute to a maximum pillar stress as:
and mining in the east direction will contribute to a maximum pillar stress as:
The maximum pillar stress of the three-dimensional model is the superposition of and from the two directions, and can be estimated as:
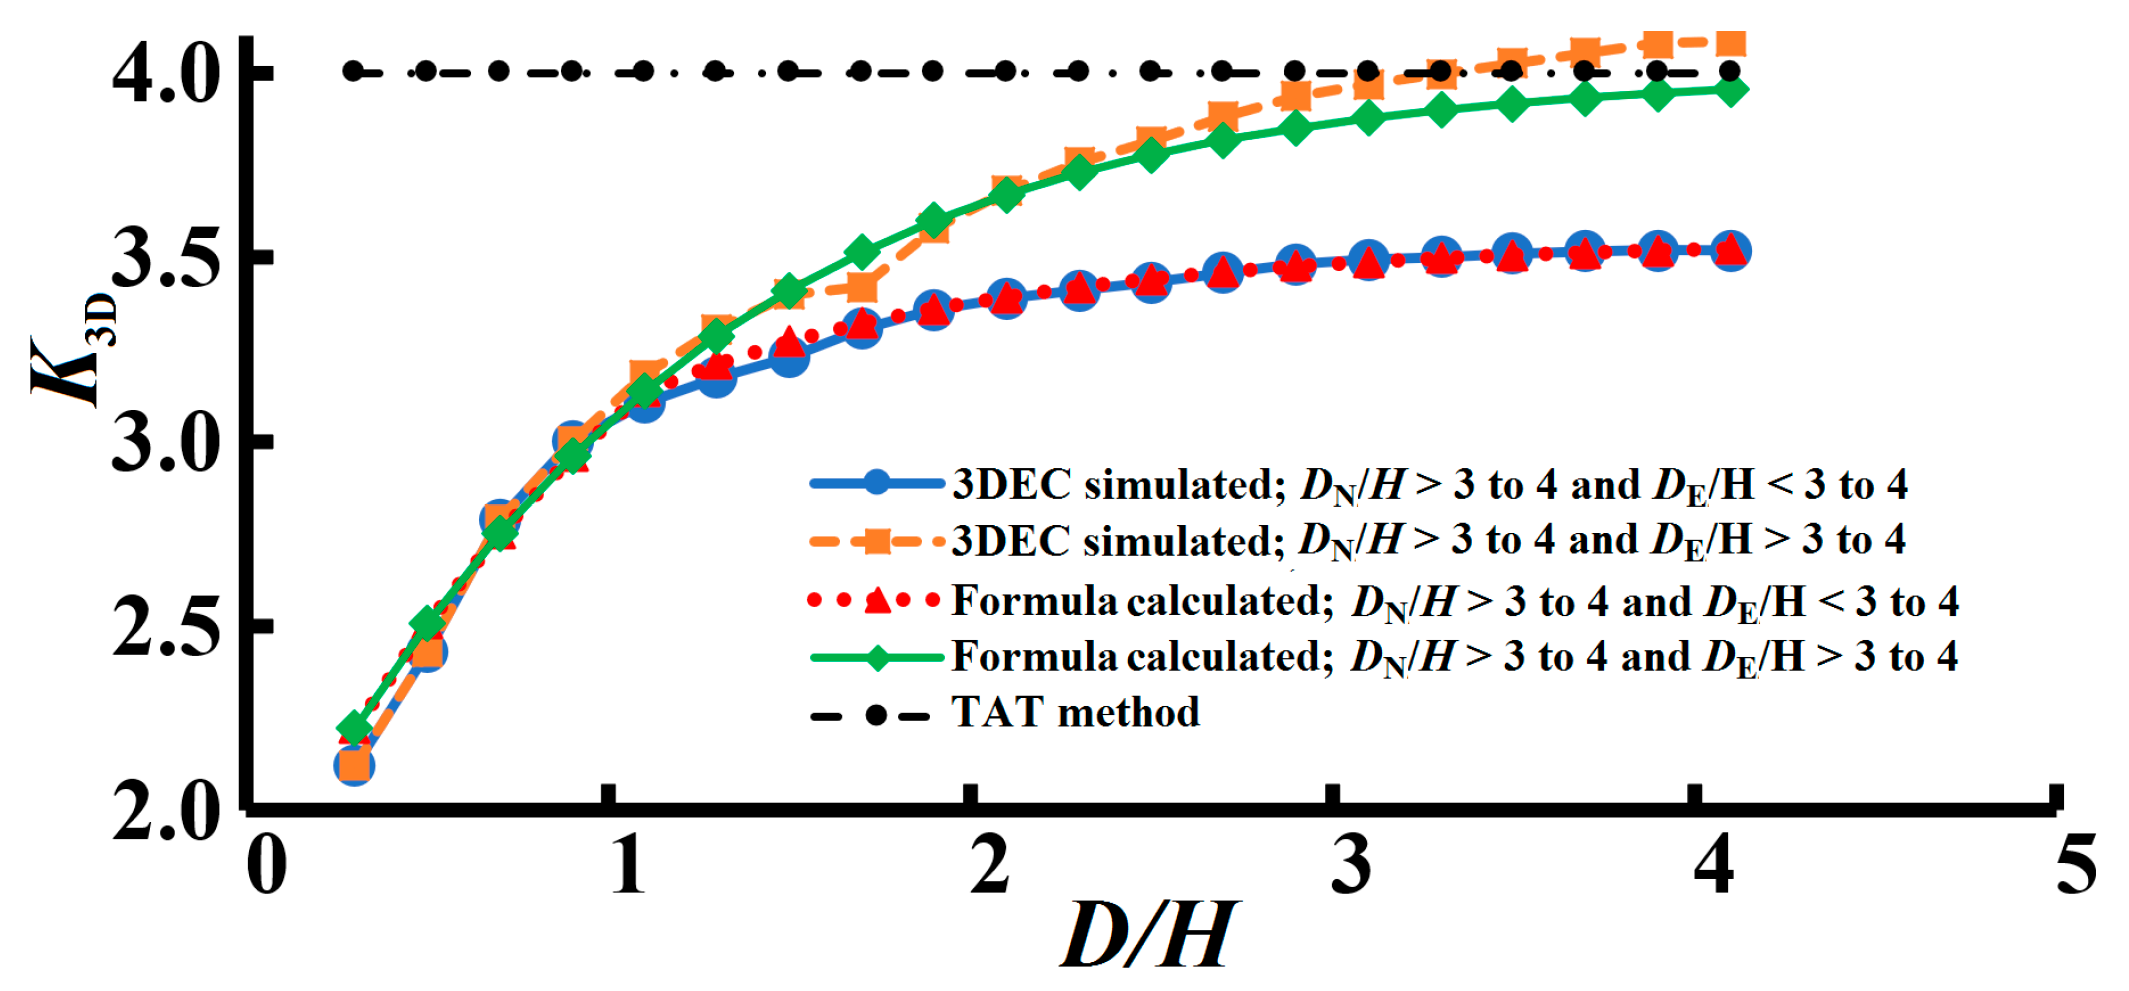
Figure 7 shows the simulated by 3DEC and the calculated by Equation (10). The results show that the curves are similar to curves of the two-dimensional simulations; the difference between simulated and calculated is very small. The curve for Figure 6b ( >3 to 4 but <3 to 4) is larger than the curve for Figure 6a ( >3 to 4 and >3 to 4). The value will gradually approach the value calculated by the TAT method with bi-directional >3.
5. Discussion
The TAT method can only be used when the mine size is large enough, but the critical mine size for which the TAT method is suitable has not been well addressed prior to the current study. All the numerical simulations in this paper show that the maximum pillar stress of a mine will gradually reach a peak value (the pillar stress calculated by the TAT method) when ≥3 to 4. Thus, of 3 is suggested as an index to determine whether the TAT method can be used. This is important especially for mining at deep depths, because the may be small, and using the TAT method may overestimate the pillar stress, resulting in unnecessarily large pillars and wasted coal resource.
As no mine failures occurred in these simulations, the values represent the maximum pillar stress in a mine. For strip mining, Equation (7) can be used to calculate the pillar stress when <3 to 4; otherwise, both Equation (7) and TAT can be used. For room-and-pillar mines, the TAT method can be used if >3 to 4 and >3 to 4; otherwise, Equations (8)–(10) should be used. By doing this, the waste of coal resource that results from an overestimation of pillar stress can be reduced.
Equations (8)–(10) are proposed based on the analysis of two-dimensional UDEC models. The small difference between 3DEC simulated stress and calculated stress by formula (Figure 7) indicated that the parameters from two-dimensional simulation can be used to predict the pillar stress in a three-dimensional model. Therefore, two-dimensional UDEC simulation can also be conducted to determine the parameters and in Equations (8)–(10) even for complicated mining situations. This is important because three-dimensional numerical simulations are more time-consuming than two-dimensional numerical simulations. A numerical model with ≥3 to 4 is also suggested when analyzing the mine system in full scale.
6. Conclusions
The widely used TAT method may overestimate the pillar stress since it neglects mine size effects. Essentially, mine size effects result from pressure arch formation, but the arch shape changes during mining and is hard to determine; current PAT methods are also not always reliable in pillar stress calculations. As a result, more precise stress calculation methods are needed.
Numerical studies of partial extraction mining are presented and several simplified pillar stress formulas are presented for both two-dimensional and three-dimensional pillar stress calculations. It is observed that the mine size has the same effects on both strip mining and room-and-pillar mining. For both shallow and deep mines, the maximum vertical pillar stress of a mine is controlled by , , , and . A of 3 to 4 has been found to be useful in determining whether the pillar stress can be calculated by the TAT method. As long as <3 to 4 in any mining direction, the TAT method overestimates the pillar stress, and mine size effects should be considered. Thus, the pillar size can be reduced, and the recovery ratio of partial extraction can be improved. Finally, the parameters and for the three-dimensional stress calculation can be achieved through two-dimensional numerical simulation.
Acknowledgments
Financial support was provided by the National Nature Science Fund of China (No. 51774270).
Author Contributions
Ka-Zhong Deng provided the main idea of the study; Yang Yu conducted the experiments and wrote the paper; Shen-En Chen provided language and technical support, and revised the paper.
Conflicts of Interest
The authors declare no conflict of interest.
References
- Can, E.; Kuşcu, Ş.; Kartal, M.E. Effects of mining subsidence on masonry buildings in Zonguldak hard coal region in Turkey. Environ. Earth Sci. 2012, 66, 2503–2518. [Google Scholar] [CrossRef]
- Deliormanli, A.H. Assessment of coal mining subsidence damage in Soma-Turkey coalfield using FEM modelling. Arch. Min. Sci. 2012, 57, 179–192. [Google Scholar]
- Ghabraie, B.; Ren, G.; Barbato, J.; Smith, J.V. A predictive methodology for multi-seam mining induced subsidence. Int. J. Rock Mech. Min. 2017, 93, 280–294. [Google Scholar] [CrossRef]
- Wang, H.; Zhang, D.; Wang, X.; Zhang, W. Visual exploration of the spatiotemporal evolution law of overburden failure and mining-induced fractures: A case study of the Wangjialing coal mine in China. Minerals 2017, 7, 35. [Google Scholar] [CrossRef]
- Yu, Y.; Chen, S.E.; Deng, K.Z.; Wang, P.; Fan, H.D. Subsidence mechanism and stability assessment methods for partial extraction mines for sustainable development of mining cities—A review. Sustainability 2018, 10, 113. [Google Scholar] [CrossRef]
- Chen, S.; Wang, H.; Wang, H.; Guo, W.; Li, X. Strip coal pillar design based on estimated surface subsidence in eastern China. Rock Mech. Rock Eng. 2016, 49, 1–10. [Google Scholar]
- Guo, W.; Wang, H.; Chen, S. Coal pillar safety and surface deformation characteristics of wide strip pillar mining in deep mine. Arab. J. Geosci. 2016, 9, 1–9. [Google Scholar] [CrossRef]
- Chong, L.; Xu, J.; Wang, Z.; Shuai, Q. Domino instability effect of surrounding rock-coal pillars in a room-and-pillar gob. Int. J. Min. Sci. Technol. 2013, 23, 913–918. [Google Scholar]
- Dehghan, S.; Shahriar, K.; Maarefvand, P.; Goshtasbi, K. 3-D numerical modelling of domino failure of hard rock pillars in Fetr6 Chromite Mine, Iran, and comparison with empirical methods. J. Cent. South Univ. 2013, 20, 541–549. [Google Scholar] [CrossRef]
- Wilson, A.H. The stability of underground workings in the soft rocks of the coal measures. Int. J. Min. Eng. 1983, 1, 91–187. [Google Scholar] [CrossRef]
- Roberts, D.P.; Merwe, J.V.D.; Canbulat, I.; Sellers, E.J.; Coetzer, S. Development of a Method to Estimate Coal Pillar Loading. 2002. Available online: http://www.mhsc.org.za/sites/default/files/COL%20709%20Final%20Report.pdf (accessed on 23 January 2018).
- Jaiswal, A.; Sharma, S.K.; Shrivastva, B.K. Numerical modeling study of asymmetry in the induced stresses over coal mine pillars with advancement of the goaf line. Int. J. Rock Mech. Min. 2004, 41, 859–864. [Google Scholar] [CrossRef]
- Jayanthu, S.; Singh, T.N.; Singh, D.P. Stress distribution during extraction of pillars in a thick coal seam. Rock Mech. Rock Eng. 2004, 37, 171–192. [Google Scholar] [CrossRef]
- Hauquin, T.; Deck, O.; Gunzburger, Y. Average vertical stress on irregular elastic pillars estimated by a function of the relative extraction ratio. Int. J. Rock Mech. Min. 2016, 83, 122–134. [Google Scholar] [CrossRef]
- Luo, Y. Room-and-pillar panel design method to avoid surface subsidence. Min. Eng. 2015, 67, 105–110. [Google Scholar]
- Poulsen, B.A. Coal pillar load calculation by pressure arch theory and near field extraction ratio. Int. J. Rock Mech. Min. 2010, 47, 1158–1165. [Google Scholar] [CrossRef]
- Mark, C. Analysis of Longwall Pillar Stability. Ph.D. Thesis, Pennsylvania State University, University Park, State College, PA, USA, 1987. [Google Scholar]
- Singh, A.K.; Singh, R.; Maiti, J.; Kumar, R.; Mandal, P.K. Assessment of mining induced stress development over coal pillars during depillaring. Int. J. Rock Mech. Min. 2011, 48, 805–818. [Google Scholar] [CrossRef]
- Suchowerska, A.M.; Merifield, R.S.; Carter, J.P. Vertical stress changes in multi-seam mining under supercritical longwall panels. Int. J. Rock Mech. Min. 2013, 61, 306–320. [Google Scholar] [CrossRef]
- Rezaei, M.; Hossaini, M.F.; Majdi, A. Determination of longwall mining-induced stress using the strain energy method. Rock Mech. Rock Eng. 2015, 48, 2421–2433. [Google Scholar] [CrossRef]
- Du, X.L.; Song, H.W.; Chen, J. Numerical simulation of the evolution of the pressure arch during coal mining. J. China Univ. Min. Technol. 2011, 40, 863–867. (In Chinese) [Google Scholar]
- Mark, C. Science of empirical design in mining ground control. Int. J. Min. Sci. Technol. 2016, 26, 461–470. [Google Scholar] [CrossRef]
- He, G.Q.; Yang, L.; Ling, G.D.; Jia, F.C.; Hong, D. Mine Subsidence Science; China University of Mining and Technology Press: Xuzhou, China, 1994. (In Chinese) [Google Scholar]
- Shi, B. Study on Influence Factors of Water Conservation Mining in Shallow Seam Mine Area in the North Shaanxi Province. Ph.D. Thesis, Xi’an University of Science and Technology, Xi’an, China, 2012. (In Chinese). [Google Scholar]
Figure 1.
Typical layout of partial extraction sites [5]: (a) Planar view of the working face of a room-and-pillar mine; (b) Planar view of the working face of a strip pillar mine; (c) Two-dimensional scheme of a partial extraction site (front view of a partial extraction mine).
Figure 1.
Typical layout of partial extraction sites [5]: (a) Planar view of the working face of a room-and-pillar mine; (b) Planar view of the working face of a strip pillar mine; (c) Two-dimensional scheme of a partial extraction site (front view of a partial extraction mine).

Figure 2.
Example of relationships between the stress concentration factor and the mine size to mining depth ratio for the mining width to pillar width ratio = 1: (a) of models with a mining height of 100 m and a pillar width from 10 m to 25 m; (b) the regression curve for the case with mining depth 200 m and pillar width 10 m.

Figure 3.
The relationship between the mining depth and the average fit constant .
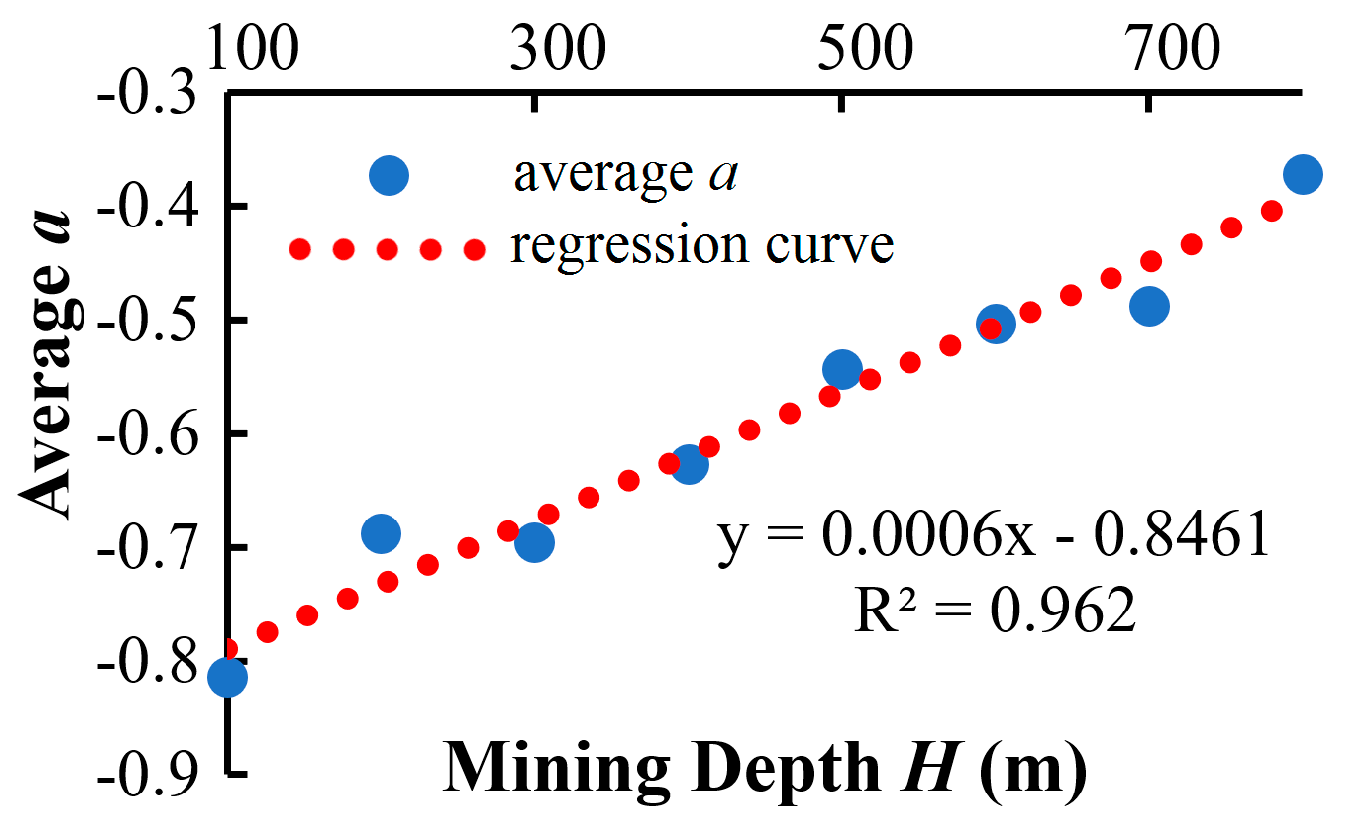
Figure 4.
The effect of the mining width to pillar width ratio on the parameters and . (a) effect on ; (b) effect on .
Figure 4.
The effect of the mining width to pillar width ratio on the parameters and . (a) effect on ; (b) effect on .

Figure 5.
The effect of the overburden elastic modulus on the fit parameters and in Equation (2). (a) effect on ; (b) effect on .
Figure 5.
The effect of the overburden elastic modulus on the fit parameters and in Equation (2). (a) effect on ; (b) effect on .
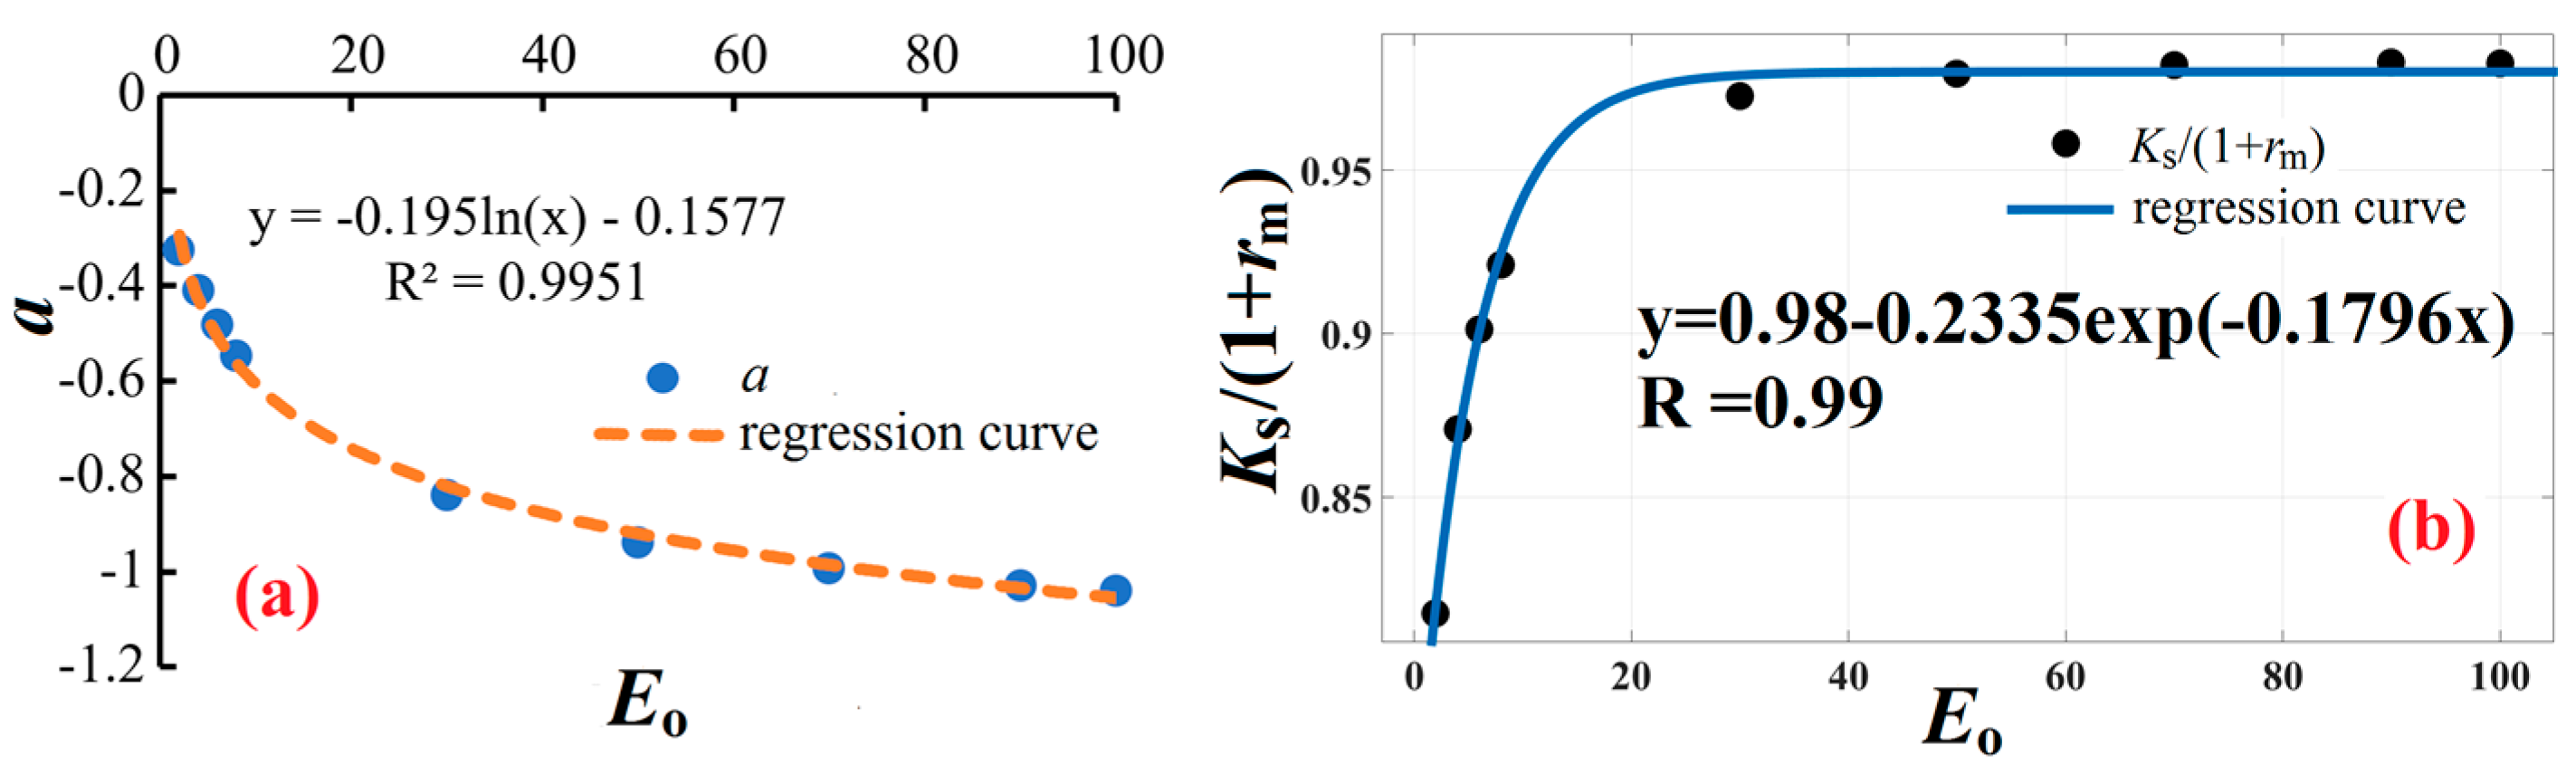
Figure 6.
The planar view of the coal seam for the three-dimensional model. (a) A north–south size to mining depth ratio >3 to 4 and an east–west size to mining depth ratio <3 to 4 are employed. (b) >3 to 4 and >3 to 4 are employed.
Figure 6.
The planar view of the coal seam for the three-dimensional model. (a) A north–south size to mining depth ratio >3 to 4 and an east–west size to mining depth ratio <3 to 4 are employed. (b) >3 to 4 and >3 to 4 are employed.
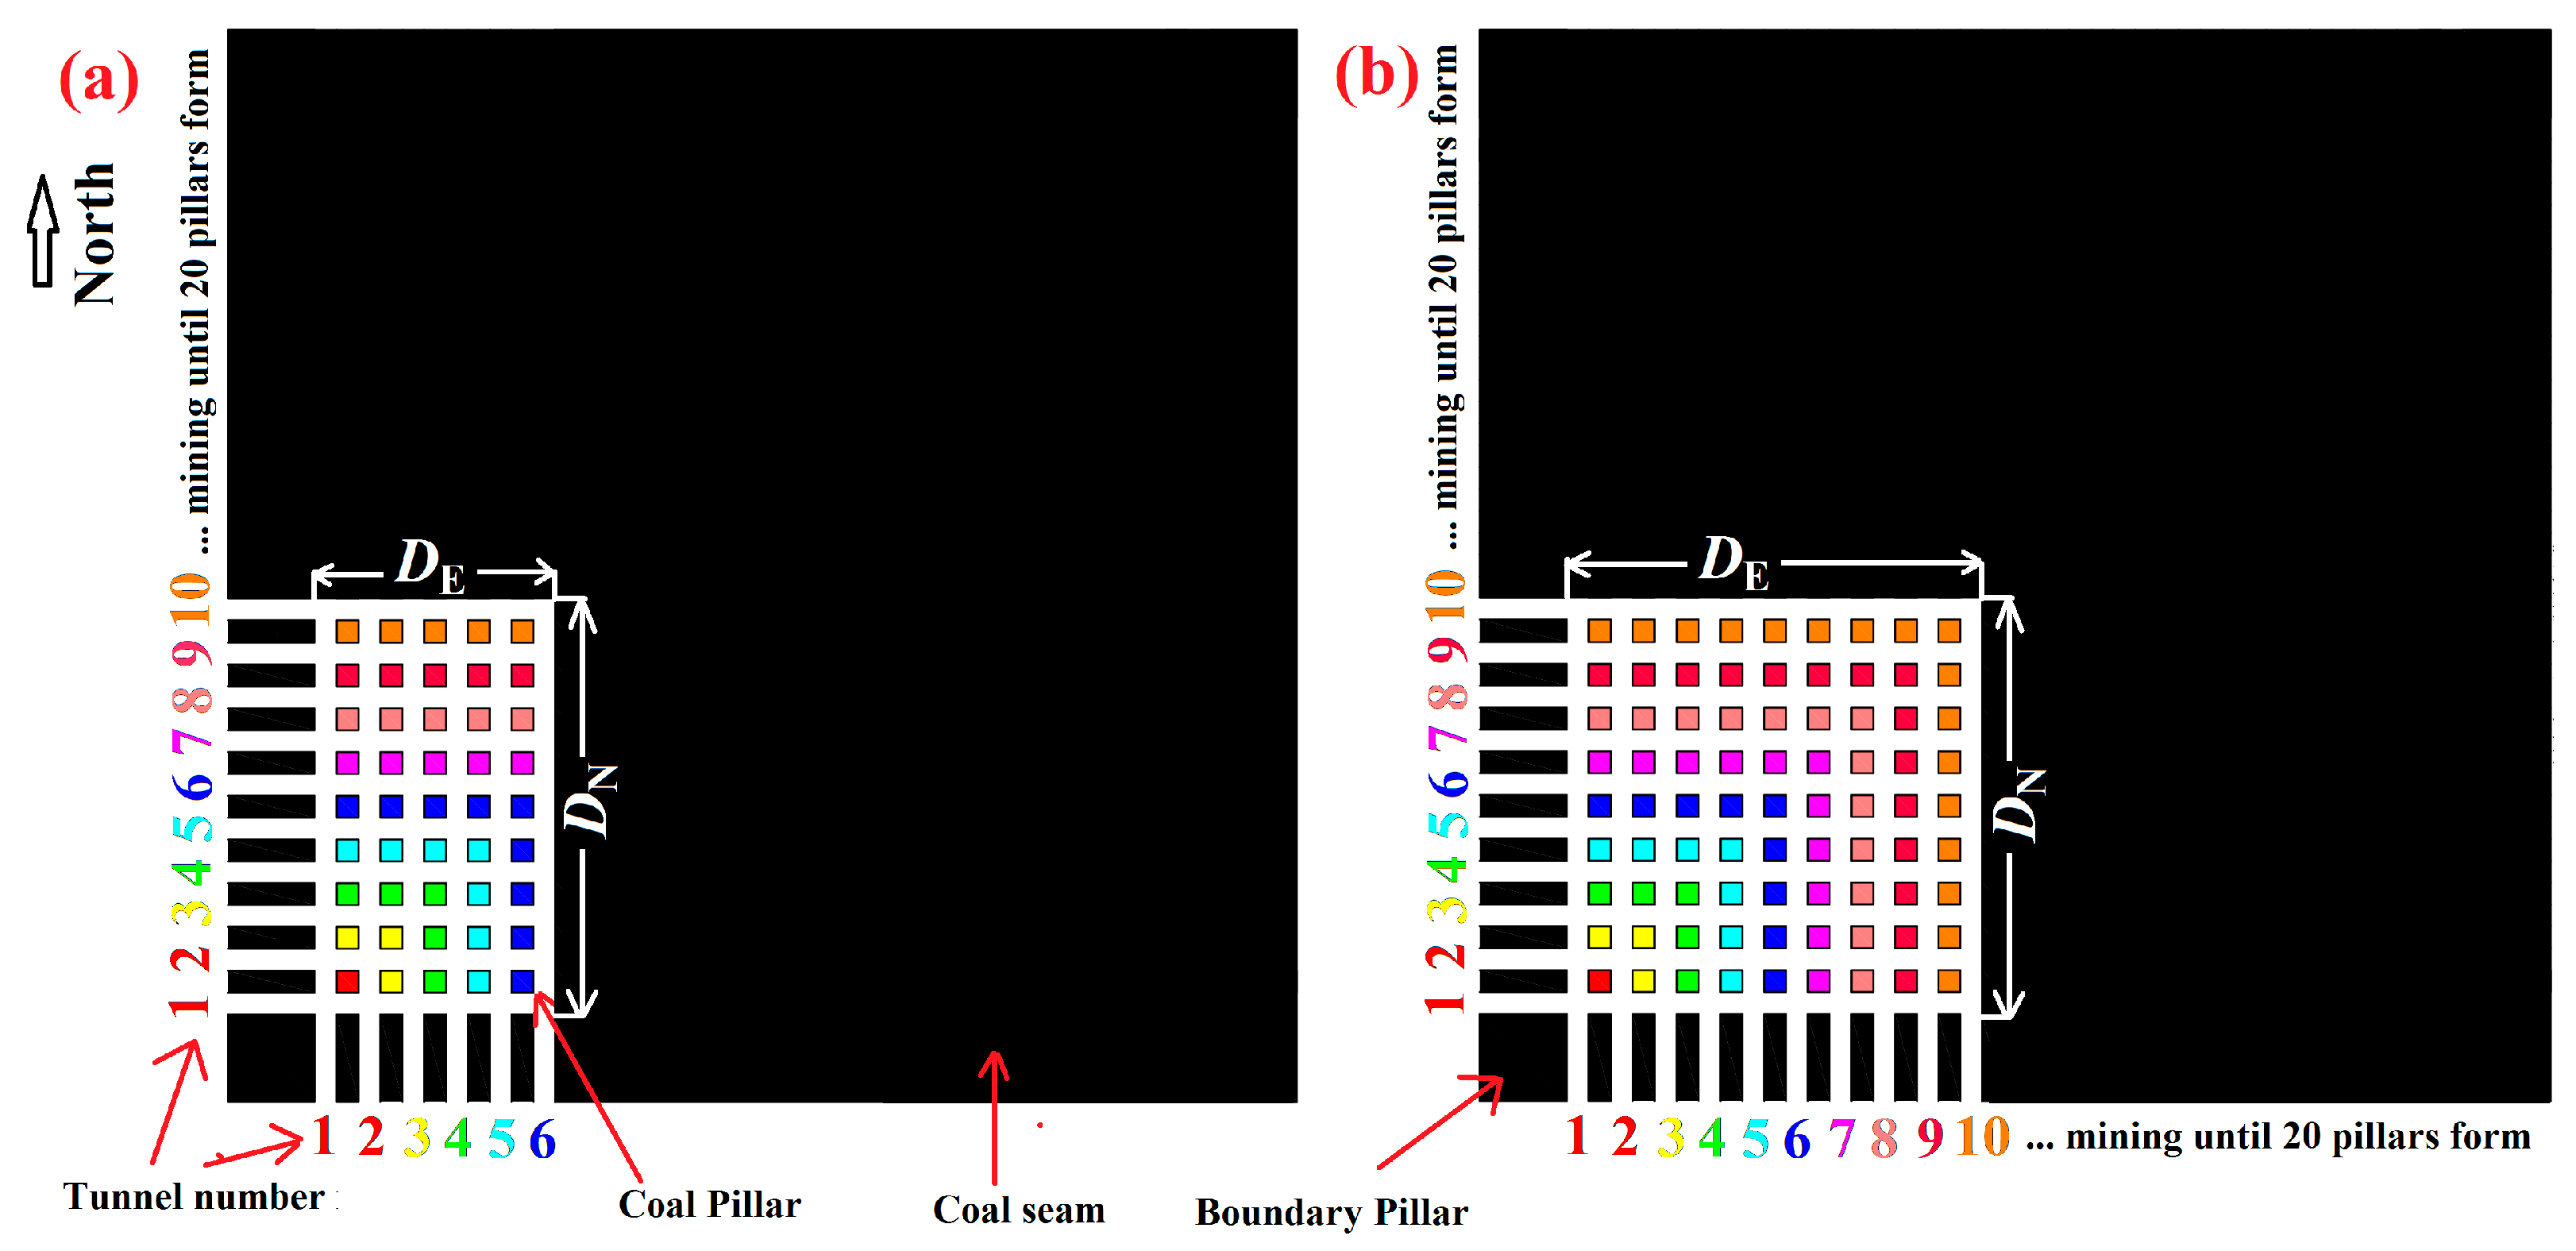
Figure 7.
Simulation results of three-dimensional numerical simulations.

Table 1.
The geometric parameters of models: is mining depth, is pillar width, is mining width, is mine size, and is the ratio of mining width to pillar width. All lengths are in meters.
Table 1.
The geometric parameters of models: is mining depth, is pillar width, is mining width, is mine size, and is the ratio of mining width to pillar width. All lengths are in meters.
| 100 | 14 | 10 | 1066 | 0.71 | 200 | 17 | 20 | 1093 | 1.18 | 300 | 75 | 1575 | 1 | |
| 12 | 10 | 516 | 0.83 | 14 | 20 | 1006 | 1.43 | 400 | 54 | 40 | 2108 | 0.74 | ||
| 10 | 1510 | 1 | 10 | 20 | 1190 | 2 | 40 | 1560 | 1 | |||||
| 9 | 10 | 656 | 1.11 | 7 | 20 | 1073 | 2.86 | 20 | 40 | 2080 | 2 | |||
| 5 | 10 | 670 | 2 | 23 | 1587 | 1 | 45 | 1575 | 1 | |||||
| 12 | 1620 | 1 | 25 | 1525 | 50 | 1550 | ||||||||
| 13 | 1573 | 29 | 1537 | 57 | 1539 | |||||||||
| 15 | 1575 | 34 | 1530 | 67 | 1541 | |||||||||
| 17 | 1547 | 41 | 1517 | 80 | 1520 | |||||||||
| 20 | 1500 | 67 | 50 | 1454 | 0.75 | 50 | 100 | 2050 | 2 | |||||
| 34 | 25 | 1146 | 0.74 | 50 | 1550 | 1 | 100 | 1500 | 1 | |||||
| 25 | 1525 | 1 | 25 | 50 | 1475 | 2 | 134 | 100 | 2206 | 0.75 | ||||
| 13 | 25 | 1127 | 1.92 | 300 | 15 | 30 | 1650 | 2 | 500 | 50 | 1550 | 1 | ||
| 200 | 7 | 1127 | 1 | 20 | 30 | 1680 | 1.5 | 56 | 1512 | |||||
| 8 | 1288 | 25 | 30 | 1735 | 1.2 | 63 | 1575 | |||||||
| 9 | 1449 | 30 | 1530 | 1 | 72 | 1512 | ||||||||
| 10 | 1510 | 35 | 30 | 1785 | 0.86 | 84 | 1596 | |||||||
| 11 | 1507 | 40 | 30 | 1780 | 0.75 | 100 | 1500 | |||||||
| 13 | 1521 | 34 | 1530 | 1 | 125 | 1625 | ||||||||
| 15 | 1515 | 38 | 1558 | 600 | 60 | 3060 | ||||||||
| 27 | 20 | 1195 | 0.74 | 43 | 1505 | 700 | 70 | 3570 | ||||||
| 24 | 20 | 1076 | 0.83 | 50 | 1550 | 800 | 80 | 4080 | ||||||
| 20 | 1500 | 1 | 60 | 1500 | ||||||||||
Table 2.
Mechanical properties of strata: is the cohesion, is the tensile strength, is the internal friction angle, is the elastic modulus, is the Poisson’s ratio, and is the density.
Table 2.
Mechanical properties of strata: is the cohesion, is the tensile strength, is the internal friction angle, is the elastic modulus, is the Poisson’s ratio, and is the density.
| Strata | (MPa) | (MPa) | (°) | (GPa) | (kg/m3) | |
|---|---|---|---|---|---|---|
| Sandstone | 6.36 | 11.6 | 34.6 | 15.1 | 0.15 | 2370 |
| Coal | 0.72 | 2.61 | 42 | 2.2 | 0.27 | 1290 |
| Interface | 0.72 | 2.61 | 42 |
Table 3.
Original parameters of Equation (2) when the mining width to pillar width ratio, = 1. R indicates adjusted R-square values.
Table 3.
Original parameters of Equation (2) when the mining width to pillar width ratio, = 1. R indicates adjusted R-square values.
| R | R | R | ||||||||||||
|---|---|---|---|---|---|---|---|---|---|---|---|---|---|---|
| 100 | 10 | −0.811 | 1.96 | 0.99 | 200 | 23 | −0.677 | 1.84 | 0.99 | 400 | 50 | −0.665 | 2.00 | 0.99 |
| 12 | −0.773 | 1.92 | 25 | −0.715 | 1.95 | 57 | −0.676 | 2.00 | ||||||
| 13 | −0.833 | 1.96 | 39 | −0.724 | 1.94 | 67 | −0.666 | 1.85 | 0.98 | |||||
| 15 | −0.816 | 1.89 | 34 | −0.709 | 1.92 | 0.98 | 80 | −0.565 | 1.74 | 0.99 | ||||
| 17 | −0.821 | 1.95 | 41 | −0.716 | 1.92 | 100 | −0.56 | 1.82 | ||||||
| 20 | −0.811 | 1.84 | 0.98 | 50 | −0.706 | 1.91 | 500 | 50 | −0.627 | 2.03 | ||||
| 25 | −0.834 | 1.92 | 300 | 30 | −0.682 | 1.97 | 0.99 | 56 | −0.536 | 1.77 | ||||
| 200 | 7 | −0.729 | 2.06 | 0.99 | 34 | −0.69 | 1.96 | 63 | −0.589 | 1.86 | ||||
| 8 | −0.599 | 1.79 | 38 | −0.697 | 1.96 | 0.99 | 72 | −0.507 | 1.75 | 0.98 | ||||
| 9 | −0.673 | 2.00 | 43 | −0.724 | 1.82 | 0.98 | 84 | −0.531 | 1.85 | 0.99 | ||||
| 10 | −0.652 | 1.98 | 50 | −0.687 | 1.95 | 100 | −0.511 | 1.83 | 0.98 | |||||
| 11 | −0.728 | 1.98 | 60 | −0.648 | 1.81 | 0.97 | 125 | −0.505 | 1.95 | 0.99 | ||||
| 13 | −0.666 | 1.98 | 75 | −0.739 | 1.80 | 0.96 | 600 | 60 | −0.504 | 1.86 | ||||
| 15 | −0.664 | 1.90 | 400 | 40 | −0.594 | 1.76 | 0.99 | 700 | 70 | −0.488 | 2.01 | 0.97 | ||
| 20 | −0.674 | 1.87 | 45 | −0.662 | 2.00 | 800 | 80 | −0.372 | 1.75 | 0.95 |
Table 4.
Mean value of the parameters of Equation (2) when the mining width to pillar width ratio, = 1.
Table 4.
Mean value of the parameters of Equation (2) when the mining width to pillar width ratio, = 1.
| 1 + | |||||||
|---|---|---|---|---|---|---|---|
| 100 | −0.81 | 1.92 | 500 | −0.54 | 1.86 | 2 | |
| 200 | −0.69 | 1.93 | 600 | −0.50 | 1.86 | ||
| 300 | −0.70 | 1.90 | 700 | −0.49 | 2.01 | ||
| 400 | −0.63 | 1.88 | 800 | −0.37 | 1.75 |
Table 5.
Original parameters of Equation (2) for different mining width to pillar width ratios .
| R | R | ||||||||||
|---|---|---|---|---|---|---|---|---|---|---|---|
| 100 | 2 | 10 | −2.062 | 2.97 | 0.99 | 100 | 0.83 | 10 | −0.726 | 1.78 | 0.98 |
| 1.92 | 25 | −2.135 | 2.84 | 200 | 20 | −0.502 | 1.56 | 0.99 | |||
| 200 | 2 | 20 | −1.972 | 3.07 | 0.98 | 300 | 0.86 | 30 | −0.501 | 1.79 | |
| 50 | −2.343 | 3 | 0.99 | 100 | 0.71 | 10 | −0.509 | 1.69 | |||
| 300 | 30 | −2.078 | 3.34 | 100 | 0.74 | 25 | −0.41 | 1.71 | |||
| 400 | 40 | −2.04 | 3.27 | 200 | 20 | −0.477 | 1.69 | ||||
| 100 | −1.852 | 3.07 | 200 | 0.74 | 50 | −0.446 | 1.67 | 0.94 | |||
| 300 | 1.5 | 30 | −1.179 | 2.4 | 300 | 30 | −0.368 | 1.55 | 0.99 | ||
| 200 | 1.43 | 20 | −1.161 | 2.42 | 400 | 0.74 | 40 | −0.41 | 1.71 | ||
| 100 | 1.11 | 10 | −0.964 | 2.09 | 0.98 | 0.75 | 100 | −0.329 | 1.68 | 0.95 | |
| 200 | 1.18 | 20 | −0.968 | 2.16 | 0.99 | ||||||
| 300 | 1.2 | 30 | −0.911 | 2.21 |
Table 6.
The effect of the mining width to pillar width ratio on the fit constant and the ultimate stress concentration factor .
Table 6.
The effect of the mining width to pillar width ratio on the fit constant and the ultimate stress concentration factor .
| Average | Average | Average | Average | 1 + |
|---|---|---|---|---|
| 1.99 | 243 | −2.07 | 3.11 | 2.99 |
| 1.47 | 250 | −1.17 | 2.41 | 2.47 |
| 1.16 | 200 | −0.95 | 2.15 | 2.26 |
| 1 | 240 | −0.71 | 1.91 | 2 |
| 0.84 | 200 | −0.58 | 1.71 | 1.84 |
| 0.74 | 243 | −0.41 | 1.66 | 1.74 |
Table 7.
Parameters of Equation (2) for different overburden properties. /(1 +) is the ratio of simulated ultimate stress concentration factor to the theoretical , representing a reduction effect of the overburden elastic modulus on simulated .
Table 7.
Parameters of Equation (2) for different overburden properties. /(1 +) is the ratio of simulated ultimate stress concentration factor to the theoretical , representing a reduction effect of the overburden elastic modulus on simulated .
| Poisson’s Ratio Effect = 15 GPa | Elastic Modulus Effect = 0.15 | |||||||
|---|---|---|---|---|---|---|---|---|
| R | /(1 +) | R | ||||||
| 0.1 | −0.7352 | 1.909 | 0.98 | 2 | −0.3258 | 1.629 | 81% | 0.96 |
| 0.2 | −0.7388 | 1.908 | 0.99 | 4 | −0.4092 | 1.742 | 87% | |
| 0.3 | −0.736 | 6 | −0.4822 | 1.803 | 90% | 0.97 | ||
| 0.4 | −0.7623 | 8 | −0.5477 | 1.842 | 92% | 0.98 | ||
| 0.49 | −0.7702 | 30 | −0.8391 | 1.945 | 97% | 0.99 | ||
| 50 | −0.9389 | 1.959 | 98% | |||||
| 70 | −0.9932 | 1.964 | 98% | 0.98 | ||||
| 90 | −1.029 | 1.966 | 98% | |||||
| 100 | −1.04 | 1.965 | 98% | 0.97 | ||||
Table 8.
Relative Error of Equation (7).
| Relative Error | Overestimated (+) | Underestimated (−) | Row Sum |
|---|---|---|---|
| [0, 5%] | 826 | 166 | 992 |
| (5%, 10%] | 329 | 45 | 374 |
| (10%, 15%] | 155 | 15 | 170 |
| (15%, 20%] | 53 | 1 | 54 |
| (20%, 25%] | 10 | 0 | 10 |
| (25%, +∞) | 0 | 0 | 0 |
| Column Sum | 1373 | 227 | 1600 |
© 2018 by the authors. Licensee MDPI, Basel, Switzerland. This article is an open access article distributed under the terms and conditions of the Creative Commons Attribution (CC BY) license (http://creativecommons.org/licenses/by/4.0/).
Share and Cite
MDPI and ACS Style
Yu, Y.; Deng, K.-Z.; Chen, S.-E. Mine Size Effects on Coal Pillar Stress and Their Application for Partial Extraction. Sustainability 2018, 10, 792. https://doi.org/10.3390/su10030792
AMA Style
Yu Y, Deng K-Z, Chen S-E. Mine Size Effects on Coal Pillar Stress and Their Application for Partial Extraction. Sustainability. 2018; 10(3):792. https://doi.org/10.3390/su10030792
Chicago/Turabian StyleYu, Yang, Ka-Zhong Deng, and Shen-En Chen. 2018. "Mine Size Effects on Coal Pillar Stress and Their Application for Partial Extraction" Sustainability 10, no. 3: 792. https://doi.org/10.3390/su10030792
Note that from the first issue of 2016, this journal uses article numbers instead of page numbers. See further details here.