A Multi-Criteria Goal Programming Model to Analyze the Sustainable Goals of India


1
Department of Statistics & Operations Research, Aligarh Muslim University, Aligarh 202002, India
2
Brandenburg University of Technology Cottbus-Senftenberg, Platz der Deutschen Einheit 1, 03046 Cottbus, Germany
*
Author to whom correspondence should be addressed.
Sustainability 2018, 10(3), 778; https://doi.org/10.3390/su10030778
Submission received: 27 November 2017
/
Revised: 26 February 2018
/
Accepted: 9 March 2018
/
Published: 12 March 2018
(This article belongs to the Special Issue Sustainability and Ethics: Reflections on the UN Sustainable Development Goals)
Abstract
:There is an ever-growing demand for sustainable development (SD) plans, in order to foster a country’s economic growth by implementing suitable policies and initiative programs for the development of the primary, the secondary and the tertiary sectors. We present a multi-criteria modeling approach using the linear programming problem (LPP) framework for a simultaneous optimization of these three sectors. Furthermore, we develop a fuzzy goal programming (FGP) model that provides an optimal allocation of resources by achieving future goals on the gross domestic product (GDP), the electricity consumption (EC) and the greenhouse gas (GHG) emissions. Furthermore, a weighted model of FGP is presented to obtain varying solutions according to the priorities set by the decision-maker for achieving future goals of GDP growth, EC and GHG emissions. The presented models provide useful insight for decision-makers when implementing strategies across different sectors. As a model country, we chose India by the year 2030. A study of economic policies and sustainable development goals (SDGs) for India is finally carried out.
1. Introduction
Today, sustainable development (SD) is everybody’s concern, for developing as well as for developed countries. SD is necessary to meet human goals while sustaining natural resources upon which economies and societies depend. To tackle the problem of SD, the UN General Assembly on September 2015 formally adopted a set of 17 SD goals. (The SDGs are: no poverty, zero hunger, good health and well-being, quality education, gender equality, clean water and sanitation, affordable and clean energy, decent work and economic growth, industry innovation and infrastructure, reduced inequalities, sustainable cities and communities, responsible consumption and production, climate action, life below water, life on land, peace, justice and strong institutions and partnership for sustainable development.) The main target of the UN is to achieve these goals in every sector from the year 2016–2030. India covers 6.4% of the world land area and has 17% of the world population, but nearly a quarter of its population lives without regular or reliable access to electricity. India’s per-capita GDP (nominal) is around USD 1408 per annum, which is considered to be very low among the developing countries. Around 30% of the population in India lives in poverty; about 1.77 million people are homeless; and 4.9% of the population (aged 15 years and above) is unemployed. The per-capita electricity consumption stands low at 917 kWh, which is barely one third of the world’s average consumption. In recognition of the growing problem of climate change, India declared a voluntary goal of reducing the emissions intensity of its GDP by 20–25 percent by 2020 and by 33–35 percent by 2030. In 2015–2016, the per-capita energy consumption was 22.042 gigajoules (0.527 Mtoe). Due to rapid economic expansion, India has one of the world’s fastest growing energy markets and is expected to be the second largest contributor to the increase in global energy demand by 2035, accounting for 18% of the rise in the global energy consumption. India has the world’s fifth largest wind power market and also plans to add about 100,000 MW of solar power capacity by 2030. India has also targeted to increase the contribution of nuclear power to overall electricity generation capacity from 4.2–9.0% within 25 years. According to an Asian Development Bank report, the approximate cost of climate change adaptation for India in the energy sector alone would be about USD 7.7 billion (at 2014–2015 prices) between now and 2030. India would need around 206 billion USD (at 2014–2015 prices) to achieve the SDGs in agriculture, forestry, fisheries infrastructure, water resources and ecosystems between the years 2016 and 2030. The report also projects the economic damage and losses in India from climate change to be around 1.8% of its GDP annually by 2050. Estimates by NITI Aayog indicate that the mitigation activities for moderate low carbon development would cost around USD 834 billion till 2030 at 2011 prices.
In the past decades, a variety of sustainable development models has been developed. Ramanathan and Ganesh [1,2] used the goal programming technique and an analytic hierarchy process by incorporating different quantitative and qualitative criteria for energy-economy-environmental systems. Mezher et al. [3] formulated a multi-objective LGP model for Lebanon and considered two priority structures, economy (costs, efficiency, energy conservation and employment generation) and environment, in order to allocate specific energy resources to the various household end-users. Borges and Antunes [4] developed a fuzzy multiple objective model to study the relationships between the economy and the energy sector on a national level. Han et al. [5] proposed a multi-objective optimization model to determine available technologies to produce electricity and treat CO2 to maximize the expected profits and minimize the financial risk of handling uncertain environments. Akenji and Bengtsson [6] discussed the role of sustainable consumption and production in the SDGs and also how sustainable consumption and production objectives could be reflected efficiently in this emerging global policy framework. Jayaraman et al. [7,8,9,10,11] developed FGP models and weighted FGP models that integrate different sectors of the UAE and provide a view of how much resources should be allocated to different sectors simultaneously to achieve SDGs on GDP growth, electricity consumption and GHG emissions in the UAE. The work in Nomani et al. [12] proposed an FGP model to analyze the SDGs of India by the year 2030 with reference to the key economic sectors of India. Schult et al. [13] suggested mixed-integer linear programming methods to solve large-scale input-output systems that describe an optimal allocation of the world’s resources to operate the global economy in a more sustainable way. Jayaraman et al. [14] developed a stochastic goal programming model with a satisfaction function that integrates optimal resource (labor) allocation to simultaneously satisfy conflicting criteria related to economic development, energy consumption, workforce allocation and greenhouse gas emissions for the United Arab Emirates. Bowen et al. [15] identified three key challenges for implementing the SDGs: cultivating collective action by creating inclusive decision spaces for stakeholder interaction across multiple sectors and scales; making difficult trade-offs, focusing on equity, justice and fairness; and ensuring mechanisms exist to hold-to-account societal actors regarding decision-making, investment, action and outcomes. Pradhan et al. [16] analyzed the SDG interactions for 227 countries by using synergies and trade-offs. A significant positive correlation between a pair of SDG indicators is classified as a synergy, while a significant negative correlation is classified as a trade-off. They rank synergies and trade-offs between SDG pairs on global and country scales in order to identify the most frequent SDG interactions. Oliveira [17] discussed how the lack of concrete intergenerational principles affects (short- and long-term) success in SDGs.
In this paper, we develop a fuzzy goal programming model to analyze the sustainable development goals of India by considering the future goals: GDP growth, energy consumption and GHG emissions.
2. Multi-Criteria Fuzzy Goal Programming
Decision-making is one of the constant challenges in our day-to-day lives. In recent decades, researchers have emphasized the use of multi-criteria decision-making (MCDM) models for complex decisions-making scenarios. MCDM aims at improving the quality of decisions by making the process more explicit, rational and efficient. It is concerned with structuring and solving decision-making problems involving multiple criteria. MCDM is concerned with selecting the best suitable solution from a set of available alternatives, which are evaluated with respect to two or more criteria. Incredible efforts and significant advances have been made towards the development of numerous MCDM methodologies to solve different types of problems. Goal programming (GP) is a powerful and flexible technique that can be applied to a variety of decision-making problems involving multiple objectives. GP was developed by [18] and turned out to be a commanding technique to solve MCDM problems. GP has been applied to various areas such as economics, accounting, engineering, agriculture, marketing, transportation, finance and other types of conflicting contexts. Several researchers have proposed an overview of the current state of the art in GP in which the decision-makers set some acceptable aspiration levels for their goals, say , and try to achieve these goals as closely as possible. The purpose of GP is to minimize the deviation between the achievements of goals, say and these acceptable aspiration levels, Therefore, GP can be expressed as follows:
Here, K is the total number of goals, is the coefficient matrix, is the right-hand side of the constraint coefficient, is the k-th objective and is the aspiration level of the k-th goal. In many real-life decision-making problems, the variants of GP such as lexicographic GP, weighted GP and MINIMAX GP are also applied. The above-stated GP model can be rewritten as:
where and are respectively over- and under-achievement of the k-th goal; all other variables are defined as above.
Still, one of the major problems that decision-makers face is the modeling of ill-conditioned optimization problems or the problems where the coefficients are imprecise and vague in nature. Here, most classical methods of mathematical programming failed to optimize such problems, since they require that the given input data are precise and valid. Zadeh [19] suggested the concept of fuzzy sets as a possible way of improving the modeling of vague parameters. Zimmermann [20] further developed the fuzzy programming approach to solve multi-criteria decision-making problems. Bellman and Zadeh [21] introduced the concept that the constraints and goals in such situations may be viewed as fuzzy in nature. In multi-objective linear programming problem, if an aspiration level is introduced to each of the objectives, then these fuzzy objectives are termed as fuzzy goals.
A general mathematical model of the fuzzy goal programming model can be stated as: Find to optimize the following fuzzy goals:
where X is an n-dimensional decision vector, the symbol ⪰ (the type of fuzzy-max) referring to that should be approximately greater than or equal to the aspiration level signifies that the decision-maker is satisfied even if less than up to a certain limit, the symbol ⪯ (the type of fuzzy-min) referring to that should be approximately less than or equal to the aspiration level up to a certain tolerance limit, the symbol ≅ (the type of fuzzy-equal) referring to that should be in the vicinity of the aspiration signifies that the decision-maker is satisfied even if greater than (or less than) up to a certain limit, is the k-th fuzzy goal constraints, is the number of fuzzy-max goal constraints, is the number of fuzzy-min constraints and is the number of fuzzy-equal constraints.
For fuzzy-min, the membership function is defined as:
where is the upper tolerance limit (see Figure 1).
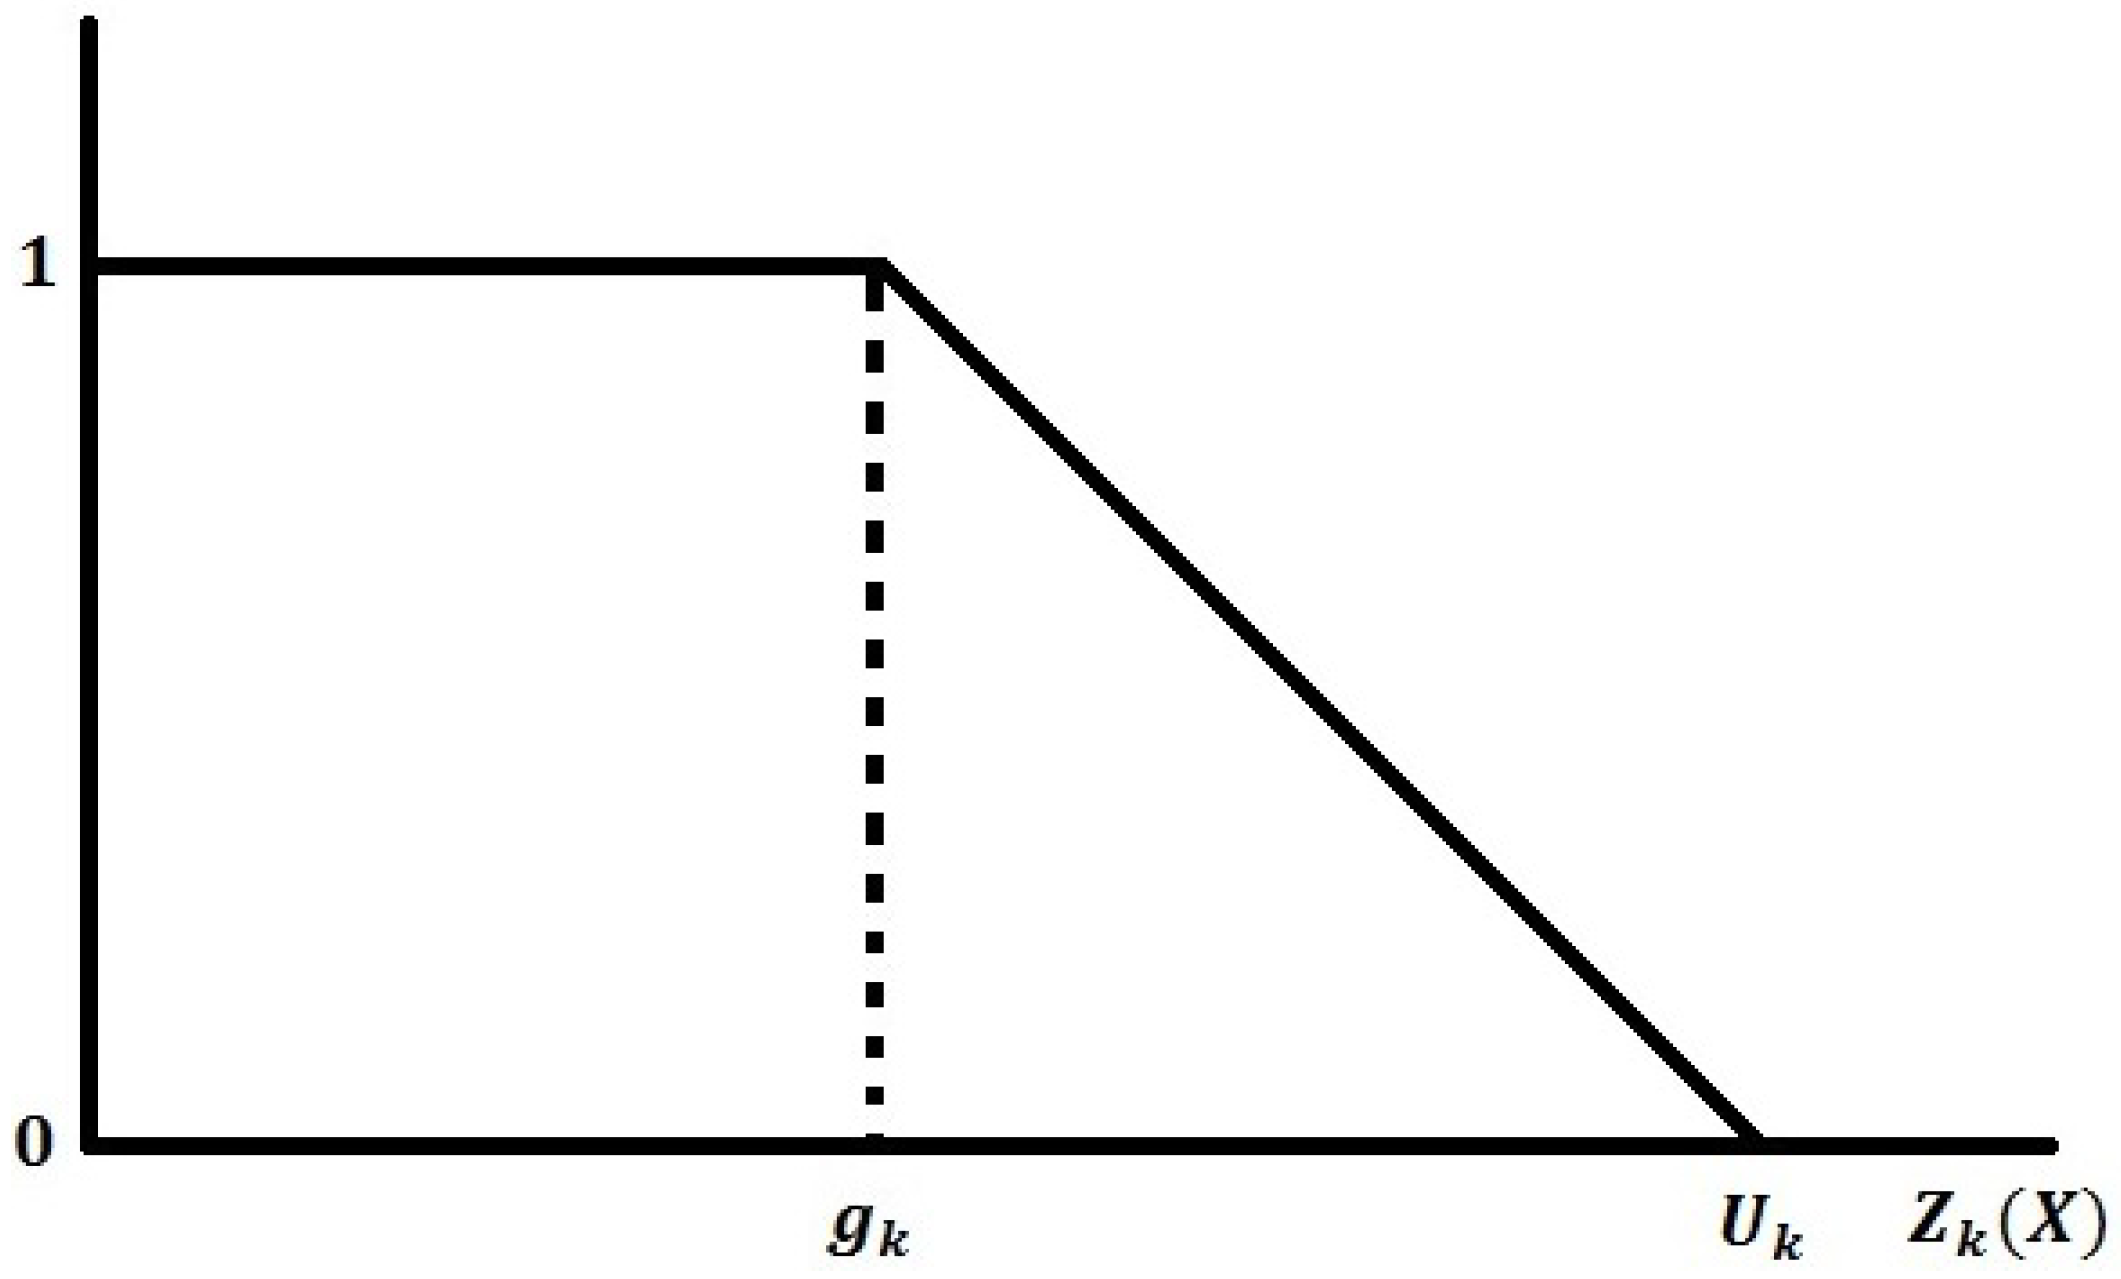
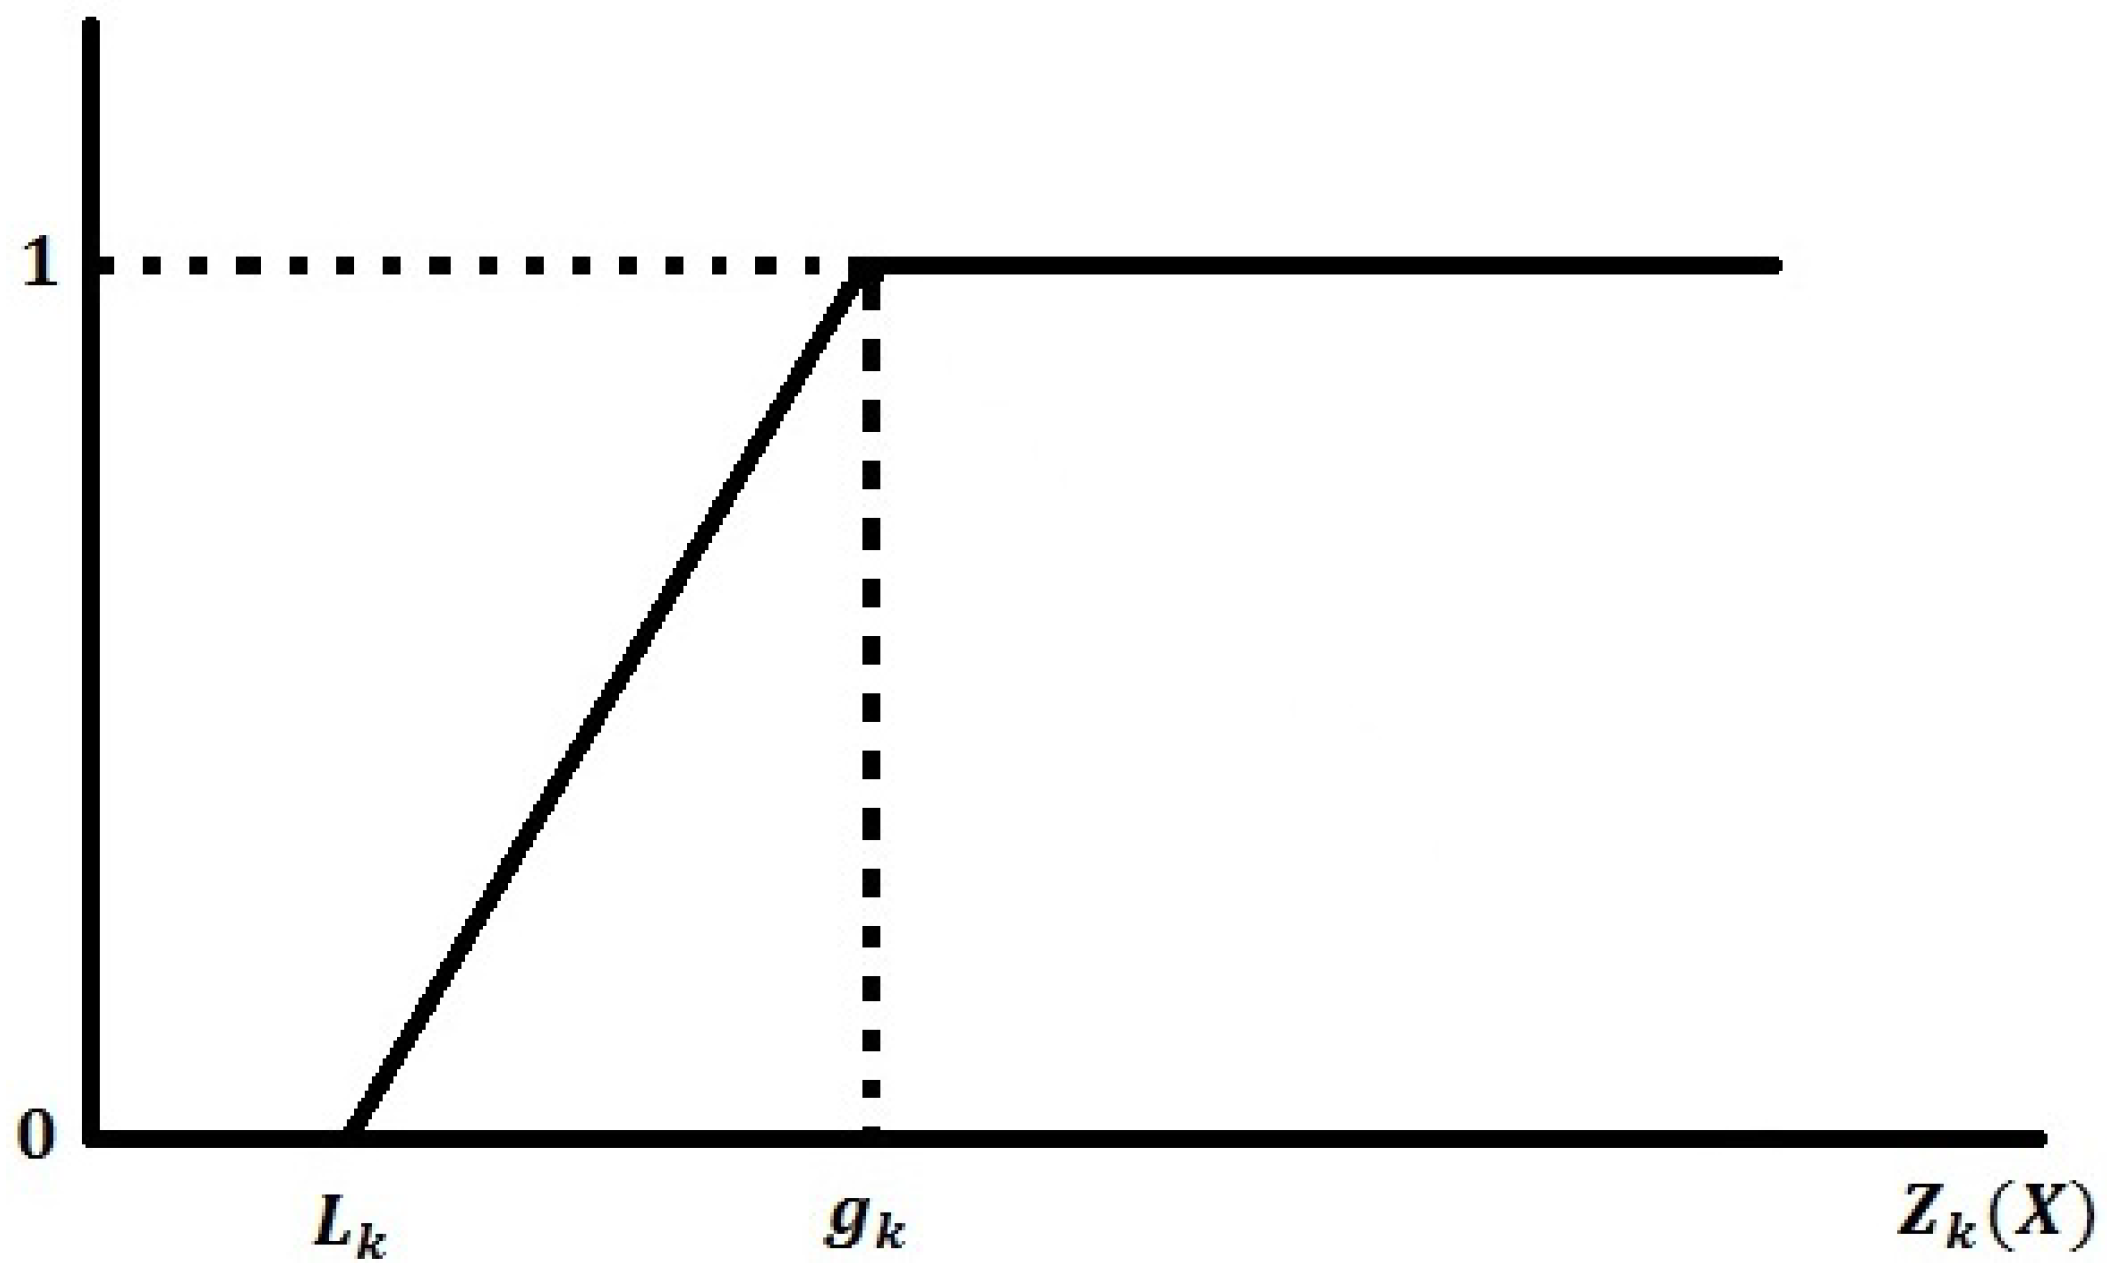
For fuzzy-max, the membership function is defined as:
where is the lower tolerance limit for the k-th fuzzy goal (see Figure 2).
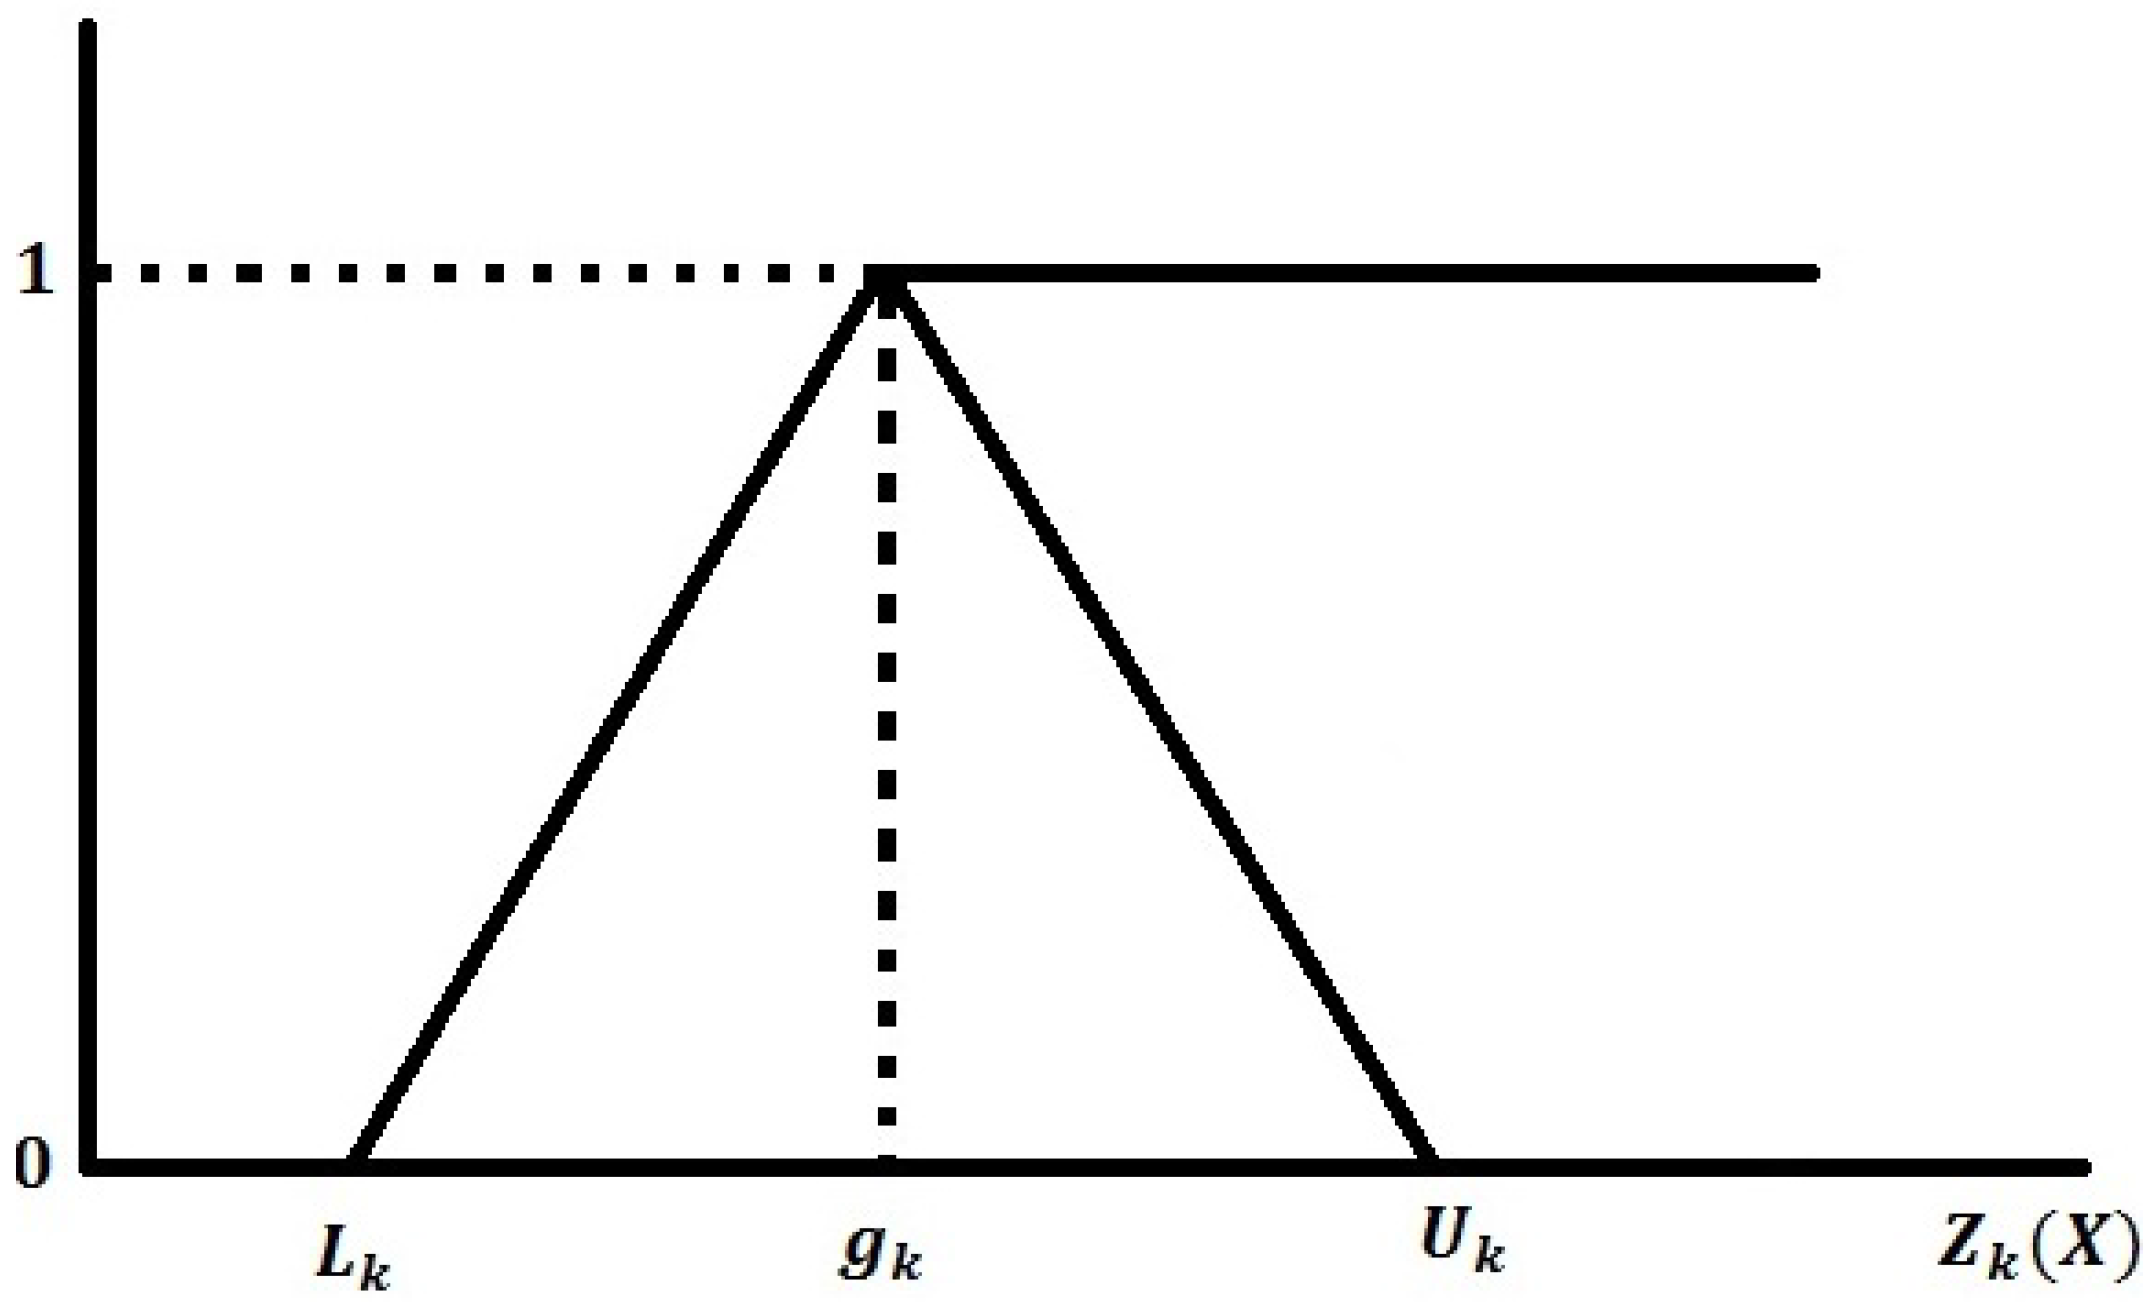
In the case of the fuzzy goal of type , i.e., fuzzy-equal, the membership function is defined as (see Figure 3):
A fuzzy constraint is a subset of X characterized by its membership function . The linear membership function for the fuzzy constraint is given by:
Here, is the tolerance interval. Using these definitions, the fuzzy goal programming model can be written as:
Weighted Fuzzy Goal Programming
If the decision-maker is more interested in a direct comparison of the objectives, then the weighted FGP model is used preferably. In the weighted additive approach, weights are attached to each of the objectives to measure the relative importance of the deviations from their target. WFGP handles several objectives simultaneously by establishing a specific numeric weight for each of the objectives and then finds a solution that comes close to each of these goals. A popular choice for the normalization of relative weights is the range of the corresponding objective (between the best and the worst possible values). The relative weights may be any real number, where the greater the weight, the greater the assigned importance to minimize the objective function.
Here, is the relative weights attached to each objective.
3. An Overview of Socio-Economic Studies about India
India can be divided into five geographical regions, namely northern, eastern, western, southern and northeastern region, respectively.
The northern region consists of seven states and two union territories, which are Haryana, Himachal Pradesh, Jammu and Kashmir, Punjab, Rajasthan, Uttar Pradesh, Uttarakhand, Chandigarh and Delhi. Rajasthan (342,239 km2) is the largest state area-wise among seven states that are in the northern region of India. Uttar Pradesh (243,290 km2) area comes second in the North Regions, but Uttar Pradesh is ahead of these states regarding population. The total population of Uttar Pradesh is 199.8 m, which is the highest population of any state in all of India. Rajasthan comes second with 68.5 m. According to the census, 65,814,715 people in Uttar Pradesh are engaged in work activities, due to which Uttar Pradesh’s GDP is $225 billion, which is much higher than the rest of the states of the northern region. The total population of Delhi, which is the capital of India, is 16.8 m, out of which 5,587,049 are engaged in work activities. Delhi’s GDP is $96 billion, which is higher than Punjab, Jammu and Kashmir, Haryana and Uttarakhand. The per-capita electricity consumption of Delhi has been found to be the highest, that is the per-person consumption of electricity is 1651.26 kWh per year. In summary, the total area of the northern region is 1,013,093 km2, and the total population is around 370 m, out of which 130 m people are engaged in work activities. The northern region of India has a GDP greater than $650 billion, and the per-capita yearly consumption of electricity is 833 kWh. Table 1 shows a summary of the information for different states and union territories of northern India.
The western region of India consists of five states and two union territories, which are Gujarat, Madhya Pradesh, Chhattisgarh, Maharashtra, Goa, Daman and Diu and Dadra and Nagar Haveli. The western part of India has three big states, which are Gujarat (196,024 km2), Maharashtra (307,713 km2) and Madhya Pradesh (308,350 km2). Maharashtra has the highest population of 112.4 m, and it has more employment in comparison to other states of the western region of India; therefore, Maharashtra is said to be an economic state of India. Maharashtra’s GDP is $390 billion, which is the highest among the other states of India. Madhya Pradesh (31,574,133) comes second in providing jobs or employment in the western region, whereas Gujarat’s GDP ($199 billion) comes in second place. The per-capita electricity consumption in Gujarat is 1633 kWh, which is highest among other states in the western region, while the per-capita electricity consumption is 1028.22 kWh in Maharashtra. In summary, the total area of the western region is 951,583 km2, and its total population is around 280 m, out of which 110 m people are engaged in work activities. The western region of India has a GDP of more than $759 billion, and the per-capita consumption of electricity is 1201 kWh. Table 2 gives a summary of data from different states and union territories of western India.
The southern region of India consists of four states and two union territories, which are Andhra Pradesh, Karnataka, Kerala, Tamil Nadu, Lakshadweep and Puducherry. Andhra Pradesh (275,045 km2) is the largest state among that four states in the southern region of India. In the southern region, Andhra Pradesh also has the highest population, which is 84.6 m; Tamil Nadu comes in second place with a population of 72.1 m; and Karnataka is in third place with 61.1 m inhabitants. Among the states with the lowest population in the southern region is Kerala, which is only 33.4 m. According to the census, 39,422,906 inhabitants in Andhra Pradesh are engaged in work activities, due to which Andhra Pradesh’s GDP is $220 billion, which is double Kerala’s GDP. The per-capita electricity consumption of Andhra Pradesh has been found to be highest, where per-person consumption is 1157 kWh of electricity, while in Tamil Nadu, it is 1131.58 kWh, 903.24 kWh for Karnataka and 525.25 kWh for Kerala. In summary, the total area of the southern region is 636,351 km2, and its total population is around 250 m, out of which 80 m people are engaged in work activities. The southern region of India has a GDP of more than $700 billion, and the per-capita energy consumption is 1098 kWh. Table 3 gives a summary of data from different states and union territories of southern India.
The eastern region of India consists of five states and one union territory, which are Bihar, Jharkhand, Odisha, West Bengal, Sikkim and Andaman and the Nicobar Islands. Odisha (155,707 km2) is the largest state among the five states in the eastern region of India. Bihar with 94,163 km2 of area has the highest population in the eastern region, which is 104.1 m; West Bengal comes in second place with a population of 91.3 m; and Odisha and Jharkhand are in third and fourth place with 42 m and 33 m inhabitants, respectively. According to the census, around 30–40 m inhabitants in both Bihar and West Bengal are engaged in work activities, but West Bengal’s contribution to India’s GDP is much more than Bihar, which is approximately $141 billion due to its agricultural and mineral resources. The per-capita electricity consumption of Bihar has been found to be lowest, where per-person consumption is only 122.11 kWh of electricity, while for the other eastern states, it is as follows: Jharkhand (880.43 kWh), Odisha (874.26 kWH), Sikkim (850 kWh) and West Bengal (550.16 kWH). In summary, the total area of the eastern region is 433,681 km2, and its total population is around 260 m, out of which 80 m people are engaged in work activities. The eastern region’s of India having a GDP of more than $350 billion, and the per-capita consumption of electricity is 521 kWh. Table 4 gives a summary of data from the different states and union territories of eastern India.
The northeastern region of India consists of seven small states, which are Assam, Manipur, Meghalaya, Nagaland, Tripura, Arunachal Pradesh and Mizoram. All the states of the northeastern region are smaller in their geographical area and also have less inhabitants. The northeastern region of India covers an area of 0.262 million sq. km. accounting for 7.9% of the total geographical area of the country and 3.77% of the total population of India. Arunachal Pradesh (83,743 km2) is the largest state among the seven states in the eastern region of India. The highest population in the region is in Assam, which has a population of 31.2 m, which is 1/7 of the Uttar Pradesh population. Furthermore, the northeastern region has a lesser contribution to India’s GDP, where all the states contribute a total of $58 billion to the aggregate GDP with per-capita consumption of 292 kWh. However, despite the abundance of resources, the region has lagged behind many Indian states in vital development indicators. Table 5 gives a summary of the data from different states and union territories of northeastern India.
In this paper, we have considered employment as a decision variable, which is very important for sustainable development. The sustainable goals can only be achieved by achieving the following goals related to gross domestic product, electricity consumption and GHG emissions, which are essential for the successful operation of the modern economy. India was the fastest growing economy in the world, with an increase of 7.6 percent in GDP, during the year 2015–2016. This was the quickest growth of the Indian economy since 2011–2012. However, since 2015–2016, there has been some decline in India’s economic growth, which is mainly due to the lack of employment generation. After 2012, the pace of employment in the country has been meager. According to the latest data, in these nine sectors, 135,000 jobs were created during 2015, while 490,000 in 2014, and 1,250,000 jobs were created in 2009. Between 1999–2000 and 2004–2005, 7,500,000 jobs were created in the non-agricultural sector every year in the country. However, during this time, about 20 million new people joined the job seekers queue every year. However, between 2004–2005 and 2011–2012, only two million people gained employment per year. Due to continuous private and public investment, the growth rate of GDP during the period 2004–2005 to 2011–2012 was 8.4 percent, and in the meantime, 7,500,000 new employment positions were created in the industrial and services sector. Increasing employment strengthens economic growth: as employment grows continuously, the economy of the country moves from the primary sector to the secondary sector and then to the tertiary sector. The tertiary area is also called the service sector, which includes trade, communication, transport, finance and insurance, the hotel industry, real estate and social services. Therefore, we have considered in our formulated model that the tertiary sector will generate maximum employment, so that the goals of sustainable development can be achieved.
4. India’s Sustainable Development: A Case Study
India signed the UNFCCC in 1992 and ratified it in 1993. According to the INDCReport of the UNFCCC submitted by India in 2015 (see below for further details), India will aim to improve its GDP by 33–35 percent until 2030 with respect to the 2005 levels and also try to increase the share of non-fossil fuel-based electricity production to 40 percent until then. India will try to increase the forest cover by 2030, which will absorb CO2, one of the main gases responsible for global warming. The Indian state government carries out an action plan by which the transformation of India’s carbon-intensive sectors is made possible. This contributes to the country’s vision of an overall ambitious fight against climate change by focusing on a technology transfer and capacity building. The cost of climate action from 2015–2030 is estimated to total more than USD 2.5 trillion.
The financial requirement for India to meet its costs for food security is around INR 46 lakh crores (USD 729 billion) from 2015–2024. India will require around INR 55 lakh crores (USD 880 billion) till 2030 to achieve healthy lives and promote well-being for all at all ages. In order to achieve quality education and promote life-long learning opportunities, the total financial requirement for India is of the order of INR 142 lakhs crores (USD 2258 billion). India requires a sum of INR 89 lakh crores (USD 1408 billion) to ensure gender equality by 2030. For access to and availability of water and sanitation for all, India is estimated to require a sum of INR 13 lakh crores (USD 199 billion) till 2030. Infrastructure development has always been on the top of the agenda for India for which a financial requirement of INR 119 lakh crores (USD 1900 billion) will be required. To make cities inclusive, safe, resilient and sustainable, India will require a sum of INR 131 lakh crores (USD 2067 billion). This includes housing for all, development and planning of cities, efficient transport systems, public spaces and other components of urban infrastructure costs. The cumulative costs of low carbon strategies have been estimated to be around INR 62.5 lakh crores (USD 992 billion), between 2011 and 2030.
The various sustainable development goals of India are:
- Goal 1
- End poverty in all its forms everywhere
- Goal 2
- End hunger, achieve food security and improved nutrition and promote sustainable agriculture
- Goal 3
- Ensure healthy lives and promote well-being for all at all ages
- Goal 4
- Ensure inclusive and equitable quality education and promote life-long learning opportunities for all
- Goal 5
- Achieve gender equality and empower all women and girls
- Goal 6
- Ensure availability and sustainable management of water and sanitation for all
- Goal 7
- Ensure access to affordable, reliable, sustainable and modern energy for all
- Goal 8
- Promote sustained, inclusive and sustainable economic growth, full and productive employment and decent work for all
- Goal 9
- Build resilient infrastructure, promote inclusive and sustainable industrialization and foster innovation
- Goal 10
- Reduce inequality within and among countries
- Goal 11
- Make cities and human settlements inclusive, safe, resilient and sustainable
- Goal 12
- Ensure sustainable consumption and production patterns
- Goal 13
- Take urgent action to combat climate change and its impacts
- Goal 14 and 15
- Conserve and sustainably use the oceans, seas and marine resources for sustainable development; protect, restore and promote sustainable use of terrestrial ecosystems, sustainably manage forests, combat desertification, halt and reverse land degradation and halt biodiversity loss.
India’s INDC Review Report
Some key points of India’s INDC report [22] are the following:
- India has pledged to reduce the emissions intensity of its GDP by 33–35 percent by 2030, with respect to the 2005 levels.
- India is willing to obtain 40 percent of its total electricity capacity from non-fossil fuel-based energy sources.
- CSE’s projections show that in 2030, India will have about 250–300 GW of solar and wind energy capacity.
- India’s forestry target is also very ambitious. It intends to create an additional carbon sink of 2.5–3 billion tonnes of CO2 through additional forests by 2030.
- CSE’s projections shows that in 2030, India’s total emissions could reach about 4.5–5.0 billion tonnes. Its per-capita emissions would be about 3.5 tonnes.
As a measurement of sustainable development, we focus on GDP growth, electricity consumption, GHG emissions and employment across different economic activities of India. As defined in [12], we use the following nine sectors in our FGP model:
- (i)
- Agriculture, forestry and fishing ,
- (ii)
- Mining and quarrying ,
- (iii)
- Manufacturing ,
- (iv)
- Electricity, gas, water supply and other utility services ,
- (v)
- Constructions ,
- (vi)
- Trade, repair, hotels and restaurants ,
- (vii)
- Transport, storage, communication and services related to broadcasting ,
- (viii)
- Financial, real estate and professional services and
- (ix)
- Community, social and personal services .
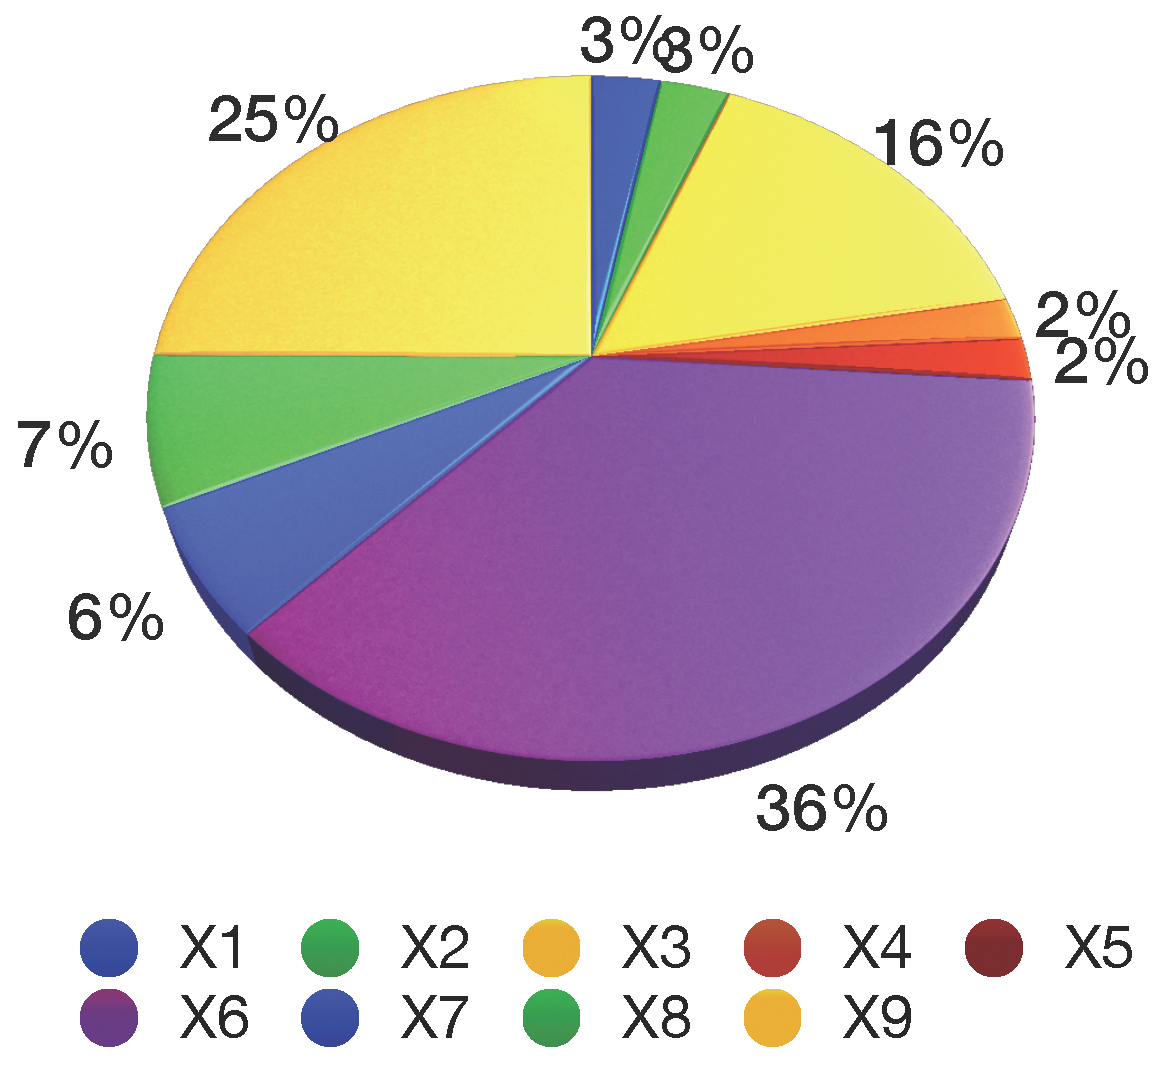
Here, represents the number of employees in sector i. Table 6 and Figure 4, Figure 5 and Figure 6 show the sector-wise contribution of the GDP, electricity consumption, GHG emissions and the number of employees.
India set the goal of 8.58% annual growth in GDP (G1) and expected to have a GDP of 367,935.59 billion INR by the year 2030. The largest GDP contributors are from the financial, real estate and professional services sector with 20,557.06 billion INR, followed by the manufacturing sector with 17,702.32 billion INR, whereas the mining and quarrying sector is at the other end of this range with a mere 2,826.05 billion INR contribution. The electricity consumption (G2) is projected to be 2,684,750.195 GWh by 2030 at a 10.67% growth rate. The largest electricity consumption is accounted for by financial, real estate, and professional services with 185,576 GWh, followed by 159,854 GWh due to the manufacturing sector. The lowest electricity consumption was found in electricity, gas, water supply and other utility services with 21,005.3 GWh. The total GHG emissions (G3) in India were 1904.73 million tons, a number rapidly increasing over the years to come, so India set the goal to restrict the GHG emissions to at most 5700 million tons by 2030. Energy-related activities contributed the most to GHG emissions with 719.30 million tons, followed by 334.41 million tons due to agriculture, forestry and fishing, while financial, real estate and professional services contributed the least to the GHG emissions with 54.73 million tons. The number of employees in the year 2014 was 462,410 million, and projecting a labor market growth of 3%, the estimated number of employees in the year 2030 is estimated to reach 742,032 million. Table 7 represents the identified sustainable development goals of India.
5. Model Formulation and Numerical Results
In our model for sustainable development, we make use of a formulation as a linear programming problem to determine the optimum allocation of employees across different economic activities to sustain GDP growth, electricity consumption and GHG emissions. The objectives are formulated as follows:
Here, the following symbols are used:
- Objective function optimizes the per-capita gross domestic product across the j-th economic sector
- Objective function optimizes the per-capita gross electricity consumption across the j-th economic sector
- Objective function optimizes the per-capita green house gas emissions across the j-th economic sector
- The first constraint places restrictions due to the overall employment level
- The second constraint incorporates total GDP for the economic sectors
- The third constraint incorporates total GVA for the economic sectors
- The fourth constraint places restrictions on employment
- is the number of employees in the j-th contributing sectors
- is the current employment in the j-th sector
- is the employment goal in the j-th sector at an annual growth rate of 3%
- is the gross domestic product in the j-th sector
- is the electricity consumption in the j-th sector
- is the GHG emissions in the j-th sector
- is the GDP goal for sustainable development is the gross value-added goal for sustainable development
The mathematical formulation for the model is as follows:
subject to the constraints:
and the bounds:
The above formulated model cannot be solved directly; therefore, using the fuzzy goal programming approach , we obtain the model as:
6. Results and Discussion
We apply the fuzzy goal programming approach presented in Section 2 to the above model formulation. The resulting optimization problem is solved using the numerical optimization software LINGO 16.0 [23]. The optimal compromise of the objective values with optimal employments in different sectors is given in Table 8, Table 9 and Table 10, as well as Figure 7. In the following, we analyze the results and draw conclusions:
- The goal is completely attainable if and only if the number of employees is optimal in every sector of economic activity.
- A sustainable development for India by using fuzzy goal programming can be attainable with some optimal employment in different sectors respectively for achieving the set goals by the year 2030 (see Table 8 and Table 9 and Figure 7). The value of is 0.85–0.86, which mean we reach the achievement level of 85%. This value needs to be equal to one so as to achieve the goal perfectly by the year 2030, and the government should try to put more efforts into each and every sector to attain the goal.
- The model suggests that the achievement of the goal set for economic growth until the year 2030 will not be possible without any additional measures in every economic sector of the country. India today is an agrarian economy, as about 54 percent of the population still depends on agriculture. Therefore, it is quite natural that a major part of the GDP originates from this sector in India. Nonetheless, agriculture still remains the biggest employer in India, while technologically, India’s agriculture is far more undeveloped than it is in many other countries in the world. Considering the development of the country, the government of India should start several initiatives and programs to ensure continuous growth in agriculture. From public and private sectors, more investments are needed in rural areas to sort out water resource problem, roads and electrification problem, provide training to farmers to use organic farming and the use of information technology. These are some of the key trends that one should be focused on in the development of the agricultural sector.
- The goal related to meeting the energy consumption by the year 2030 will be attainable with some additional efforts in the power sector. The government now wants to set in motion a process of accelerated industrialization to provide the much needed jobs, sustain growth and drive development. This will raise an energy demand, and more financing strategies should be developed to generate resources for the required growth of the power sector. Moreover, poor quality of power supply and frequent power cuts and shortages impose a heavy burden on India’s fast growing trade and industry. Therefore, effective policies may need to be developed that help the country in its self-production of electricity.
- The model suggests that the reduction in GHG emissions by the year 2030 will not be possible without any additional measures in every sector. Due to industrialization and urbanization, emissions of greenhouse gases into the atmosphere lead to a rise of the temperature. India is the fourth largest carbon emitter in the world in terms of total emissions. To achieve the targeted goal in GHG emissions by 2030, India should increase its dependence on renewable sources of energy, develop stringent emissions standards, a nationwide energy conservation program, a four-fold increase in the carbon tax, establish smart cities and build additional forest cover.
7. Conclusions
In this paper, we consider a fuzzy goal programming model to study the sustainable development goals of GDP growth, electricity consumption and GHG emission across different economic sectors of India by the year 2030. Additionally, the results provided by using fuzzy goal programming give a quantitative justification for additional investments in primary, secondary and tertiary sectors to achieve strategic priorities until 2030. Our analysis provides useful insights to the policy makers to initiate policies according to the needs of the mixed Indian economy. India is basically an agriculture-based economy, and our study also focuses on optimal allocation of employment in the agricultural sector along with the manufacturing and service sector to attain sustainable growth in its economy.
Author Contributions
S.G. and I.A. conceived and designed the experiments, analyzed the data, and wrote the paper, A.F. supported writing the paper and editing.
Conflicts of Interest
The authors declare that there is no conflict of interests regarding the publication of this paper.
Nomenclature
| SD | Sustainable development |
| SDGs | Sustainable development goals |
| FGP | Fuzzy goal programming |
| LGP | Lexicography goal programming |
| WFGP | Weighted fuzzy goal programming |
| GDP | Gross domestic product |
| EC | Electricity consumption |
| GHG | Green house gas |
| GVA | Gross value added |
| UN | United Nations |
| USD | United States Dollars |
| HDI | Human Development Index |
| GW | Gigawatt |
| NITI | National Institution for Transforming India |
| UAE | United Arab Emirates |
| toe | Tonnes of oil equivalent |
| UNFCCC | United Nations Framework Convention on Climate Change |
| INDC | Intended nationally-determined contributions |
| NSDC | National Skill Development Corporation |
| CSE | Centre for Science and Environment |
| CO2 | Carbon dioxide |
| INR | Indian Rupee rate |
| kWh | Kilowatt hour |
References
- Ramanathan, R.; Ganesh, L.S. Energy alternatives for lighting in households: An evaluation using an integrated goal programming-AHP model. Energy 1995, 20, 63–72. [Google Scholar] [CrossRef]
- Ramanathan, R.; Ganesh, L.S. Energy resource allocation incorporating qualitative and quantitative criteria: An integrated model using goal programming and AHP. Soc.-Econ. Plan. Sci. 1995, 29, 197–218. [Google Scholar] [CrossRef]
- Mezher, T.; Chedid, R.; Zahabi, W. Energy resource allocation using multi-objective goal programming: The case of Lebanon. Appl. Energy 1998, 61, 175–192. [Google Scholar] [CrossRef]
- Borges, A.R.; Antunes, C.H. A fuzzy multiple objective decision support model for energy-economy planning. Eur. J. Oper. Res. 2003, 145, 304–316. [Google Scholar] [CrossRef]
- Han, J.H.; Ahn, Y.C.; Lee, I.B. A multi-objective optimization model for sustainable electricity generation and CO2 mitigation (EGCM) infrastructure design considering economic profit and financial risk. Appl. Energy 2012, 95, 186–195. [Google Scholar] [CrossRef]
- Akenji, L.; Bengtsson, M. Making sustainable consumption and production the core of sustainable development goals. Sustainability 2014, 6, 513–529. [Google Scholar] [CrossRef]
- Jayaraman, R.; Colapinto, C.; Torre, D.L.; Malik, T. Multi-Criteria Model for Sustainable Development Using Goal Programming Applied to the United Arab Emirates. Energy Policy 2015, 87, 447–454. [Google Scholar] [CrossRef]
- Jayaraman, R.; Liuzzi, D.; Colapinto, C.; Malik, T. A fuzzy goal programming model to analyze energy, environmental and sustainability goals of the United Arab Emirates. Ann. Oper. Res. 2015, 251, 1–16. [Google Scholar] [CrossRef]
- Jayaraman, R.; La Torre, D.; Malik, T.; Pearson, Y.E. A polynomial goal programming model with application to energy consumption and emissions in United Arab Emirates. In Proceedings of the International Conference on Industrial Engineering and Operations Management (IEEE-IEOM), Dubai, United Arab Emirates, 3–5 March 2015; pp. 1–6. [Google Scholar]
- Jayaraman, R.; Liuzzi, D.; Colapinto, C.; La Torre, D. A Goal Programming model with satisfaction function for long-run sustainability in the United Arab Emirates. In Proceedings of the International Conference on Industrial Engineering and Engineering Management (IEEE-IEEM), Singapore, 6–9 December 2015; pp. 249–253. [Google Scholar]
- Jayaraman, R.; Colapinto, C.; La Torre, D.; Malik, T. A Weighted Goal Programming model for planning sustainable development applied to Gulf Cooperation Council Countries. Appl. Energy 2017, 185, 1931–1939. [Google Scholar] [CrossRef]
- Nomani, M.A.; Ali, I.; Fügenschuh, A.; Ahmed, A. A fuzzy goal programming approach to analyse sustainable development goals of India. Appl. Econ. Lett. 2016, 24, 443–447. [Google Scholar] [CrossRef]
- Schult, A.; Ward, H.; Vierhaus, I.; Fügenschuh, A.; Steckel, J.C. Reducing global CO2 emissions with the technologies we have. Resour. Energy Econ. 2017, 49, 201–217. [Google Scholar]
- Jayaraman, R.; Colapinto, C.; Liuzzi, D.; La Torre, D. Planning sustainable development through a scenario-based stochastic goal programming model. Oper. Res. 2017, 17, 789–805. [Google Scholar] [CrossRef]
- Bowen, K.J.; Cradock-Henry, N.A.; Koch, F.; Patterson, J.; Häyhä, T.; Vogt, J.; Barbi, F. Implementing the “Sustainable Development Goals”: Towards addressing three key governance challenges-collective action, trade-offs, and accountability. Curr. Opin. Environ. Sustain. 2017, 26, 90–96. [Google Scholar]
- Pradhan, P.; Costa, L.; Rybski, D.; Lucht, W.; Kropp, J.P. A Systematic Study of Sustainable Development Goal (SDG) Interactions. Earth’s Future 2017, 5, 1169–1179. [Google Scholar] [CrossRef]
- Oliveira, R.V. Back to the Future: The Potential of Intergenerational Justice for the Achievement of the Sustainable Development Goals. Sustainability 2018, 10, 427. [Google Scholar] [CrossRef]
- Charnes, A.; Cooper, W. Management Models of Industrial Applications of Linear Programming. Manag. Sci. 1957, 4, 38–91. [Google Scholar] [CrossRef]
- Zadeh, L. Fuzzy Sets. Inf. Control 1965, 8, 338–353. [Google Scholar] [CrossRef]
- Zimmermann, H. Fuzzy Programming and Linear Programming with Several Objective Functions. Fuzzy Sets Syst. 1978, 1, 45–55. [Google Scholar] [CrossRef]
- Bellman, R.E.; Zadeh, L.A. Decision-making in a fuzzy environment. Manag. Sci. 1970, 17, B-141–B-164. [Google Scholar] [CrossRef]
- Singh, J.; Kamal, R. India’s INDC Is Fair, and Its Renewable Energy and Forestry Targets Are Ambitious, Says CSE. 2015. Available online: http://www.downtoearth.org.in/coverage/climate-change-package-51338 (accessed on 11 March 2018).
- Lingo System Inc. Lingo-User’s Guide; Published by Lindo System Inc.: Chicago, IL, USA, 2016. [Google Scholar]
Figure 1.
Linear membership function .
Figure 2.
Linear membership function .
Figure 3.
Linear membership function .
Figure 4.
Gross domestic product (left) and electricity consumption (right).
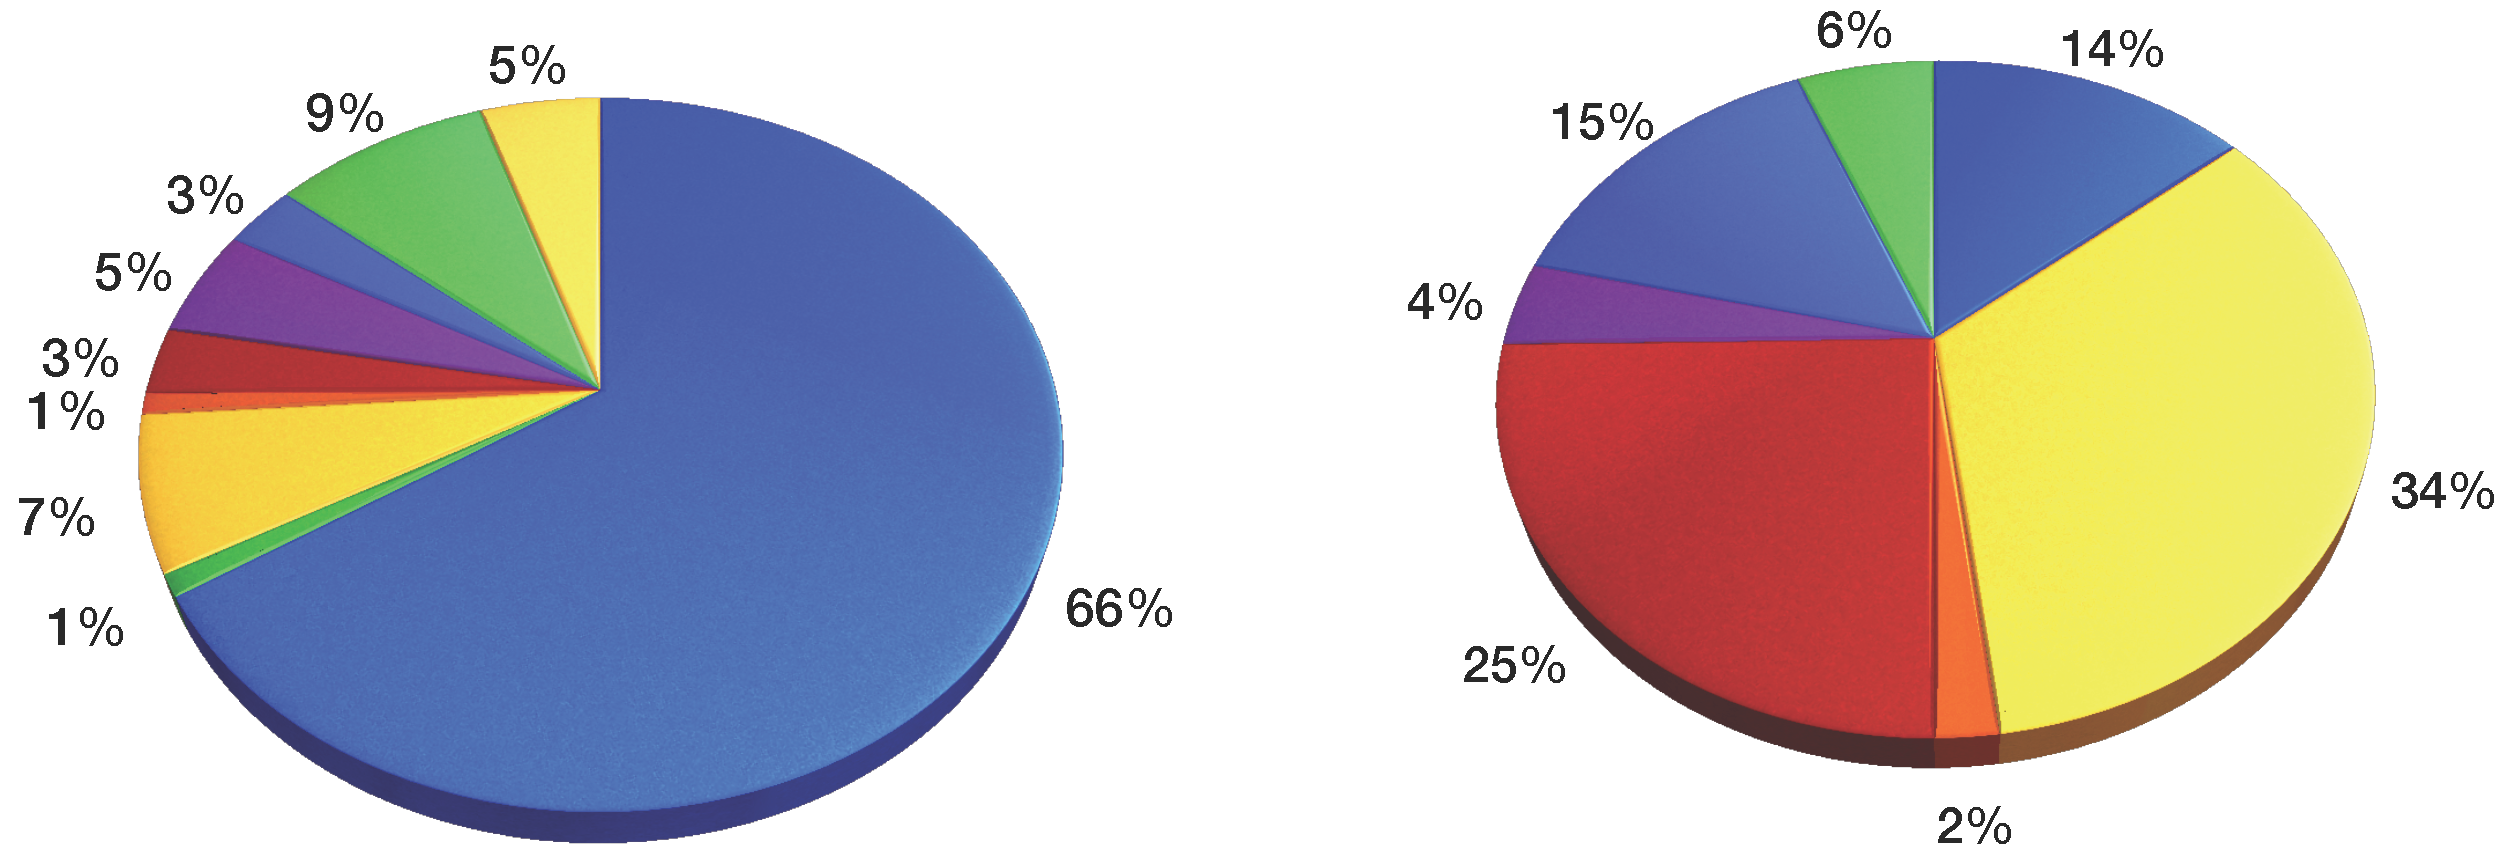
Figure 5.
Per-capita gross-value added (left) and greenhouse gas emissions (right).
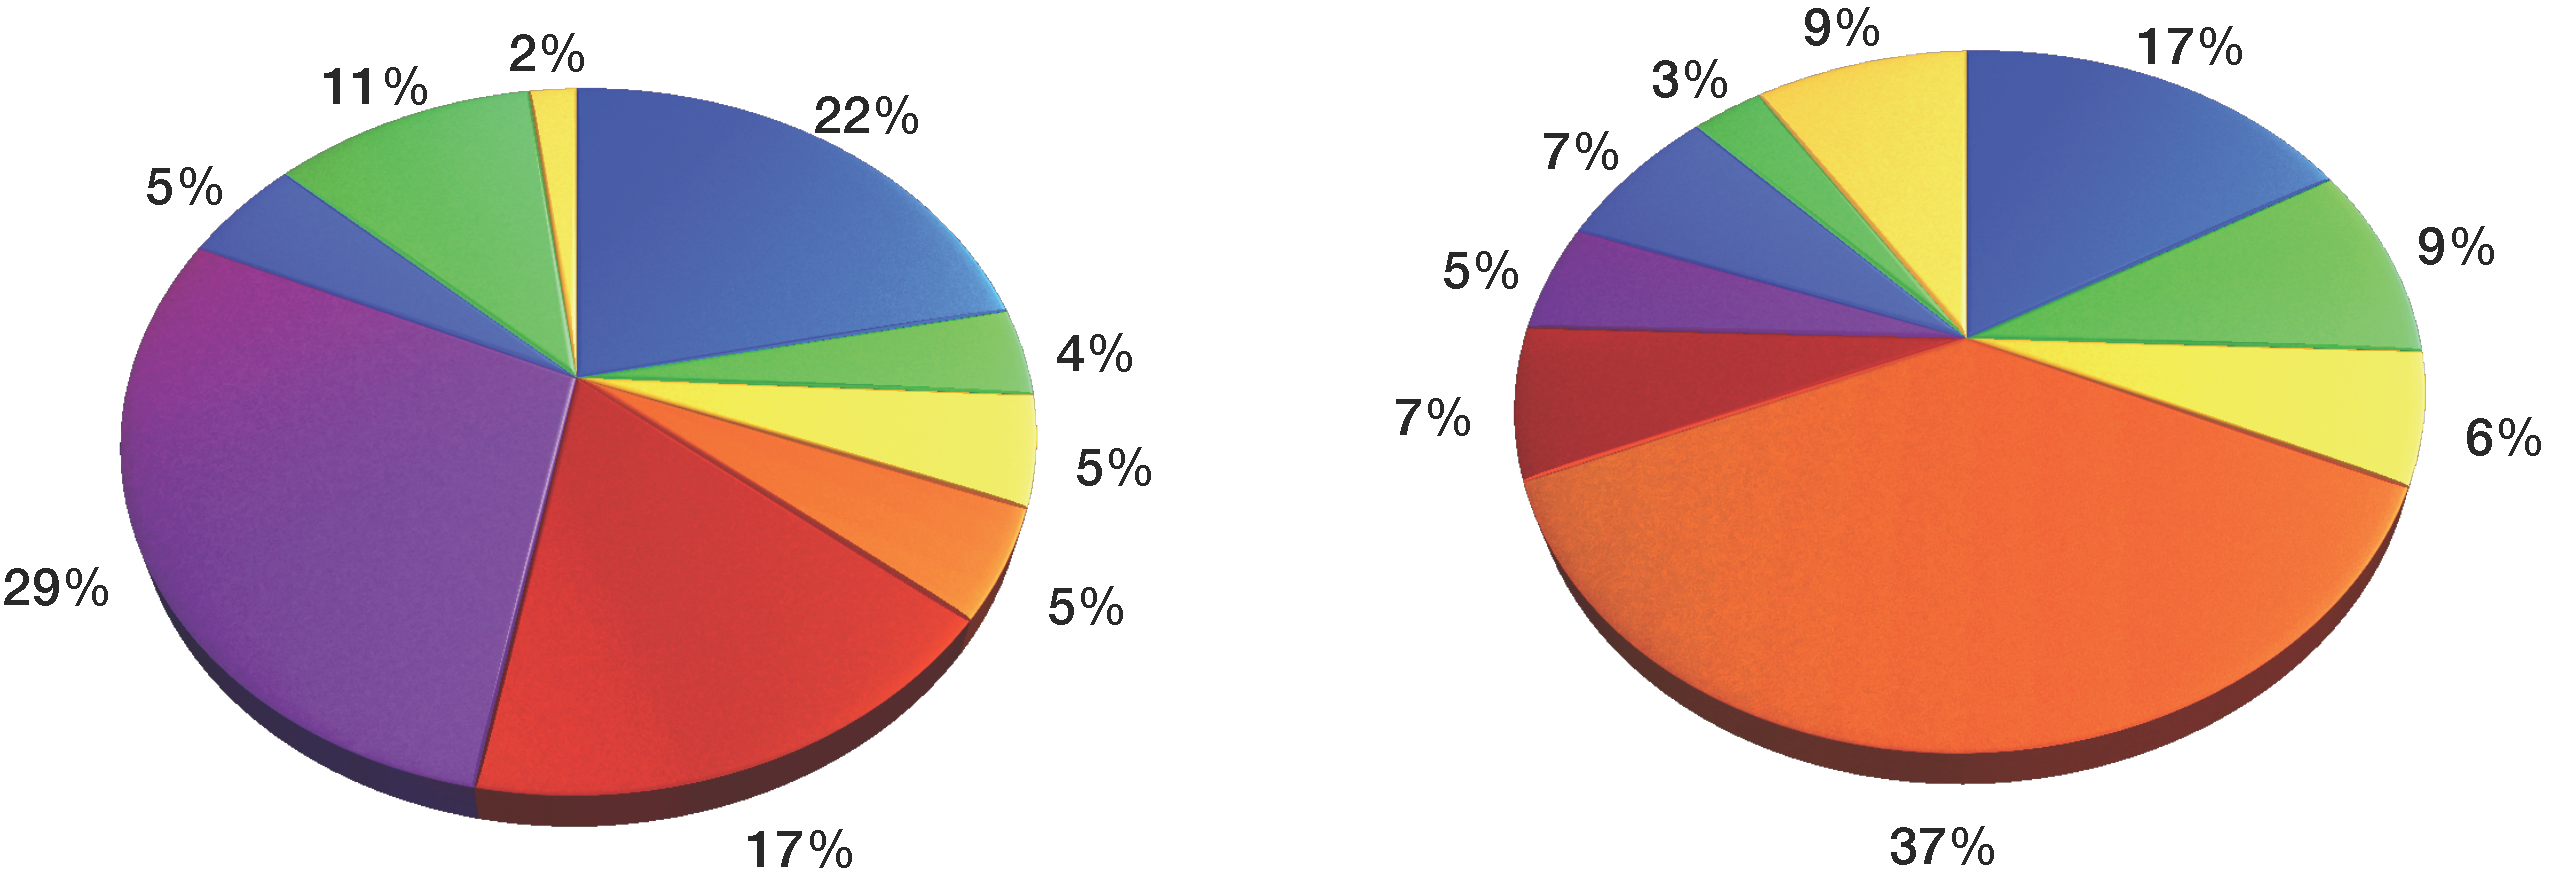
Figure 6.
Fraction of employees in different sectors.
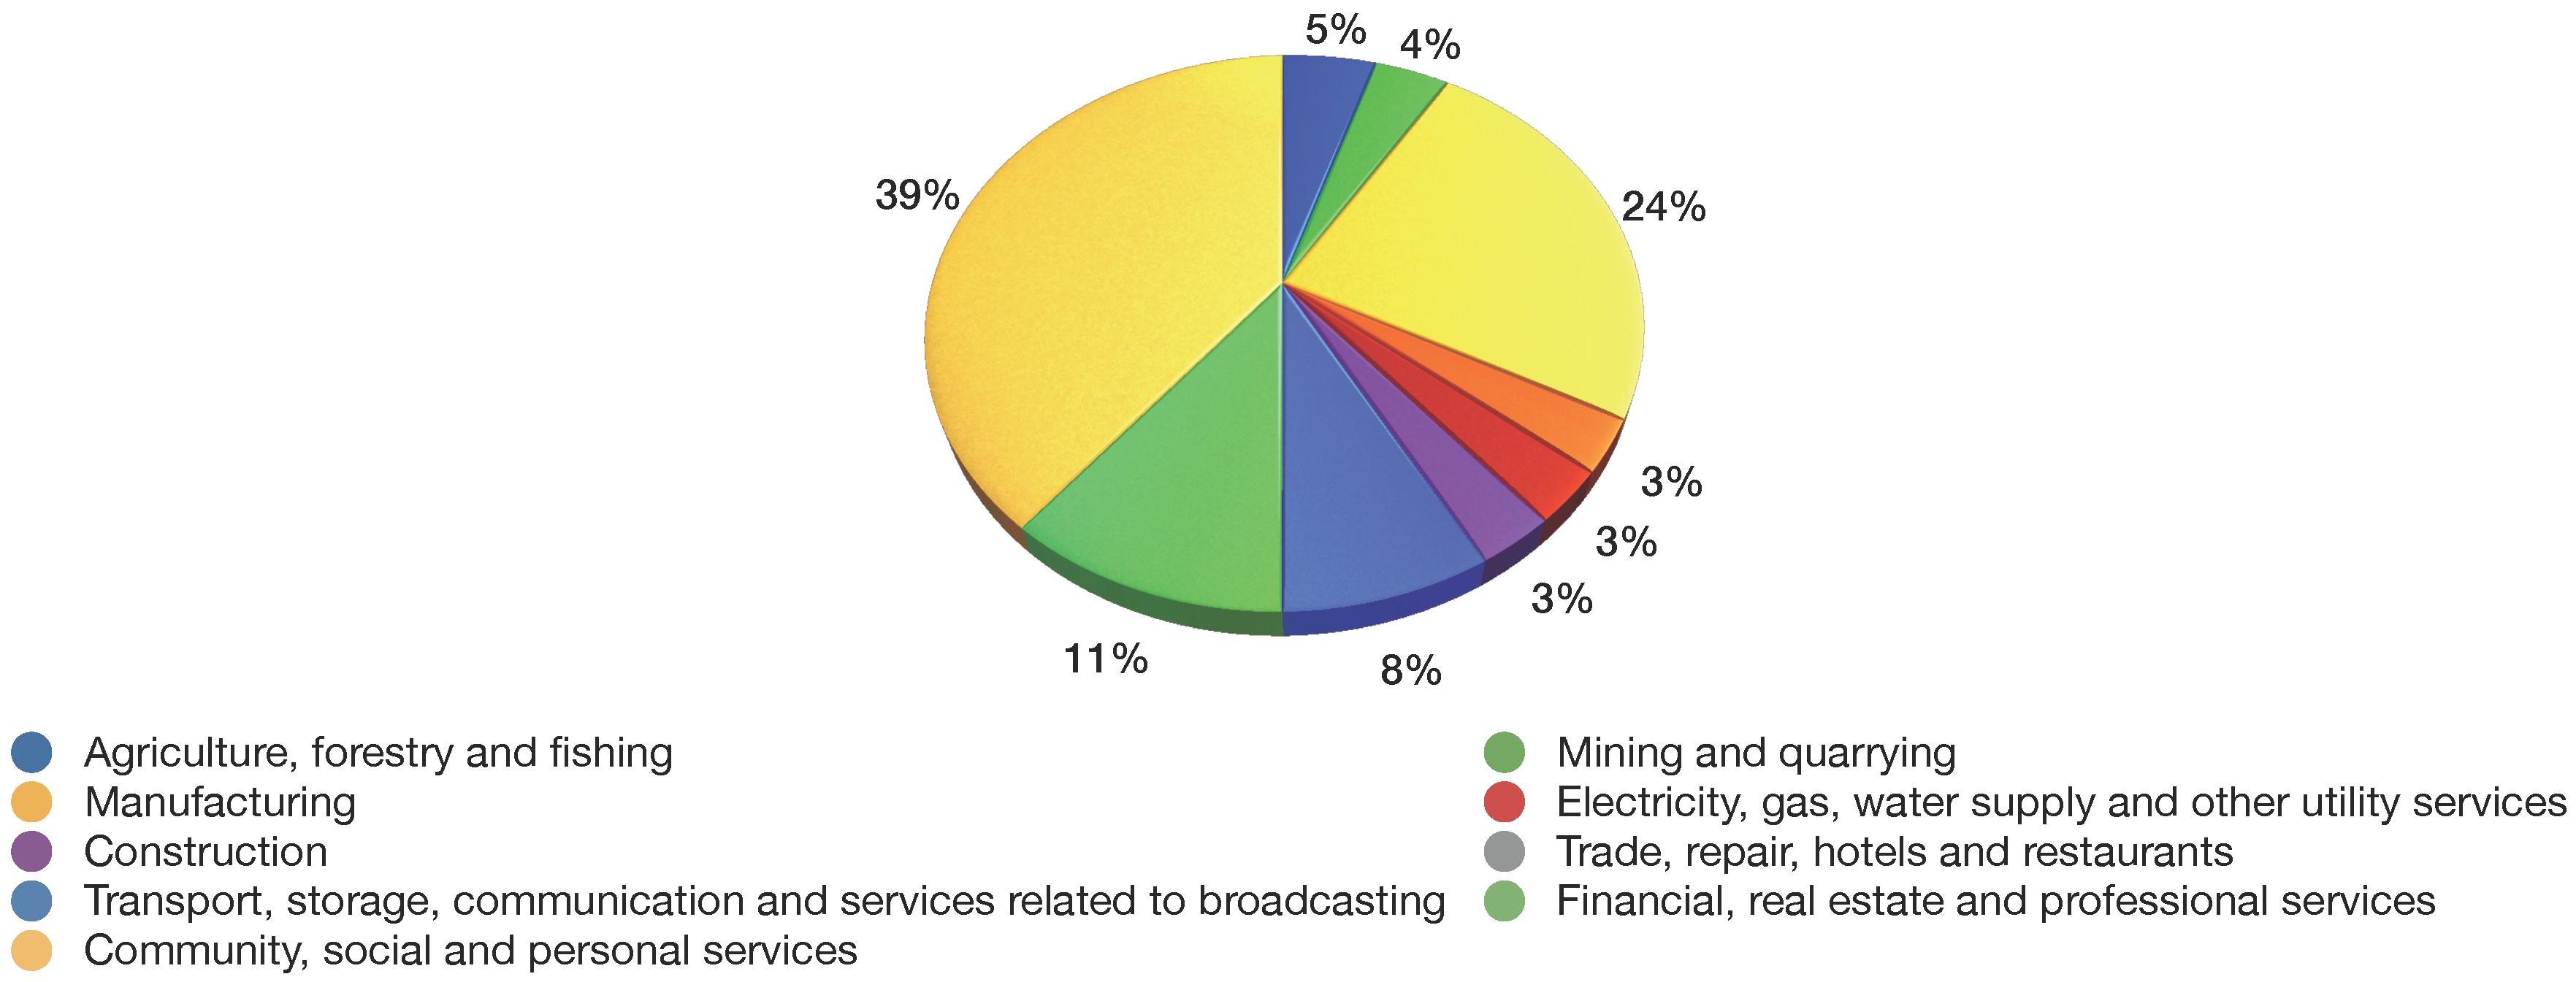
Figure 7.
Sector-wise optimal employment ().

Table 1.
Different states and union territories of northern India. Data from the India census report (2011).
Table 1.
Different states and union territories of northern India. Data from the India census report (2011).
| States/UT | Area (km2) | National Share (%) | Population (m) | Employment (rate) | GDP (b) | PCEC (kWH) |
|---|---|---|---|---|---|---|
| Haryana | 44,212 | 1.34 | 25.4 | 8,916,508 (43.7%) | $95 | 1222.21 |
| Himachal Pradesh | 55,673 | 1.70 | 6.86 | 3,559,422 (44.9%) | $19 | 1379.99 |
| Jammu & Kashmir | 222,236 | 6.76 | 12.5 | 4,322,713 (39.2%) | $23 | 952.02 |
| Punjab | 50,362 | 1.53 | 27.7 | 9,897,362 (42.4%) | $72 | 1526.86 |
| Rajasthan | 342,239 | 10.41 | 68.5 | 29,886,255 (49.0%) | $115 | 736.20 |
| Uttar Pradesh | 243,290 | 7.33 | 199.8 | 65,814,715 (44.8%) | $225 | 348.37 |
| Uttarakhand | 53,483 | 1.62 | 10.1 | 3,872,275 (45.9%) | $35 | 1112.29 |
| Chandigarh | 114 | 0.003 | 1.06 | 404,136 (38.4%) | $4.6 | 1340.00 |
| Delhi | 1484 | 0.004 | 16.8 | 5,587,049 (41.8%) | $96 | 1651.26 |
Table 2.
Different states and union territories of western India. Data from the India census report (2011).
Table 2.
Different states and union territories of western India. Data from the India census report (2011).
| States/UT | Area (km2) | National Share (%) | Population (m) | Employment (rate) | GDP (billion) | PCEC (kWH) |
|---|---|---|---|---|---|---|
| Gujarat | 196,024 | 5.96 | 60.4 | 24,767,747 (48.9%) | $199 | 1633 |
| Madhya Pradesh | 308,350 | 9.37 | 72.6 | 31,574,133 (45.7%) | $110 | 602.07 |
| Maharashtra | 307,713 | 9.36 | 112.4 | 49,427,878 (52.7%) | $390 | 1028.22 |
| Chhattisgarh | 135,191 | 4.11 | 25.5 | 12,180,225 (67.9%) | $45 | 1546.94 |
| Goa | 3702 | 0.11 | 1.46 | 577,248 (48.9%) | $11 | 2025 |
| Dadra and Nagar Haveli | 491 | 0.01 | 0.34 | 157,161 (46.7%) | $360 | 11863.64 |
| Daman and Diu | 112 | 0.03 | 0.24 | 121,271 (50.0%) | $160 | 7118.23 |
Table 3.
Different states and union territories of southern India. Data from the India census report (2011).
Table 3.
Different states and union territories of southern India. Data from the India census report (2011).
| States/UT | Area (km2) | National Share (%) | Population (m) | Employment (rate) | GDP (billion) | PCEC (kWH) |
|---|---|---|---|---|---|---|
| Andhra Pradesh | 275,045 | 4.87 | 84.6 | 39,422,906 (62.5%) | $220 | 1157 |
| Karnataka | 191,791 | 5.83 | 61.1 | 27,872,597 (55.5%) | $200 | 903.24 |
| Kerala | 38,863 | 1.18 | 33.4 | 11,619,063 (50.0%) | $115 | 525.25 |
| Tamil Nadu | 130,058 | 3.95 | 72.1 | 32,884,681 (57.2%) | $210 | 1131.58 |
| Lakshadweep | 32 | 0.001 | 0.0645 | 18,753 (36.1%) | $0.06 | 418.14 |
| Puducherry | 562 | 0.001 | 1.25 | 444,968 (52.5%) | $4.5 | 1743.37 |
Table 4.
Different states and union territories of eastern India. Data from the India census report (2011).
Table 4.
Different states and union territories of eastern India. Data from the India census report (2011).
| States/UT | Area (km2) | National Share (%) | Population (m) | Employment (rate) | GDP (billion) | PCEC (kWH) |
|---|---|---|---|---|---|---|
| Bihar | 94,163 | 2.86 | 104.1 | 34,724,987 (48.5%) | $97 | 122.11 |
| Odisha | 155,707 | 4.73 | 42 | 710,000 (49.4%) | $61 | 874.26 |
| West Bengal | 88,752 | 27.0 | 9.13 | 34,756,355 (50.8%) | $141 | 550.16 |
| Jharkhand | 79,714 | 24.2 | 3.3 | 13,098,274 (50.9%) | $43 | 880.43 |
| Sikkim | 7096 | 0.21 | 0.61 | 308,138 (56.0%) | $2.5 | 850.00 |
| Andaman and Nicobar Island | 8249 | 0.25 | 0.38 | 152,535 (60.8%) | $0.91 | 493.98 |
Table 5.
Different states and union territories of northeastern India. Data from the India census report (2011).
Table 5.
Different states and union territories of northeastern India. Data from the India census report (2011).
| States/UT | Area (km2) | National Share (%) | Population (m) | Employment (rate) | GDP (billion) | PCEC (kWH) |
|---|---|---|---|---|---|---|
| Arunachal Pradesh | 83,743 | 2.54 | 1.38 | 587,657 (53.6%) | $2.9 | 683 |
| Assam | 78,438 | 2.38 | 31.2 | 11,969,690 (49.1%) | $38 | 204.80 |
| Mizoram | 21,081 | 0.64 | 1.1 | 486,705 (63.7%) | $2.7 | 376.99 |
| Nagaland | 16,579 | 0.50 | 1.98 | 974,122 (62.7%) | $2.6 | 218.03 |
| Manipur | 22,327 | 0.68 | 2.86 | 1,304,610 (52.8%) | $2.7 | 240.22 |
| Meghalaya | 22,429 | 0.68 | 2.97 | 1,185,619 (61.0%) | $4.5 | 675.19 |
| Tripura | 10,486 | 0.31 | 3.67 | 1,469,521 (56.1%) | $4.5 | 335.47 |
Table 6.
Sectoral contribution of economic sectors to the identified goals.
| S.No. | Economic Sectors | GDP (in billion INR) | Electricity Consumption (in KWh/million) | GHG Emissions (in million tonnes) | Per-Capita GVA | Number of Employment (in thousand) |
|---|---|---|---|---|---|---|
| 1 | Agriculture, forestry and fishing | 15,968.77 | 168,913 | 334.41 | 80,288 | 23,430 |
| 2 | Mining and quarrying | 2826.05 | 35 | 165.31 | 15,905 | 18,770 |
| 3 | Manufacturing | 17,702.32 | (*) | 117.32 | 16,340 | 110,670 |
| 4 | Electricity, gas, water supply and other utility services | 2322.69 | 29,966 | 719.30 | 17,735 | 13,770 |
| 5 | Construction | 7926.63 | (**) | 129.92 | 59,589 | 14,580 |
| 6 | Trade, repair, hotels and restaurants | 12,110.97 | 303,929 | 100.87 | 102,975 | 12,210 |
| 7 | Transport, storage, communication and services related to broadcasting | 6541.33 | 43,669 | 142.04 | 17,530 | 39,290 |
| 8 | Financial, real estate and professional services | 20,557.06 | 183,740 | 57.73 | 40,759 | 50,900 |
| 9 | Community, social and personal services | 12,620.91 | 78,391 | 173.84 | 7584 | 17,8710 |
Data sources: [12]; INDC report submitted by India to UNFCC; Press Information Bureau of India; (*)/(**) Electricity consumption in manufacturing (*) and construction (**) together is 418,346.
Table 7.
Identified goals for sustainable development.
| Current Growth Rate | Expected Annual Growth Rate | |
|---|---|---|
| GDP (INR Billion) | 7.1% | 8.58% |
| GHG Emissions (million tonnes) | 6.43% | 4.88% |
| Electricity Consumption (KWh) | 5.97% | 10.67% |
| Number of Employment (million) | 2.66% | 3.55% |
Table 8.
Compromise objective values.
| Tol. | ||||
|---|---|---|---|---|
| 0.1 | 337,881.30 | 7,215,281.00 | 3912.76 | 0.8625655 |
| 0.2 | 337,633.90 | 7,191,716.00 | 3925.78 | 0.8616739 |
| 0.3 | 337,383.30 | 7,167,842.00 | 3938.98 | 0.8607706 |
| 0.4 | 337,129.40 | 7,143,655.00 | 3952.35 | 0.8598555 |
| 0.5 | 336,872.20 | 7,119,148.00 | 3965.89 | 0.8589283 |
| 0.6 | 336,611.50 | 7,094,314.00 | 3979.63 | 0.8579887 |
| 0.7 | 336,347.30 | 7,069,147.00 | 3993.54 | 0.8570365 |
| 0.8 | 336,079.60 | 7,043,640.00 | 4007.64 | 0.8560715 |
| 0.9 | 336,193.00 | 7,190,050.00 | 4001.67 | 0.8564800 |
| 1.0 | 335,533.20 | 6,991,580.00 | 4036.42 | 0.8541018 |
Table 9.
Optimal employment in different sectors.
| Tol. | |||||||||
|---|---|---|---|---|---|---|---|---|---|
| 0.1 | 23,752 | 19,028 | 112,191 | 13,959 | 14,780 | 252,273 | 39,830 | 51,600 | 181,168 |
| 0.2 | 24,078 | 19,289 | 113,732 | 14,151 | 14,983 | 250,810 | 40,377 | 52,308 | 183,656 |
| 0.3 | 24,409 | 19,554 | 115,293 | 14,345 | 15,189 | 249,328 | 40,931 | 53,026 | 186,176 |
| 0.4 | 24,743 | 19,822 | 116,874 | 14,542 | 15,397 | 247,827 | 41,493 | 53,753 | 188,730 |
| 0.5 | 25,083 | 20,094 | 118,476 | 14,741 | 15,608 | 246,305 | 42,061 | 54,490 | 191,318 |
| 0.6 | 25,426 | 20,369 | 120,100 | 14,943 | 15,822 | 244,763 | 42,638 | 55,237 | 193,939 |
| 0.7 | 25,774 | 20,648 | 121,745 | 15,148 | 16,039 | 243,201 | 43,222 | 55,994 | 196,596 |
| 0.8 | 26,128 | 20,931 | 123,413 | 15,356 | 16,259 | 241,618 | 43,814 | 56,761 | 199,289 |
| 0.9 | 26,456 | 21,194 | 124,965 | 15,549 | 16,463 | 249,107 | 44,365 | 57,475 | 200,637 |
| 1.0 | 26,848 | 21,509 | 126,817 | 15,779 | 16,707 | 238,386 | 45,022 | 58,326 | 204,785 |
Table 10.
Sector-wise importance.
| Sector | Weights | Value of Objective Function | Goal Achievement | |||||||||
|---|---|---|---|---|---|---|---|---|---|---|---|---|
| 1 | (0.1,0.9,0.0) | 342,147.50, | 25,773 | 20,647 | 121,737 | 15,147 | 16,412 | 248,850 | 43,219 | 55,990 | 196,583 | |
| 7,210,943.00 | ||||||||||||
| 4043.41 | ||||||||||||
| 2 | (0.2,0.8,0.0) | 342,147.50, | 25,773 | 20,647 | 121,737 | 15,147 | 16,412 | 248,850 | 43,219 | 55,990 | 196,583 | |
| 7,210,943.00, | ||||||||||||
| 4043.41 | ||||||||||||
| 3 | (0.5,0.5,0.0) | 413,609.20, | 25,773 | 20,647 | 121,737 | 15,147 | 16,038 | 321,101 | 43,219 | 55,990 | 196,583 | |
| 9,008,152.00, | ||||||||||||
| 4636.96 | ||||||||||||
| 4 | (0.7,0.3,0.0) | 413,609.20, | 25,773 | 20,647 | 121,737 | 15,147 | 16,038 | 321,101 | 43,219 | 55,990 | 196,583 | |
| 9,008,152.00, | ||||||||||||
| 4636.96 | ||||||||||||
| 5 | (0.4,0.0,0.6) | 332,693.70, | 25,773 | 20,647 | 121,737 | 15,147 | 16,038 | 13,431 | 43,219 | 363,660 | 196,583 | |
| 6,560,323.00, | ||||||||||||
| 2444.17 | ||||||||||||
| 6 | (0.0,0.3,0.7) | 342,147.50, | 25,773 | 20,647 | 121,737 | 15,147 | 16,412 | 248,850 | 43,219 | 55,990 | 196,583 | |
| 7,210,943.00, | ||||||||||||
| 4043.41 | ||||||||||||
| 7 | (0.3,0.3,0.4) | 413,609.20, | 25,773 | 20,647 | 121,737 | 15,147 | 16,038 | 321,101 | 43,219 | 55,990 | 196,583 | |
| 9,008,152.00, | ||||||||||||
| 4636.96 | ||||||||||||
| 8 | (0.8,0.1,0.1) | 332,693.70, | 25,773 | 20,647 | 121,737 | 15,147 | 16,038 | 13,431 | 43,219 | 363,660 | 196,583 | |
| 6,560,323.00, | ||||||||||||
| 2444.17 | ||||||||||||
| 9 | (0.3,0.5,0.2) | 342,147.50, | 25,773 | 20,647 | 121,737 | 15,147 | 16,412 | 248,850 | 43,219 | 55,990 | 196,583 | |
| 7,210,943.00 | ||||||||||||
| 4043.41 | ||||||||||||
| 10 | (0.3,0.1,0.8) | 332,693.70, | 25,773 | 20,647 | 121,737 | 15,147 | 16,038 | 13,431 | 43,219 | 363,660 | 196,583 | |
| 6,560,323.00, | ||||||||||||
| 2444.17 |
© 2018 by the authors. Licensee MDPI, Basel, Switzerland. This article is an open access article distributed under the terms and conditions of the Creative Commons Attribution (CC BY) license (http://creativecommons.org/licenses/by/4.0/).
Share and Cite
MDPI and ACS Style
Gupta, S.; Fügenschuh, A.; Ali, I. A Multi-Criteria Goal Programming Model to Analyze the Sustainable Goals of India. Sustainability 2018, 10, 778. https://doi.org/10.3390/su10030778
AMA Style
Gupta S, Fügenschuh A, Ali I. A Multi-Criteria Goal Programming Model to Analyze the Sustainable Goals of India. Sustainability. 2018; 10(3):778. https://doi.org/10.3390/su10030778
Chicago/Turabian StyleGupta, Srikant, Armin Fügenschuh, and Irfan Ali. 2018. "A Multi-Criteria Goal Programming Model to Analyze the Sustainable Goals of India" Sustainability 10, no. 3: 778. https://doi.org/10.3390/su10030778
Note that from the first issue of 2016, this journal uses article numbers instead of page numbers. See further details here.