Article

Cooling Effects and Regulating Ecosystem Services Provided by Urban Trees—Novel Analysis Approaches Using Urban Tree Cadastre Data

1
Department of Geography, Landscape Ecology & Biogeography, Ruhr-University Bochum, Universitätsstraße 150, 44801 Bochum, Germany
2
Research Group Urban & Landscape Ecology, Department of Geography and Geology, University of Salzburg, Hellbrunnerstrasse 34, A-5020 Salzburg, Austria
*
Author to whom correspondence should be addressed.
Sustainability 2018, 10(3), 712; https://doi.org/10.3390/su10030712
Submission received: 15 January 2018 / Revised: 28 February 2018 / Accepted: 1 March 2018 / Published: 6 March 2018
(This article belongs to the Section Sustainable Urban and Rural Development)

Abstract

:
The provision of ecosystem services by urban trees is not yet routinely integrated in city administrations’ planting scenarios because the quantification of these services is often time-consuming and expensive. Accounting for these welfare functions can enhance life quality for city dwellers. We present innovative approaches that may appeal to the numerous city administrations that keep tree inventory or cadastre databases of all trees growing on city property for civil law liability reasons. Mining these ubiquitous data can be a feasible alternative to field surveys and improve cost–benefit ratios for ecosystem service assessment. We present methods showing how data gaps (in particular tree height and crown light exposure) in the cadastre data can be filled to estimate ecosystem services with i-Tree Eco. Furthermore, we used the i-Tree Eco output for a noval approach which focus on predicting energy reduction as a proxy for cooling benefits provided by trees. The results for the total publicly owned and managed street trees in our study site of Duisburg (Germany) show that the most important ecosystem services are the removal of particulate matter by 16% of the city emissions and the reduction of 58% of the direct and thermal radiation in the effective range of the trees in the cadastre.

1. Introduction

Human societies will have to face three big challenges during the 21st century. The first is an increasing share of population living in cities [1]; second, the loss of biodiversity due to land-use changes and urban sprawl [2,3]; and third, climate change, which will lead to an increase of thermal stress for the urban population with heatwaves occurring more frequently and with longer duration. The higher the temperatures, the more the ozone concentrations are rising, which in turn is detrimental to air quality in urban areas [4]. These threats to societies are interconnected, as the heat island effect is becoming stronger as more people live in urban areas. Increasing energy consumption, soil sealing and the high competition for space between green and grey infrastructure in densifying urban areas may lead locally to a lack of urban greening [5] and the loss of biodiversity. Climate change will potentially lead to a decline of quality of life in cities.
Urban planners have to work on solutions that counter the upcoming problems. Urban green infrastructure such as parks, urban woodlands and street trees play a key role in mitigating those impacts. The ecosystem services concept offers an analytical lens to components of urban green, underlying ecological processes and functions, and their relevance for a sustainable relationship between nature and society. Outcomes and functions of ecosystems that maintain air and soil quality and flood, storm water and disease control are categorized as regulating ecosystem services [6]. In particular, urban trees provide several ecosystem services:
  • Reducing thermal stress due to shadow casting and transpiration [7,8,9];
  • The leaves in the canopy act as a filter for gaseous pollutants (NO2, SO2, O3, CO) and particulate matter (PM10, PM2.5) [10,11,12];
  • The canopy can intercept huge amounts of water during rainfall [13,14] which leads to decreased storm water runoff;
  • CO2 sequestration through photosynthesis helps to reduce greenhouse gases from the atmosphere [15,16];
  • Trees provide a habitat for different animal species groups like insects, birds and mammals [17,18] and enhance biodiversity in cities.
Even though research findings about these regulating ecosystem services are already at hand, they are not yet routinely integrated in planning processes. In many cases, the preservation of urban trees for enhancing ecosystem services has relatively low priority in urban planning. Citizens and the communal administration may be more concerned about the cultivation and maintenance costs of urban trees rather than recognizing their value for the urban ecosystem and human wellbeing [19]. Approaches for supporting planners and practitioners in planning the urban tree stock under the paradigms of multifunctionality and climate change are emerging [20]. Exact quantifications of ecosystem services may require complex, time-consuming and expensive field surveys. At the same time, the financial and personnel resources of city administrations are limited. In most cases the costs will exceed the usage of ecosystem service assessments. Because of that, practitioners look for more economically feasible solutions to assess ecosystem services with less effort.
An opportunity to assess regulating ecosystem services with given data lies in analyzing urban tree stock data. In European countries, tree ownership implies liability for damages; hence, civil law gives incentives for safety precautions and their legally watertight documentation. Many cities keep tree cadastres to monitor tree vitality and damages to comply with road safety regulations as an administrative task, often in a Geographic Information System (GIS)-compatible format. Those cadastres are extensive databases, including information on tree species, location, height, crown width, diameter at breast height (DBH), vitality and many more variables. We argue that regulating ecosystem services can be evaluated with relatively little cost and effort by analyzing those cadastres. Tapping into this data source for urban ecosystem service analysis has therefore great practical and planning potential.
Hence, the paper has the following objectives. Firstly, we discuss and demonstrate the assessment of regulating ecosystem services of urban trees by using tree cadastre data. As modelling software, we use i-Tree Eco (v. 5) which was developed by the US Forest Service [21]. Not all required data for an i-Tree Eco analysis is provided by the cadastre; therefore, secondly, we developed statistical and geostatistical methods for filling those data gaps. Thirdly, we present a novel approach to quantify cooling effects through the canopy layer by working with the results from i-Tree Eco analysis to calculate energy reduction, which is missing from i-Tree Eco’s output. In addition to the above, our results for the city of Duisburg in Germany add to the number of European i-Tree Eco-projects that are published so far. Examples of European i-Tree Eco-projects are Strasbourg [22], Bozen [23], London [24] and Barcelona [25]; in contrast to our study, these have not included tree cadastre data.

2. Materials and Methods

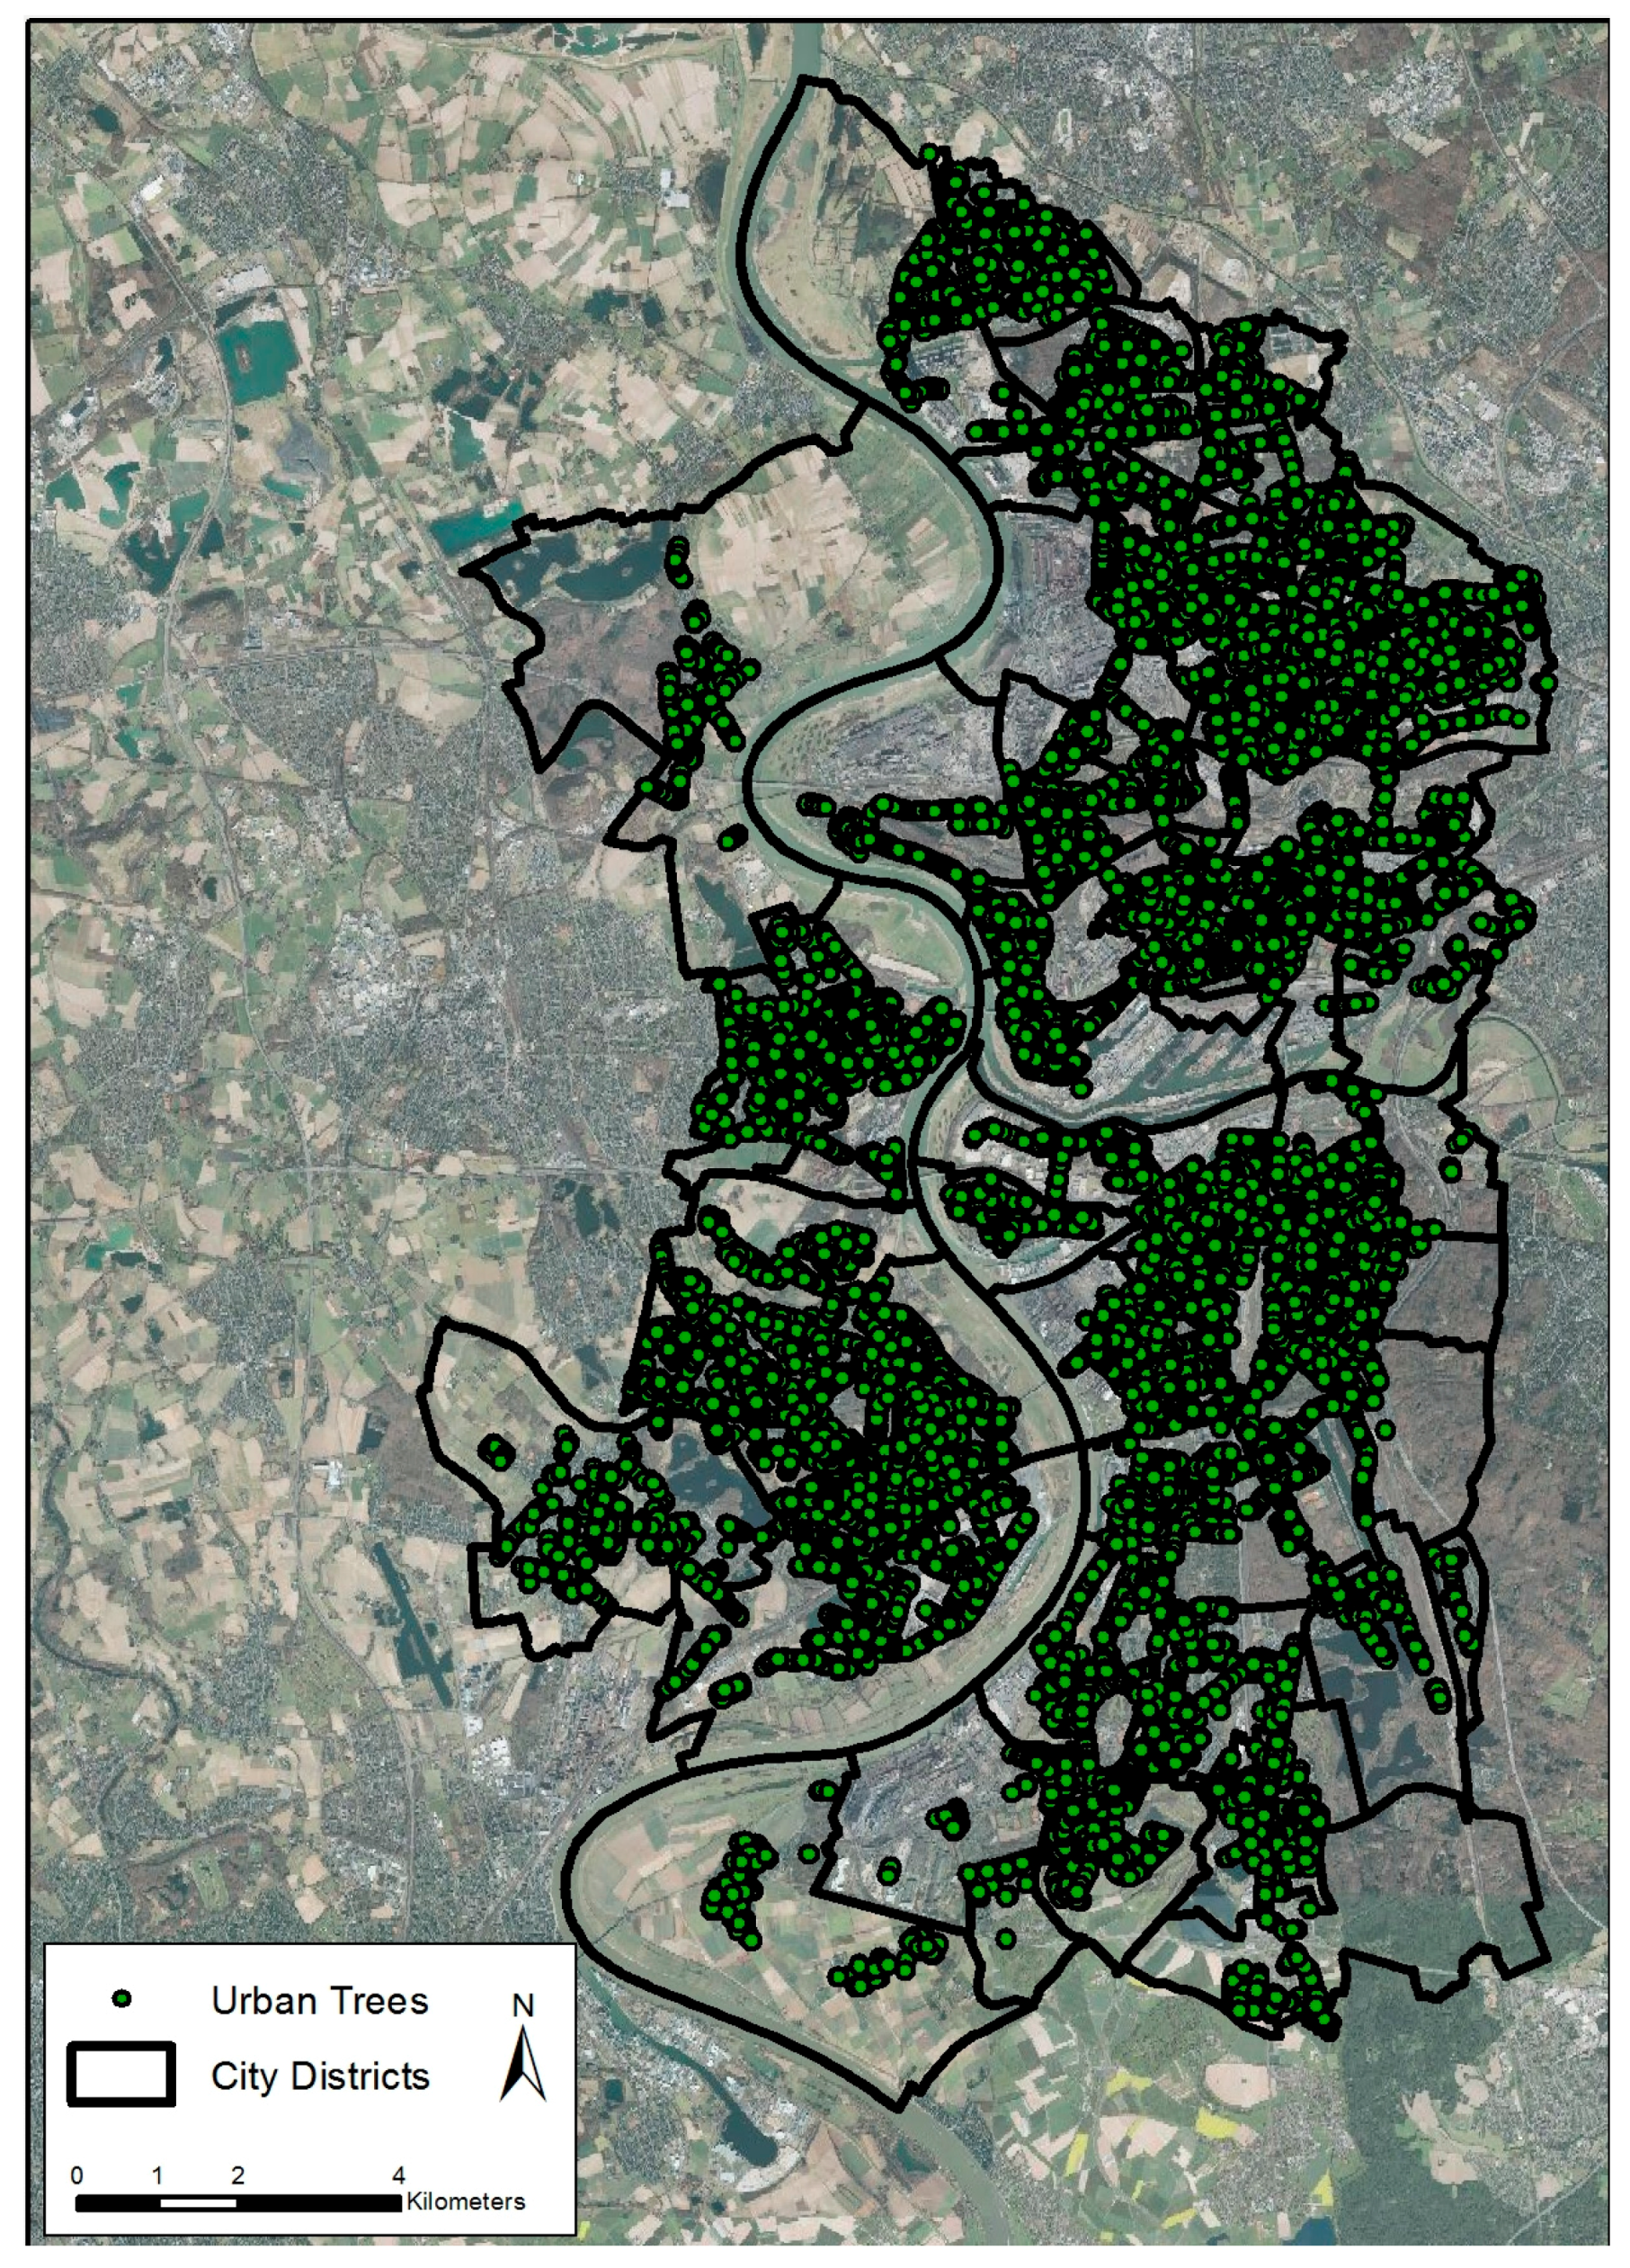
2.1. Data Availability, Database and Study Area

Tree cadastres are inventories in which all trees in public areas of a city are recorded. They are used as a tool for managing tree maintenance and for recording the vitality and damages to comply with road and traffic safety tasks. It is necessary to monitor and document the damage patterns, the date of the last tree inspection and the amount and type of care and maintenance. If the cadastre is digital, queries and evaluations for status reports can be run and in most cases the single trees have geographical coordinates, which were recorded during tree inspection. Estimation and monitoring of ecosystem services are not yet considered in the cadastres, but it would be a useful addition in the context of a future-oriented and climate adaptive urban tree management.
The present analysis was carried out for the publicly owned and managed urban tree stock in the German city of Duisburg in the Rhein–Ruhr area. Duisburg is located in the lower Rhein Valley and has a humid oceanic climate considered by the Köppen classification as Cfb with a mean annual temperature between 12 to 13 °C and an annual precipitation between 700 and 800 mm [26]. With 491,231 inhabitants, Duisburg has a typical urban climate, where the temperature gradient is mainly influenced by land-use. The urban heat island effect can reach 5–6 K and occurs especially in downtown and residential areas with a dense building structure [27]. The Duisburg urban tree cadastre contains around 50,000 trees from 236 different species and breeds. The last tree inspection occurred in October 2015. In that year, a total of 49,921 trees were inspected, so the data displays a relatively up to date picture of the situation in Duisburg. All recorded trees are located at roadsides and in public places. Trees in parks, urban forests and in private gardens are missing in the database. However, 50,000 trees are a very good sample for modelling ecosystem services on the spatial and species level (Figure 1). The cadastre contains taxonomic and site information, tree structure data (stem girth, crown width) and information on the vitality and on damages on the stem, the crown and the roots.

2.2. i-Tree Eco Model

I-Tree Eco is a freely available software, developed by the Forest Service of the U.S. Department of Agriculture. It is aimed at city administrations and decision-makers, scientists, advocacy groups and associations of interested citizens. The model equations are peer-reviewed, based on long-term research and are improved continuously to deliver information on urban forest structure and ecosystem services and disservices. Moreover, the model can be used for risk assessments on pests and diseases to support tree management. The aim of the software is to help managers and researchers quantify urban forest structure and ecosystem services. As input data, tree structural data, site information and local weather and air pollution data is required. Detailed descriptions of the model and the software are published by the Forest Service of the U.S. Department of Agriculture [21].

2.3. Data Requirement for i-Tree Eco and Data Availability in the Database

The tree cadastre contains a lot of information which can be used for an Eco analysis (Table 1). For all 236 tree species and breeds, equations are available in Eco. The status defines whether the tree is planted or self-established. The land-use describes the tree site. Because all trees in the cadastre are planted street trees, both parameters are definable. For every tree, diameter at breast height (DBH) and crown width are measured during tree inspection. Local air pollution data is available from the federal environment agency [29]. Climate data is used from the nearest station which is listed by the NOAA (Düsseldorf Airport ID: 10400099999). The percentage of crown missing and the crown dieback can be derived from the vitality and damage information in the cadastre. Lower crown height was set to 3 m in the model as this is the minimum lower crown height for street trees due to safety restrictions.
Missing parameters are the tree height and information on crown light exposure. Without these data, the modelling cannot be run. Re-measuring the 50,000 trees is not practical due to financial and personnel resources. Therefore, we developed methods for estimating the missing parameters which will be presented in the following sections.

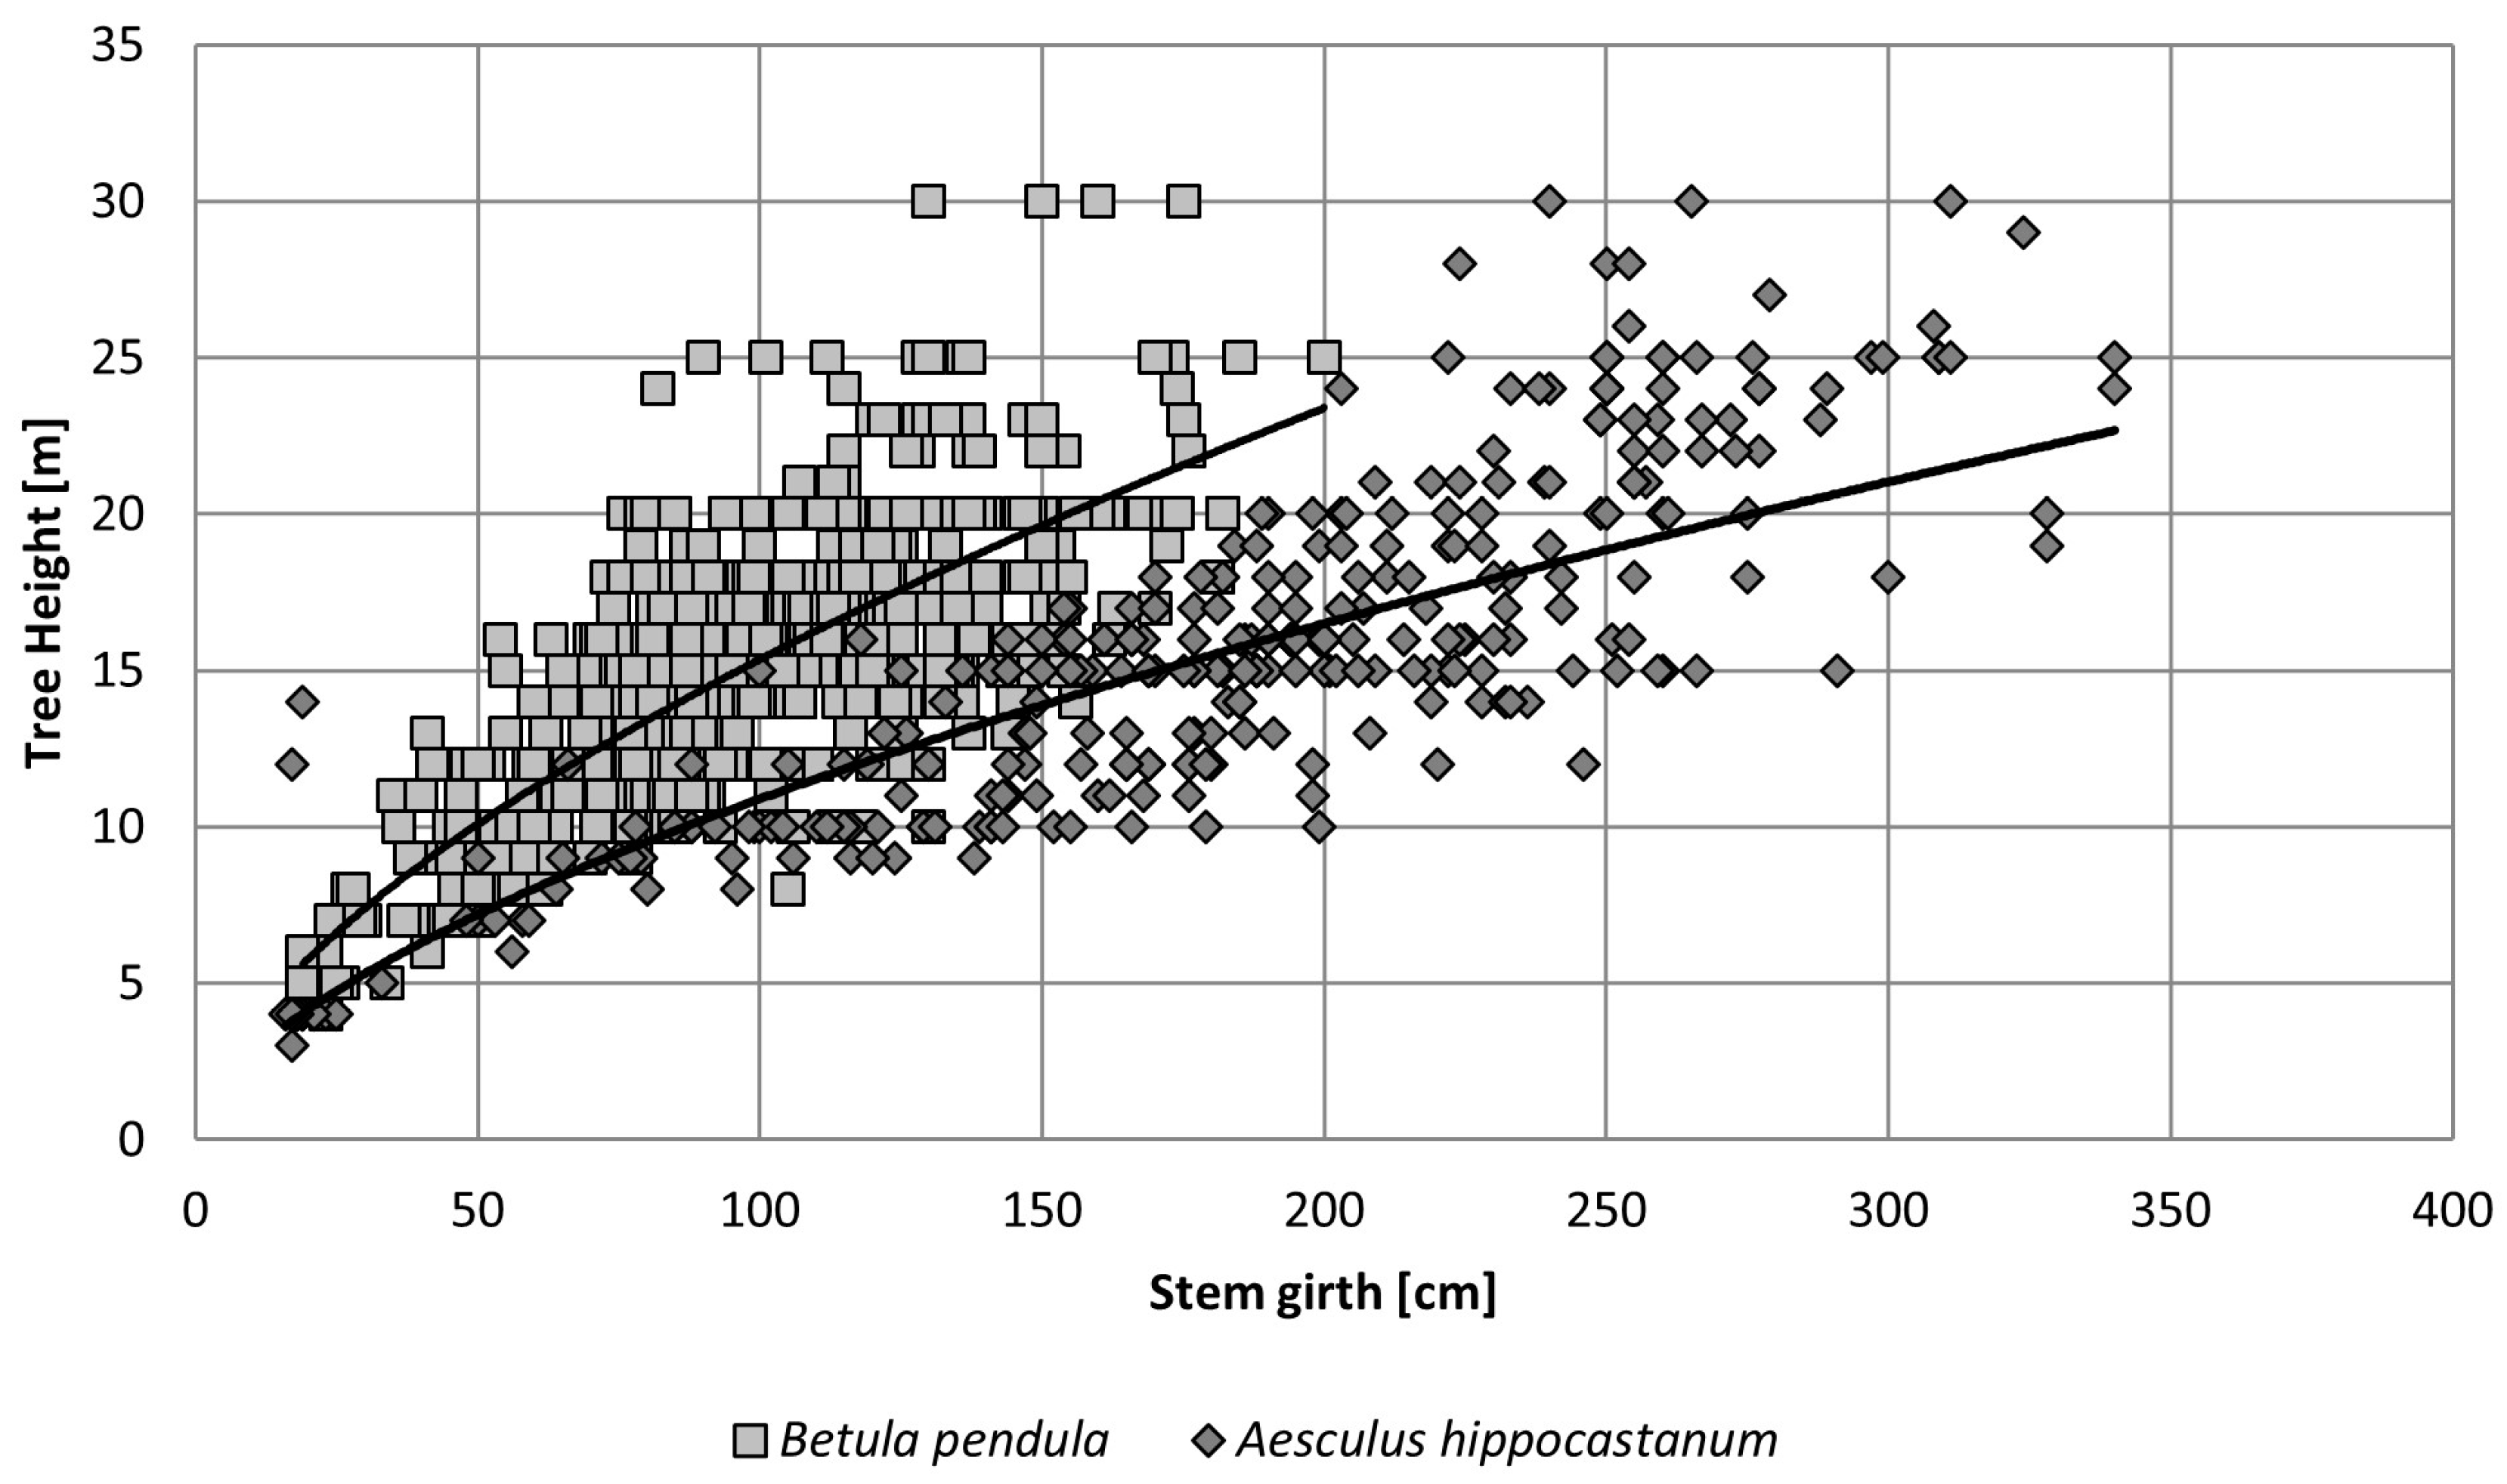
2.3.1. Estimating Tree Height

For estimating tree heights, allometric growth equations were used (following [30]), which were calculated from the tree cadastre of Bochum. Bochum is a city 30 km away from Duisburg with equal growth conditions for urban trees: both cities have more than 350,000 inhabitants, a high building density and a typical urban climate. In Bochum and Duisburg, only street trees are included in the cadastre. Compared to Duisburg, the cadastre in Bochum contains both pieces of information—tree height and stem girth. For every species, we correlated the stem girth as an independent variable and the tree height as dependent variable with the statistic software SPPS version 22 (IBM Corporation, New York, NY, USA). Species and breed specific regression equations were calculated. These growth equations were used on the data in the tree cadastre of Duisburg for estimating tree height. Only equations with minimum R2 = 0.5 and p ≤ 0.001 (highly significant) were used. Furthermore, we calculated height and crown specific equations by defining three height and crown growth classes (tall/broad: >20 m tree height and >14 m crown width; medium: 20 to 15 m tree height, 14 to 8 m crown width; small: <15 m tree height, <8 m crown width) and summarizing all species depending on their typical growth characteristics on urban sites [20].
With the species and breeding specific equations, the tree heights of 43,826 trees or 88% of the trees in the cadastre could be predicted. For the other 12%, genus specific or height and crown specific equations were used. Chosen growth equations are listed in Appendix A. In most cases power functions fitted best to the sample. These functions consider the relatively fast height growth by small stem girths which slows down continuously when the trees age and stem girths enlarge [31]. Two examples of the regression equations are given in Figure 2. Betula pendula is a pioneer tree species which is fast growing and reaches a height of 25 m typically at a girth of 200 cm. In contrast, Aesculus hippocastanum has a slower height growth and reaches a height of 25 m typically at a girth of 350 cm.
Table 2 gives an overview of the height estimation for the ten most frequent species in the cadastre. The average height ranges from 19 m (Platanus x acerifolia) to 10 m (Fraxinus excelsior). The calculated heights fitted well to the reachable heights given in the literature of the regarded species and do not overestimate their tree growth [20,32]. A wider variation between the maximum estimated height and the reachable height occurs for Fraxinus excelsior due to a relative small maximum DBH. An average DBH of 18.5 cm indicates that most individuals of Fraxinus excelsior in the cadastre are young, newly planted trees which have not yet reached their typical height.

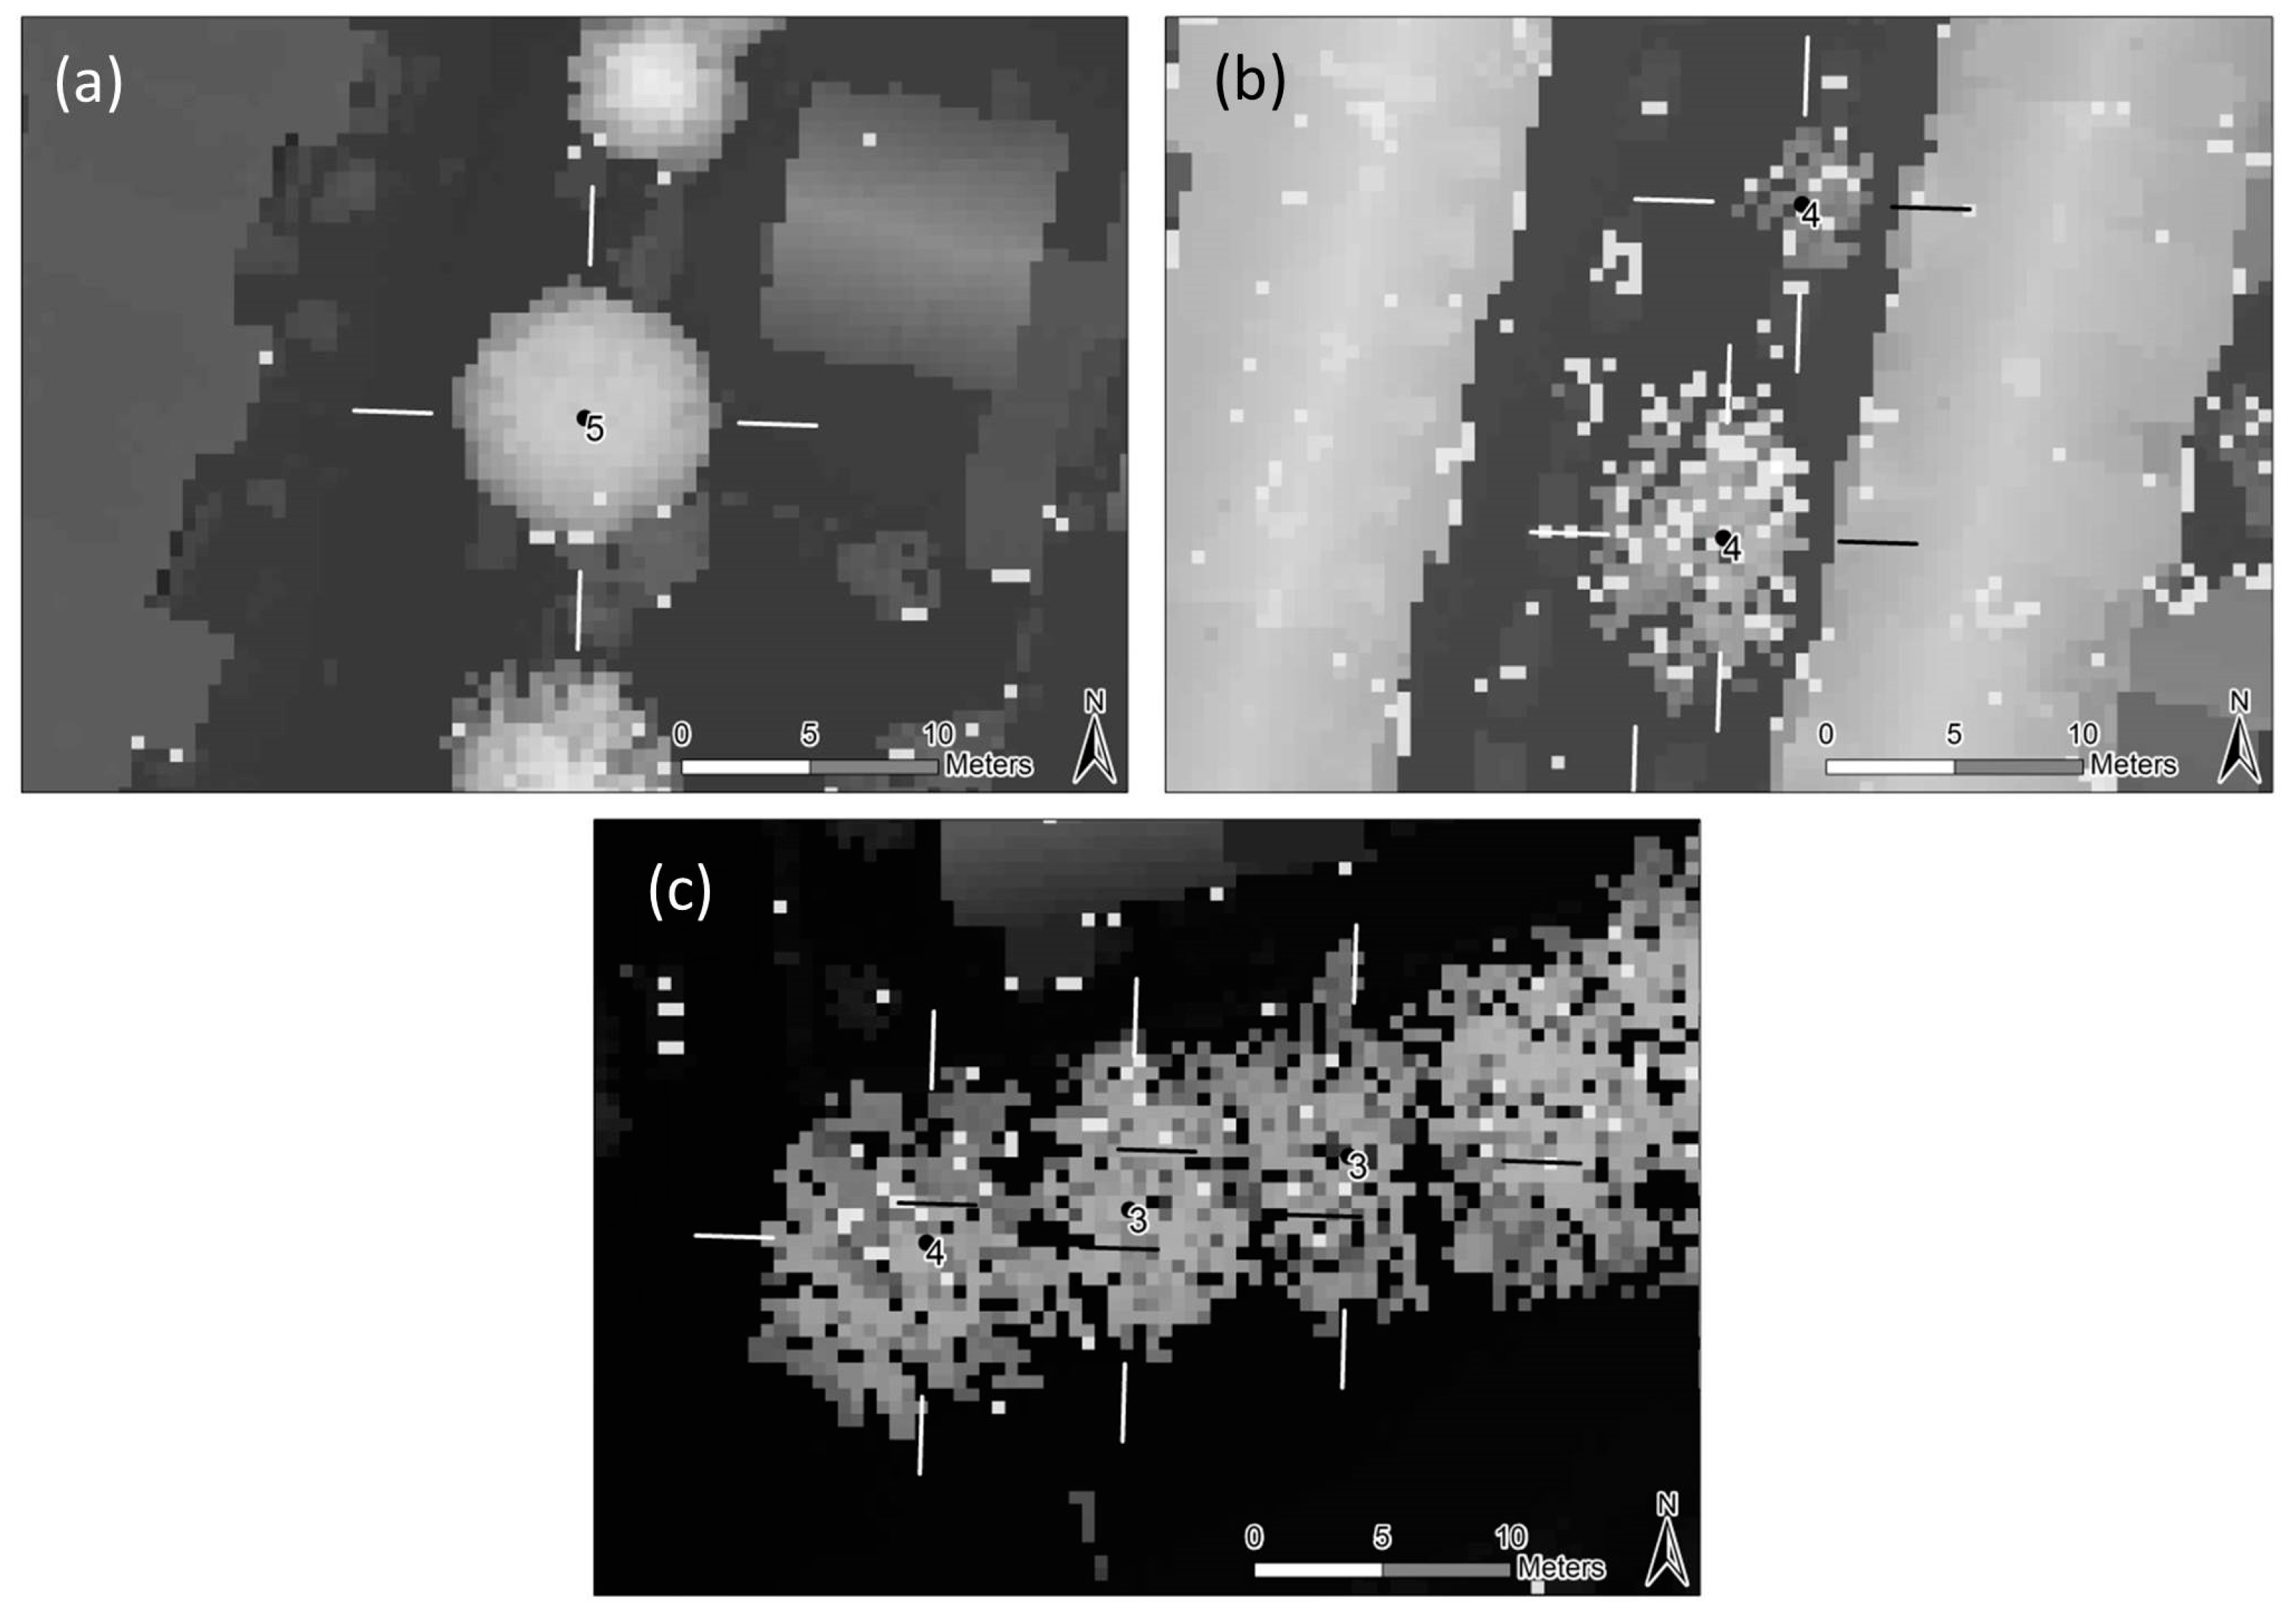
2.3.2. Estimating Crown Light Exposure

In the i-Tree Eco model, crown light exposure (CLE) is a factor that estimates the amount of sunlight a tree is receiving. During field surveys, the parameter is measured by defining the number of sides from which the individual tree receives sunlight. The scale values range from 5 to 0. If the tree receives sunlight from four directions and from above, the value 5 is given. If from one side another tree or a building casts a shadow on the crown, the next lower value (4) is given. Because the CLE is not necessary for tree maintenance, this parameter is probably not yet contained in any tree cadastre.
The CLE was estimated in a GIS procedure with a digital surface model (DOM1L) of the entire city. The DOM1L has a raster size of 0.5 m2. To calculate the surface height in four directions of the crown, lines with the length of the crown radius plus three additional meters were automatically created from the center of the tree in all four compass directions by using the ArcGIS Tool “Bearing Distance to Line” (ArcGIS 10.1, ESRI Inc., Redlands, CA, USA). Then, the process was repeated, creating four lines for each tree with the length of the crown radius. With the tool “Symmetrical Distance”, both lines are subtracted from each other. The remaining line segments have a length of three meters, beginning at the edge of the crown.
For every segment, the mean raster value from the surface model is calculated and subtracted from the tree height. If the result is positive, the tree is higher than the surroundings and the sun reaches the crown from that specific side. If the result is negative, a near building or tree is higher than the tree. From that specific side a shadow would probably be cast on the crown. In most cases, urban trees are planted in a specific distance to each other. Because of that, we assume that no light limitation comes from above. Therefore, every tree gets a minimum CLE value of 1.

2.4. Assessing Cooling Effects by the Canopy Layer

Cooling effects through the tree canopy layer cannot yet be calculated with i-Tree Eco. Overall, there are just a few approaches to predict this ecosystem service (e.g., [8]), which will be more and more important for city dwellers in the context of increasing thermal load and urban heat island effect [4]. We develop our own model to estimate the energy reduction provided by the trees, which is missing from i-Tree Eco’s output. For assessing the cooling effects, we predict the energy reduction under the tree by combining the elimination of direct radiation by the canopy layer and the reduced thermal radiation which occurs due to lowered surface temperature in the tree shadow.
For the calculation of the reduced thermal radiation from the surface under the tree, we used the leaf area which was calculated by i-Tree Eco [33]. In an empirical work by Gillner et al. [7], the difference of the surface temperature between the shadowed area under different tree species and the nearby fully sun-exposed asphalt were measured with thermal sequences during a heat wave in Dresden, Germany. In this study, the thermal images were taken between 12:00 and 15:30 h CEST (Central European Summer Time) on three sunny and cloudless days in August. They found a positive linear regression between the leaf area density (LAD) and the surface temperature differences between the sun-exposed and the shaded asphalt, explained by the following equation (see [7] (p. 39)):
Δ T = 2.38 + 4.63 × L A D
where ΔT = sun-exposed to shaded surface temperature (K) and LAD = Leaf Area Density (m2 m−3).
We used this equation to estimate the capacity to reduce surface temperature. The LAD was calculated by dividing the leaf area from the crown volume, following the formulas given in [34]:
L A D = L A × V C 1
where LA = leaf area (m2), VC = crown volume (m3).
V C = W C 2 × L C
where WC = crown width (m), LC = crown length (m).
L C = H t H l c
where Ht = tree height (m), Hlc = lower crown height (m).
The surface temperature reductions under the crown were transformed to the thermal radiation following the Stefan–Boltzmann Law [35]:
L = ε × σ × T 4
where L↑ = thermal radiation (W m−2); ε = Stefan–Boltzmann-Constant; σ = emissivity (asphalt = 0.96); T = surface temperature (K).
The direct radiation was calculated for the same time-period as analyzed in the study of [7] (dates: 2 August 2015, 3 August 2015, 7 August 2015). According to [36], the irradiance which a plane surface receives during a cloudless day can be described by the following equation:
Q = Q 0 × E c × s i n β × 0.9751 × τ
where Q↓ = irradiance of the direct solar radiation (W m−2); Q0 = solar constant (W m−2) (1368 W m−2); Ec = eccentricity factor (-); β = sun elevation angle (°); τ = transmissivity of the atmosphere.
Ec and β differ between the days of the year and the daytime. τ describes the weakening of the direct radiation by crossing the atmosphere and is equal to the sum of the radiation absorption by oxygen, carbon dioxide, ozone and water vapor and the radiation scattering on air molecules and aerosols [37]. The modelling of the direct solar radiation was made in time steps of 15 min between 12:00 and 15:30 h CEST.
Following the formula from [36], the average direct solar irradiance for the regarded time period is 518.4 W m−2. By rearranging the Stefan–Boltzmann Law [38], the temperature of the sun-exposed asphalt surface nearby the tree is about 39 °C. That temperature was used as a reference to calculate the surface temperature in the tree shadow, using the Formula (1). The surface temperature of the tree’s shadow was then converted into the amount of thermal radiation, as described in Formula (5).
The average direct solar radiation in the regarded time period was used to calculate the reduction of the direct radiation through the canopy layer by following the Lambert–Beer Law modified by [39] for a uniform leaf arrangement in the canopy:
Δ Q = Q × e k × L A I
where ΔQ = irradiance under the tree canopy (W m−2); Q↓ = irradiance of the direct solar radiation (W m−2); k = extinction coefficient (0.7); LAI = leaf area index (m2 m−2).
For k, we assume an extinction coefficient of 0.7, which is a typical value for deciduous forests. The leaf area index (LAI) was estimated by the i-Tree Eco model. The sum of ΔL (W m−2) and ΔQ (W m−2) can be multiplied with the ground cover area (m2) to the total energy reduction ΔE (kW) per tree.

3. Results

3.1. Crown Light Exposure

About 33% (16,318 tree individuals) of the trees have no limitation in receiving direct sunlight and 32% (15,753 trees) are shaded only from one direction. 915 trees (2%) get the lowest rating and receive sunlight only from above. The frequency distribution of CLE values represents the different tree planting types in urban areas (Figure 3). In the first case (a) the tree is planted in a solitary stand in a specific distance to other trees and buildings. The tree receives light from every direction. The second case (b) shows trees in a narrow building canyon. The canopy almost reaches the wall of the higher building. Hence, it is shaded from eastern direction. The third case (c) is when a group of trees stand close together and their canopy merges. Two trees have limited access to sunlight from east and west which lead to a rating of three. The tree at the end of the row is rated with the value 4 because light limitation occurs only from the tree standing on the east side.

3.2. Energy Reduction as Proxy for Thermal Comfort under the Canopy

Table 3 shows the results from the assessment of direct and thermal energy reduction for the ten most frequent trees in the cadastre. The LAD of the whole canopy ranges between 0.3 (Acer saccharinum) and 1.0 m2 m−3 (Tilia platyphyllos) which are typical values for tall forest trees. According to [34], the LAD can range from 0.15–1.6. The reduction of thermal radiation (ΔL) ranges between 24.1 W m−2 (Acer saccharinum) and 44.6 W m−2 (Tilia platyphyllos) and the reduction of the direct radiation (ΔQ) ranges between 489.7 W m−2 (Quercus robur) and 511.8 W m−2 (Tilia cordata). These ten species can reduce direct radiation by 87% to 98% referred to the reference Q of 518.4 W m−2. Among all species, the reduction of thermal radiation is significantly smaller than the reduction of direct radiation.
The overall energy reduction attributed to the ground cover is lowest for Fraxinus excelsior (13.2 kW) and Corylus colurna (14.2 kW). F. excelsior can have a higher ground cover area when the trees enlarge, but in the cadastre, the species individuals are newly planted and have not yet reached their typical height. The highest values are generated by Platanus x acerifolia (82.7 kW) and Acer saccharinum (60.6 kW) because of their huge average ground cover area.
The linear relationship between the ground cover area and the energy reduction in direct and thermal radiation for all species can be described by the following equation which shows that energy reduction increases by 0.53 kW per 1 m2 ground cover.
Δ E = 0.53 × A G + 0.16
where ΔE = energy reduction (kW); AG = ground cover (m2); r = 1; R2 = 0.99; p < 0.0001; n = 233。

3.3. Regulating Ecosystem Services Provided by Public Urban Trees

Estimation of the total regulating ecosystem services provided by all cadastre trees is made for the effective canopy range only. This effective range is determined as the summative ground cover from all cadastre trees, which is 2.95 km2 in Duisburg. The overall annual emission rate of CO2 is 120,469 t per km2 in Duisburg [41]. Hence, the emissions are about 355,383 t per year in the effective range of the trees (2.95 km2). Per km2 and year, an average of 212 t gaseous pollutants (NO2, SO2) and particulate matter are emitted in Duisburg. Therefore, emissions of about 626 t per km2 can be expected in the effective range of all cadastre trees.
Table 4 shows that the publicly owned and managed urban trees have only a small effect in mitigating the urban emissions in their effective range. 0.2% of the urban CO2-Emissions are sequestered by the trees and the pollution removal is about 2.6% of the urban emission of gaseous pollutants and particulate matter. However, in considering the pollution removal, it is useful to account for the gaseous pollutants removal and particulate matter removal separately. The removal of NO2 and SO2 is about 0.9% and 2.9%, respectively, and is comparable to the overall pollution removal. However, the removal of particulate matter is notable: 15.9% of the urban particulate matter emission can be removed through the tree canopy. Information on ozone emissions in Duisburg is not available; however, a total removal of 11 t y−1 indicates notable effects. Around 69,800 m3 of rainwater per year is intercepted by the trees which is a low quantity as measured by the whole precipitation amount in their effective range. However, the most effective service is the reduction in energy: The surface area equivalent to the summative ground cover area or effective range of the trees (2.95 km2) receives 3054 MW due to direct and thermal radiation in August between 12:00 and 15:30 h on a cloudless day. The cadastre trees can reduce this energy load by almost 58%. Therefore, we agree with [7] that further research on energy reduction by street trees should be carried out.

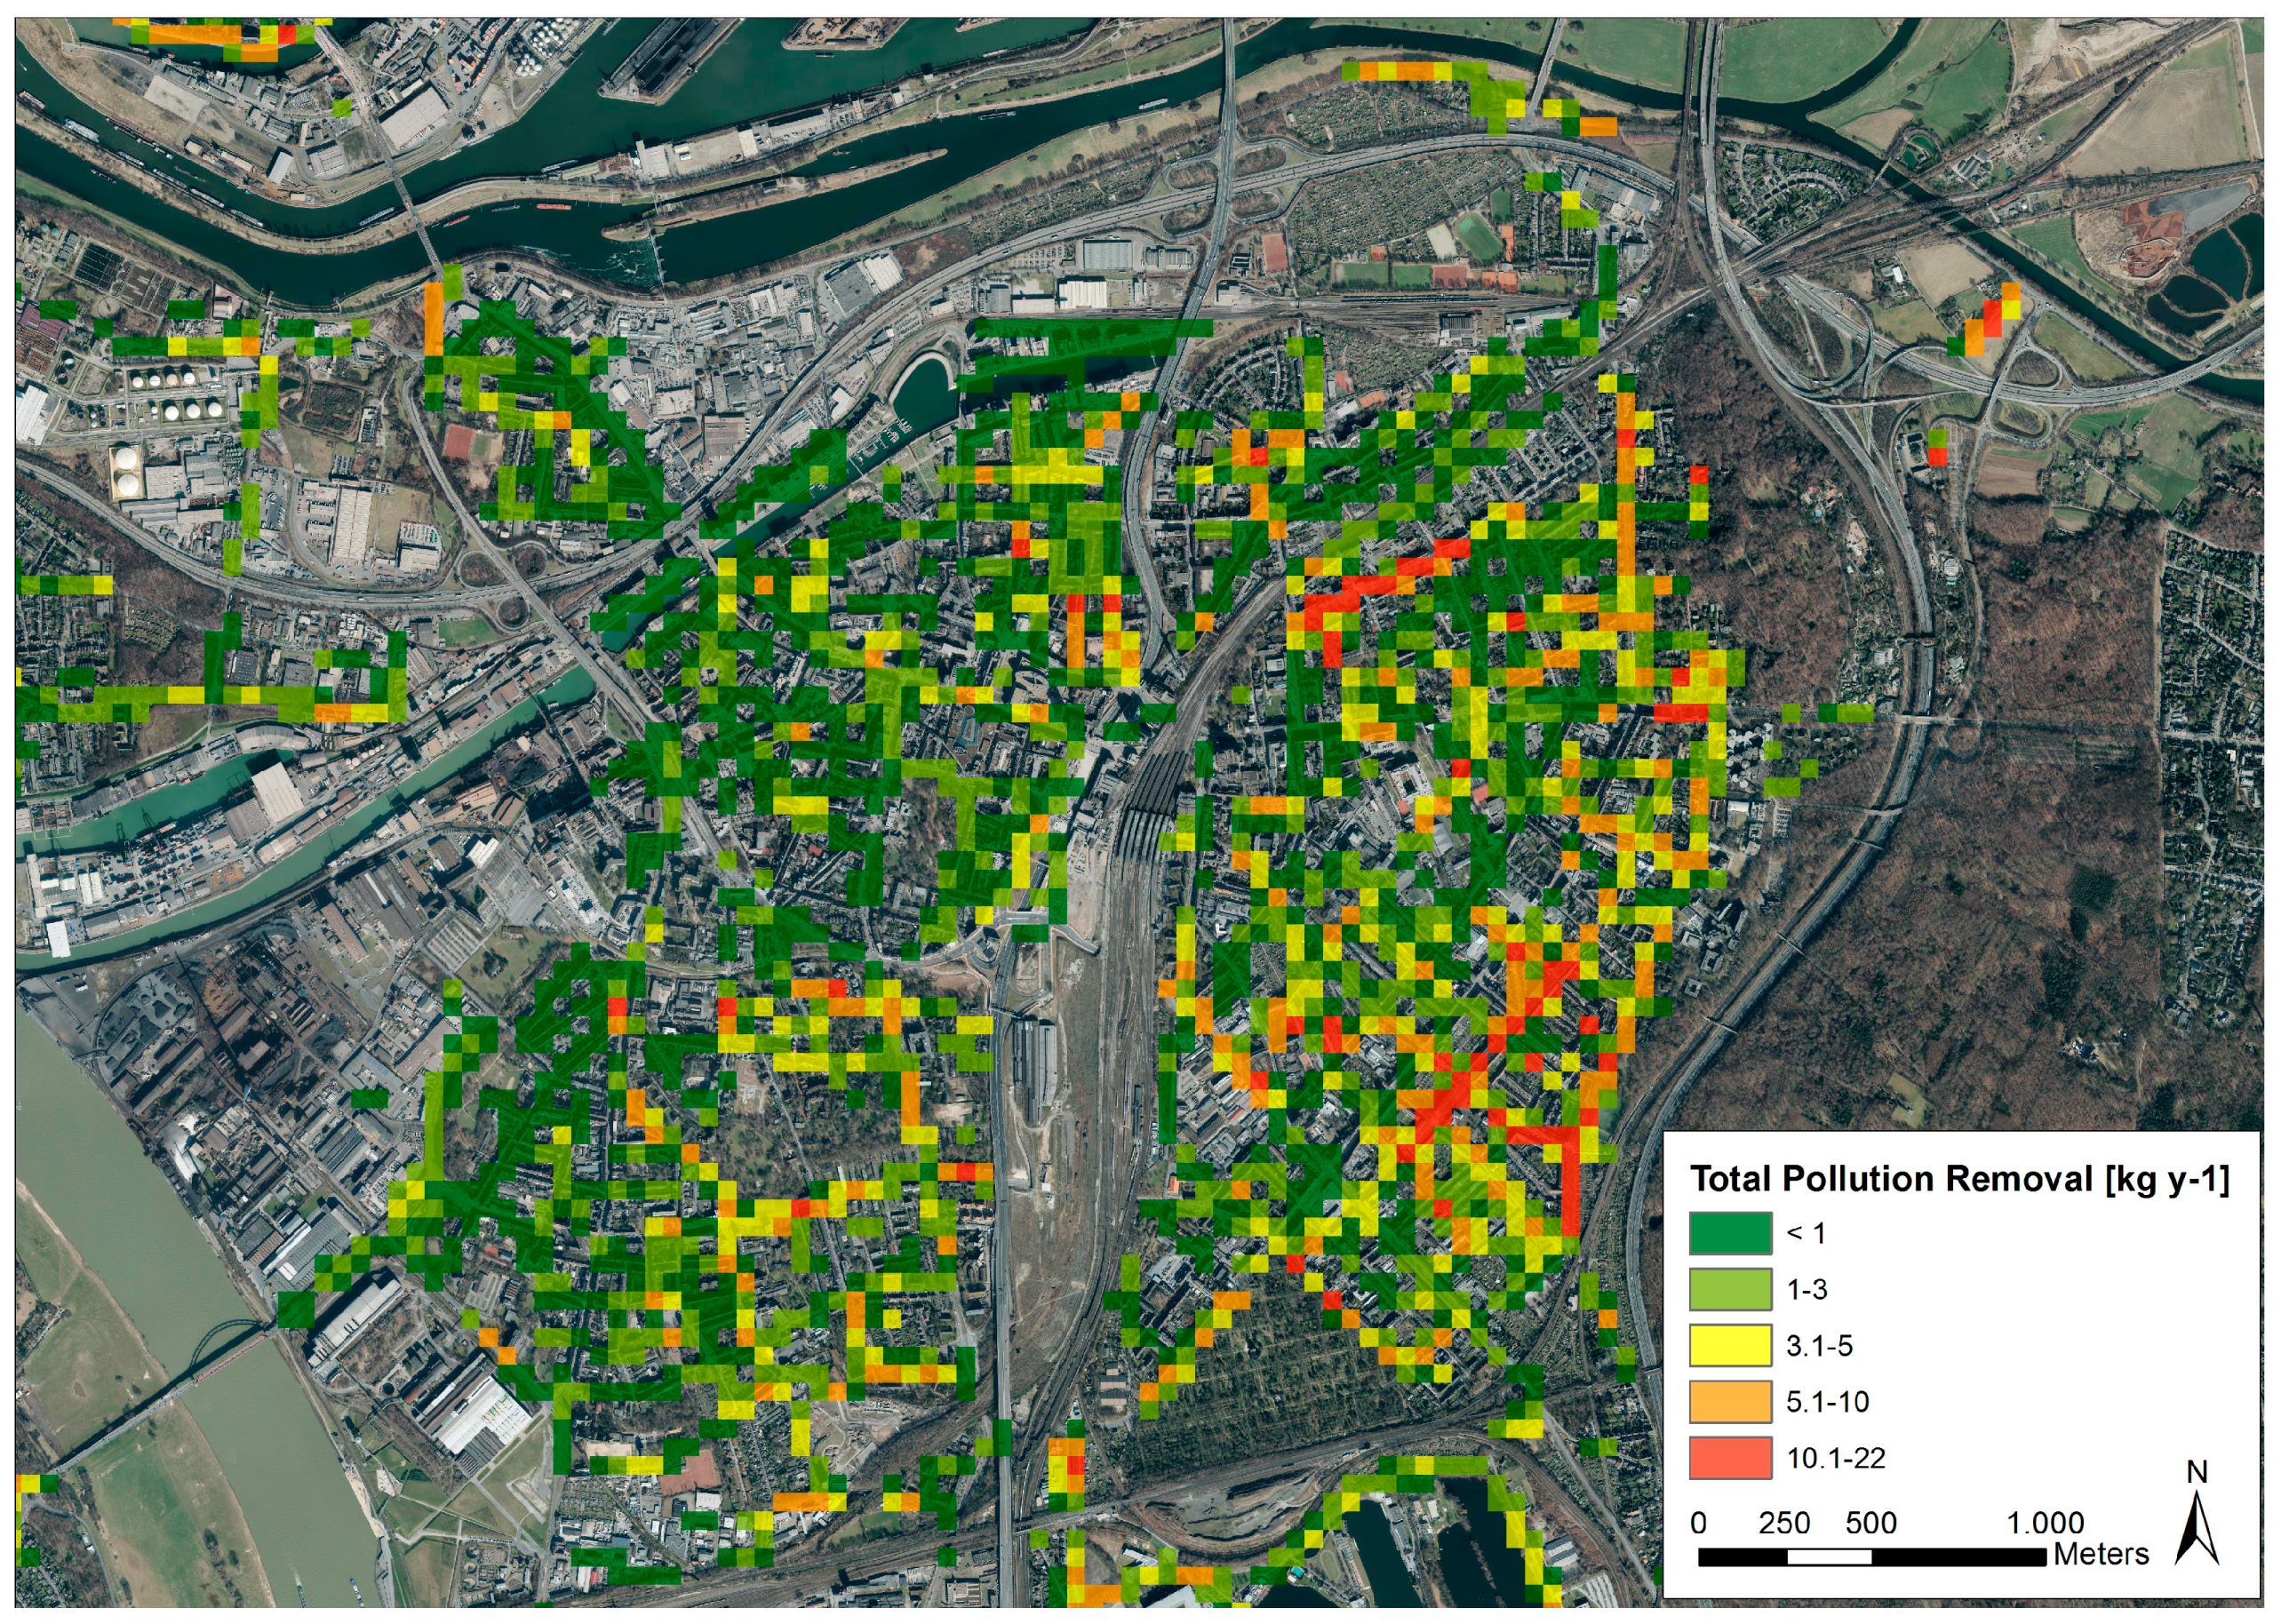
3.4. Spatial Distribution of Ecosystem Services

A main advantage in assessing ecosystem services with tree cadastre data is that those inventories are mostly GIS-compatible, i.e., they are in digital data formats that can be easily imported such as spreadsheets, comma separated values, or shapefiles. Because the stem coordinates are documented during tree inspection, the ecosystem services can also be aggregated on a spatial level. To illustrate that approach the streets with highest and lowest ecosystem services are shown in Table 5.
The highest regulating ecosystem services provided by street trees are observed in the Voßstraße in the district Obermeiderich and in the Königsberger Allee. Both lie in residential areas and are characterized by huge Platanus x acerifolia trees. Currently, the trees on Schifferstraße at the inland port and on Europaallee in the industrial park Friemersheim provide the lowest ecosystem services in Duisburg. Both streets are characterized by newly planted Fraxinus excelsior trees; their regulating ecosystem services will improve when those trees enlarge.
Figure 4 shows the air pollution removal by urban trees in the downtown districts as one possible output that can inform practitioners and decision-makers. The air pollution removal is especially low in the harbor area, near the railroad station but also in some residential areas. By analyzing the spatial distribution, districts with low availability of regulating ecosystem services can be identified and strategies for improving the benefits of urban green can be designed.

4. Discussion

The results of the provided ecosystem services are similar to previous findings in comparable studies. Baró et al. [25] reported that the urban trees in Barcelona remove less than 1% of the urban NO2-emissions but 22% of the particulate matter emissions. In Strasbourg, 7% of the PM10-emissions are potentially removed by urban trees, while the removal of gaseous pollutants is small [22]. The empirical study from Langner [42] shows that 11% of the particulate matter emissions at a roadside can be removed by a single Acer platanoides. Dochinger [43] measured a reduction of particulate matter pollution in a deciduous forest of around 30%. The calculated annual CO2-sequestration is comparable with the i-Tree Eco study from Barcelona and makes a modest contribution to climate change mitigation [25]. It can be concluded that the Duisburg street trees have a remarkable effect on particulate matter removal and in reducing energy from radiation due to shadow casting. However, for the CO2-sequestration, the hydrological benefits and the removal of gaseous pollutants are less important.
This work shows that it is possible to assess ecosystem services with tree cadastre data. The presented method is cost-efficient, time-saving and can be reproduced with every tree cadastre which has the same or a better database. The administration can generate a report of the status of the ecosystem services provided by urban trees on a species and on a spatial level. Furthermore, ecosystem services can be observed over time periods. With that information, urban areas deficient in the ecosystem services can be identified, as shown in Figure 4. Planning scenarios for improving the welfare function of urban green can be created and the value of trees for the citizens can be articulated. Those findings can be used as arguments that counter deforestation or sacrificing trees for preferred and competing urban land uses.
However, there are still some constraints in the method which need to be taken into account as discussed in the following paragraphs.
The ecosystem services were calculated with a model for which the fundamental research occurs mostly in the USA. Models are constructs based on specific conditions, but they cannot completely reflect the full ecological complexity. Aguaron & McPherson [44] calculated C-storage and CO2-sequestration for the urban trees of Sacramento with different models (among others, i-Tree Eco) and found that i-Tree Eco in comparison mostly underestimated these ecological functions. The overall variability was about 29% (38–49 t ha−1) in C-storage and about 55% (1.8–2.8 t ha−1) in CO2-sequestration. Considering these results, it can be assumed that field surveys will provide results with less bias in most cases and that i-Tree Eco provides conservative estimates of ecosystem services. We caution that the results presented here may not precisely represent the real scenarios of regulating ecosystem service provision by urban trees due to a number of assumptions and simplifications that are inherent to the approach presented here and inherent to the application of the i-Tree Eco model. However, it should be kept in mind that the basis of models such as the i-Tree Eco is the use of allometric equations, which are applied by the model to the sampled urban trees to estimate biomass, leaf area and subsequent C storage. This is an internationally accepted approach that avoids destructive sampling, i.e., felling, weighing of trees on site, and determining the leaf area with a planimeter [23]. This would allow for measuring C-storage, CO2-sequestration, and pollutant removal. For interception assessment, bulk precipitation in open areas and throughfall could be measured with fixed rainfall collectors. Leaf area density measurements would have to be combined with thermal imagery or other surface temperature measurements to quantify the effect of shading for a larger sample of trees and sites than demonstrated in the study of Gillner et al. [7]. This discussion underscores that inaccuracies in the estimates and error propagation in the i-Tree Eco model are to be taken into account when interpreting the results. Inaccuracies in the estimates are inevitable as some parameters are based on assumptions and simplifications rather than measurements of the circa 50,000 street trees in our sample (see Figure 1).
In conclusion, the justification for using the i-Tree Eco model is the practicability: empirical surveys to measure ecosystem services for a whole city are very time-consuming and expensive and the costs will exceed the usefulness of the results in most cases for city administrations. A typical regional field survey for an i-Tree Eco assessment will cost around $80,000 for 300 plots [44]. The costs for measuring ecosystem services for 50,000 trees are not numerable. Therefore, it is useful to take available data, like tree cadastres, which already give a lot of information for the assessment of ecosystem services. However, it should be kept in mind that tree cadastre data typically contain only trees that must be monitored due to road-safety. The cadastre of Duisburg, for example, contains only trees at roadsides and in public places. Based on estimates in the literature, street trees comprise about 2% of the urban tree stock including urban forests. In public and private urban green areas such as parks, gardens and streets, the proportion of public trees can be as high as 60% [45]. This shows the scope of urban climate change adaptation and mitigation which can be addressed by public tree management.
The tree cadastre data can have gaps in some necessary parameters which in this study were filled by statistical and geostatistical methods. The methods for estimating tree height and CLE have limitations. In urban areas, growth conditions can be very heterogeneous due to the substrate in the tree pit limiting space for the rhizome, the effect of drought, stress because of salt used for de-icing and many more factors which influence the growth of trees significantly. Because the growth equations were generated from urban trees in the same growth region, we assume that most impacts are considered in the equations, but they may not give the exact tree height under all urban conditions. Alternatively, tree height could also be measured by using a surface model derived from remote sensing or airborne laser scanning datasets [46]. In that case, the user should be sure that there is no time gap between the aerial survey for the surface model and the tree inspection. Otherwise, newly planted trees cannot be found in the surface model or some trees may be cut or pruned. For practitioners, it should be noted that the growth equations for predicting tree height are calculated for urban trees in a specific climate region. Applying those equations to trees under different growth conditions, in dense tree stands or forests for example would lead to inaccuracies. For example, [46] did not find a power relationship, but a linear relationship between the DBH and the tree height in a forest of Japanese cypress (Chamaecyparis obtusa). Despite the high correlation coefficients and the validation that the equations give realistic results for the tree height (Table 2), we caution that for some species the sample size is rather low (e.g., Ailanthus altissima with 15 trees). More research is needed to increase sample size and to subsequently improve the equations for urban trees under specific growth conditions.
When using the predicting method to analyze CLE, it is crucial to document the exact stem coordinates as inaccurate coordinates will lead to errors; furthermore, the crown width must be measured correctly. To support ecosystem service assessment with tree cadastres and prevent the need for models to estimate missing data, practitioners should consider adding measurements of tree height and CLE to regular tree inspections.
So far, the assessment of cooling effects from trees due to shadow casting and transpiration cannot be calculated by i-Tree Eco. However, there are a few approaches to assess cooling effects for trees in urban sites (for example [8,9,47,48,49]). In this study, the energy reduction in the shadow of the trees was calculated with different equations from the literature by using the cadastre and i-Tree Eco data. This approach considers both the reduction in thermal radiation due to the reduced surface temperature and the reduction in direct radiation through the canopy layer and can be a useful add-on for an i-Tree Eco analysis. For a more simple evaluation to predict energy effects through shading, the equation in Section 3.2 can be used, which shows that energy reduction increases by 0.53 kW per 1 m2 ground cover. Because the formula from [36] is an iterative equation, energy reduction can be calculated hourly, depending on the solar angle, eccentricity and emissivity, which makes it suitable for an additional module in i-Tree Eco considering energy effects. The assessment shows that the overall energy reduction is mainly controlled by the reduction of the solar irradiance. This considers the fact that human thermal comfort is mainly achieved by the reduction of short-wave solar radiation by shading (a reduction about 850 W m−2 can occur [50,51]), while the air temperature reduction due to evapotranspiration has only a little effect on the thermal load (0.5 K up to 3 K measured by [52] on a small urban green wooded site). 80% of the cooling effect comes from shading, 20% from evapotranspiration [50]. The cooling effect can significantly reduce the need for air-conditioning in houses [53]. However, it should be kept in mind that the calculation of the thermal energy was based on a study carried out in Dresden (Germany) for a specific day and year during a heatwave. The thermal energy produced by the asphalt under trees may differ during the year but also with different materials and locations. Therefore, future measurements should include multiple days, locations and surface materials to improve the correlation between the LAD and the surface temperature reduction. For the Monsi–Saeki Law, we assumed an extinction coefficient of 0.7 which is a typical value for deciduous forests. However, the coefficient may not be valid for urban trees. The measurement of the extinction coefficient under urban trees should be carried out in following studies regarding the energy reduction provided by street trees.
By using tree cadastre data, the results from ecosystem service assessments depend on the amount and accuracy of the available data. There can be spatial gaps when street trees are not monitored; results will underestimate ecosystem services if trees in parks or on private property are not included. Leaving out shrubberies and hedges means failure to account for their high pollution removal capacity. Another restriction is the time gap: as trees enlarge, the ecosystem service provision increases. A storm event or pests may damage the tree stock and it will take until the next inventory update to reflect such changes in the cadastre. However, this equally applies to remote sensing based assessments. Therefore, it is necessary to calculate these services again in different time periods. When the site and species specific growth conditions are known (annual gain in leaf area and DBH), a forecast can be made to show how the ecosystem service provision may change [8]. To close the temporal and spatial gaps, it is possible to collect more data and develop species specific regression equations for the known trees in the cadastre and to use them for the missing trees.
Urban trees may not be the panacea to urban environmental problems, but they can provide microclimate regulation at a scale that is highly relevant for urban inhabitants: the local scale. Moreover, urban greening contributes to climate change adaptation and mitigation in urban areas. City administrations could pay more attention to these ecosystem services and need more guidance for planning and design of urban green infrastructure, including street trees. Our study points out the removal of particulate matter and the reduction of direct and thermal radiation by publicly owned and managed trees. Based on these results, further research could be directed at planning recommendations and urban climate modeling. Including the orientation of the streets into the estimation of cooling benefits could refine the results. Norton el al. showed that street trees would provide less benefit in narrow street canyons with a high degree of self-shading [54]. Also, the exchange of air can be blocked by trees in narrow streets, leading to an accumulation of pollutants [55]. Hence, broad streets with high solar exposure should be prioritized for tree planting. However, such recommendations for planting trees will vary with geographic location and climate of the city. We address the local scale, while urban climate modeling studies that go beyond that include the radiative heat exchange among trees and sky, building walls and the ground to simulate cooling and energy saving potentials of urban trees on the neighborhood to city scales [56].
Empirical evidence on cooling effects of urban trees is usually based on observational studies of a small number of green sites or beneath trees and the results are not easily scalable to neighborhood and city scales or other geographic locations and climates [54,57]. Our novel approach takes a different angle and uses a tree cadastre database on which methods are applied to fill data gaps on tree height and crown light exposure. The scale of the results is determined by the location and distribution of the modelled trees in the real urban setting. Ground validation of the results would encompass several additional observational studies and analyses that are subject to further research, yet beyond the scope of the present paper.

5. Conclusions

Considering the citywide emissions in Duisburg, the evaluated street trees have only a small mitigating effect. Notable impacts in their effective range are the removal of particulate matter (16%) and the reduction of thermal load (58% of the radiation). Also, the removal of ozone seems to have an important effect, but there is no information on citywide ozone emissions for comparison. The most important physiological parameters linked to provisioning of these ecosystem services are biomass and leaf area. The C-storage and the CO2-sequestration is even higher when the biomass in the tree is greater. Interception, pollution removal and energy effects increase with the amount of leaf area. It can be concluded that, in the face of these ecosystem services, the planted tree species is of secondary importance as long as the tree is healthy and well adapted to the tree stand where it can produce high amounts of biomass and leaf area. To enhance climate regulating ecosystem services it is necessary to choose tree species which are suitable for urban sites and which can cope with the impacts of urban climate change.

Acknowledgments

We thank Martin Siry, Wirtschaftsbetriebe Duisburg (AöR) for making the tree cadastre data from the year 2015 available. The authors would also like to express their gratitude to three anonymous reviewers who provided constructive comments on an earlier version of this manuscript. We acknowledge financial support by the Open Access Publication Fund of the University of Salzburg.

Author Contributions

Angela Hof, Tobias Scholz and Thomas Schmitt conceived and designed the study; Tobias Scholz performed the modelling with i-Tree Eco, developed and performed the methods (energy reduction, tree height equations, CLE estimation) and contributed the materials; Tobias Scholz and Angela Hof analyzed the data and wrote the paper. The manuscript was produced through contributions of all authors; all authors have given approval to the final version of the manuscript.

Conflicts of Interest

The authors declare no conflict of interest.

Appendix A

Table A1. Species and breed specific growth equations for estimating tree height. x = stem girth (m).
Species/BreedFormularR2 (corr.)Standard Errorpn
Acer campestre11.323 *(x0.535)0.880.7630.17<0.000180
Acer platanoides13.323 *(x0.606)0.790.620.24<0.0001389
Acer pseudoplatanus13.311 *(x0.558)0.750.570.22<0.00011323
Acer pseudoplatanus ‘Erectum’12.076 *(x0.886)0.750.550.22<0.000137
Acer saccharinum14.606 *(x0.551)0.740.540.20<0.0001545
Acer saccharinum ‘Wieri’14.797 *(x0.526)0.820.640.13<0.000118
Aesculus carnea11.461 *(x0.586)0.860.730.19<0.000124
Aesculus carnea ‘Briotii’10.115 *(x0.600)0.850.720.19<0.0001319
Aesculus hippocastanum10.894 *(x0.599)0.880.770.21<0.0001301
Aesculus hippocastanum ‘Baumanni’9.901 *(x0.473)0.950.900.10<0.000145
Ailanthus altissima11.454 *(x0.615)0.930.860.19<0.000115
Betula pendula15.355 *(x0.607)0.780.610.18<0.0001612
Betula pendula ‘Tristis’16.355 *(x0.636)0.790.620.17<0.000161
Carpinus betulus15.117 *(x0.676)0.870.750.27<0.000171
Corylus colurna13.997 *(x0.679)0.860.740.20<0.0001424
Crataegus x lavallei10.165 *(x0.610)0.740.540.25<0.0001227
Fagus sylvatica11.995 *(x0.622)0.770.590.26<0.0001120
Fraxinus excelsior13.968 *(x0.569)0.850.720.19<0.0001943
Fraxinus excelsior ‘Diversifolia’13.477 *(x0.409)0.730.530.14<0.000182
Fraxinus excelsior ‘Westhof Glorie’13.948 *(x0.538)0.890.780.20<0.000143
Fraxinus ornus10.865 *(x0.459)0.850.720.15<0.000127
Ginkgo biloba15.595 *(x0.625)0.770.590.28<0.000156
Gleditsia triacanthos15.485 *(x0.629)0.940.880.14<0.0001113
Liquidambar stryaciflura14.810 *(x0.561)0.810.660.24<0.0001116
Liriodendron tulipifera13.352 *(x0.666)0.840.700.25<0.000191
Platanus x acerifolia13.336 *(x0.582)0.850.720.20<0.00011852
Populus x canadensis10.515 *(x0.817)0.760.550.10<0.000128
Prunus avium11.426 *(x0.424)0.720.510.26<0.000148
Qercus robur14.608 *(x0.619)0.810.660.27<0.000160
Quercus robur ‘Fastigiata’20.091 *(x0.930)0.860.740.27<0.0001132
Quercus rubra14.113 *(x0.629)0.850.720.21<0.0001387
Robinia pseudoacacia12.259 *(x0.625)0.860.720.15<0.000124
Robinia pseudoacacia ‘Umbraculifera’7.239 *(x0.473)0.840.690.21<0.000122
Sorbus aria12.283 *(x0.782)0.960.910.15<0.000121
Sorbus aucuparia11.747 *(x0.721)0.790.620.24<0.000168
Sorbus x thuringiaca ‘Fastigiata’13.989 *(x0.730)0.820.650.25<0.000115
Tilia cordata14.608 *(x0.588)0.870.750.17<0.000152
Tilia cordata ‘Greenspire’15.499 *(x0.791)0.840.700.17<0.000180
Tilia platyphyllos14.002 *(x0.735)0.890.790.18<0.0001184
Tilia tomentosa13.349 *(x0.694)0.870.760.19<0.0001375
Tilia tomentosa ‘Brabant’15.315 *(x0.633)0.920.840.14<0.000127
Tilia x euchlora15.759 *(x0.703)0.740.550.22<0.0001198
Tilia x vulgaris15.681 *(x0.682)0.90.820.24<0.0001167
Tilia x vulgaris ‘Palida’15.486 *(x0.574)0.860.740.17<0.000177
Height and crown specific equations
Tall & Broad Crown 13.287 *(x0.586)0.880.780.21<0.000123,923
Tall & Medium Crown14.882 *(x0.591)0.840.700.20<0.00014245
Tall & Small Crown13.563 *(x0.790)0.760.580.32<0.0001233
Medium Height & Broad Crown13.954 *(x0.570)0.850.720.25<0.0001109
Medium Height & Medium Crown13.477 *(x0.625)0.860.740.24<0.00015691
Medium Height & Small Crown14.510 *(x0.609)0.860.740.23<0.0001896
Small & Small Crown9.691 *(x0.477)0.730.530.29<0.00012943

References

  1. United Nations. World Urbanization Prospects: The 2014 Revision; United Nations: New York, NY, USA, 2015. [Google Scholar]
  2. Seto, K.C.; Güneralp, B.; Hutyra, L.R. Global forecasts of urban expansion to 2030 and direct impacts on biodiversity and carbon pools. Proc. Natl. Acad. Sci. USA 2012, 109, 16083–16088. [Google Scholar] [CrossRef] [PubMed]
  3. Hansen, A.J.; Knight, R.L.; Marzluff, J.M.; Powell, S.; Brown, K.; Gude, P.H.; Jones, K. Effects of Exurban Development on Biodiversity: Patterns Mechanisms and Research Needs. Ecol. Appl. 2015, 15, 1893–1905. [Google Scholar] [CrossRef]
  4. Kuttler, W. Climate change in urban areas, part 1, effects. Environ. Sci. Eur. 2011, 23. [Google Scholar] [CrossRef]
  5. Artmann, M.; Kohler, M.; Meinel, G.; Gan, J.; Ioja, I. How smart growth and green infrastructure can mutually support each other—A conceptual framework for compact and green cities. Ecol. Indic. 2017. [Google Scholar] [CrossRef]
  6. Haase, D.; Neele, L.; Andersson, E.; Artmann, M.; Borgström, S.; Breuste, J.; Gomez-Baggethun, E.; Gren, A.; Hamstead, Z.; Hansen, R.; et al. A Quantitative Review of Urban Ecosystem Service Assessments: Concepts, Models, and Implementation. Ambio 2014, 43, 413–433. [Google Scholar] [CrossRef] [PubMed]
  7. Gillner, S.; Vogt, J.; Tharang, A.; Dettmann, S.; Roloff, A. Role of street trees in mitigating effects of heat and drought at highly sealed urban sites. Landsc. Urban Plan. 2015, 143, 33–42. [Google Scholar] [CrossRef]
  8. Moser, A.; Rötzler, T.; Pauleit, S.; Pretzsch, H. Structure and ecosystem services of small-leaved lime (Tilia cordata) and black locust (Robinia pseudoacacia) in urban environments. Urban For. Urban Green. 2015, 14, 1110–1121. [Google Scholar] [CrossRef]
  9. Lehmann, I.; Mathey, J.; Rößler, S.; Bräuer, A.; Goldberg, V. Urban vegetation structure types as a methodological approach for identifying ecosystem services—Application to the analysis of micro-climatic effects. Ecol. Indic. 2014, 42, 58–72. [Google Scholar] [CrossRef]
  10. Nowak, D.J.; Crane, D.E.; Jack, C.S. Air pollution removal by urban trees in the United States. Urban For. Urban Green. 2006, 4, 115–123. [Google Scholar] [CrossRef]
  11. Takashi, M.; Higaki, A.; Nohno, M.; Kamada, M.; Okamura, Y.; Matsiu, K.; Kitani, S.; Morikawa, H. Differential assimilation of nitrogen dioxide by 70 taxa of roadside trees at an urban pollution level. Chemosphere 2005, 61, 633–639. [Google Scholar] [CrossRef] [PubMed]
  12. Beckett, K.P.; Freer-Smith, P.H.; Taylor, G. Urban woodlands: Their role in reducing the effects of particulate pollution. Environ. Pollut. 1998, 99, 347–360. [Google Scholar] [CrossRef]
  13. Xiao, Q.; McPherson, E.G.; Simpson, J.R.; Ustin, S.L. Rainfall interception by Sacramento’s urban forest. J. Arboric. 1998, 24, 235–244. [Google Scholar]
  14. Sanders, R.A. Urban vegetation impacts on the hydrology of Dayton, Ohio. Urban Ecol. 1986, 9, 361–376. [Google Scholar] [CrossRef]
  15. Strohbach, M.W.; Haase, D. Above-ground carbon storage by urban trees in Leipzig, Germany: Analysis of patterns in a European city. Landsc. Urban Plan. 2012, 104, 95–104. [Google Scholar] [CrossRef]
  16. Nowak, D.J.; Crane, D.E. Carbon storage and sequestration by urban trees in the USA. Environ. Pollut. 2002, 116, 381–389. [Google Scholar] [CrossRef]
  17. Strohbach, M.W.; Lerman, S.B.; Warren, P.S. Are small greening areas enhancing bird diversity? Insights from community-driven greening projects in Boston. Landsc. Urban Plan. 2013, 114, 69–79. [Google Scholar] [CrossRef]
  18. Carbó-Ramírez, P.; Zuria, I. The value of small urban greenspaces for birds in a Mexican city. Landsc. Urban Plan. 2011, 100, 213–222. [Google Scholar] [CrossRef]
  19. Kronenberg, J. Why not to green a city? Institutional barriers to preserving urban ecosystem services. Ecosyst. Serv. 2015, 12, 218–227. [Google Scholar] [CrossRef]
  20. Vogt, J.; Gillner, S.; Hofmann, M.; Tharang, A.; Dettmann, S.; Gerstenberg, T.; Schmidt, C.; Gebauer, H.; van de Riet, K.; Berger, U.; et al. Citree: A database supporting tree selection for urban areas in temperate climate. Landsc. Urban Plan. 2017, 157, 14–25. [Google Scholar] [CrossRef]
  21. i-Tree Eco User’s Manual, Version 6.0; Forest Service: New York, NY, USA, 2016.
  22. Selmi, W.; Weber, C.; Rivière, E.; Blond, N.; Mehdi, L.; Nowak, D. Air pollution removal by trees in public green spaces in Strasbourg city, France. Urban For. Urban Green. 2017, 17, 192–201. [Google Scholar] [CrossRef]
  23. Russo, A.; Escobedo, F.J.; Zerbe, S. Quantifying the local-scale ecosystem services provided by urban treed streetscapes in Bolzano, Italy. AIMS Environ. Sci. 2016, 3, 58–76. [Google Scholar] [CrossRef]
  24. Rogers, K.; Sacre, K.; Goodenough, J.; Doick, K. Valuing London’s Urban Forest. In Results of the London i-Tree Eco Project; Treeconomics: London, UK, 2015. [Google Scholar]
  25. Baró, F.; Chaparro, L.; Gómez-Baggethun, E.; Langemeyer, J.; Nowak, D.J.; Terradas, J. Contribution of ecosystem services to air quality and climate change mitigation policies: The case of urban forest in Barcelona, Spain. Ambio 2014, 43, 466–479. [Google Scholar] [CrossRef] [PubMed]
  26. LANUV NRW—Landesamt für Natur, Umwelt und Verbraucherschutz Nordrhein-Westfalen. Climate Atlas of Northrine-Westphalia. Available online: http://www.klimaatlas.nrw.de/site/ (accessed on 10 February 2018).
  27. Snowden, A.; Rauch, B. Klimaanalyse Stadt Duisburg (Climate Analysis of Duisburg). In Report on Behalf of the Regional Association Ruhr; Regionalverband Ruhr: Essen, Germany, 2010. [Google Scholar]
  28. Geobasis NRW. DOP20 Web Map Service. Available online: https://www.wms.nrw.de/geobasis/wms_nw_dop20. The License Germany—Attribution—Version 2.0 is Valid for the Imprint. License Text. Available online: https://www.govdata.de/dl-de/by-2-0 (accessed on 13 February 2018).
  29. LANUV NRW—Landesamt für Natur, Umwelt und Verbraucherschutz Nordrhein-Westfalen. Hourly Pollution Immission on Continuous Measuring Stations in Duisburg. Available online: https://www.lanuv.nrw.de/umwelt/luft/immissionen/stationen-und-messwerte/ (accessed on 17 May 2017).
  30. Peper, P.J.; McPherson, E.J.; Mori, S.M. Equations for predicting Diameter, Height, Crown Width and Leaf Area of San Joaquin Valley Street Trees. J. Arboric. 2001, 27, 306–317. [Google Scholar]
  31. Pretzsch, H. Forest Dynamics, Growth and Yield: From Measurement to Model; Springer Science & Business Media: Berlin/Heidelberg, Germany, 2009. [Google Scholar]
  32. Roloff, A.; Bärtels, A. Flora der Gehölze: Bestimmung, Eigenschaften, Verwendung (Flora of Trees. Determination, Characteristics, Usage), 4th ed.; Ulmer: Stuttgart, Germany, 2014. [Google Scholar]
  33. Nowak, D.J. Estimating Leaf Area and Leaf Biomass of Open-Grown Deciduous Urban Trees. For. Sci. 1994, 42, 504–507. [Google Scholar]
  34. Larcher, W. Physiological Plant Ecology, 4th ed.; Springer Science & Business Media: Berlin/Heidelberg, Germany, 2003. [Google Scholar]
  35. Häckel, H. Meteorologie (Meteorology), 8th ed.; Ulmer: Stuttgart, Germany, 2016. [Google Scholar]
  36. Bird, R.E. A simple, solar spectral model for direct-normal and diffuse horizontal irradiance. Sol. Energy 1984, 32, 461–471. [Google Scholar] [CrossRef]
  37. Bendix, J. Geländeklimatologie (Terrain Climatology); Ulmer: Stuttgart, Germany, 2004. [Google Scholar]
  38. Lauer, W.; Bendix, J. Klimatologie (Climatology), 2th ed.; Ulmer: Stuttgart, Germany, 2006. [Google Scholar]
  39. Monsi, M.; Saeki, T. On the Factor Light in Plant Communities and its Importance for Matter Production. Ann. Bot. 2005, 95, 549–567. [Google Scholar] [CrossRef] [PubMed]
  40. Geobasis, N.R.W. Digital Surface Model (1 m). The license Germany—Attribution—Version 2.0 is Valid for the Imprint. License Text. Available online: https://www.govdata.de/dl-de/by-2-0 (accessed on 13 February 2018).
  41. LANUV NRW—Landesamt für Natur, Umwelt und Verbraucherschutz Nordrhein-Westfalen. Online-Emission-Cadastre NRW. Available online: http://www.ekl.nrw.de/ekat/ (accessed on 17 May 2017).
  42. Langner, M. Analysen zur Staubauflage auf Bäume (Acer platanoides) innerstädtischer Standorte (Analyze of dust coating on trees (Acer platanoides) on urban sites). In Karlsruher Berichte zur Geographie und Geoökologie, 15; Forschungsbericht: Karlsruhe, Germany, 2002. [Google Scholar]
  43. Dochinger, L.S. Interception on airborne particles by tree planting. J. Environ. Qual. 1980, 9, 265–268. [Google Scholar] [CrossRef]
  44. Aguaron, E.; McPherson, E.G. Comparison of Methods for Estimating Carbon Dioxide Storage of Sacramento’s Urban Forest. In Carbon Sequestration in Urban Ecosystems; Lal, R., Augustin, B., Eds.; Springer Science & Business Media: Heidelberg, Germany, 2012; pp. 43–72. [Google Scholar]
  45. Roloff, A. Urban trees—Importance, benefits, problems. In Urban Tree Management. for the Sustainable Development of Green Cities; Roloff, A., Ed.; John Wiley & Sons: New York, NY, USA, 2016; pp. 1–14. [Google Scholar]
  46. Lizuka, K.; Taichiro, Y.; Itoh, M.; Kosugi, Y. Estimating Tree Height and Diameter at Breast Height (DBH) from Digital Surface Models and Orthophotos Obtained with an Unmanned Aerial System for a Japanese Cypress (Chamaecyparis obtusa) Forest. Remote Sens. 2018, 10, 13. [Google Scholar] [CrossRef]
  47. Shashua-Bar, L.; Potchter, O.; Bitan, A.; Boltansky, D.; Yaakov, Y. Microclimatic modelling of street tree species effects within the varied urban morphology in the Mediterranean city of Tel Aviv, Israel. Int. J. Climatol. 2010, 30, 44–57. [Google Scholar]
  48. Donovan, G.H.; Butry, D.T. The value of shade: Estimating the effect of urban trees on summertime electricity use. Energy Build. 2009, 41, 662–668. [Google Scholar] [CrossRef]
  49. Hardin, P.J.; Jensen, R.R. The effect of urban leaf area on summertime urban surface kinetic temperatures: A Terre Haute case study. Urban For. Urban Green. 2007, 6, 63–72. [Google Scholar] [CrossRef]
  50. Kuttler, W. Climate change in urban areas, part 2, measures. Environ. Sci. Eur. 2011, 23. [Google Scholar] [CrossRef]
  51. Mayer, H.; Kuppe, S.; Holst, J.; Imbery, F.; Matzarakis, A. Human thermal comfort below the canopy of street trees on a typical Central European summer day. In Reports of the Meteorological Institute of the University of Freiburg; Meteorologisches Institut, Albert-Ludwigs-Universität Freiburg: Freiburg, Germany, 2009; Volume 18, pp. 211–219. [Google Scholar]
  52. Shashua-Bar, L.; Hoffmann, M.E. Vegetation as a climatic component in the design of an urban street. An empirical model for predicting the cooling effect of urban green areas with trees. Energy Build. 2000, 31, 221–235. [Google Scholar] [CrossRef]
  53. Millward, A.A.; Sabir, S. Benefits of a forested urban park: What ist the value of Allan Gardens to the city of Toronto, Canada? Landsc. Urban Plan. 2011, 100, 177–188. [Google Scholar] [CrossRef]
  54. Norton, B.A.; Coutts, A.M.; Livesley, S.J.; Harris, R.J.; Hunter, A.M.; Williams, N.S.G. Planning for cooler cities. A framework to prioritise green infracstructure to mitigate high temperatures in urban landscapes. Landsc. Urban Plan. 2015, 134, 127–138. [Google Scholar] [CrossRef]
  55. Kniesel, B. Dust and noise reduction. In Urban Tree Management for Sustainable Development of Green Cities; Roloff, A., Ed.; John Wiley & Sons: Oxford, UK, 2016; pp. 177–183. [Google Scholar]
  56. Wang, Z.-H.; Zhao, X.; Yang, J.; Song, J. Cooling and energy saving potentials of shade trees and urban lawns in a desert city. Appl. Energy 2016, 161, 437–444. [Google Scholar] [CrossRef]
  57. Bowler, D.E.; Buyung-Ali, L.M.; Knight, T.M.; Pulling, A.S. A systematic review of evidence for the added benefits to health of exposure to natural environments. BMC Public Health 2010, 10. [Google Scholar] [CrossRef] [PubMed]
Figure 1. Spatial overview of the recorded trees in the cadastre. Own design, background orthophoto shown with permission by reference [28].
Sustainability 10 00712 g001
Figure 2. Regression analysis for Betula pendula and Aesculus hippocastanum generated from the street trees documented in the tree cadastre of Bochum. Betula pendula: r = 0.78; R2 = 0.61; Standard error = 0.18; p ≤ 0.0001; n = 612. Aesculus hippocastanum: r = 0.88; R2 = 0.77; Standard error = 0.21; p ≤ 0.0001; n = 301. The growth equations can be found in Appendix A.
Sustainability 10 00712 g002
Figure 3. Sample scenarios which present the estimation of CLE with the digital surface model. Upper left (a) solitary tree stand without light limitation; upper right (b) street trees near houses with light limitation from one direction; lower (c) trees in alleys with merged canopy and receiving light differently. Black line segments indicate limited light availability. Own results, using a digital surface model data from reference [40].
Sustainability 10 00712 g003
Figure 4. Air pollution removal by urban trees in the downtown area of Duisburg. Own results, background orthophoto shown with permission by [28].
Sustainability 10 00712 g004
Table 1. Comparison between the data requirement for the i-Tree model and the data availability in the tree cadastre. ✓ = Data available; (✓) = Data can be derived; x = Data not available.
Data requirementAvailability
Tree species and breeds
Status
Land-use
DBH (cm)
Crown width (m)
Local climate and air pollution data
Crown missing (%)(✓)
Crown dieback (%)(✓)
Lower crown height (m)(✓)
Tree height (m)x
Crown Light Exposure (CLE)x
Table 2. Minimum, average and maximum tree height estimations for the ten most frequent species in the cadastre of Duisburg in comparison to their typical and reachable height (in brackets) taken from the literature [18,32].
SpeciesnDBH (cm)Height (m)Typical and Reachable Height (m)
MinAverageMaxMinAverageMax
Acer platanoides34470.623.7121.01.210.729.925 (30)
Acer pseudoplatanus31061.331.4127.32.212.928.930 (40)
Acer saccharinum13485.752.1159.25.718.935.530 (40)
Corylus colurna17783.222.779.62.910.826.115 (25)
Fraxinus excelsior15490.618.592.31.59.725.635 (40)
Platanus x acerifolia10,1073.260.7159.23.519.134.025 (35)
Quercus robur10870.627.6130.51.312.835.025 (40)
Tilia cordata54533.837.7101.94.215.828.927 (40)
Tilia platyphyllos9242.926.6117.82.411.636.632 (40)
Tilia tomentosa17416.043.6114.64.216.332.527 (30)
Table 3. Average ground cover, leaf area index (LAI), leaf area density (LAD), surface temperature reduction (ΔT) and the reduction of thermal radiation (ΔL), direct radiation (ΔQ) and the sum of thermal and direct radiation attributed to the ground cover (ΔE) by the ten most frequent species in the tree cadastre. Standard deviation is given.
SpeciesnGround Cover (m2)LAI (m2 m−2)LAD (m2 m−3)ΔT (K)ΔL (W m−2)ΔQ (W m−2)ΔE (kW)
Acer platanoides344736.8 ± 33.67.4 ± 2.70.9 ± 0.56.4 ± 2.141.1 ± 12.6507.4 ± 18.020.0 ± 18.1
Acer pseudoplatanus310648.0 ± 33.07.1 ± 2.40.6 ± 0.35.3 ± 1.333.9 ± 7.9507.2 ± 19.425.9 ± 17.5
Acer saccharinum1348115.7 ± 61.85.4 ± 1.30.3 ± 0.13.7 ± 0.624.1 ± 3.9501.4 ± 17.460.6 ± 32.2
Corylus colurna177826.4 ± 20.26.2 ± 2.40.7 ± 0.35.6 ± 1.535.9 ± 9.4499.3 ± 26.014.2 ± 10.9
Fraxinus excelsior154924.6 ± 27.75.7 ± 1.90.8 ± 0.56.1 ± 1.739.2 ± 10.8499.7 ± 20.413.2 ± 14.8
Platanus x acerifolia10,107154.2 ± 97.77.2 ± 1.80.4 ± 0.24.2 ± 1.027.3 ± 6.5510.9 ± 13.682.7 ± 50.4
Quercus robur108745.9 ± 45.25.0 ± 1.70.5 ± 0.44.7 ± 1.430.5 ± 8.8489.7 ± 34.323.7 ± 23.1
Tilia cordata545360.0 ± 39.38.0 ± 2.60.6 ± 0.35.0 ± 1.432.2 ± 8.5511.8 ± 13.932.5 ± 21.0
Tilia platyphyllos92451.6 ± 59.56.7 ± 2.51.0 ± 0.77.0 ± 3.344.6 ± 20.1505.8 ± 17.027.8 ± 31.9
Tilia tomentosa174180.1 ± 54.97.3 ± 2.00.5 ± 0.34.8 ± 1.330.8 ± 8.0510.7 ± 15.043.2 ± 29.4
Table 4. Ecosystem services provided by 50,000 trees in their effective range (summative ground cover area = 2.95 km2). Data source for urban emissions: [41]. Note that there are no comparative values for ozone (O3) in the emission cadastre. Strong effects are highlighted in bold.
Ecosystem ServiceInventory TreesUrban Emissions, Precipitation, Direct and Thermal Energy ReceivedPercentage
C-storage21,749 t--
CO2-sequestration708 t y−1355,383 t y−10.2%
Pollutants removal (without O3)16 t y−1626 t y−12.6%
NO26 t y−1266 t y−12.3%
SO23 t y−1316 t y−10.9%
PM10 + PM2.57 t y−144 t y−115.9%
O311 t y−1--
Interception69,832 m3 y−12,382,715 m3 y−12.9%
Energy reduction1767 MW3054 MW57.9%
Table 5. Ecosystem services provided by trees in selected streets in Duisburg. Very high and very low values are highlighted in bold.
StreetnC-Storage (t)CO2-Sequestration (kg a−1)Pollution Removal (kg a−1)Energy Reduction (kW)Interception (m3 a−1)
AverageSumAverageSumAverageSumAverageSumAverageSum
Streets with highest ecosystem services
Voßstraße503.5176.562.83141.32.1105.8147.67379.36.3316.7
Königsberger Allee1041.5158.939.94152.11.8183.2128.913,402.95.2542.6
Streets with lowest ecosystem services
Schifferstraße2370.024.32.8669.10.0614.53.9932.00.1228.5
Europaallee620.021.13.4211.60.074.44.2257.90.127.4

