Article

Farmers’ Value Assessment of Sociocultural and Ecological Ecosystem Services in Agricultural Landscapes

1
College of Land Management, Nanjing Agricultural University, Nanjing 210095, China
2
College of Agriculture and Natural Resources, Dilla University, Dilla 419, Ethiopia
3
National and Local Joint Engineering Research Center for Rural Land Resources Use and Consolidation, Nanjing 210095, China
*
Author to whom correspondence should be addressed.
Sustainability 2018, 10(3), 703; https://doi.org/10.3390/su10030703
Submission received: 6 February 2018 / Revised: 25 February 2018 / Accepted: 1 March 2018 / Published: 5 March 2018
(This article belongs to the Section Sustainable Urban and Rural Development)

Abstract

:
Biophysical and economic values of ecosystem services (ESs) are commonly used to define areas for land use and management planning. To date, there has been limited research conducted in Ethiopia regarding farmers’ evaluations of ESs. This article addresses farmers’ evaluations and perceptions of 16 ESs that are provided by five major land uses within two catchments, using a combined method of data generation and synthesis. Most farmers perceived the majority of land use/land cover (LUC) types as multifunctional; however, they showed distinctly diverse opinions of the benefits and services that the land uses provide. The farmers also distinguished pristine ESs as different importantance depending on their location in up- or downstream regions. Accordingly, shade and shelter values in the upstream region and fodder sources in the downstream regions were among the services perceived as the most important, followed by erosion control. Conversely, water treatment and tenure security were attributed poor value. Farmers’ also identified various threats to the studied ESs that were believed to be the consequences of overpopulation coupled with climate change. Routine anthropogenic activities, woodlots extraction, agribusiness investment, and drought and rainfall variability appeared to be the main drivers of these threats. The farmers’ perceptions recorded in this study generally parallel empirical research, wherein anthropogenic and environmental challenges affect the ecosystems. This general consensus represents an important basis for the establishment of collaborative land management activities.

1. Introduction

In the past half millennium, human welfare and the economy have, relatively speaking, undergone sustainable development at the expense of the “degradation of many ecosystems” [1], of which the land transformation process and land use/land cover (LUC) changes have been recognized as the main actors [2,3,4,5]. On a much finer scale, land change patterns are the combined outcomes driven by complex socioeconomic, policy and institutional, and market forces [6]. Because of the coupled impact of growing populations and land degradation, the sub-Saharan region exhibits serious problems related to LUC change that increase societal vulnerability to both environmental and socioeconomic change [1]. The problem is most severe in the populous Ethiopian highlands [2,7] where human interference via LUC change in ecosystems has been recorded for a number of decades [8,9]. A more important driver is agribusiness expansion over native ecosystems and common resources, whereby large tracts of land are being overtaken by corporate capital [2,10,11]. These rapid LUC conversions and simultaneous deteriorations in rural wellbeing are engendering a progression of ecological and social costs and conflicts over the appropriation of ecosystem services [1,12].
Terrestrial ecosystem services (ESs) provided from different land use types are visibly public in nature, containing all ‘’the conditions and processes through which natural ecosystems and the species that make them up sustain and fulfill human life’’ [1,13]. According to this definition, ESs provide societal benefits in general, beyond the benefits they provide to individuals. Jacobs [14] states that ‘’society is more affluent for having ESs, although smaller number of people are privately benefiting from their existence’’. Because ethical concerns and issues of social equity are an eventual outcome of opinion differences, it is important to create a public arena from which argumentation can occur. Thus, investigating suitable procedures that will bring ES appraisal into the public arena appears to be crucial [15,16]. For several decades, investigating farmers’ perceptions of specific natural capital has been a challenging research topic [17]; however, the ESs framework is emerging to become a complimentary approach [1,13,18,19]. The concept of ESs provides a useful framework for investigating farmers’ values and perceptions of the benefits of natural capital within agricultural landscapes.
Recent findings implied that sociocultural perception and preferences of various land uses and provided services can be utilized to identify and assess how ES are valued by the local community [16,20,21,22]. Schultz et al. [23] and Smith & Sullivan [24] also emphasized the significance that considering farmers outlook has in their systematic assessment of land uses, particularly in agro-ecosystems. However, most studies paid more attention to either the biophysical assessment of native and agricultural ecosystems’ ability to provide ES or to their monetary value estimation. Whereas theoretical and practical developments in monetary evaluation have seemed to be a wide-ranging mechanism with which to value ESs, arguments indicate their deficiency at fully capturing sociocultural and regulating dimensions of ESs [18,25]. Complementary measures thus need to be sought via other approaches so as to have an informed decision-making. Yet, research that pursues sociocultural solutions to the problem [24,26] is generally inadequate. In this paper, we address this research gap through the identification of farmers’ valuation of sociocultural and ecological elements of ecosystem (LUC) types within an agricultural landscape. To accomplish this, we studied the indigenous agroforestry dominant Gedeo-Abaya landscape in southeastern Ethiopia, using multi-criteria valuation approaches from empirical data generated from a field campaign.
The study area is mainly known for being a mixed farming system where traditionally and indigenously held agroforests are the dominant land uses in the upper half of the landscape, and (agro)pastures are dominant in the lower plain [11,27,28,29]. Through a mixed farming transition belt, agroforestry land use has been overtaken by cereal farming and pastoral (grazing)-dominated land use down the slope. The agroforestry land use system in our study region has immense potential to support a large population, as it mainly consists of enset—which has a high population-carrying capacity [30], and coffee—a valuable cash crop. As a result, the Gedeo people have been reasonably food self-sufficient and have been capable of preserving steady rural livelihoods for many decades despite high population pressure and an incredibly rugged topography. The Sustainable Land Use Forum (SLUF) [31] noted that the Gedeo traditional agroforestry system was one of the most effectively, efficiently, and sustainably utilized land use systems in the country. Hence, it has been recommended as a novel strategy for Africans to curb ecosystem ruin [32]. Thanks to its widely recognized ecosystem repairs and productivity potentials, the Gedeo agroforestry land use is nowadays in the process of inscription into UNESCO world heritage sites [33]. We believe that such distinctive and diverse landscapes, with associated culture-bound knowledge systems about landscape management, needs to be studied and documented. Hence, our article is also well-timed to contribute to the world heritage sites inscription process. On the other hand, as there have been notable changes in biophysical and socioeconomic conditions, the system is unlikely to remain sustainable [28,34,35]. Similarly, drought/rainfall variability and agribusiness investment (i.e., the resultant of national Agricultural Development-Led Industrialization policy framework) enhances land use transition to large-scale farmers, which frustrates the pastoralists’ livelihood in the lower plain. This also occurs in most parts of sub-Saharan Africa [36], where national development policies and global rises in food price (i.e., the period in 2007/8 during which the annual Commodity Food Price index showed a peak value) [37] fasten agricultural investment to the occupation of large tracts of land.
In the features of such entwined socioeconomic and environmental problems, it is essential to enhance ongoing land management efforts by implementing individual and group-based discourse of farmers’ relative ability to evaluate ESs and their threats in the study landscape. This is essential to encouraging the adoption of ecosystem-oriented management practices, as well as implementing effective natural resource management strategies. Therefore, this article aims to: (1) examine the importance, as well as the perceptions, of several different features of and threats to ESs through the documentation of farmers’ relative ability to evaluate ESs and challenges to their provisioning status; (2) explore farmers land use type preference perspectives on the basis of the aggregate values of criteria-based scoring that farmers assigned to each ES value obtained from the respective ecosystem types and; (3) investigate landscape-based spatial variations of socialcultural and ecological values of ecosystem services as perceived and evaluated by farmers, so as to recommend site-specific land resource management tools. Addressing these attributes of ESs together provides an in-depth and novel understanding of farmers’ knowledge that has significant implications for policy. Accordingly, by presenting this preliminary investigation, we illustrate ES potential in agricultural landscapes, enhance upcoming research, and contribute to the knowledge of the Gedeo-Abaya sociocultural and ecological systems.

2. Materials and Methods
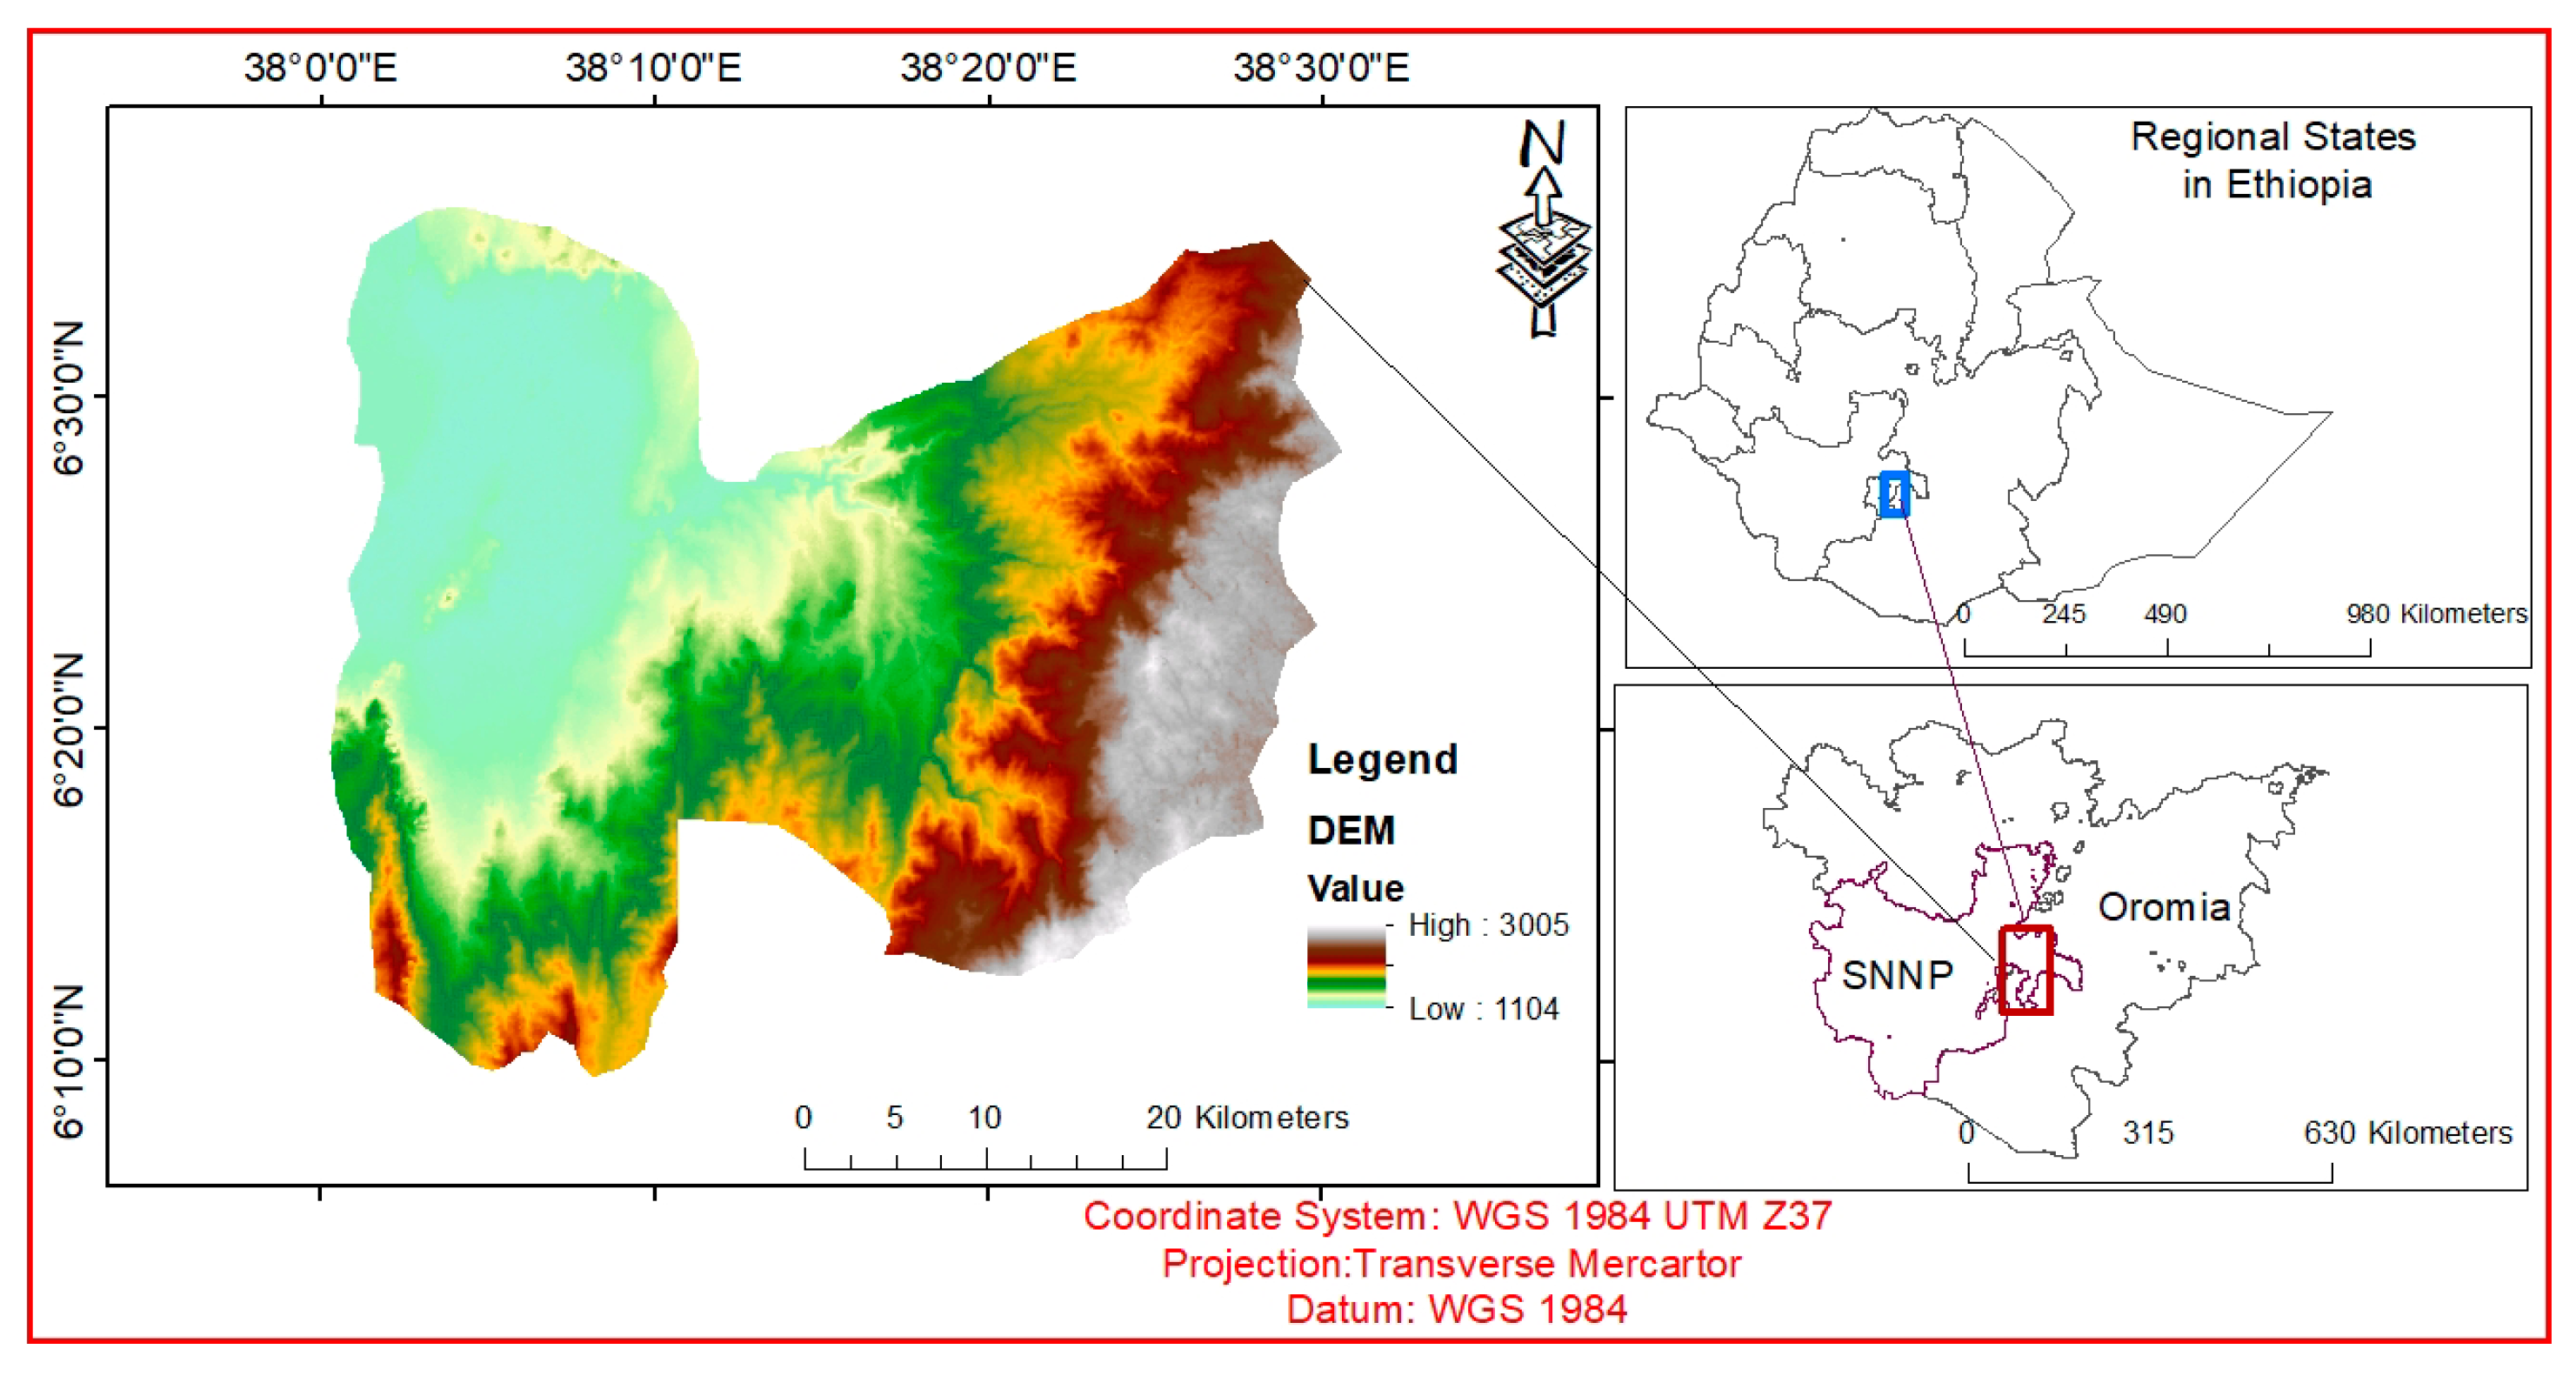
2.1. Study Area

The study was conducted in the Rift Valley escarpment of southeastern Ethiopia, ‘Gedeo-Abaya landscape’ (6°09′02′′–6°35′56′′N, 38°00′01′′–38°31′18′′E), about 375 km south of Addis Ababa. Using both administrative and watershed concepts, the study landscape was defined as comprising, in the north, the Gedeo administrative zone of the Southern Nations, Nationalities and Peoples’ Regional State (SNNPRS) and, in the south, the Abaya ‘woreda’ (an Ethiopian local administrative group that forms a district) of the West Guji zone, Oromiya Regional State (Figure 1).
It is situated in Gidabo river sub-basin of the Eastern Lake Abaya-Chamo in the Rift-Valley lakes basin at an altitudinal range of 1100 to 3005 m a.s.l. The averaged climatic data sourced from the nearby meteorological stations characterized the climate of the study region as bimodal rainfall distribution with annual total of 800–1800 mm rainfall, and the mean annual temperature of 12.5 to 28 °C. The escarpment slopes of the study landscape are also distinguished by the dominance of Nitisols—a type of soil characterized by deep, reddish-brown clayey with moderately high organic matter content, constituting well-drained and fertile soils [38].
The upper catchment (hereafter upstream) of the study landscape is found in the humid and sub-humid highlands of the Gedeo zone (mainly inhabited by the Gedeo ethnic group), which are above 1500 m a.s.l. The zone is well-known for two crucial features: (a) its highest population density in Ethiopia is projected by Central Statistics Authority (CSA) to be over the 800 persons/km2 zonal averages in 2017 (and this climbs to 1000 persons/km2 in Wenago woreda [39]), and (b) the miracles of natural resource management practice and indigenous agroforestry systems of farmers. Farmers have well managed such traditional land use mainly as a livelihood strategy rather than with the goal to improve its aesthetics or to sustain its scientific values [27,40]. This traditional agroforestry system follows a steep terrain and has among the highest population density in Ethiopia. This land use arrangement acquires the forms of permanent crops fused with fruit trees and/or domestic animals initiated to forested land and now accounts for 94.5% of the zonal land cover [29]. As a result, people of the Gedeo zone have been reasonably food self-sufficient and are equipped to maintain stable rural livelihoods for decades regardless of the ever-limited landholding size in a rugged topography. Recently, however, zonal reports have shown that only two woredas (Bule and Gedeb) out of six have been relatively self-sufficient; the other four (Wenago, Dila-zuria, Yirgachefe, and Kochore) have been challenged for a couple of decades because of the reduced productivity of the system.
The lower catchment (hereafter downstream) mostly include the pastoral and agropastoral farmers who mainly belong to the Guji ethnic group in the lower plain of the study landscape. Administratively, it lays in Abaya woreda, west Guji zone, within a semi-arid agroecology at an altitude lower than 1500 m a.s.l. (Figure 1). It is the most populated woreda (110 persons/km2) in the zone, though sparsely populated with respect to the upstream region [39]. Abaya woreda exists in the northern zonal periphery and it is socioeconomically and culturally close to the Gedeo people [41]. A transitional type of land use between the up- and downstream regions exhibits a sedentary agropastoral way of life. Maize, wheat, barley, and haricot beans are the major crops. In some parts, enset is also grown and provides a degree of food security during drought incidents, and coffee is an important cash crop. Grazing land, woodlands, and wetlands are the dominant land uses with recently emergent agricultural investment. Most imperative is the realization of the vital importance that wetlands have had in the lower plain as a biodiversity pool and also in the drought months for both cattle and society. During drought periods, the upstream farmers move down their cattle in search of feed and water, thus demonstrating the socioeconomic interdependence of the two stream people. Debelo [41] revealed that the Guji and Gedeo peoples are two “distinct” ethnic groups, who have co-existed for long periods in the southern part of Ethiopia. In the past, the two ethnic groups were engaged in different but complementary economic activities, with the Guji being agro-pastoralists and the Gedeo settled agriculturalists. Their economic activities and sharing of separate ecological niches enabled them to create a kind of symbiotic relationship. Even in some conflicts, they co-existed by resolving disputes locally using customary conflict resolutions.

2.2. Sampling Method

Considering entwined sociocultural and ecological ecosystem processes and functions, non-market assessment approaches for valuing non-marketable ESs are well-recognized measures [19,42]. Many attempts to evaluate the services of natural capital are usually based on ‘willingness-to-pay’ principles [43], which are the most commonly used methods when working with values in absolute (dollar) terms. The values of ecosystem goods and services could be represented either in absolute or in relative terms (scales or rates) when comparing different ecosystems [44]. This article focuses on the relative valuation of various ecosystem types, also called land use/cover types [45] along the catchment, through a scale-based analysis (relative valuation). The different valuations are mainly attributed to the lack of a distinct market value to control the value distortions. Such distortion can manly arise by the lack of awareness of the participant farmers about ESs. To accomplish a combined analysis of coupled sociocultural and ecological services rendered by different ecosystems, our study approach agrees with Smith [46] and Young & Wesner [47], which also used the relative valuation technique. Cáceres et al. [18] and Díaz et al. [45] also implemented a similar approach rather than following a vectorial trajectory in the articulation of the social and ecological dimensions of ESs using different farmer groups.
A multi-strata research approach was followed to conduct the assessment of the farmers’ ES valuations of primary LUC types distributed in the catchment along the slope of agroforestry-dominated Gedeo-Abaya landscape in southeastern Ethiopia. The first strata corresponded to the sub-catchments stratified into two regions (up- and downstream) according to the dominance of some LUC types in either of the catchments. For instance, agroforestry dominates the upstream region while grazing land, woodland/shrubland, and wetland are mainly found in the downstream region. Recently, following extensive investment in the downstream area, commercial agricultural land also has acquired a considerable coverage. Being assisted by 2015 LUC maps of the Gedeo-Abaya landscape [11], five primary LUC (ecosystem) types (i.e., Agroforestry—AF, Cultivation Land—CL, Grazing Land—GL, Woodland/Shrubland—WL, and Wetland—WeL) distributed in the two regions were selected (Table 1). Finally, 16 ESs were identified by field reconnaissance conducted with zonal and woreda experts from the two government sectors (agriculture and natural resources sector and forestry and environmental protection sector). For in-depth interviews and criteria-based scoring, farmers were selected from five kebeles (a kebele is a group of villages forming the smallest administrative unit in Ethiopia which is called “Woreda”). We purposively selected sample kebeles as hot spot sites based on: their representative distribution along the study landscape, accessibility and farmers’ ability to understand the research theme, and the exposure frequency of the farmers to various environmental and developmental trainings. Thus, three kebeles were selected from the northern region (“Sika” from Bule woreda, “Bula” from Dilla-zuriya woreda, and “Mokonisa” from Wenago woreda) and two from the southern region (Semero-gambella kebele and Dibicha kebele). Purposive and snowball sampling techniques were applied to choose a total of 90 farmers. Two focus group discussions (FGDs) with well performing participants of the interview session, including development agents of both areas, were conducted to integrate the views and scoring values of the individual participants. The number of FGDs was limited by the project resources and by the rugged and hardly accessible study landscape that made it difficult to travel to each farmer residence. Though the sample was small, the in-depth nature of the interviews conducted resulted in an informative quantitative and qualitative insight into the farmers’ views of ecosystem goods and services.

2.3. Landscape Stratification and ESs Classification

As discussed in Section 2.1, though the up- and downstream people of our study landscape have a strong socioeconomic interdependency and also share biophysical resources, we decided to stratify the catchment into up- and downstream regions, recognizing the significant agro-climatic, demographic, and farming system differences [41]. Prior to determine the ES types to be studied, we conducted a field reconnaissance with zonal and woreda experts from two government sectors and with several key informants. On the basis of the agro-ecosystem dominance of the study landscape with the strong sociocultural setup of the local community and on previous literature on Ethiopian research [26,48], discussions after the field reconnaissance identified 16 ES types. Thus, the services investigated in the study include water supply, water regulation, energy source, woodlot/construction sources, fodder resources, medical services, climate regulation, soil fertility maintenance, water treatment, erosion regulation, habitat maintenance, shade and shelter for animal and plant, recreation/aesthetic values, shade for cultural deliberations, religious values, and tenure security.

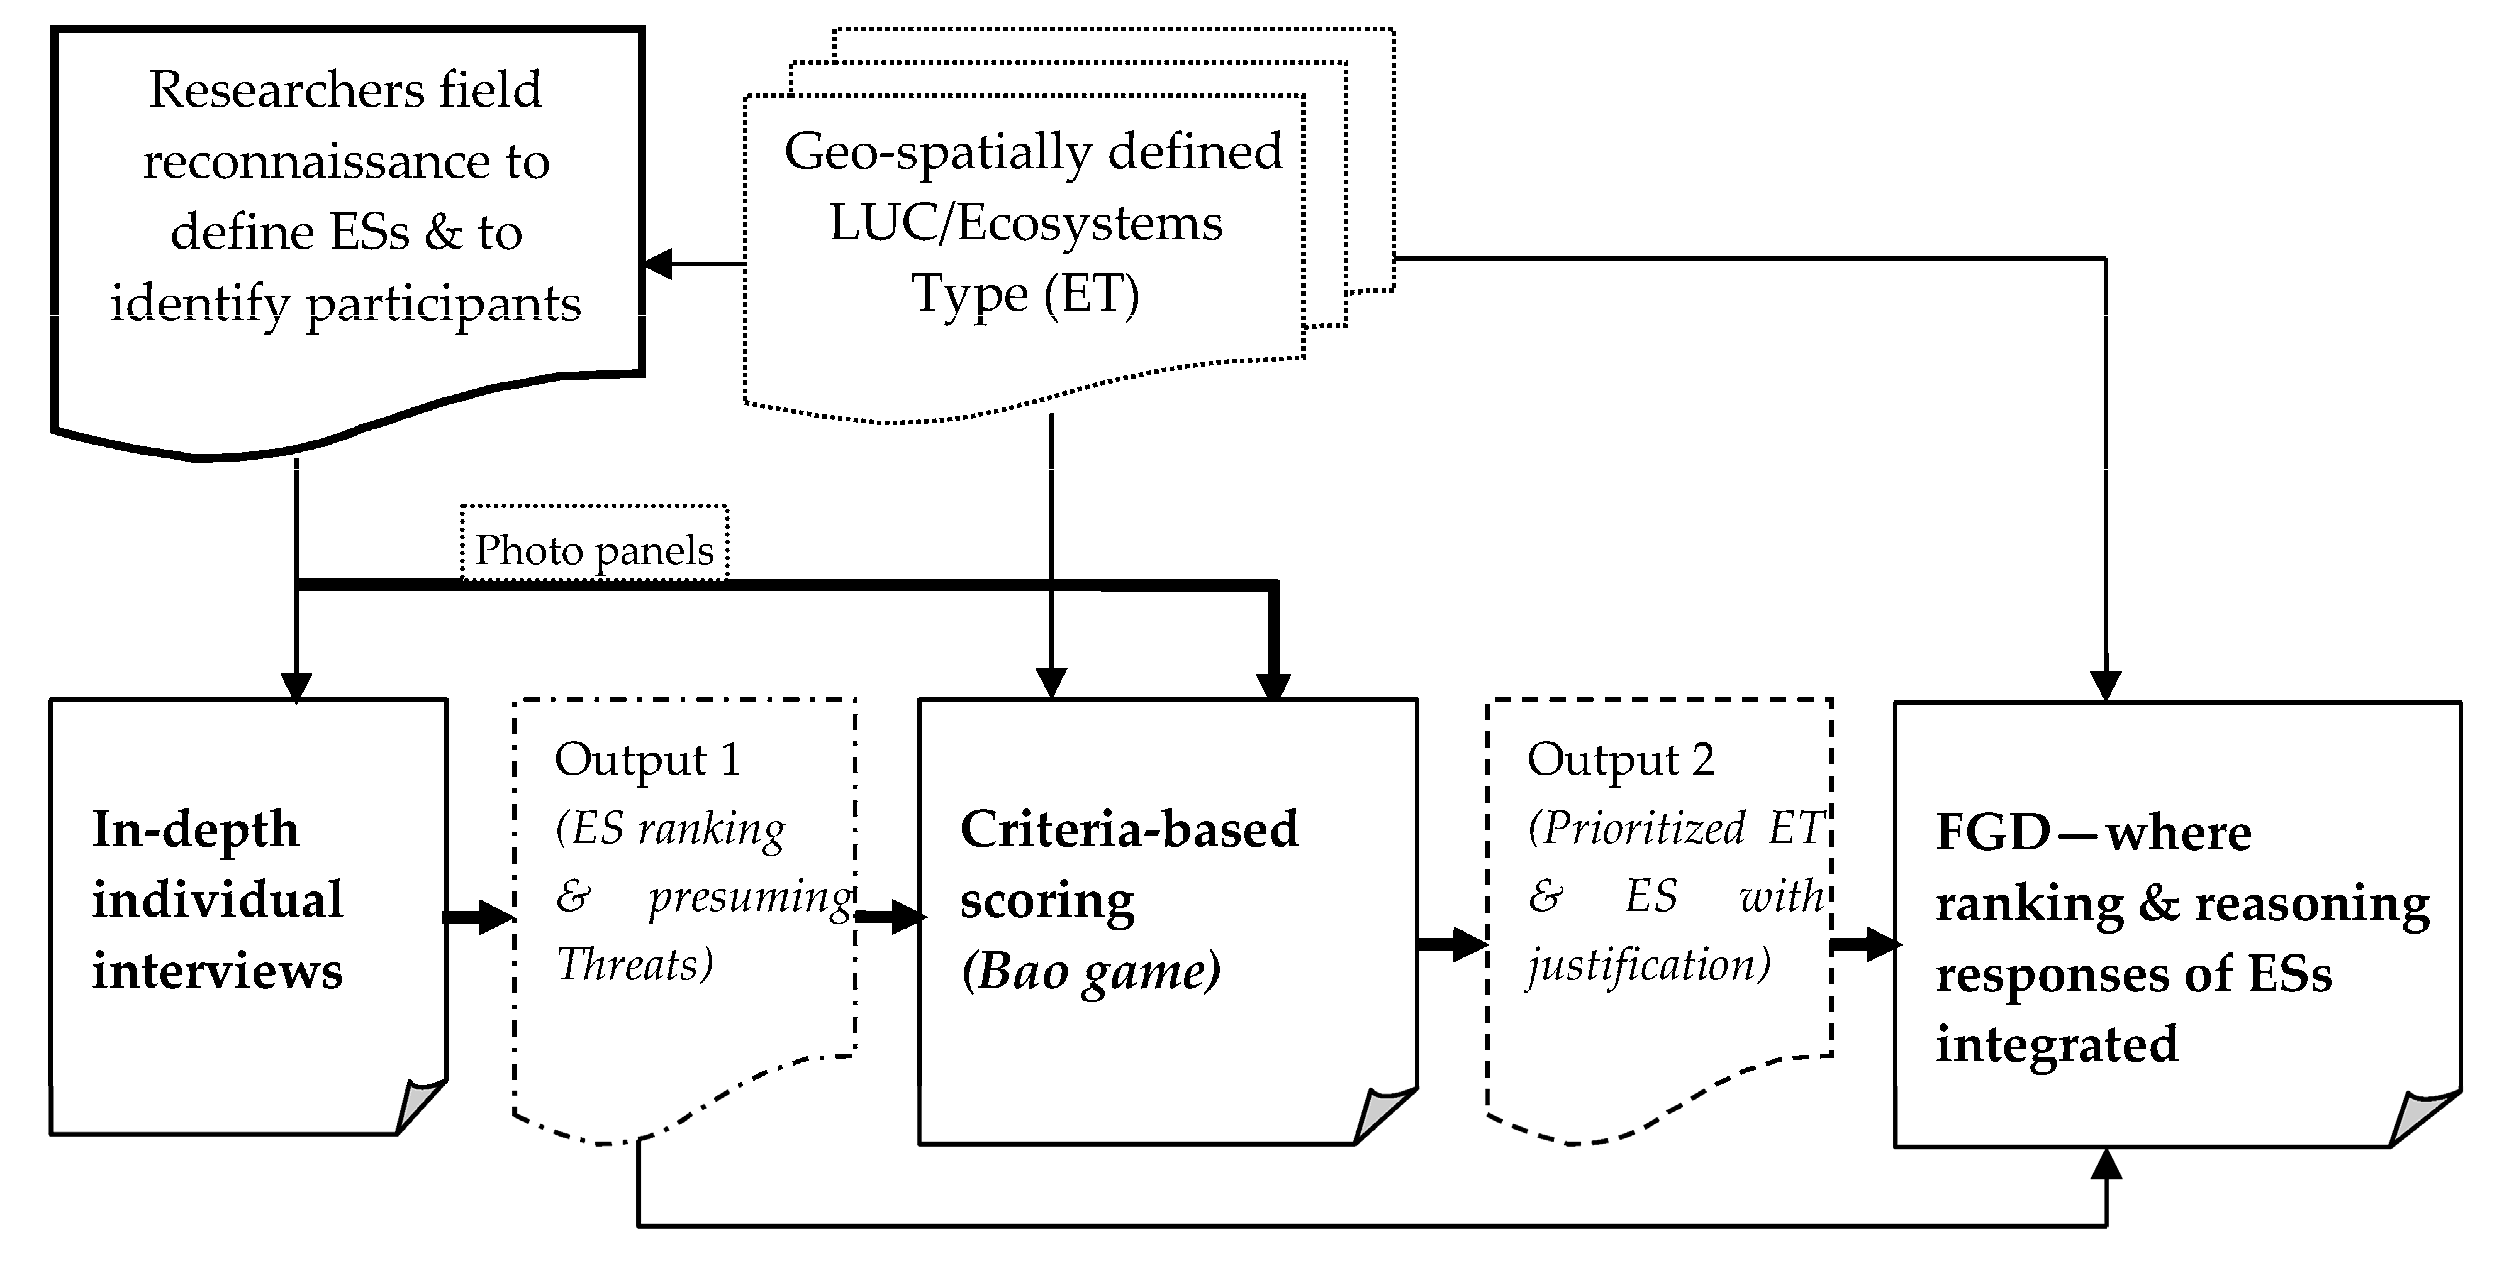
2.4. Data Collection and Analysis

The research generally followed three stages including data generation and synthesis methods (Figure 2). These were (1) on-site individual in-depth interviews, from which farmers’ perception about the most important ESs provided by different LUC types and perceived threats were presented. These interviews were typically conducted for 1 to 2 h with each interviewee in all kebeles. The interview focused on the general household characteristics of the farmers and on the farmers’ perceptions about the most important ESs provided by the predominant agro-ecosystems. Besides, the interview focused on assessing attributes (mainly “threats” to ESs) of the 16 ecosystem services; (2) Bao game (a traditional game often known and played in rural areas of eastern Africa) [49] was used for criteria-based scoring. It is an approach used to elicit farmers’ ratings and reasoning of ESs provided by LUC types; (3) focus group discussions; in which selected participants meet to consolidate and clarify the reason behind bao rating values as well as discuss on the most important ES types, their threats, and the type of land use necessary to provide the selected service. A photo panel (Figure 3) visually outlining the concept of LUC types and ecosystem services was then presented to participants during all the stages to assist the discussion. As there have been heroic claims regarding the proper implementation and usage of participatory approaches to support decision-making in rural development activities, the way we followed in this study can further improve the legitimacy of our result. Nearly all of the intangible values of a land uses, mainly of agro-ecosystems, were obtained from farmers’ experience. In other words, this cannot be easily known by other methods like laboratory measurements or experimentations. Participatory methods, therefore, have a vital significance for successful ESs value assessment of land uses because they employ the intangible value of farmer’s knowledge. Several studies in the literature highlighted that the community is the one that knows more about the benefits they get or expect from a land use they want to implement [18,50]. Moreover, the participation of the farmers is compulsory as the values of various land uses are influenced by local socioeconomic and environmental conditions.
Using bao game as the participatory tool [49] values of the five expected primary land use types were examined following the same strategy as Duguma and Hager [26]. The bao game board were managed in an 8 × 2 matrix to place the ranking of the sixteen ES attributes for five LUC types on a Likert scale of 0 to 10 (low to high), representing the lowest and highest service values given for LUC classes. The responses from the participant interviewees were re-ranked from 0 to 4 as either very low (0–1), low (2–3), medium (4–7), high (6–7), or very high (8–10). As shown in Figure 4, a 10 × 2 board-hole matrix is commonly used among the community living in the study area. To minimize ranking confusions: first, four extra holes (2 × 2) were sealed and excluded, then, each LUC type was considered one by one across the sixteen criterions, i.e., only one LUC type at a time was used during the evaluation. Researchers used this method for multi-purpose tree species selection, for evaluation for soil fertility in Western Kenya [51] and eastern Zambia [52], and for social and ecological valuation of land uses in central Ethiopia [26]. As the game is famous in Kenya, geographical and cultural proximity makes Guji and Gedeo peoples equally play the game for pleasure. The game is, therefore, used as an approach to elicit farmers’ sociocultural and ecological values rating among various ecosystem (LUC) types. Concurrently, the effects of the catchment location (upstream and downstream), interactions, and the different preferences and perceptions among participants regarding the various ES values provided by the five LUC types were also examined.
The data obtained from the three data generation stages were analyzed statistically using the SPSS and GraphPad Prism statistical packages. Therefore, descriptive and bivariate correlational analyses were employed. Bivariate statistical analyses were made to investigate the relationships between different ES attributes. A particular analysis was undertaken following stepwise reviewing of the responses regarding threats to ES types. For each catchment category, the threat response frequencies to the respective ES were analyzed, and the two threat categories with the highest number of responses are presented in Table 2.

3. Result and Discussion

3.1. Farmers’ Perception of Ecosystem Services and Ecosystem/LUC Types

On the basis of the authors’ experience and of discussions with a panel of experts, informants, and local administrators, five ecosystem types were evaluated for their ES provision, using individual ES criteria according to farmers’ perception. A synthesis of the information collected in the field campaign is presented in Figure 5, where the graph shows the relative importance of ESs that the farmers associated to each of the five ecosystem types. Figure 5 shows that, except for water treatment, all the expected ES types were well understood by the local farmers. In the upstream region, farmers rated the relative importance of water treatment service provision from wetland at 57.9%, agroforestry at 39.4%, woodland at 31.5%, grazing land at 27.8%, and cultivation land at 6.0%. In the downstream region, wetland was rated at 36.1%, woodland at 29.9%, grazing land at 20.1%, agroforestry at 14.6%, and cultivation land at 8.3%. Similarly, the importance of tenure security was more strongly perceived in the up- than in the downstream region, particularly for agroforestry at 100.0% and 80.6% and for cultivation land at 75.5% and 67.4%, respectively. Because of the communal holding nature of these communities, the service provision of tenure security for the rest of ecosystem types was granted limited importance (e.g., reducing boundary disputes, land illegal expropriation etc.). Accordingly, the water treatment service provider that was perceived as important in the upstream region (e.g., agroforestry) was found to be less important in the downstream region. In fact, some ecosystem types were evaluated similarly in both areas, particularly wetland—as a principal service provider—and cultivation land were perceived as the poorest for water treatment services.
Though efforts were made repeatedly to answer the question ‘what does water treatment service mean?’, this concept was generally not well understood in the studied region. However, several respondents from the upstream region understood the meaning of water treatment service provision thanks to their experience of seasonal water pollution resulting from the many coffee washing plants along the rivers. Accounts from key informants and extension agents revealed that these washing plants release effluents from the washing process directly into the rivers, although repeatedly told to install and use treatment plants. They also highlighted the important contribution of small-scale industries from the existing suburban regions in polluting the water streams.
From Table 2, the Pearson correlation among the perceived farmers’ values of ESs also clarified the relationship between various ES attributes in both up- and downstream study regions. Many strong correlation characteristics are depicted in the correlation table between ESs of both regions. For instance, the higher relative importance of shade and shelter for animals and plants (ShSh) is strongly related to the high importance given to shade for cultural deliberations (ShCD, r = 0.99) and to religious values (RV, r = 0.98), as these three services are closely similar. A higher perception of the importance of climate regulation correlates with a similar perception of the importance habitat maintenance (r = 0.98), but not of tenure security (r = 0.10). Most natural vegetation classes in the downstream region were considered very important from the perspective of the climate regulation service but were poorly valued from the perspective of the tenure security (TS) service, as they usually belongs to communal properties. Interestingly, TS showed a negative relationship with most ESs particularly in the downstream region where land security has been societal, and other challenges are connected to its agro-pastoral life style [11].

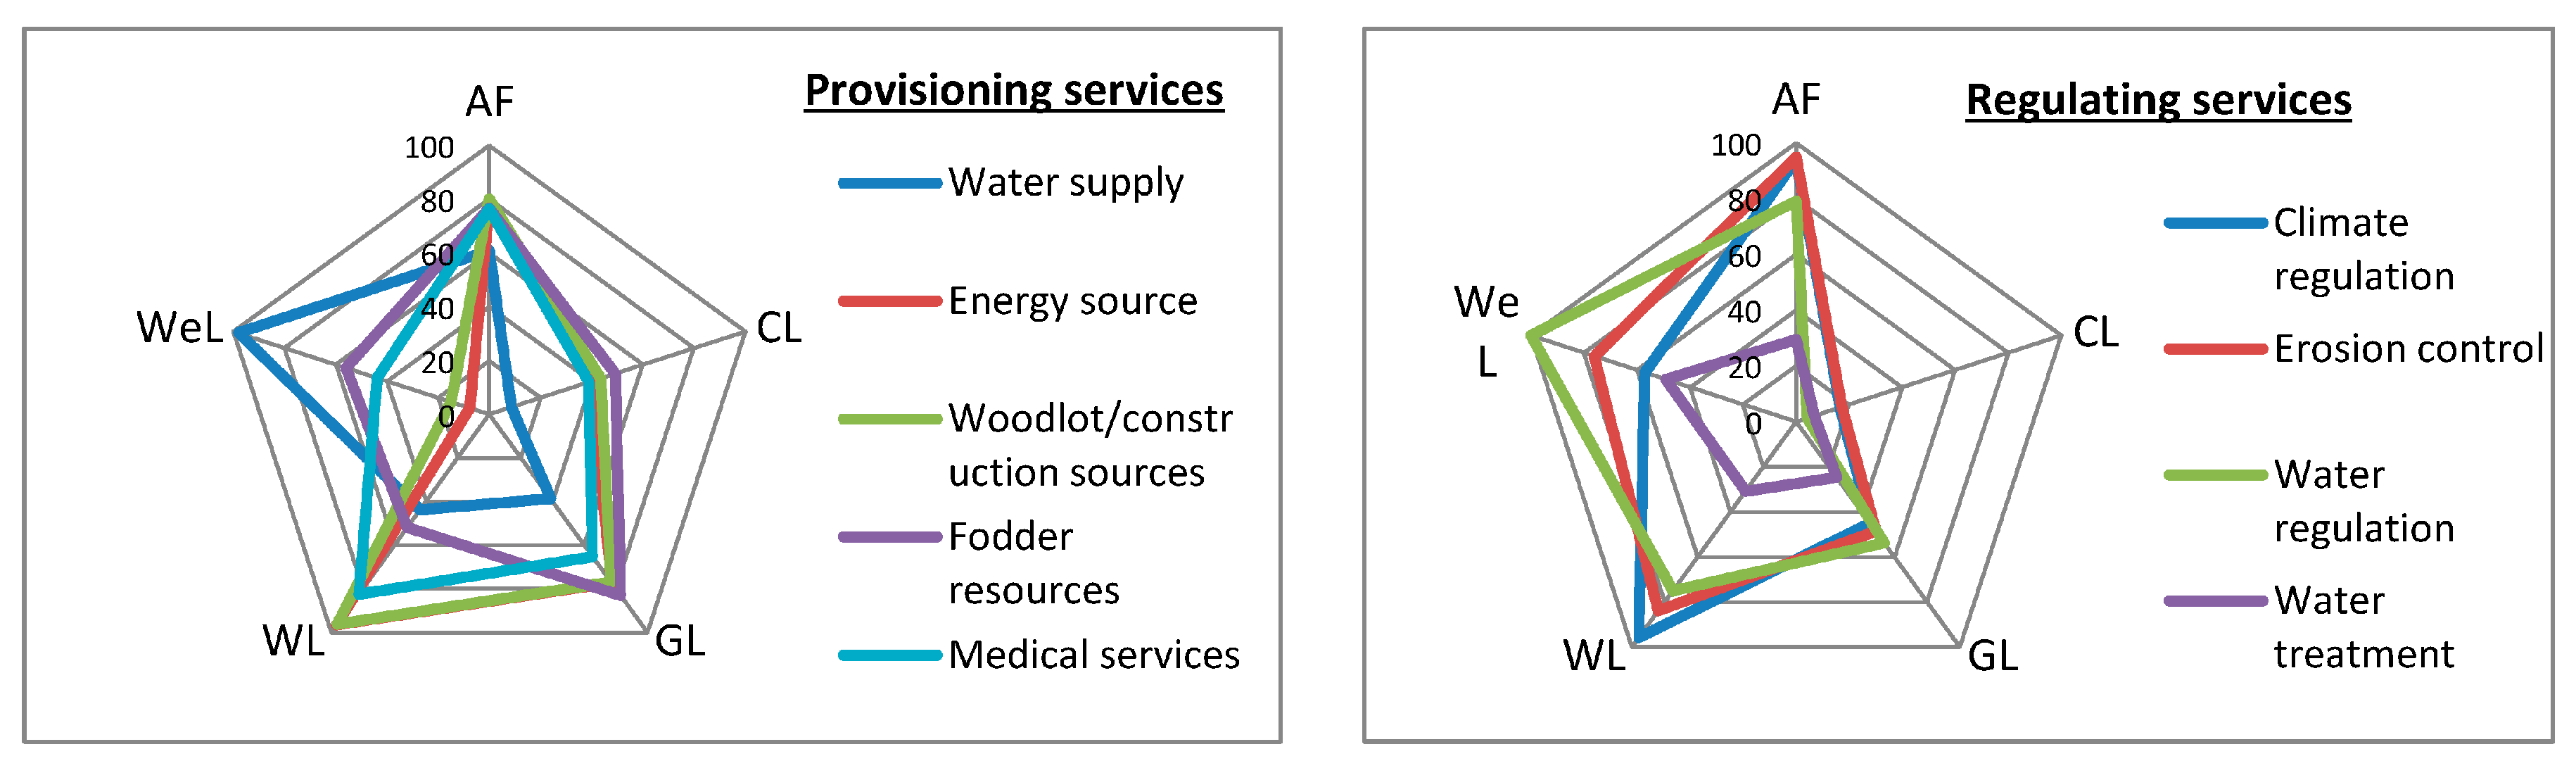
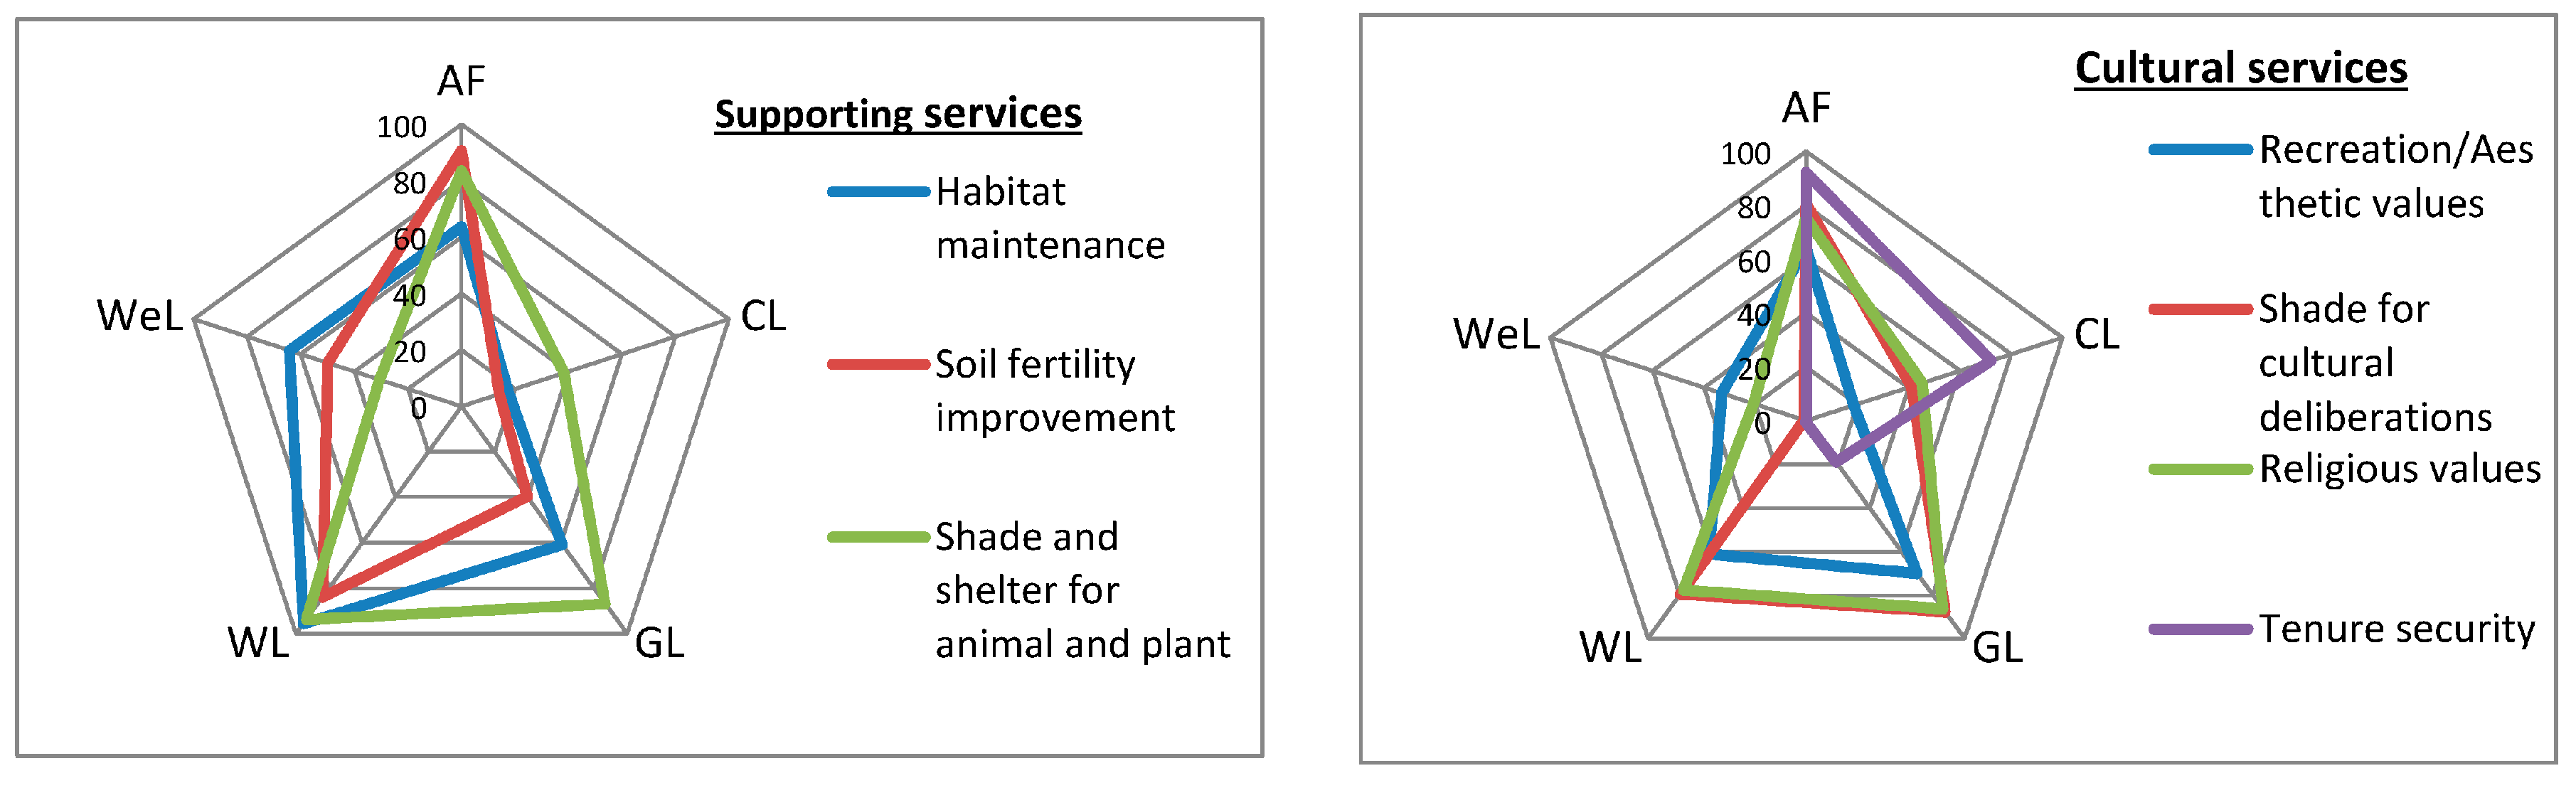
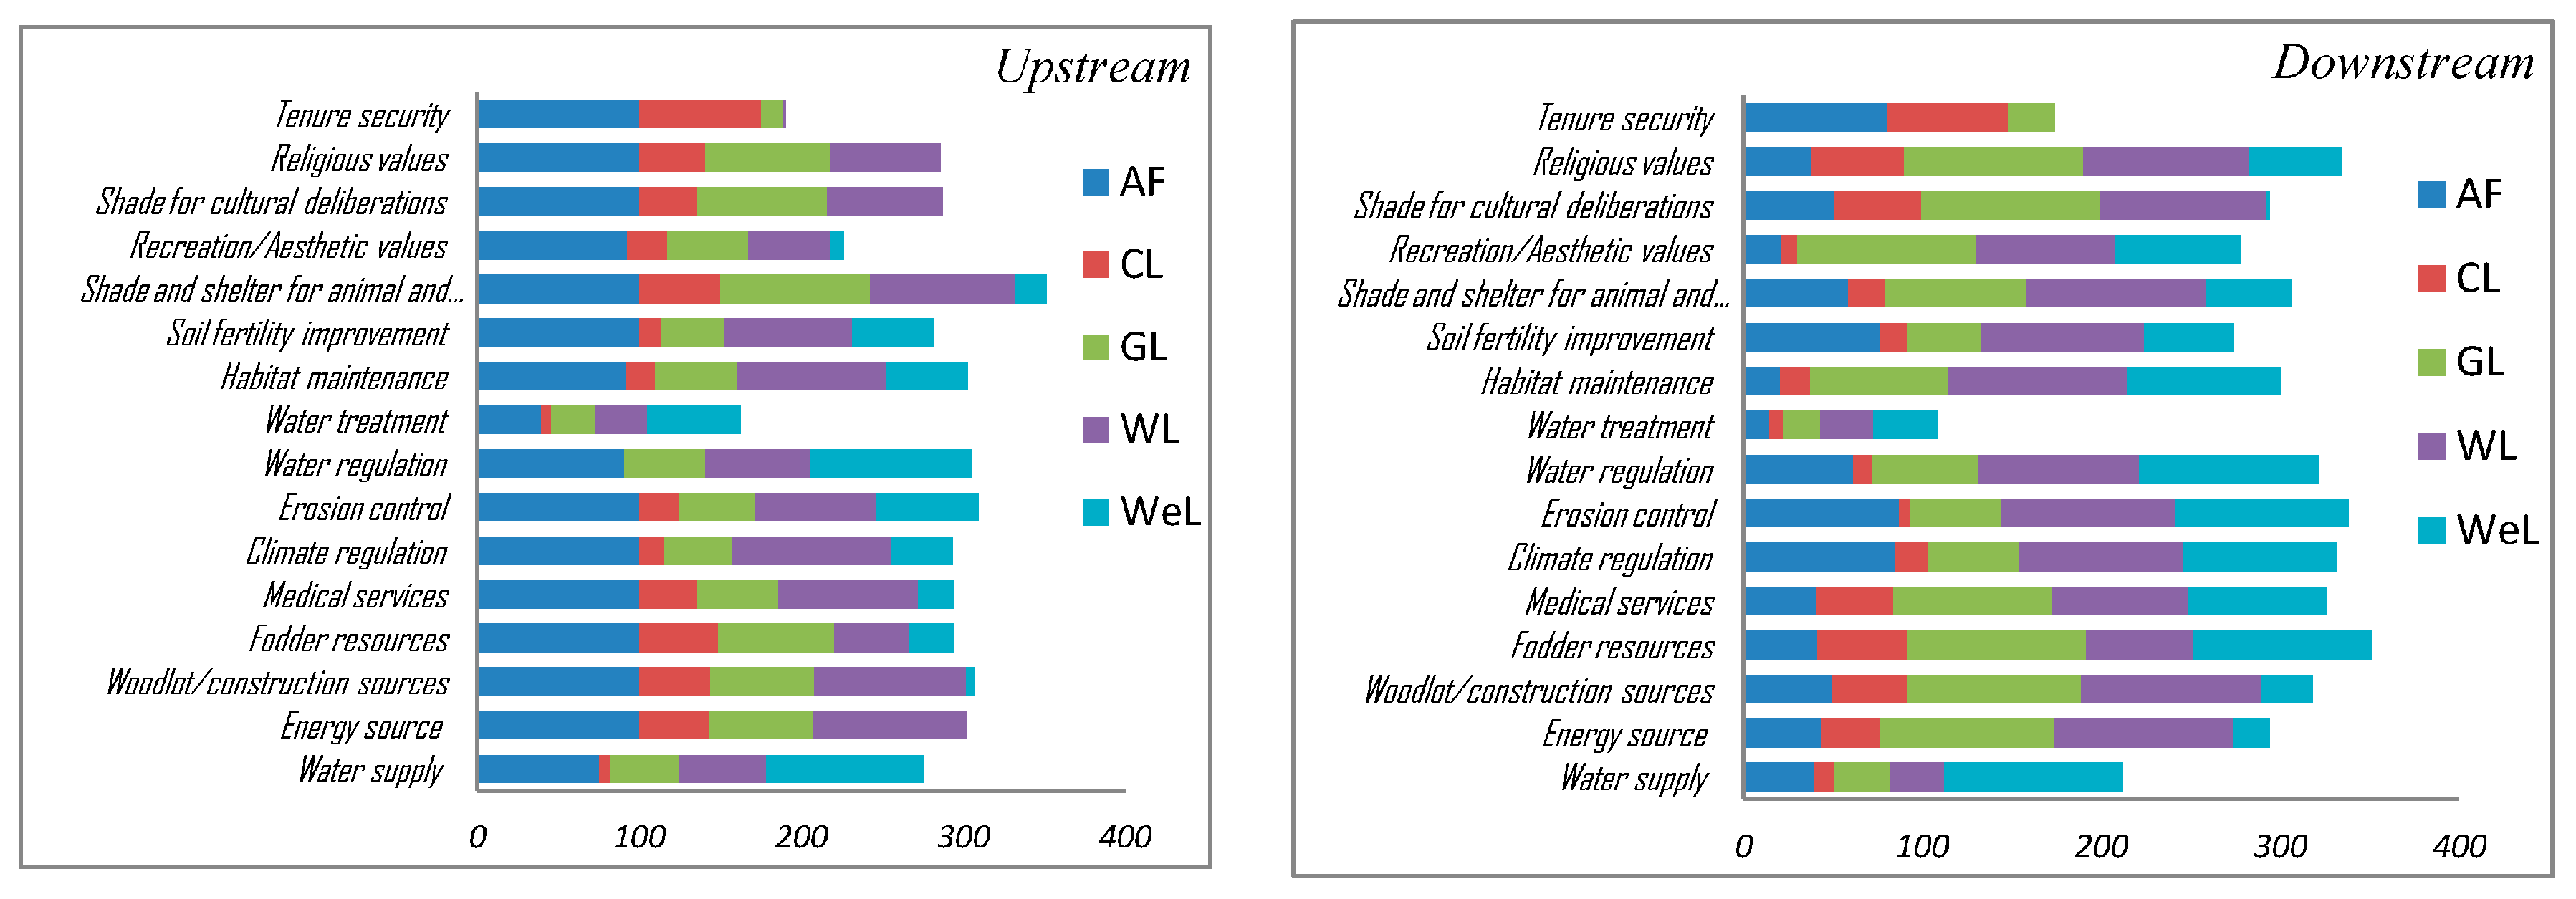
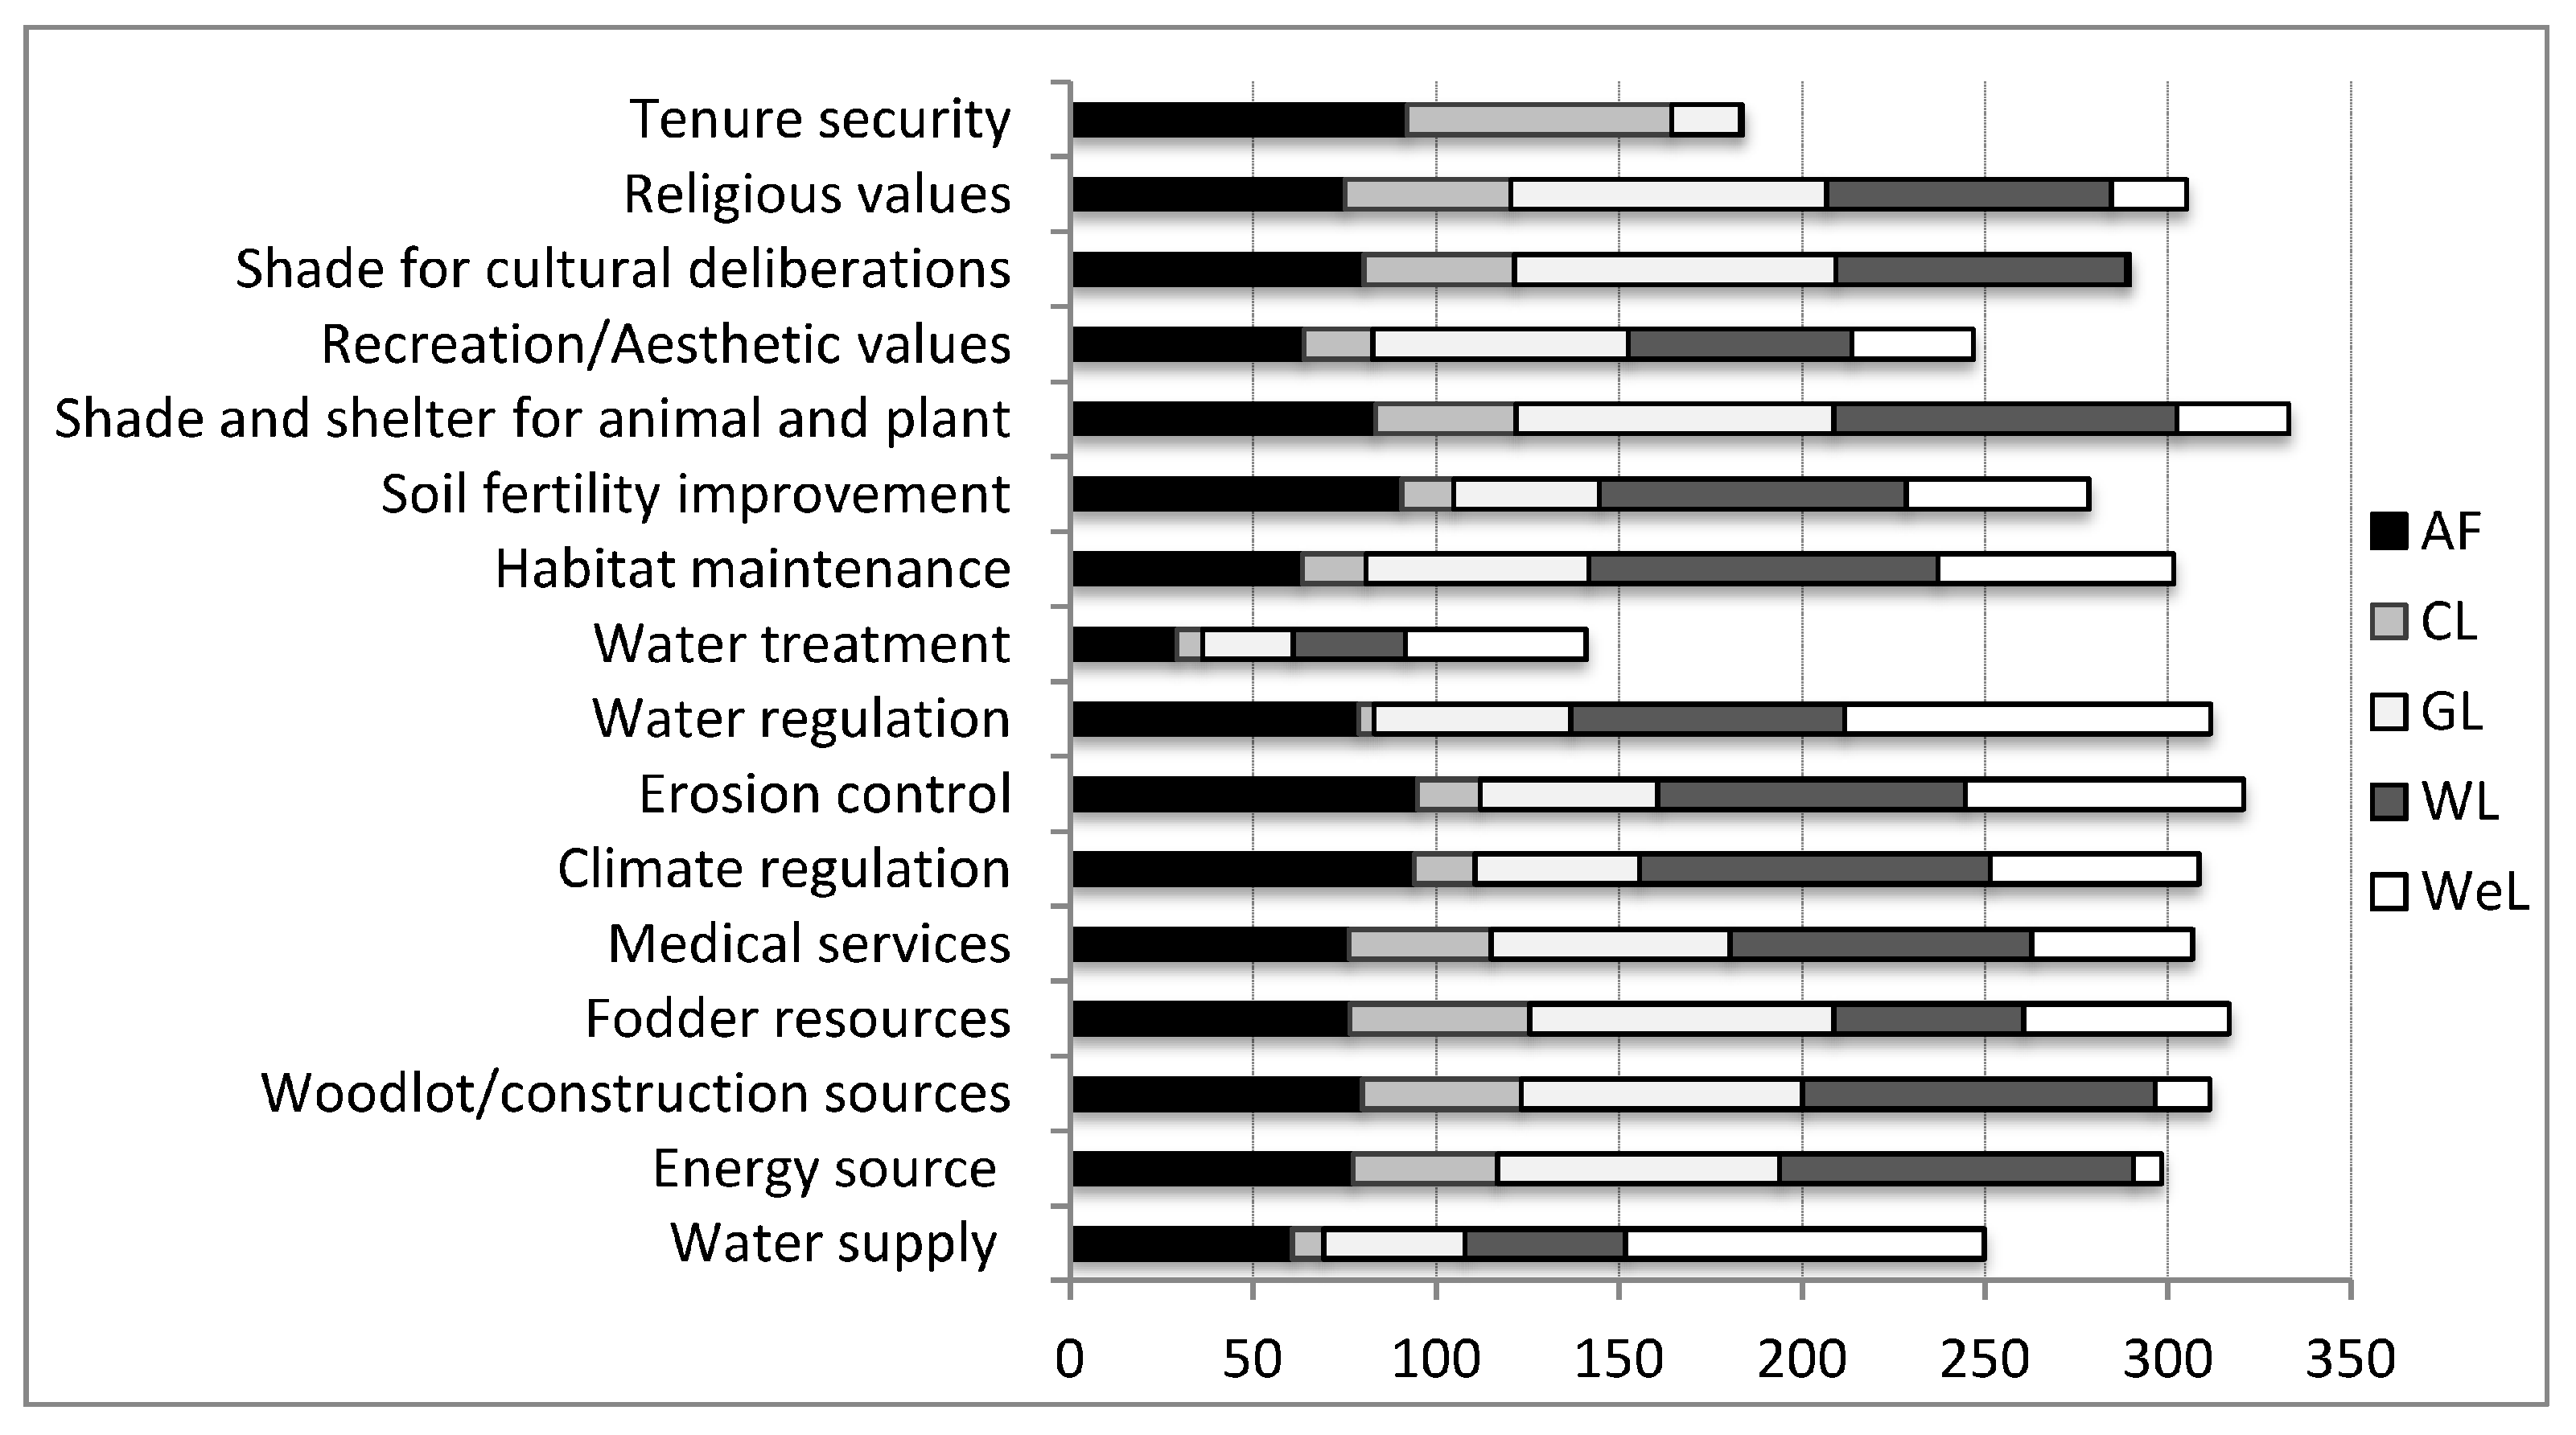
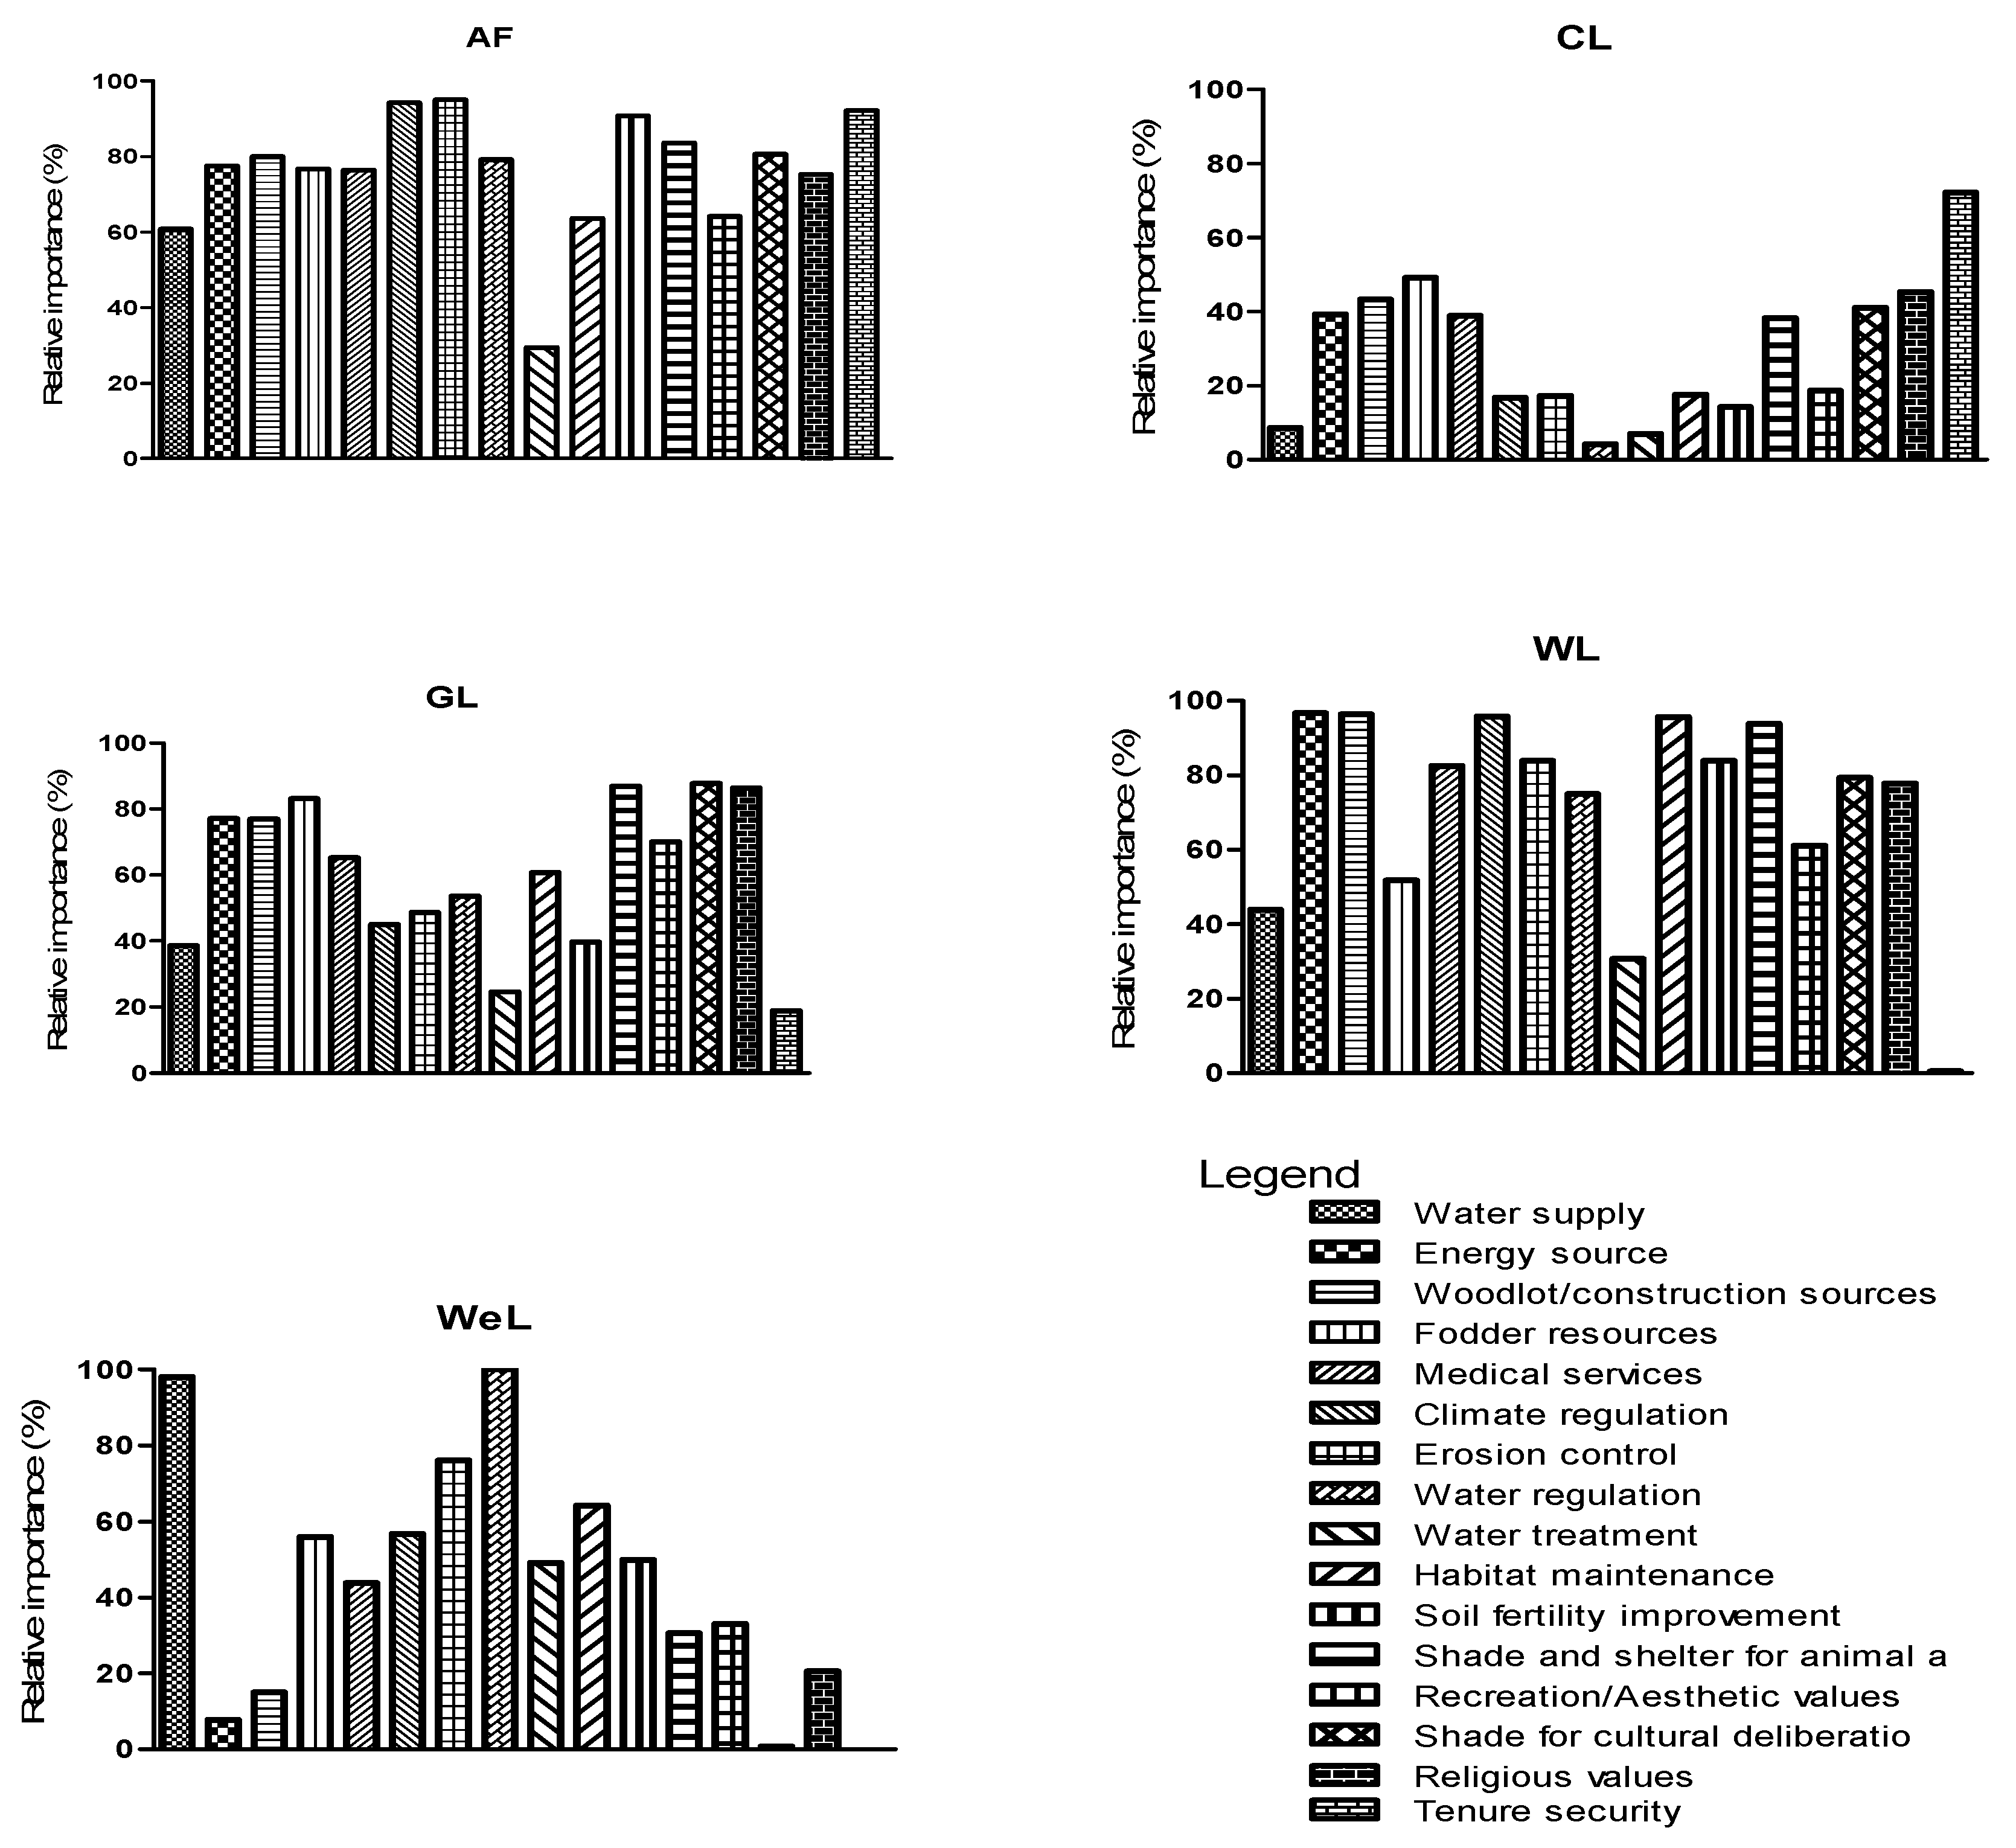
3.2. Relative Importance of the Individual and Bundle ESs

A comparative valuation of individual service values showed how each of them is important in relation to other ESs for a given ecosystem type (Figure 8). Landscape-level aggregate relative importance of shade and shelter for animal and plant (65.8%), erosion control (64.7%), and fodder resources (64.5%) resulted to be the most important ESs for the local farmers in the study area. Other prominent values included water regulation (62.7%), woodlot sources (62.5%), and climate regulation (62.5%). Except for the shade and shelter value, all of the highly valued ESs are categorized under provisioning or regulating services. Indeed, this shows that there is a basic consensus between farmers’ perception as reported in this study and the scientific literature in acknowledging the dominance of provisioning and regulating services in agricultural landscapes [24,53].
With regard to bundles of ecosystem services, the up- and downstream study regions exhibited a high and similar ratings of all values except for the cultural services that were perceived as relatively less important. The woodlands, agroforests, and grazing land were assigned significantly higher proportions of provisioning services (Figure 6), while cultivation and wetland received fairly moderate proportions of these services. For regulating services, woodlands, agroforests, and wetland received the highest proportion, whereas cultivation land was poorly valued for both regulating and supportive services. Similarly, woodland and agroforestry were highly valued for supporting services, followed by grazing lands and wetlands. Farmers in grazing land and agroforestry paid the highest recognition for cultural services provision, followed by woodland and cultivation land, while wetland was inadequately serviced (Figure 6). FG discussants pointed out that the big tree (named ‘Oda’) is usually used for cultural deliberations and frequently protected in grazing fields in the downstream agro-pastoralist regions, while it is planted and maintained around homesteads in most upstream communities where land shortage does not allow to have such trees in large communal or grazing fields.

3.3. Land Use Preferences for ES Values in Gedeo-Abaya Landscape

For nearly all the studied individual services, farmers chose agroforestry as a dominant service provider followed by woodland, while cultivation land resulted to have the least service provision right through the studied landscape, particularly for regulating and provisioning ESs. In this case, farmers’ perceptions generally paralleled scientific knowledge. A study in Ethiopian highlands also showed that cropland was dominant, but, according to farmers valuation, it was the least favored land use type for the provision of social and ecological values [26]. Such a wide-ranging consent indicates an important starting point for collaborative formulation and implementation of rural development strategies to encourage the improvement of ongoing land management activities, particularly in the misused crop fields. For instance, significant efforts have been made by the government to introduce improved land use management measures as a policy framework in the last two decades [54]. The responsible sector(s) mobilized farmers, sector development agents, and experts for the annual ‘soil and water conservation and tree planting campaign’ as well as proposed enclosure deals and implementations on degraded areas to the local community. Recurrent works through the productive safety net program were also conducted and strongly supported the campaign works [54,55,56]. The farmers residing in the transition belt between the up- and downstream study region realized the benefit they earned from the land management campaign by adopting the agroforestry land use proposed in the campaign package. This implies that community land use preference and government policies and implementation commitments are contributing to the relative ecological improvement of the study landscape, however, much has to be done to improve upstream land use productivity and downstream changes of communal ecosystems [11].
Except for land tenure security maintenance, for which the highest overall relative importance was scored (72.2%), cultivation land was not perceived as important in the sixteen ES types (Figure 7). Evaluations of FGD participants in the upstream region also highlighted as some of the land use types, particularly agroforestry and cultivation land, have been used as a sociocultural tool to maintain land tenure security. The traditional boundary demarcations (often with stone marks or/and by growing live trees, mainly Eucalyptus, and border-hedges of shrubs) are mostly fragile and frequently lead to boundary conflicts and even illegal land expropriation. So far, digital cadastral technologies have been totally absent for rural and suburban land administration in Ethiopia. However, according to the zonal agricultural office, this system has recently been under pilot implementation in several woredas of the study area. The sociocultural values of the ecosystem types of the region, therefore, contribute at large in maintaining frequent disputes that arise between neighbors [26].

3.4. Spatial Variations of Community Values and Threats

Figure 8 reveals that there are comparative variations in the attribution of community values to individual ecosystem services provided by the respective LUC types between up- and downstream regions. Agroforestry was the only land use consistently and more highly valued in the upstream region. For fourteen of the studied individual ESs, >90% relative importance was attributed to agroforestry by the farmers. This could be due to the dominance of agroforests in the upstream study landscape (i.e., about 95% total coverage; [29]). In the downstream region, woodland, grassland, and wetland were strongly perceived, in that order, while agroforestry appeared to be fairly recognized. Cultivation land was inadequately recognized by both up- and downstream farmers, except around the transition belt between the two streams, where crop cultivation is fairly practiced. The accounts of FGD clarified that also the poor ESs provision nature of the cultivation land was recognized by the community. This could also be noticed from the conversion of many cropping and grazing fields to agroforests in the recent decades which is leading to the expansion of agroforests in the downstream region [11].
With regard to individual ecosystem services, Shade and shelter for animal and plant was ranked first in the upstream, while fodder sources was first in the downstream region, with aggregate relative importance of 70.3% and 70.1%, respectively. Erosion control was the second most highly valued service type in the both up- (61.9%) and downstream (67.6%) regions. Woodlot/construction source, water regulation, habitat maintenance, and energy sources (mainly fuelwood for domestic and marketing) displayed a similar proportion of substantial values in the upstream region (Figure 8). Similarly, climate regulation, water regulation, shade and shelter for animal and plants, habitat maintenance, religious value, and woodlots/construction sources showed a similar proportion of significant values in the downstream region. Conversely, water treatment and tenure security were the least valued service types in both regions.
The most highly valued services in both up- and downstream regions show that there is a basic consensus between farmers’ perception, as reported in this study, and the scientific literature. Highly valued shade and shelter service in the agroforestry-dominated landscape (i.e., in the upstream region) is in agreement with the general principle of agroforestry system. In this system, the tree components provide a shade and shelter service to under-storey perennial and annual crops, whereby this integration determines the system productivity and so its existence [57]. This is why agroforestry is referred to be a traditional land husbandry which not only sustains the coexistence of humans, trees, and perennial and annual crops, but also favors their integration [57]. The most compressive and explicit definition given by ICRAF [58]—“an ecologically based natural resource management system that integrates trees (for fibre, food, and energy) with crop and/or animal on farms with the aim of diversifying and sustaining income and production while maintaining ecosystem services”, also confirmed the value that the trees should deserve as a pillar of the system. The fact that soil erosion is an ever-challenging factor in agricultural landscapes (it was the second most highly valued ES in the upstream region) shows the extreme importance that agroforests have for erosion control [38]. This could be a good evidence that soil erosion has been severe in the area, if such a rugged and steeply landscape has not been tackled through agroforestry practices [11].
However, focus group members of the upstream region have underlined the decline of native knowledge as well as the steady rise of environmental degradation has substantially contributing to the challenges to manage agroforests. Legesse [28] and Debelo et al. [33] reported that elders worry about the ongoing transformation of the core Gedeo principles of “tree is life” to the increasingly predominant view, especially among Gedeo youth, that “tree is money in the pocket”. This scenario also confirmed that upstream farmers highly valued woodlot/construction service (ranked 3rd), a reflection of the extensive tree extraction practices carried out mainly to earn money. Temesgen et al. [11] also highlighted as the Gedeo agroforestry cover has been increasing with deteriorating productivity mainly as a result of overpopulation.
Fodder service was highly valued in the downstream part study landscape (Figure 8)—a reflection of the highest significance that the service has in the study region. This inference is attributed to (agro)-pastoral livelihood dependence on fodder of the community in the lower plain and/or the perception that comes from the knowledge of and closeness to the vast grazing lands and wetlands. Interestingly, the agro-pastoral communities, especially in Semero-Gambella kebele, highly valued the fodder service obtained from cultivation land—a new practice adopted quite a few years ago. Both interviewees and FGD participants highlighted as most farmers have been piling crop residues for the drought season following the persistent advice and training given by the local government. Climate regulation, water regulation, shade and shelter, and habitat maintenance were highly valued in the downstream region (Figure 8), which is in conformity with the climatic change that is causing drought/rainfall (RF) variability and challenges the semiarid regions of Ethiopia [3,59]. Farmers recognition paid to the habitat maintenance service is also related to the dominance of natural ecosystems (e.g., woodland, grass land, and wetland) that support the natural habitat in the downstream region.
In this study, farmers identified a variety of threats to the sixteen ESs (Table 3). These threats were generally considered by FG discussants to be the consequence of overpopulation coupled with climate change and agribusiness investment in the Gedeo-Abaya landscape. There is an extensive scientific documentation in the scientific literature showing how various drivers of land use change also directly threaten the ecosystems [20,24]. As shown in Table 3, this general notion was supported by farmers in this study who acknowledged that routine anthropogenic activities, particularly woodlots extraction in the upstream region and inappropriately applied agribusiness investment in the downstream, region are the main drivers of ecosystem change. Farmers realized that both commercializing woodlots and population pressure-induced holding size reduction are significantly threatening ESs in the upstream region, while charcoaling and agribusiness investment are threatening the downstream region. Drought/rainfall variability appeared to be the common challenge throughout the study landscape (Table 3). In this case, farmers’ perceptions generally parallel empirical researches [11,59]. Legesse [28] and Negash et al. [35] have shown the rapid productivity decline due to population pressure and subsequent land-holding size reduction in Gedeo agroforests, and Bishaw et al. [34] also highlighted environmental challenges due to recurrent drought. This general consensus in Gedeo-Abaya agricultural landscape represents an important starting point for collaborative policy and rural development to encourage the ongoing improvement in land management activities.

4. Conclusions

Overall, our results show that there are relative differences between farmers’ values toward individual ESs in the up- and downstream regions. Probably because of its dominance, agroforestry was the only land use that was consistently highly valued in the upstream region, while woodland and grassland were strongly perceived as important in the downstream region. Cultivation land was inadequately recognized by both up- and downstream farmers. Overall, the highest relative importance was attributed to land tenure security maintenance and to agroforestry. Hence, they have been used as a sociocultural tool to maintain land tenure security.
Shade and shelter values in the upstream region and fodder sources in the downstream region were perceived as highly important individual ESs, followed by erosion control. Other prominent services in the studied landscape were woodlot/construction and energy source, water regulation, climate regulation, and habitat maintenance, whilst water treatment and tenure security were poorly recognized in both regions. This result indicates that there is a basic consensus between farmers’ perception, as reported in this study, and the scientific literature. Here, the vertical structures built in agroforestry system aim to maximize the shade and shelter value for middle and under-storey plants. This solution improves the ecological stability and the productivity potential of the system, particularly in rugged topographic settings where erosion is a serious challenge. However, the decline of indigenous knowledge to manage agroforests and the rise of environmental degradation was mentioned and resulted from the “conservation” and “utilization” antagonism among elders and youths, respectively. This scenario implies that upstream farmers highly valued the woodlot/construction service, a reflection of the extensive tree extraction ongoing mainly to earn money. Also important is the extreme recognition paid to fodder source by downstream participants, reflecting not only their (agro)-pastoral livelihood dependence on fodder, but also the knowledge of and proximity they have to grazing and wetlands ecosystems. These farmers also mentioned the new tradition of using crop residues for fodder, especially during drought seasons, as recommended by the local government.
The varieties of threats to ESs identified by the farmers were generally considered to be the consequences of overpopulation and agribusiness coupled with climate change, showing how various drivers of land use change affect the service potential of ecosystems. Farmers’ perception supported the concept that routine anthropogenic activities, particularly woodlots extraction in the upstream region and inappropriately applied agribusiness investment in the downstream region, are the main drivers of ecosystem change. Drought/rainfall variability appeared to be the common challenge throughout the study landscape. In this case, farmers’ perceptions generally parallel empirical researches, attributing the rapid productivity decline to anthropogenic and environmental challenges (i.e., recurrent drought). This general consensus in Gedeo-Abaya agricultural landscape represents an important foundation for collaborative policy and rural development to encourage the ongoing improvement in land management activities.

Acknowledgments

The authors gratefully thank Dilla University for providing a field car. Special thanks also to Gedeo zone and Abaya woreda administrators, development agents, and the community for their imaginative opinions and cooperation during the field work. We also thank the National Nature Sciences Foundation of China (Fund No. 41571176) and the 111 Project (Fund No. B17024) for financial support.

Author Contributions

Habtamu Temesgen designed the research and wrote the paper. Wei Wu contributed through persistent guidance and editorial work.

Conflicts of Interest

The authors declare no conflict of interest.

References

  1. MEA. Ecosystems and Human Well-Being: Wetlands and Water; World Resources Institute: Washington, DC, USA, 2005. [Google Scholar]
  2. Brink, A.B.; Bodart, C.; Brodsky, L.; Defourney, P.; Ernst, C.; Donney, F.; Lupi, A.; Tuckova, K. Anthropogenic pressure in East Africa—Monitoring 20 years of land cover changes by means of medium resolution satellite data. Int. J. Appl. Earth Obs. Geoinf. 2014, 28, 60–69. [Google Scholar] [CrossRef]
  3. Temesgen, H.; Nyssen, J.; Zenebe, A.; Haregeweyn, N.; Kindu, M.; Lemenih, M.; Haile, M. Ecological succession and land use changes in a lake retreat area (Main Ethiopian Rift Valley). J. Arid Environ. 2013, 91, 53–60. [Google Scholar] [CrossRef] [Green Version]
  4. Wang, Z.; Mao, D.; Li, L.; Jia, M.; Dong, Z.; Miao, Z.; Ren, C.; Song, C. Quantifying changes in multiple ecosystem services during 1992–2012 in the Sanjiang Plain of China. Sci. Total Environ. 2015, 514, 119–130. [Google Scholar] [CrossRef] [PubMed]
  5. Yirsaw, E.; Wu, W.; Temesgen, H.; Bekele, B. Effect of temporal land use/land cover changes on ecosystem services value in coastal area of China: The case of Su-Xi-Chang region. Appl. Ecol. Environ. Res. 2016, 14, 409–422. [Google Scholar] [CrossRef]
  6. Lambin, E.F.; Meyfroidt, P. Land Use Transitions: Socio-Ecological Feedback versus Socio-Economic Change. Land Use Policy 2010, 27, 108–118. [Google Scholar] [CrossRef]
  7. Pender, J.; Place, F.; Ehui, S. Strategies for Sustainable Land Management in the East African Highlands; International Food Policy Research Institute (IFPRI): Washington, DC, USA, 2006. [Google Scholar]
  8. Hailu, G. Environment Law: Ethiopia; International Encyclopedia of Laws; Kulwer Law International: Leuven, Belgium, 2000. [Google Scholar]
  9. McGinley, M. Ethiopian montane moorlands. In Encyclopedia of Earth; Cleveland, C.J., Ed.; Environmental Information Coalition and the National Council for Science and the Environment: Washington, DC, USA, 2008. [Google Scholar]
  10. Feintrenie, L. Agro-industrial plantations in Central Africa, risks and opportunities. Biodivers. Conserv. 2014, 23, 1577–1589. [Google Scholar] [CrossRef]
  11. Temesgen, H.; Wu, W.; Legesse, A.; Yirsaw, E.; Bekele, B. Landscape based upstream-downstream prevalence of land use/cover change drivers in southeastern rift escarpment of Ethiopia. Environ. Monit. Assess. 2018, 190, 166. [Google Scholar] [CrossRef] [PubMed]
  12. Woodhouse, P. Beyond industrial agriculture? Some questions about farm size, productivity and sustainability. J. Agrar. Chang. 2010, 10, 437–453. [Google Scholar] [CrossRef]
  13. Daily, G. Nature’s Services: Societal Dependence on Natural Ecosystems; Island Press: Washington, DC, USA, 1997. [Google Scholar]
  14. Jacobs, M. Environmental Valuation, Deliberative Democracy and Public Decision-Making Institutions. In Valuing Nature; Taylor & Francis Group: London, UK, 1997; pp. 211–231. [Google Scholar]
  15. Reyers, B.; Biggs, R.; Cumming, G.S.; Elmqvist, T.; Hejnowicz, A.P.; Polasky, S. Getting the measure of ecosystem services: A social–ecological approach. Front. Ecol. Environ. 2013, 11, 268–273. [Google Scholar] [CrossRef]
  16. Wilson, M.A.; Howarth, R.B. Discourse-Based Valuation of Ecosystem Services: Establishing Fair Outcomes through Group Deliberation. Ecol. Econ. 2002, 41, 431–443. [Google Scholar] [CrossRef]
  17. Curtis, A.; de Lacy, T. Landcare, stewardship and sustainable agriculture in Australia. Environ. Values 1998, 7, 59–78. [Google Scholar] [CrossRef]
  18. Cáceres, D.; Tapella, E.; Quétier, F.; Díaz, S. The social value of biodiversity and ecosystem services from the perspectives of different social actors. Ecol. Soc. 2015, 20, 62. [Google Scholar] [CrossRef]
  19. De Groot, R.S.; Wilson, M.A.; Boumans, R.M. A typology for the classification, description and valuation of ecosystem functions, goods and services. Ecol. Econ. 2002, 41, 393–408. [Google Scholar] [CrossRef]
  20. Chan, K.M.; Satterfield, T.; Goldstein, J. Rethinking ecosystem services to better address and navigate cultural values. Ecol. Econ. 2012, 74, 8–18. [Google Scholar] [CrossRef]
  21. Milcu, A.; Hanspach, J.; Abson, D.; Fischer, J. Cultural ecosystem services: A literature review and prospects for future research. Ecol. Soc. 2013, 18, 44. [Google Scholar] [CrossRef]
  22. Plieninger, T.; van der Horst, D.; Schleyer, C.; Bieling, C. Sustaining ecosystem services in cultural landscapes. Ecol. Soc. 2014, 19, 59. [Google Scholar] [CrossRef]
  23. Schultz, L.; Folke, C.; Olsson, P. Enhancing ecosystem management through social-ecological inventories: Lessons from Kristianstads Vattenrike, Sweden. Environ. Conserv. 2007, 34, 140–152. [Google Scholar] [CrossRef]
  24. Smith, H.F.; Sullivan, C.A. Ecosystem services within agricultural landscapes—Farmers’ perceptions. Ecol. Econ. 2014, 98, 72–80. [Google Scholar] [CrossRef]
  25. Viglizzo, E.F.; Paruelo, J.M.; Laterrae, P.; Jobbágy, G. Ecosystem service evaluation to support land-use policy. Agric. Ecosyst. Environ. 2012, 154, 78–84. [Google Scholar] [CrossRef]
  26. Duguma, L.A.; Hager, H. Farmers’ assessment of the social and ecological values of land uses in central Highland Ethiopia. Environ. Manag. 2011, 47, 969–982. [Google Scholar] [CrossRef] [PubMed]
  27. Kanshie, T.K. Five Thousand Years of Sustainability? A Case Study on Gedeo Landuse (Southern Ethiopia); Treemail Publishers: Heelsum, The Netherlands, 2002. [Google Scholar]
  28. Legesse, A. The Dynamics of Gedeo Agroforestry and Its Implications to Sustainability. PhD Dissertation, UNISA, Pretoria, South Africa, 2014. [Google Scholar]
  29. Mebrate, B.T. Agroforestry Practices in Gedeo Zone Ethiopia a Geographical Analysis. Ph.D. Thesis, Panjab University, Chandigarh, India, 2007. [Google Scholar]
  30. Bevan, P.; Pankhurst, A. Ethiopian Village Studies: Adado Gedeo; Department of Sociology, Addis Ababa University: Addis Abeba, Ethiopia, 1996. [Google Scholar]
  31. SLUF. Indigenous Agro-Forestry Practices and Their Implications on Sustainable Land Use and Natural Resources Management, the Case of Wonago Woreda: SIDA and Oxfam Novib; Addis Ababa, Ethiopia, Unpublished work; 2006. [Google Scholar]
  32. Nair, P.; Garrity, D. Agroforestry, the Future of Global Land Use; Nair, P.K.R., Garrity, D., Eds.; Springer: Dordrecht, The Netherlands, 2012. [Google Scholar]
  33. Debelo, A.R.; Tura, A.L.; Milstein, T.; Orkaydo, O.O. “Tree is life”: The rising of Dualism and the Declining of Mutualism among the Gedeo of southern Ethiopia. Front. Commun. 2017, 2, 7. [Google Scholar] [CrossRef]
  34. Bishaw, B. Farmers’ Strategies for Adapting to and Mitigating Climate Variability and Change through Agroforestry in Ethiopia and Kenya; Forestry Communications Group, Oregon State University: Corvallis, Oregon, OR, USA, 2013. [Google Scholar]
  35. Negash, M.; Yirdaw, E.; Luukkanen, O. Potential of indigenous multistrata agroforests for maintaining native floristic diversity in the south-eastern Rift Valley escarpment, Ethiopia. Agrofor. Syst. 2012, 85, 9–28. [Google Scholar] [CrossRef]
  36. Deininger, K.W.; Byerlee, D. Rising Global Interest in Farmland: Can It Yield Sustainable and Equitable Benefits? The World Bank: Washington, DC, USA, 2011. [Google Scholar]
  37. World Bank. GEM Commodities. 2012. Available online: http://data.worldbank.org/data-catalog/commodity-price-data (accessed on 1 December 2017).
  38. Negasa, T.; Ketema, H.; Legesse, A.; Sisay, M.; Temesgen, H. Variation in soil properties under different land use types managed by smallholder farmers along the toposequence in southern Ethiopia. Geoderma 2017, 290, 40–50. [Google Scholar] [CrossRef]
  39. CSA. Population Projection of Ethiopia for All Regions at Wereda Level from 2014–2017; Central Statistical Authority: Addis Ababa, Ethiopia, 2013. [Google Scholar]
  40. Negash, M. Trees management and livelihoods in Gedeo’s agroforests, Ethiopia. For. Trees Livelihoods 2007, 17, 157–168. [Google Scholar] [CrossRef]
  41. Debelo, A.R. Ethnicity and Inter-Ethnic Relations. The ‘Ethiopian Experiment’ and the Case of the Guji and Gedeo. Master’s Thesis, Universitetet i Tromsø, Tromsø, Norway, 2007. [Google Scholar]
  42. Farber, S.C.; Costanza, R.; Wilson, M.A. Economic and ecological concepts for valuing ecosystem services. Ecol. Econ. 2002, 41, 375–392. [Google Scholar] [CrossRef]
  43. Randall, A. Valuing the outputs of multifunctional agriculture. Eur. Rev. Agric. Econ. 2002, 29, 289–307. [Google Scholar] [CrossRef]
  44. King, D.M. Comparing Ecosystem Services and Values; US Department of Commerce, NOAA, Damage Assessment and Restoration Program: Silver Spring, MD, USA, 1997.
  45. Díaz, S.; Quétier, F.; Cáceres, D.M.; Trainor, S.F.; Pérez-Harguindeguy, N.; Bret-Harte, M.S.; Finegan, B.; Peña-Claros, M.; Poorter, L. Linking functional diversity and social actor strategies in a framework for interdisciplinary analysis of nature’s benefits to society. Proc. Natl. Acad. Sci. USA 2011, 108, 895–902. [Google Scholar] [CrossRef] [PubMed]
  46. Smith, K.R. Public payments for environmental services from agriculture: Precedents and possibilities. Am. J. Agric. Econ. 2006, 88, 1167–1173. [Google Scholar] [CrossRef]
  47. Young, C.; Wesner, M. Aesthetic Values of Forests: Measuring the Visual Impact of Forestry Operations; FAO: Rome, Italy, 2003; pp. 23–28. [Google Scholar]
  48. Kindu, M.; Schneider, T.; Teketay, D.; Knoke, T. Drivers of land use/land cover changes in Munessa-Shashemene landscape of the south-central highlands of Ethiopia. Environ. Monit. Assess. 2015, 187, 1–17. [Google Scholar] [CrossRef] [PubMed]
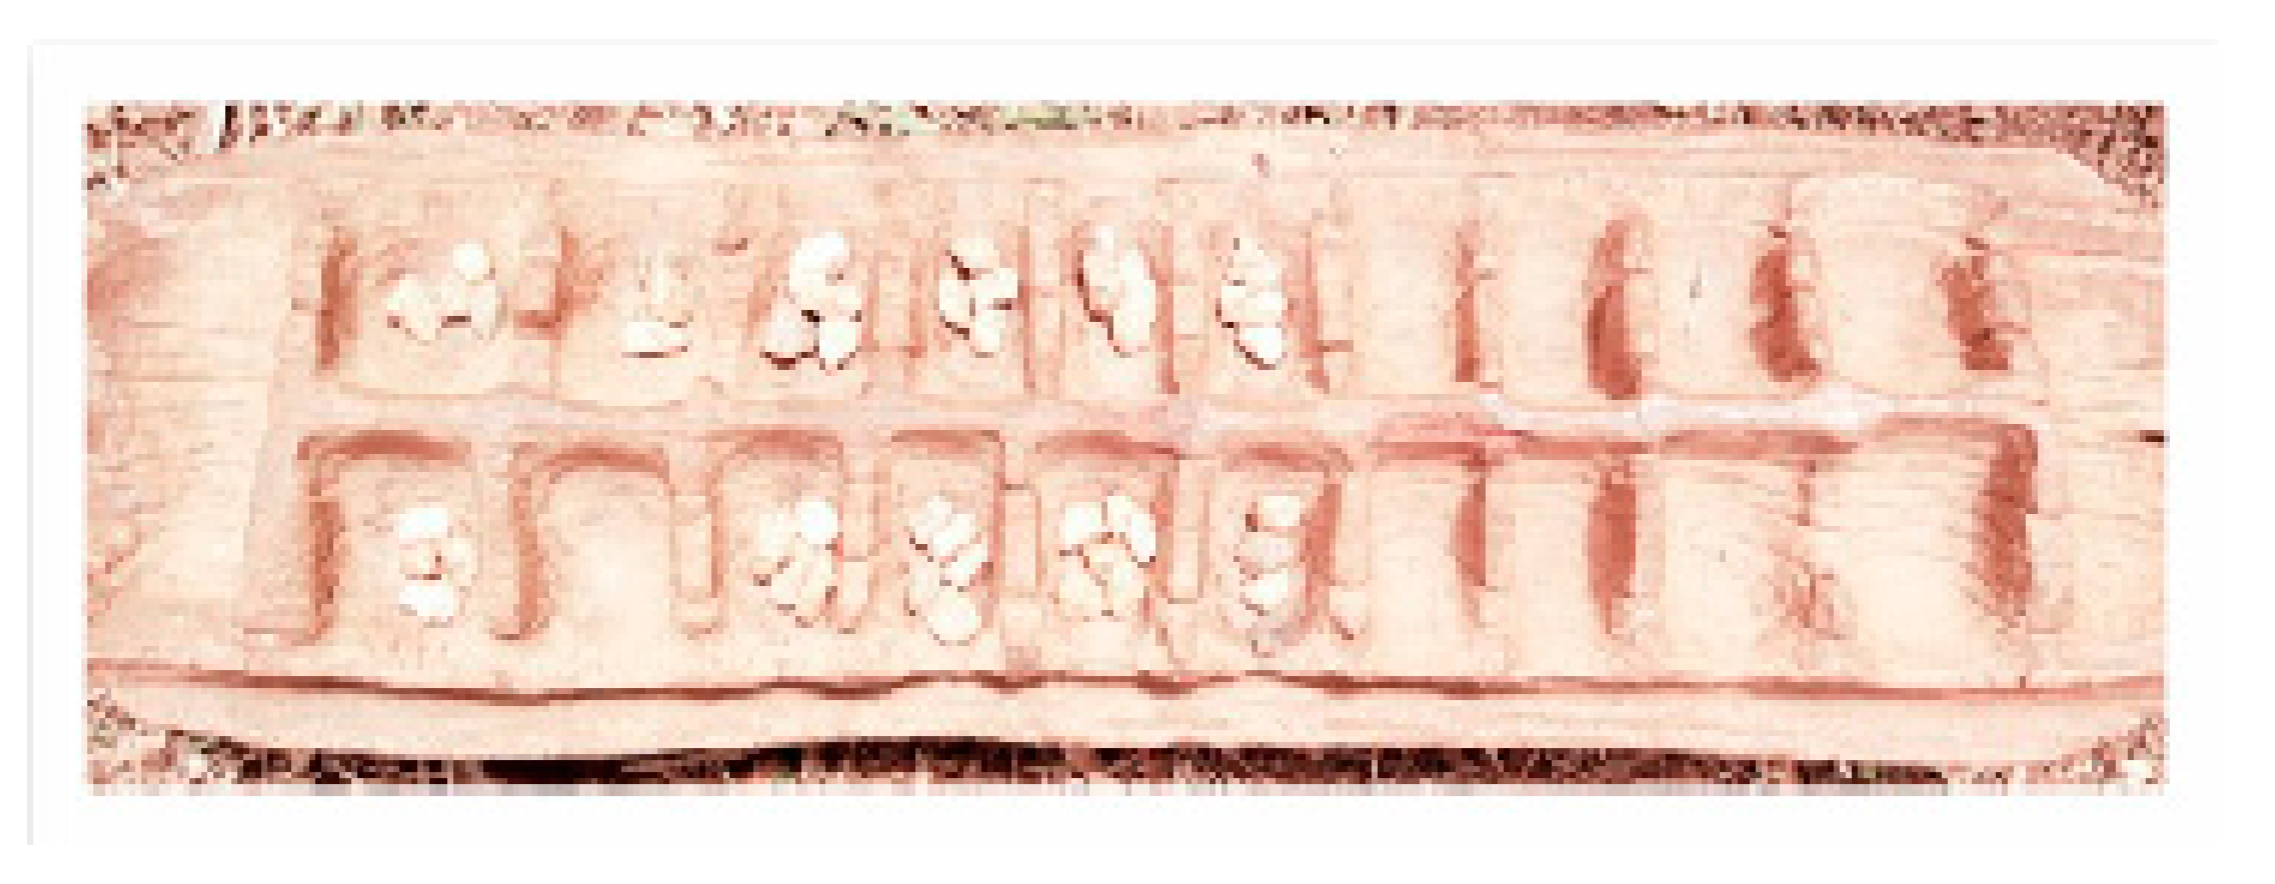
  49. Driedger, W. The game of Bao, or Mankala in East Africa. Mila 1972, 3, 7–19. [Google Scholar]
  50. Cleaver, F. Paradoxes of participation: Questioning participatory approaches to development. J. Int. Dev. 1999, 11, 597. [Google Scholar] [CrossRef]
  51. Franzel, S.; Hitimana, L.; Akyeampong, E. Farmer participation in on-station tree species selection for agroforestry: A case study from Burundi. Exp. Agric. 1995, 31, 27–38. [Google Scholar] [CrossRef]
  52. Mafongoya, P.L.; Kuntashula, E. Participatory evaluation of Tephrosia species and provenances for soil fertility improvement and other uses using farmer criteria in eastern Zambia. Exp. Agric. 2005, 41, 69–80. [Google Scholar] [CrossRef]
  53. Stallman, H.R. Ecosystem services in agriculture: Determining suitability for provision by collective management. Ecol. Econ. 2011, 71, 131–139. [Google Scholar] [CrossRef]
  54. Adimassu, Z.; Langan, S.; Johnston, R. Understanding determinants of farmers’ investments in sustainable land management practices in Ethiopia: Review and synthesis. Environ. Dev. Sustain. 2016, 18, 1005–1023. [Google Scholar] [CrossRef]
  55. Beyene, F. Land use change and determinants of land management: Experience of pastoral and agro-pastoral herders in eastern Ethiopia. J. Arid Environ. 2016, 125, 56–63. [Google Scholar] [CrossRef]
  56. Wolancho, K.W. Evaluating watershed management activities of campaign work in Southern nations, nationalities and peoples’ regional state of Ethiopia. Environ. Syst. Res. 2015, 4, 6. [Google Scholar] [CrossRef]
  57. Negash, M.; Achalu, N. History of Indigenous Agro-Forestry in Gedeo, Southern Ethiopia, Based on local community interviews: Vegetation diversity and structure in the Land-use systems. Ethiop. J. Nat. Resour. 2008, 10, 31–52. [Google Scholar]
  58. ICRAF. Paths to Prosperity through Agroforestry. ICRAF’s Corporate Strategy, 2001–2010; International Centre for Research in Agroforestry: Nairobi, Kenya, 2000. [Google Scholar]
  59. Biazin, B.; Sterk, G. Drought vulnerability drives land-use and land cover changes in the Rift Valley dry lands of Ethiopia. Agric. Ecosyst. Environ. 2013, 164, 100–113. [Google Scholar] [CrossRef]
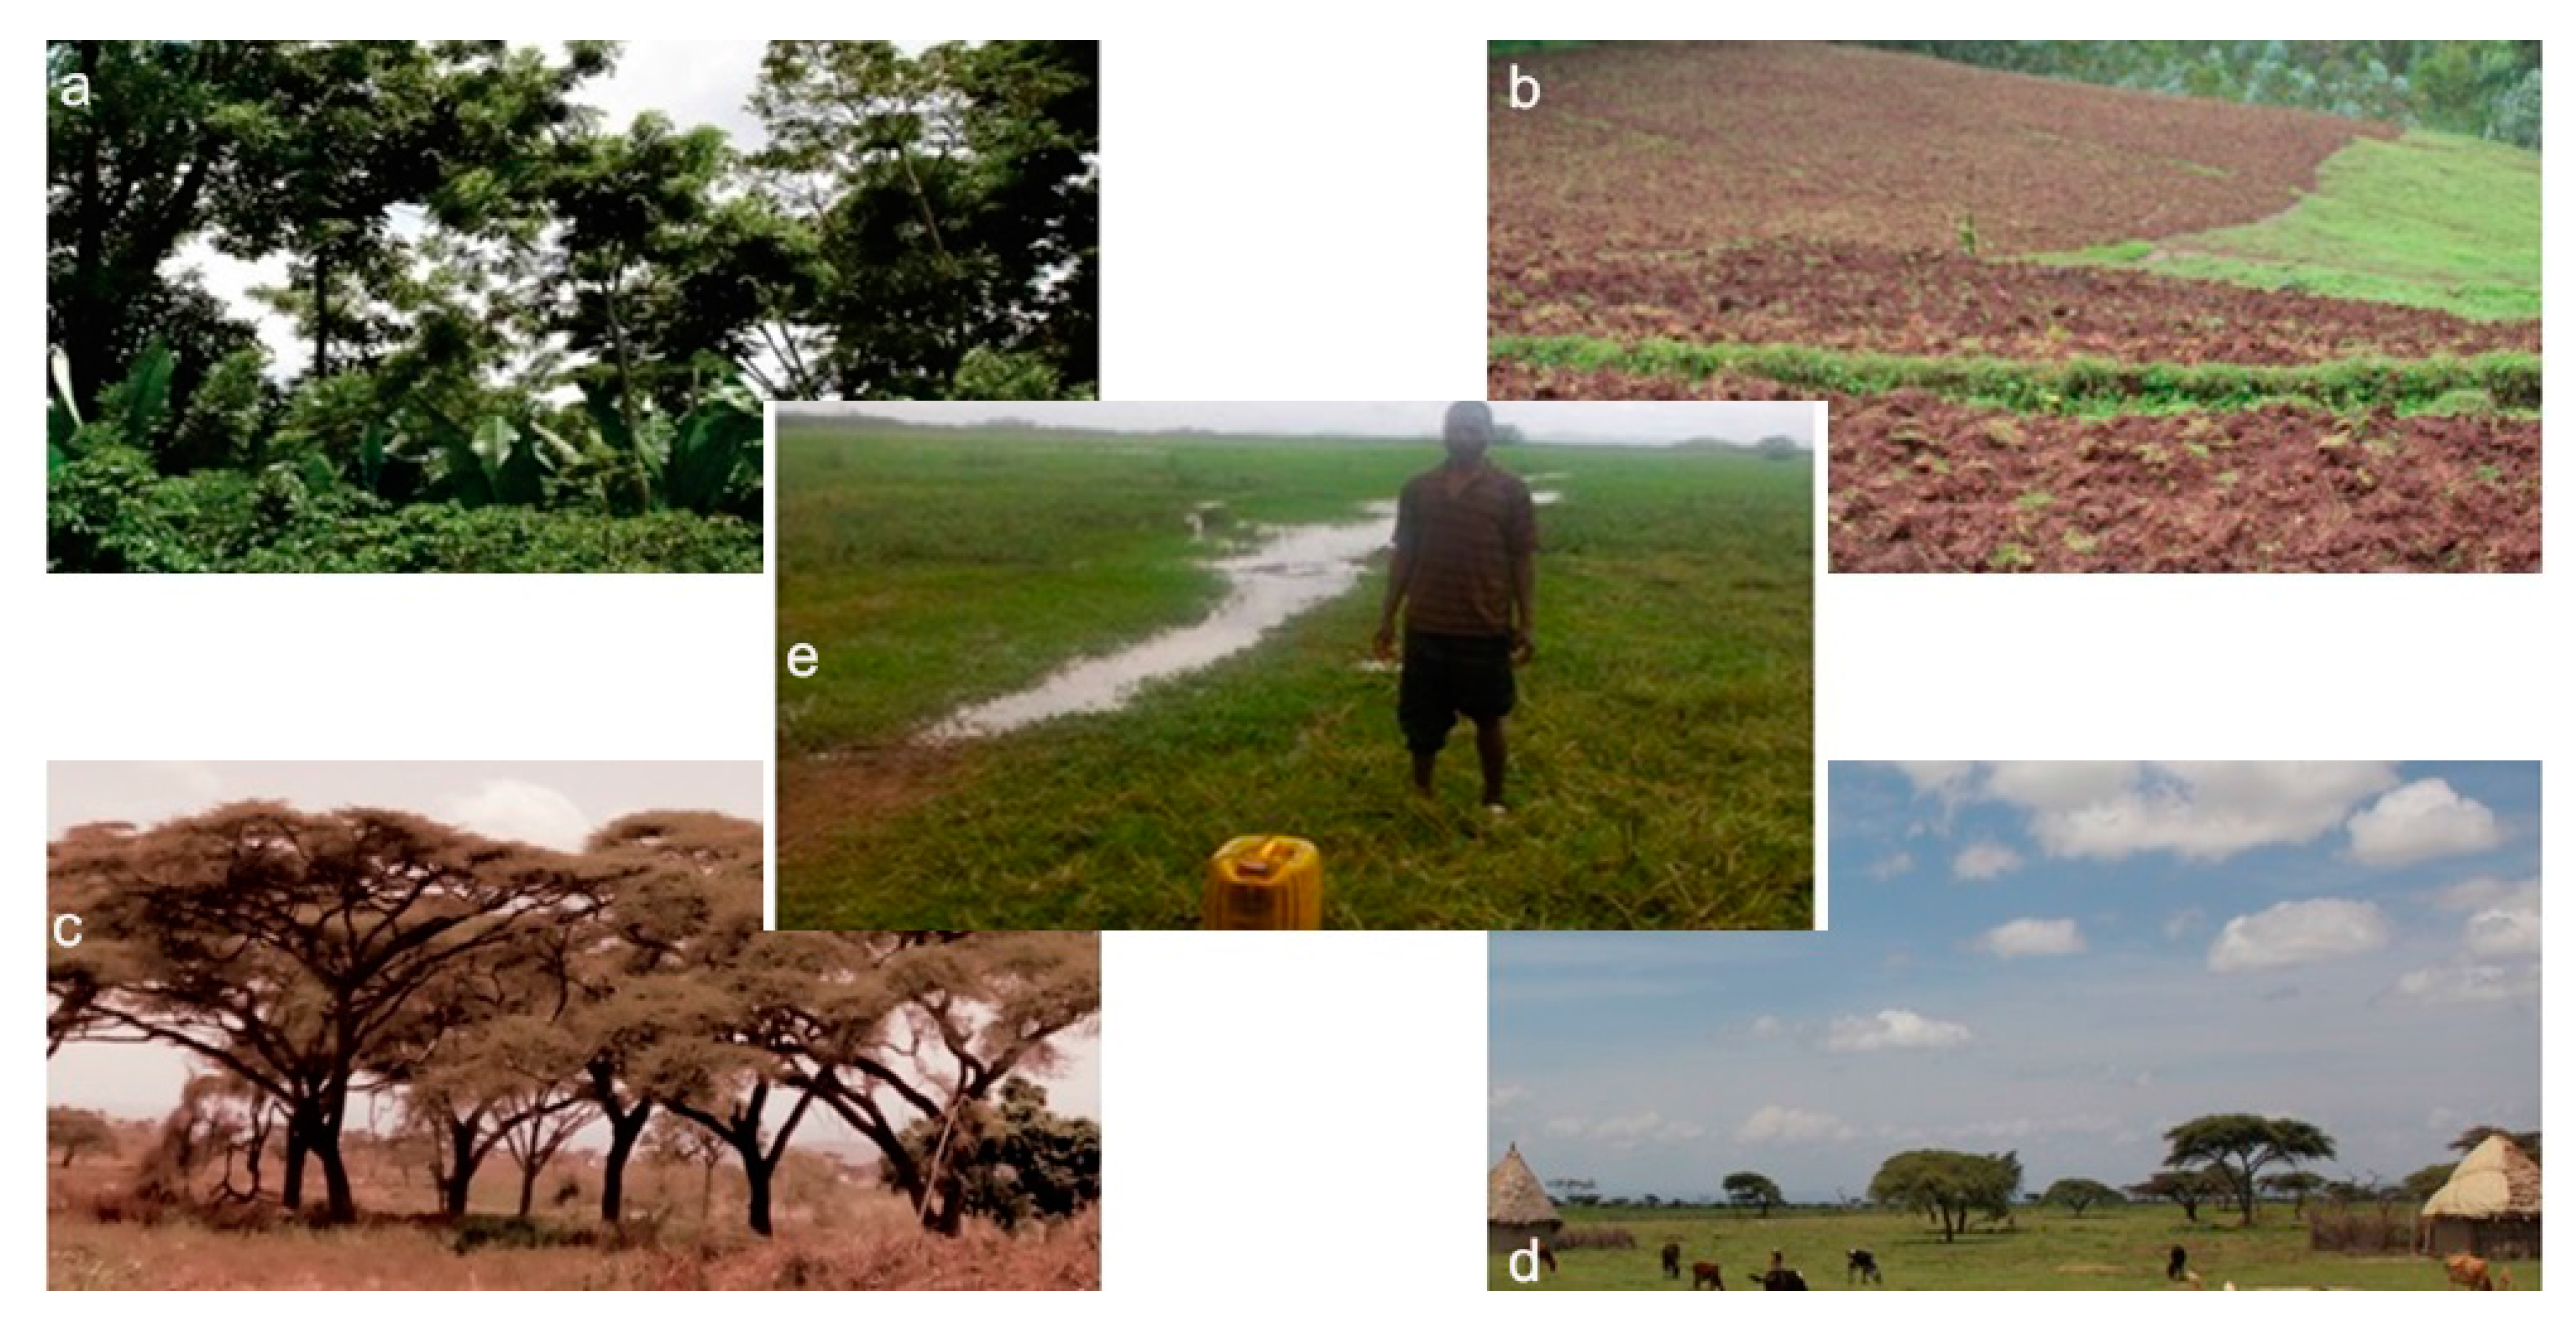
Figure 1. Study area map, which also shows agroecological settings of the study landscape.
Sustainability 10 00703 g001
Figure 2. Schematic methodological flow detection (where ESs-Ecosystem Services and ET-Ecosystem (LUC) Types).
Sustainability 10 00703 g002
Figure 3. Pictorial representations of the major ecosystem (LUC) types used as photo panel resources during the three stages of the data collection process in the Gedeo-Abaya landscape: (a) agroforestry; (b) cultivation land; (c) woodland; (d) grazing land; (e) wetland (Note: All photos were taken by the first author except for (a,e)—Reproduced with permission from Temesgen et al. [11]).
Sustainability 10 00703 g003
Figure 4. Wooden bao game board (belonging to farmers of Mokonisa kebele; Wenago woreda) used for criteria-based scoring of ESs offered by LUC types (photo by the first author taken on September 2016).
Sustainability 10 00703 g004
Figure 5. Percentage of the relative importance of the ecosystem services (ESs) provided by five LUC types (AF—agroforestry, CL—cultivation land, GL—grazing land, WL—woodland/shrubland and WeL—wetland) according to the priorities and interests of the local farmers interviewed.
Sustainability 10 00703 g005
Figure 6. Aggregate relative importance (%) of the bundle services values offered by five ecosystem/LUC types (AF—agroforestry, CL—cultivation land, GL—grazing land, WL—woodland and WeL—wetland) as per the perceptions of attendant local farmers.
Sustainability 10 00703 g006aSustainability 10 00703 g006b
Figure 7. Relative importance values of sixteen ecosystem services as provided by five primary ecosystem (LUC) types; AF—agroforestry, CL—cultivation land, GL—grazing land, WL—woodland/shrub, and WeL—wetland.
Sustainability 10 00703 g007
Figure 8. Relative importance (%) of the ecosystem services offered by five ecosystem (LUC) types (AF—agroforestry, CL—cultivation land, GL—grazing land, WL—woodland and, WeL—wetland) according to the priorities and interests of local farmers.
Sustainability 10 00703 g008
Table 1. Observation- and literature-based description of the ecosystem land use/land cover (LUC) types; the area coverage was obtained from properly classified works of Temesgen et al. [11].
Ecosystem (LUC) TypesDescriptionArea Coverage (%) aRegion Dominance (Visual Estimation)
Agroforestry (AF)Indigenously managed semi-forest area in which annual/perennial crops and/or animals are consciously used on the same land management units;40.51In the upstream region
Cultivation land (CL)Cropping fields (with sparsely existing farm trees) owned by both smallholders and large-scale farmers;15.04Through out
Grassland (GL)Dominated with grass and herb cover together with scattered trees and shrubs23.58In the downstream region
Woodland (WL)Areas dominated with woody Acacia plants which cover >20% of the surface (with height 5–20 m); also includes shrubland covered with small trees and bushes;7.78In the downstream region
Wetland (WeL)Includes: river beds, intermittent ponds, and marshy areas with shallow water and permanent reed vegetation9.55In the downstream region
a Riverine forest, barren land, and water body constitutes the rest (3.54%) of the study landscape.
Table 2. Pearson Correlation (2-tailed) of the relative importance of ecosystem services for the upstream and downstream regions.
Ecosystem ServicesWSESWCSFRMSCRECWRWTHMSFIShShRAVShCDRVTS
Upstream Region
WS10.18−0.15−0.030.100.420.710.98 **0.99 **0.530.62−0.190.08−0.15−0.19−0.28
ES11.00 **0.730.95 *0.780.540.01−0.280.700.640.95 *0.89 *0.94 *0.94 *0.37
WCS10.730.96 **0.800.560.02−0.250.720.660.94 *0.89 *0.94 *0.93 *0.36
FR10.700.480.500.10−0.140.430.510.800.93 *0.88 *0.90 *0.68
MS10.92 *0.770.26−0.010.860.840.850.91 *0.860.850.37
CR10.91 *0.560.330.98 **0.96 **0.660.760.660.630.10
EC10.810.620.93 *0.98 **0.450.700.500.470.15
WR10.96 **0.670.73−0.010.240.02−0.02−0.25
WT10.460.52−0.26−0.04−0.24−0.29−0.39
HM10.97 **0.620.700.610.57−0.03
SFI10.540.740.570.540.15
ShSh10.88 *0.99 **0.98 **0.28
RAV10.94 *0.94 *0.55
ShCD11.00 **0.40
RV10.47
TS1
Downstream Region
WS1−0.46−0.470.580.350.550.630.740.780.430.15−0.040.31−0.71−0.27−0.52
ES11.00 **0.140.570.150.120.170.090.520.410.860.650.94 *0.91 *−0.34
WCS10.100.570.140.110.160.090.520.400.850.650.95 *0.91 *−0.34
FR10.860.070.160.460.620.67−0.230.190.80−0.070.47−0.69
MS10.270.330.600.700.91 *0.140.630.99 **0.330.80−0.86
CR11.00 **0.90 *0.720.530.90 *0.640.36−0.120.01−0.45
EC10.94 *0.770.580.860.620.41−0.140.02−0.51
WR10.94 *0.800.700.620.63−0.150.21−0.76
WT10.88 *0.460.480.68−0.240.27−0.91 *
HM10.420.720.90 *0.220.70−0.97 **
SFI10.770.260.240.15−0.28
ShSh10.730.670.73−0.54
RAV10.410.82−0.81
ShCD10.80−0.03
RV1−0.59
TS1
* and ** mean the correlation is significant between responses to ES attributes at the 0.05 level and at the 0.01 level (2-tailed), respectively; WS—water supply, ES—Energy source, WCS—Woodlot/construction sources, FR—Fodder resources, MS—Medical services, CR—Climate regulation, EC—Erosion control, WR—Water regulation, WT—Water treatment, HM—Habitat maintenance, SFI—Soil fertility improvement, ShSh—Shade and shelter for animal and plant, RAV—Recreation/aesthetic values, ShCD—Shade for cultural deliberations, RV—Religious values, TS—Tenure security.
Table 3. Most frequently cited threats and second most frequently cited threats of individual ESs as identified by farmers in each catchment.
Individual ESsCatchments
Upstream (Most Frequent; 2nd most Frequent)Downstream (Most Frequent; 2nd most Frequent)
Water supplyDeforestation; Drought/RF var.Drought/RF var.; Agri-business investment(inv.)
Energy sourceCommercializing woodlots; DeforestationCharcoaling; Agri-business inv.
Woodlot/construction sourcesCommercializing woodlots; DeforestationCharcoaling; Agri-business inv.
Fodder resourcesDiminished holding size; Drought/RF var.Drought/rainfall var.; Agri-business inv.
Medical servicesDeforestation; Land degradationOvergrazing; Drought/RF var.
Climate regulationDrought/RF var.; DeforestationDrought/rainfall var.; Livestock population
Erosion controlCommercializing woodlots; Drought/RF var.Overgrazing; Drought/RF var.
Water regulationDeforestation; Drought/RF var.Agri-business inv.; Deforestation
Water treatmentDeforestation; Population pressureNA; NA (Not well understood) a
Habitat maintenanceDiminished holding size; Drought/RF var.Agri-business inv.; Livestock population
Soil fertility improvementDeforestation; Drought/RF var.Deforestation; Overgrazing
Shade & shelter for animal & plantCommercializing woodlots, DeforestationCharcoaling; Commercializing woodlots
Recreation/Aesthetic valuesDiminished holding size; Population pressureDeforestation; Drought/RF var.
Shade for cultural deliberationsCommercializing woodlots; DeforestationCharcoaling; land use change
Religious valuesSocio-cultural change; Diminished holding sizeNew religions; Deforestation
Tenure securityPopulation increment; Diminished holding sizeAgri-business inv.; land use policy
a NA indicates ‘no answer’—which was registered for more than 70% of the responses, as the concept of water treatment was poorly understood, particularly in the downstream region.

