Has Selection for Grain Yield Altered Intermediate Wheatgrass?


Department of Plant Science, University of Manitoba, 66 Dafoe Road, Winnipeg, MB R3T 2N2, Canada
*
Author to whom correspondence should be addressed.
Sustainability 2018, 10(3), 688; https://doi.org/10.3390/su10030688
Submission received: 10 February 2018
/
Revised: 26 February 2018
/
Accepted: 28 February 2018
/
Published: 3 March 2018
(This article belongs to the Special Issue Strategies, Advances and Challenges of Breeding Perennial Grain Crops)
Abstract
:Perennial grains are demonstrating a greater probability of occupying land currently dedicated to other agricultural production. Arable land that is currently in use for forage or annual crop production becomes utilized. Breeding materials for the introduction of perennial grains directly into the human food chain has required utilizing existing plant materials in the domestication of species or manufacturing diverse crosses to introduce perenniality into existing crops. In the domestication of intermediate wheatgrass (Thinopyrum intermedium (Host), Barkworth and Dewey), existing forage cultivars or plant accessions were used to develop populations selected for grain production. A comparison of Cycle 3 materials from The Land Institute (TLI), Salina, KS, USA to USDA-Germplasm Resources Information Network (GRIN) accessions took place under space-planted field conditions at Carman, MB, Canada from 2011 to 2014. One hundred plants (75 TLI and 25 GRIN identified in May 2012) were followed through three seed harvests cycles with phenological, morphological and agronomic traits measured throughout. Selection for seed productivity (TLI materials) reduced the importance of biomass plant−1 on seed yield plant−1, leading to an increase in harvest index. Principal component analysis demonstrated the separation of the germplasm sources and the differential impact of years on the performance of all accessions. Path coefficient analysis also indicated that plant biomass production was of less importance on seed yield plant−1 in the TLI materials. Analysis removing area plant−1 as a factor increased both the importance of biomass and heads on seed yield cm−2 in the TLI materials, especially in the first two seed production years. Plant differences due to selection appear to have reduced overall plant area and increased harvest index in the TLI materials, indicating progress for grain yield under selection. However, a greater understanding of the dynamics within a seed production field is needed to provide insight into the development of more effective selection criteria for long-term field level production.
1. Introduction
Perennial grains have received greater attention in the past decade due in part to their potential to be productive over a number of years [1] and potential positive impacts on soils [2]. Potential environmental benefits of perennialized cropping systems include higher carbon storage [3,4], greater water use efficiency [5], better nutrient management and greater soil protection than annual crops [6]. The majority of feed that animals utilize in protein (meat) production is not human-consumable (e.g., forage, processing by-products) and is often produced on land not-suited to annual crop production (e.g., pastureland, rangeland) [7]. A recent modelling exercise of a doubling of forage production area in Manitoba found an increase in greenhouse gas emissions, due to enteric fermentation by animals [8]. However, environmental services would still be accrued under this increase in forage production when compared to annual crop production [8,9]. Perennial grains can therefore retain the benefits attributed to forage production and lessen the impact due to animals in growing perennials, even if used as a dual crop [10].
1.1. Challenges to Crop Production
In order to meet increasing demands of a growing population, all crop production will be required to increase under conditions that will feature greater abiotic stress [11]. Stresses will be dependent upon the growth environment [11]. How abiotic stress will impact crop production will be dependent upon the level of stress and yield component compensatory effects. For example, wheat (Triticum aestivum L.) produced under water-logged soil conditions showed a decrease in yield spike−1 which was due to both seed number spike−1 and kernel weight reductions [12]. In spring oilseed rape, a reduction in seed number under shaded condition resulted in an increase of individual seed weight but not a change in overall seed yield [13].
Altering or mitigating environmental influences through cultural management practices and genetic advancement can benefit crops. Full-year irrigation in southern Italy increased the stand life of both forage and seed production stands of perennial legumes and grasses and it greatly increased seed yield across years [14]. A flowering time mutant in Oryza sativa L., Japonica type, has been identified leading to flowering taking place earlier in the day, about 2.5 h earlier, in mid-morning to reduce heat stress on flowering [15]. Earlier pollen release may reduce stress on plant fertility by avoiding higher temperatures that occur later in the day.
1.2. Role of Plant Breeding
Plant breeding has attempted to reduce plant yield variability due to environmental stresses [16], with selection within the climatic area leading to adaptation to local conditions. Perennial species are subjected to potential stress throughout their total lifetime, “Clonal growth involves massive turnover of tissues, repeatedly during the plant lifespan.” [17]. Clonal perennials have a tendency for lower reproductive output than non-clonal perennials [17]. Events can impact perennial plants such that the performance of a plant during a specific stress period can lead to issues of fitness at a later date [18]. Yield in intermediate wheatgrass (Thinopyrum intermedium (Host), Barkworth and Dewey) (IWG), a clonal perennial, has shown to be variable over time with genetics influencing year to year changes in seed yield [1,19,20]. Productivity in production fields of intermediate wheatgrass bred for grain production (Kernza) has shown a decline in yield across years [19]. Seed production in perennial grasses is the culmination of year-round influences, generally beginning immediately after the previous seed harvest and continuing through to the next harvest [6,21].
Historically, adequate seed yield and good plant persistence were traits considered in forage breeding but generally these traits were not among the primary selection criteria [22]. Domestication selection in forage grasses has shifted populations to larger plants and indirectly for organelle traits associated with forage production [23]. Selection for forage yield has led to selection for some leaf traits in perennial forages [23]. In IWG, direct selection for plant seed and forage yield has historically been carried out [20].
1.3. Genetic and Environmental Effects on Seed Yield
In grain, oilseed and pulse crops that are utilized for human consumption, the mass of the harvested product (seed yield), in general, is used as a measure of the success of the enterprise and is expressed in kg ha−1, i.e., environmental and ecological impacts are often ignored. Seed yield may be affected by numerous plant traits. Seed yield components can interact and influence overall seed yield [24,25,26]. Differences in seed size between two wheat cultivars were shown to be related to differential gene expression in the endosperm during the seed fill and maturation processes [27]. In intermediate wheatgrass, at least 23 quantitative trait loci (QTLs) are associated with seed weight and seed size [28]. A study of rapeseed (Brassica napus L.) found 525 QTLs affecting seed yield, of which 295 QTLs were present in all growth environments [29], indicating the complexity of seed yield.
Wind pollinated species, in general, show greater year to year variability than animal pollinated species [30] due in part to climatic factors effecting pollination efficiency in mast seeding events. Growth environment (year) affected seed set and seed yield in Lathryus vernus L., an animal-pollinated temperate legume [31]. In temperate perennial grasses, the cycle generally begins immediately after seed harvest and proceeds through to the next seed harvest [21]. Tillers formed after harvest and before winter provided most of the following year’s seed harvest in three perennial grasses [32,33]. Within growing season, reproductive growth was influenced by water availability, with N application rate increasing fertile tiller number, seeds inflorescence−1, seed weight and fall tiller density in Leymus chinensis (Trin.) Tzvel. [34].
Selection for one trait can influence the expression of other traits [18]. Pleiotropy was noted in rapeseed seed production [29]. Mid-anthesis heads were more productive [33], where pollen limitation would not be expected. Inter- and intra-inflorescence competition impacts seed yield with the closer the reproductive unit to the source, the greater the resulting yield [31]. Maximum seed viability occurred between 17, 35 and 12 days after peak anthesis for Lolium perenne L., Phleum pratense L. and Bromus catharticus Vahl (formerly Bromus unioloides Kunth) [33].
1.4. The Question
Accessions were obtained from USDA-Germplasm Resources Information Network (GRIN), Pullman, Washington, USA and Cycle 3 seed from The Land Institute, Salina, Kansas, USA (lines selected for seed production). Plant phenological, morphological and agronomic characteristics were measured to ascertain if selection for grain yield changed plant type or characteristics via a comparison between the germplasm sources.
2. Materials and Methods
Seeds of intermediate wheatgrass were obtained from the USDA-NCRS GRIN collection (GRIN) and from Cycle 3 germplasm of the perennial grain breeding program of The Land Institute of Salinas, KS (TLI) (see [33]) for germplasm evaluation in Manitoba. Approximately 4500 plants were transplanted into the field in the spring of 2011 at the Ian N. Morrison Research Farm of the University of Manitoba located at Carman, MB (49°29′46".70N, 98°2′43".64W).
Individual seeds were germinated, seedlings potted and grown for 8–12 weeks before transplanting in the field. After the first winter, 100 adapted plants were chosen to be followed through three consecutive seed harvests. Twenty-five plants of an accession family were transplanted into rows at 60 cm between plants within rows and 90 cm between rows. There were two rows for each accession family, randomized in two blocks. Inter-row cultivation and hand weeding were conducted to control weeds. Plants were clipped at 10 cm height at harvest and total plant dry matter was used to determine biomass produced. Fertilizer was applied in the fall after seed harvest and plant clipping at a rate of 30 kg ha−1N using a 44-0-0 urea source.
Cold temperatures in April 2012 led to the removal of approximately 60% of the materials from the overall study [1]. Accession or breeding line was not a consistent factor in identifying damaged plants although TLI lines were generally more variable. In May of 2012, one hundred individuals were selected for more measurements, and all materials selected did not visually show impact from the cold temperatures. Plants were selected based upon morphology differences within accession groups. There were 25 GRIN accessions and 75 TLI accessions selected for intense study. TLI accessions showed greater morphological variability within lines due to the open-pollination of the source materials and as some GRIN accessions being cultivars. Leaf width and length, stem diameter, crown size and degree of rhizomatousness were characteristics that showed visible differences and were primarily used to make the selections.
Climate data were collected at the Carman Research Station and compiled on a daily basis for the cropping years studied (2011–2014). This data has been previously reported [1].
2.1. Measurement in All Years
Plants were monitored for flowering initiation, with first flower being the day of the year when at least three inflorescences had visibly extruded anthers. Flowering observations were made three times weekly. Heading, end of flowering and harvest date were also noted for each individual.
Individual plants were harvested for seed in all years. Inflorescence number plant−1 (Heads) was counted prior to harvest. Plants were harvested once seed shatter was noted or at the hard dough stage [35] whichever occurred first. Biomass plant−1 (Biomass) was measured by cutting all of a plant’s vegetative and reproductive materials at this point at 10 cm, placed in paper bags to prevent loss of material and dried until a constant weight. Plants were weighed, inflorescences separated for vegetative materials and then plants were individually threshed. Seed was cleaned on a Westrup seed cleaner. Free threshing of the individual plants was then rated due to differences in free-threshing between individuals (adherence of the lemma and palea). Lemmas and paleas were then removed through manual cleaning and all seed yields are reported on a bare caryopsis basis [6]. Seed mass was determined on a bare seed basis by counting 1000 seeds with a seed counter and then weighing the 1000 seeds. Plant height was measured on three flowering stems plant−1 to the tip of the inflorescence after the onset of anthesis in all years.
2.2. Measurements in 2013–2104
Flag leaf area was measured by removing five flag leaf blades after the inflorescence began to change colour during maturation. ASSESS software (American Phytopathological Society 2002) was used to measure total leaf area. After harvest, ground area covered by the individual plant was estimated by measuring the two widest perpendicular dimensions of the plant and multiplying these dimensions. Approximately seven days after the initiation of flowering and approximately seven days before harvest in 2013 and 2014, five seedheads were collected from each plant. The first sample was used to count spikelets head−1 and florets spikelet−1 to ascertain the number of florets head−1. Five grams of seed was randomly sampled from each individual. If five grams was not available, all of the seed produced by the individual was used to measure the weight of the sample composed of ergot (Claviceps purpurea (Fr.) Tul.) and expressed as a percentage.
2.3. Calculated Characteristics Based on Measurements
The following were calculated based upon measurements made:
Seed yields (Yield) were expressed on a weight basis (g) for all plants harvested. Yield data within individual years was then expressed on a relative basis for the 100 plants harvested in 2014 for all harvest years:
where, RYld (relative yield %) ((Yield/mean Yield for all plants) × 100), Yield, yield of the plant in g for the year of harvest, and mean Yield being the mean yield for the 100 plants harvested. Yield and RYld for each harvest year was regressed to the cumulative yield for the three years of harvest:
RYld = (Yld/mean Yld) × 100
- Harvest Index (HI) = seed yield/biomass;
- Seed heads cm−2 (SHA) = Heads/plant area (cm2);
- Seed yield area (SYA) = Yield/plant area (cm2);
- Seed yield seedhead−2 (SYH) = Yield/seedheads plant−2;
- Biomass area (BIOA) = Biomass/plant area (cm2).
Coefficients of variation (CV) were calculated for Yield (CV Yield) and RYld (CV RYld) for the individual plants across years.
2.4. Analysis
Simple statistics were calculated on all measurements using PROC MEANS in SAS 9.4 (SAS Institute Inc., Cary, NC, USA) with means, standard deviation and range of values were calculated for all measures (raw data in Supplementary Table S1). Correlations between variables were calculated using PROC CORR in SAS 9.4. Within source means were compared for the CV Yield and CV RYld using PROC MIXED in SAS with outliers removed based on studentized residual values.
Principal component analysis was conducted using the prcomp function of R/stats on centered and scaled data [36]. In instances were missing values occurred missing values were substituted by the population mean. Plots were visualized using the R package ggfortify 3.
Regression of individual year seed yields to predict overall (cumulative) performance, both from an actual seed yield and a relative seed yield of the 100 plants, was performed using PROC REG in SAS.
Path coefficient analysis was conducted using PROC CALIS in SAS 9.4 with each year overall and germplasm source within years being calculated separately utilizing covariance structure analysis: maximum likelihood estimation. The simplest model was chosen in the end with plant area, Heads, Biomass and seed mass having direct effects calculated on Yield, and effects of Heads on seed mass also being calculated to look at indirect effects of seed mass on Yield through Heads. Path coefficients were also calculated for SYA of plant with the direct effects of BIOA, SHA and seed mass calculated. The direct effect of SHA on seed mass was also calculated to look at indirect effects of seed mass on SYA through SHA.
3. Results
3.1. One Hundred Plants
Many plant seed yield characteristics changed over the years of harvest (Table 1). Flowering and harvest timings were later by the third reproductive year. Mean Yield was highest in 2013 and lowest in 2014 similar to data previously reported [1]. Yield and SYA were also highest in 2013 and were positively correlated with r values of r = 0.74 in 2012, r = 0.70 in 2013 and r = 0.88 in 2014 (p < 0.01 for all years). Mean Biomass was lower in 2014 as was seed mass, however HI remained relatively consistent. A few of the USDA-GRIN accessions lines contained highly rhizomatous plant types and these lines were uniform for this growth type. However, only a few of these plant types were included and they remain in the analysis even though they would appear to be outliers.
Relationships between characters measured were, in general, consistent in direction but were different in magnitude. Correlation coefficients for HI of individual plants between years were r = 0.72 (p < 0.01) between 2012 and 2014, r = 0.75 (p < 0.01) between 2012 and 2013, and r = 0.755 (p < 0.01) between 2013 and 2014. Correlation between Yield and Biomass, were r = 0.65, 0.66 and 0.79 (p < 0.01 for all values) for 2012, 2013 and 2014, respectively. The relationship between Biomass and SYA of plant area was lower, with r = 0.26 (p = 0.05), r = 0.42 (p < 0.01), and r = 0.62 (p < 0.01) for 2012, 2013 and 2014, respectively. SYA was more strongly correlated to Yield with r values of 0.74, 0.70 and 0.82 (p < 0.01 for all values) for 2012, 2013 and 2014, respectively. Phenological development had inconsistent correlation values to Yield, with only 2012 showing significant r values. In 2012, date of the completion of anthesis was significantly correlated to Yield (r = 0.38, p < 0.01), while harvest date was negatively correlated to Yield (r = − 0.32, p < 0.01).
RYld data was assessed by comparing yearly RYld to overall RYld (three year means) (Figure 1). Three-year RYld was highly correlated with individual yearly RYld. Poor yielding individuals were consistently poor, however some higher yielding individuals showed greater variability. Year three (2014) had the widest range of RYld, with years one and two being similar in their ranges.
Coefficient of variation (CV) values were calculated across years for individual plants. RYld CV values for TLI materials were significantly lower than for Yield (p < 0.01) with means of 23.1 and 37.8, respectively, and most plants were under 30% for RYld, while USDA-GRIN materials showed a non-significant change between RYld (55.6) and Yield (63.6). For USDA-GRIN 68% and 52% of the Yield and RYld CV values were greater than 50%, while TLI materials had 87% and 58% of the RYld and Yield CV values below 40%, respectively (Figure 2).
Percent ergot (by weight) in five grams of seed was related to day of the year when the plants finished flowering. The relationship was best defined by a quadratic curve (highest R2), with early and late finishing plants having in general more ergot (Figure 3). Finishing flowering later showed the highest ergot levels.
3.2. Path-Coefficient Analysis
Path-coefficient analysis indicated that plant size (cm2) had a negative impact on Yield for the GRIN materials for 2013 and 2014 while plant size had a small positive effect on Yield for the TLI materials in 2013 only (Table 2). Values for the overall combined analysis showed plant area had no effect on Yield, Biomass was lower than for GRIN and higher than for TLI, and Heads had a lower impact than for the TLI and higher than for GRIN. Seed mass was the only parameter that showed a greater combined effect on Yield.
When the yield characteristics were looked at on a unit area of plant basis, BIOA had a significant positive direct effect on SYA for both sources and in all years (Table 3). SYA had significant direct effects in 2013 and 2014 for both sources, but not in 2012. Seed mass had a significant, positive direct effect on SYA for all years of harvest for the GRIN materials, however there was no significant direct effect of seed mass for the TLI materials in 2012. The combined analysis had similar results as indicated above for Yield.
3.3. Principal Component Analysis
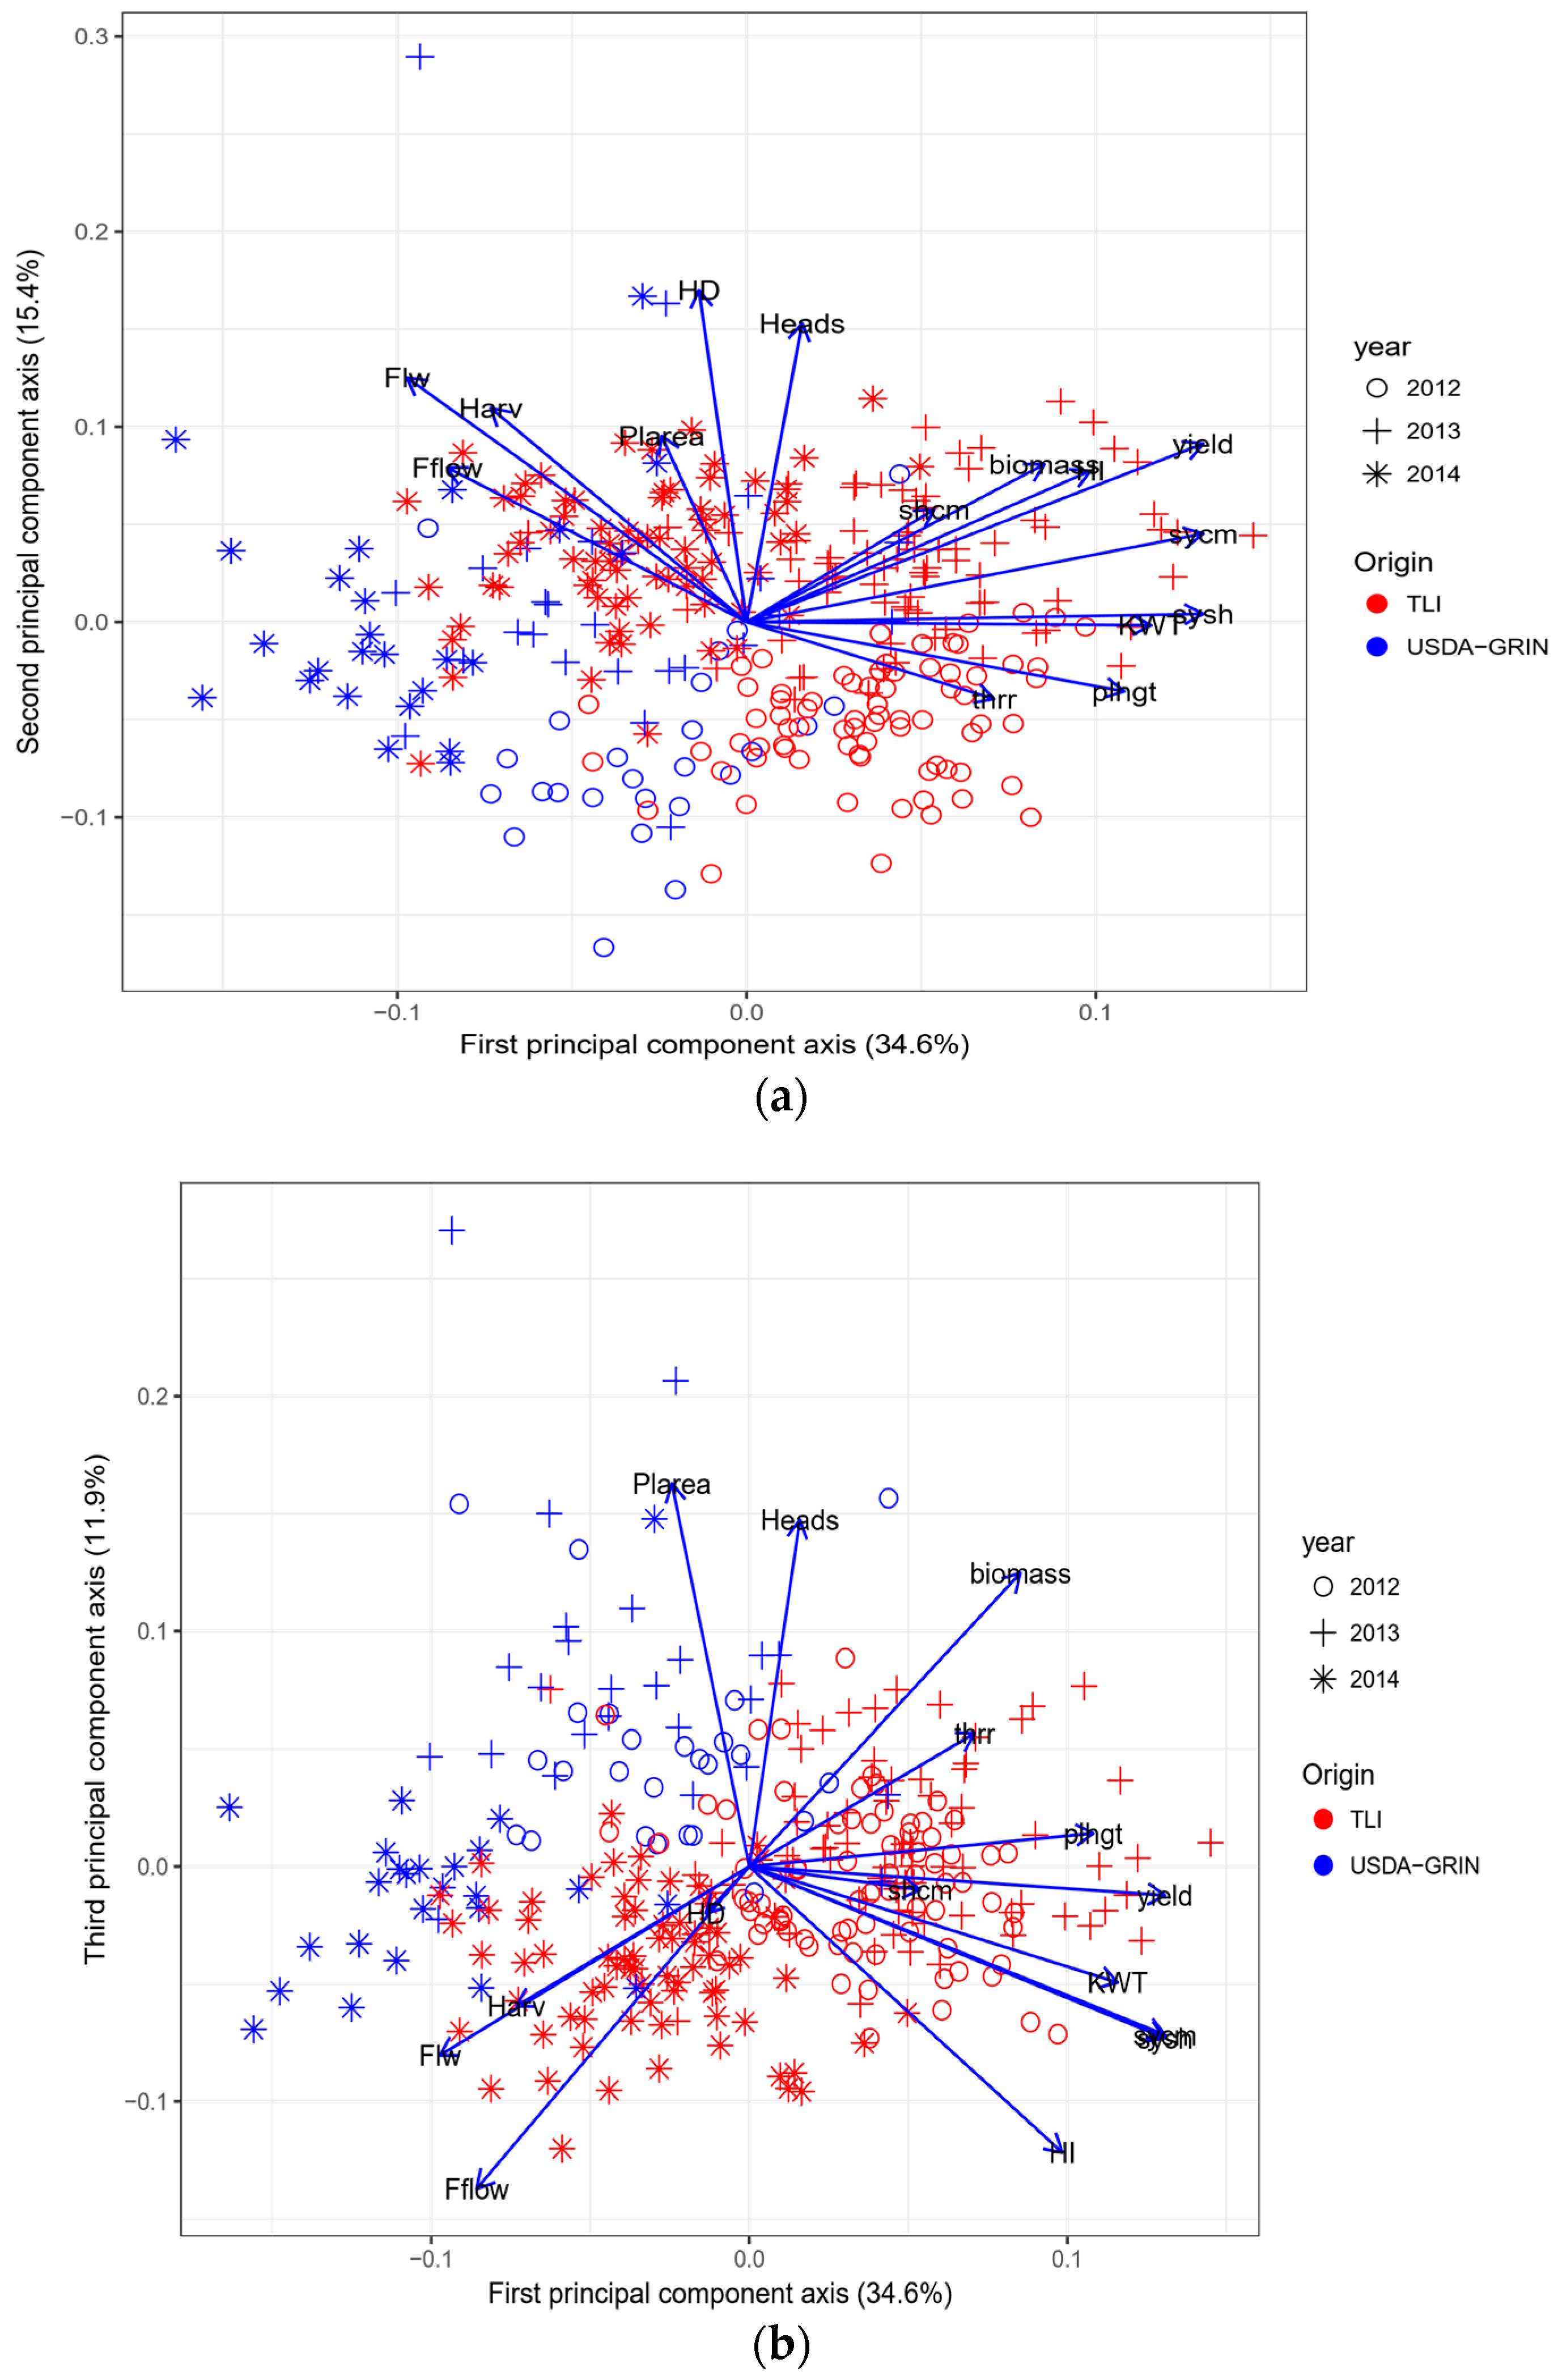
Principal component analysis indicated that there was a shift in the population from the GRIN accessions which were not selected for seed production versus the TLI selected materials (Figure 4a,b). In general, for the first and second principal components, GRIN accessions were on the negative axis of the figure and TLI were on the positive axis of the plot (Figure 4a). Years progressed from the negative axis through to the positive axis (Figure 4a). Variation was seen in each population with some overlap, both with some GRIN accessions showing TLI-like results and some TLI accessions showing GRIN-like results. For the plot of the first principal component versus the third, in general, TLI occupied the lower right part of the plot with GRIN in the upper left (Figure 4b). Years were relatively distinct, with 2012 in the lower left quadrant, 2013 in the upper right and 2014 in the lower right (Figure 4b).
4. Discussion
4.1. Effects of Selection
Potential for seed productivity has been selected for within the TLI materials when compared to the USDA-GRIN accessions under Manitoba growing conditions. Both principal component and path coefficient analysis indicate movement in the direction selection has taken the TLI materials. Not all TLI materials performed to a higher degree than GRIN accessions and some GRIN accessions were near the best TLI materials in performance.
The results for 2012, the first year of seed harvest, are different for the path coefficient analysis when compared to the other two years (Table 2 and Table 3). This is indicative of two factors. First, plants were spring transplanted and had a full season of growth entering into the reproductive induction processes [37] for this species. The following years were potentially constrained by the post-harvest/onset of winter period [21]. Second, temperatures were higher during flowering and seed set in 2012 and precipitation was lower.
Biomass was more strongly associated with Yield with the GRIN accessions and in general, a similar result was seen with BIOA with SYA, especially as the plants aged.
Principal component analysis showed that, in general, the two sources of germplasm were separated based on yield selection characteristics. Years performed differently, however the relative performance of the germplasm sources was consistent within years.
Relative seed yield plant−1 was highly correlated with yearly relative yield values unlike the results previously reported [1]. The previous results were for only the highest yielding individuals from the entire population. The inclusion of the poor performing individuals in this study is responsible for this discrepancy. Visual assessment of seed yield potential is capable of removing poor performers. Identification of high performing individuals across years is difficult [1]. This current study, although the materials in this current study are included in the previous report, indicates that poor performing individuals are identifiable in the first year of seed production. (Figure 1). This is contrary to the conclusion drawn with respect to the identification of high yielding individuals across years.
Other factors related to reproduction may also be indicated in the results. Selection in Kansas at TLI has been under summer stress conditions. Selection has been for a number of characteristics and has included earlier flowering to escape this summer stress, with an associated earlier winter dormancy cessation (earlier spring regrowth) and resulted in a loss of many of the materials at our site [1]. Additionally, flowering at our site has been predominantly in the mid-afternoon (14:00–16:00), which may also lead to enhanced stress on pollen survival. There may be greater potential for seed set in IWG if flowering can occur at a less stressful time during the day as has been suggested for rice [15].
Path coefficient analysis demonstrated that components of seed yield such as Heads had compensatory (negative) effect on other components such as seed mass. The direct effect of Heads, when Yield was high in 2013 in the combined analysis, was negative on seed mass while in 2012 and 2014, where Yield was lower, the direct effect was positive. A study on wheat reported that pre-anthesis ovary size and location of florets within a spikelet were predicative of successful seed development in the floret [38]. With 12 QTLs found to affect seed size in intermediate wheatgrass, selection for these has recently been suggested as a way forward for improving grain yield in intermediate wheatgrass [28].
4.2. Environmental Impacts
Seed yield across years may also be affected by the growth environment present in a given year. It was expected that 2012 would be a high seed yield year at our site due to the full year of growth in the establishment year and a relatively mild winter [1]. However, conditions present during flowering and seed development may also impact realized seed yield. Table 4 shows that the mean daily high temperature between 16 June and 1 August in 2012 was 2 °C higher than 2013 and 3.5 °C higher than 2014. This stress may have influenced seed productivity especially when it was coincident with low precipitation in July (Table 4). This heat and low moisture combination likely reduced seed yields in 2012. As previously reported [1], 2013 had the highest mean seed yield and the highest individual seed yields and SYA (Table 1). Field trials had yield decreasing as the stand aged [20]; however, this was not the general result on our space plants, with some plants retaining relatively high productivity. It should be noted that the TLI materials were more stable in their seed yield across years compared to the USDA-GRIN accessions, indicating that selection has increased yield stability across years on space-planted individuals.
4.3. Long-Term Yield Potential
A reduction in SYA was seen in 2014, below the previous two years’ means and range of values. Plant long-term yielding potential may be decreasing with age, or agronomic management deficiencies may be implicated here [39]. A rapid decrease in seed yield with stand age was reported in Minnesota with intermediate wheatgrass [20]. Seed yields of lines selected for seed production in Saskatchewan in the 1960s, showed comparative or sometimes higher three-year seed yields when compared to those reported recently [20]. Seed yield and its components have been shown to decrease over harvest years with the exception of seed weight in Bromus inermis L. [40]. Our results indicate that there may be other agronomic factors involved as second year yields were higher than first year yields in the current study. While the 2014 (third year) mean yield value was lower than the first year value (2012) the highest yielding plant in 2014 was greater than the highest yielding plant in 2012, indicating that selection for sustained seed productivity may be possible. On the negative side, as mentioned above, SYA decreased on both a mean and on the highest individual basis in 2014 versus 2012, indicating plants are potentially less thrifty as they age, at least seed productivity-wise. This may however be related to the growth environment as HI was not different (Table 1). A recent study indicates that intermediate wheatgrass has greater photosynthetic efficiency under cold stress conditions as plants age [41] lending hope to continued seed yield potentials as seed fields age.
The outcrossing nature of IWG and the potential for inbreeding depression [42] indicate that selection for diversity in origin and in uniformity of flowering times will be important in cultivar development. Ergot occurrence was generally enhanced when materials finished flowering later than the other materials, and to lesser extent, if flowering ended earlier (Figure 3). Mid-anthesis heads were found to be more productive than early or late anthesis heads in perennial ryegrass [32]. Pollen limitation is more likely on the extremes; therefore, uniformity of flowering times within a cultivar or population should be a priority in breeding efforts.
Ergot development will be influenced by both temperature and moisture conditions during flowering and seed fill and is considered problematic in wheat, especially in Manitoba [43]. While the mean for ergot occurrence was higher in 2014 (Table 1), the highest individual value was found in 2013, where nearly all recovered material was ergot (95%). Precipitation was higher and temperatures cooler in 2014, most likely enhancing the disease [44].
Therefore, early or late flowering individuals in self-incompatible species may be disadvantaged due to the lack of pollen availability, conferring enhanced fitness to individuals that flower in the middle of the anthesis spectrum. Also, early emerging heads have been found to have more spikelets and florets head−1 than late emerging heads [32], therefore later emerging heads may flower over a shorter period of time, also reducing potential pollen sources.
4.4. Does Seed Yield Plant−1 Equal Seed Yield under Cultivation?
Arguments have been put forward that for advancement under selection to be made, selection must take place without interplant competition [39]. However, intermediate wheatgrass selected for seed yield under relatively competitive conditions several years after space-plant establishment, realized a relatively good translation to seed production environments [21]. Our results indicate correlations between Yield and SYA were relatively high. However, field plantings of recent selections indicate that yield decreases rapidly after the first seed harvest year in field plantings [20]. Seed yield in red fescue (Festuca rubra L.) and perennial ryegrass fields have also shown decline over time [45]. However, in creeping bentgrass (Agrostis stolonifera L.) cultivar seed yields, fertile tiller density and seed mass were variable between cultivars across years [46].
Therefore, are we selecting for plant reproductive potential or population reproductive potential? Selection for Yield on space-planted materials should be tempered with consideration for plant size. Selection for forage production in perennial grasses has not been relatively successful [47] as there are many traits involved and these are affected by growth environment [48]. A recent report has shown some traits were correlated with the selection for forage production (e.g., leaf size) [23]. In a study of change in wheat cultivars and the resulting seed yield, it was found that smaller (by area) and lighter (by dry weight) flag leaves were associated with improved seed yields in soft red winter wheat cultivars released between 1919 and 2009 in the US [49]. Flag leaf area in our study was not correlated to Yield but was correlated to both head length and florets head−1 within GRIN accessions and flag leaf area was positively correlated to SYA across the combined materials (data not shown).
In what direction should breeding be headed? A correlation of r = 0.57 between forage yield and seed yield in space-planted polycross nurseries of intermediate wheatgrass has been reported [50]. The author noted selection for one trait should not decrease the other [50], similar to our results under space-planted conditions. Dry matter yield of intermediate wheatgrass has been demonstrated to be high in this region of North America [51] indicating a good potential for seed production in this region, however climatic influences may be important [1,20]. Selection for seed yield under field production conditions will be better served when there are strong relationships between characteristics selected for under spaced-plantings and field performance (i.e., in competitive stands) [20,21].
5. Conclusions
Progress has been made with respect to moving population parameters under selection for seed productivity in intermediate wheatgrass including Yield, HI and seed mass. Lack of field production-related measurements reduces the ability to effectively relate selection to performance. Agronomic interventions and their impact on seed production in production fields also are not well understood due to a lack of data. Compensatory effects are to be expected between seed yield components, especially as maximum yield potential is realized. Expressing yield on a unit area of plant cover may allow for greater accuracy in selecting for field production success. A greater understanding of the impact of competition on seed yield realization is required to correlate selection under space-plantings to enhanced production field seed yields.
Supplementary Materials
The following are available online at https://www.mdpi.com/2071-1050/10/3/688/s1.
Acknowledgements
We would like to thank the anonymous reviewers for their helpful comments on the manuscript. Funding for this research was provided by grants and aid from Manitoba Agriculture, Food and Rural Initiatives—ARDI and Growing Forward I & II, the Manitoba Wheat and Barley Growers Association, the University of Manitoba and the Department of Plant Science, University of Manitoba, Winnipeg, MB. We would like to thank all research technicians and summer research associates that participated in this program. We would like to thank the anonymous reviewers for the thoughtful suggestions and their critical review of this manuscript.
Author Contributions
Douglas J. Cattani conceived and designed the experiment; Douglas J. Cattani performed the xperiments; Douglas J. Cattani and Sean R. Asselin analyzed the data; Douglas J. Cattani and Sean R. Asselin wrote the paper.
Conflicts of Interest
The authors declare no conflict of interest.
References
- Cattani, D.J. Selection of a perennial grain for seed productivity across years: Intermediate wheatgrass as a test species. Can. J. Plant Sci. 2017, 97, 516–524. [Google Scholar] [CrossRef]
- Glover, J.D.; Culman, S.W.; Dupont, S.T.; Broussard, W.; Young, L.; Mangan, M.E.; Mai, J.G.; Crews, T.E.; DeHaan, L.R.; Buckley, D.H.; et al. Harvested perennial grasslands provide ecological benchmarks for agricultural sustainability. Agric. Ecol. Environ. 2010, 137, 3–12. [Google Scholar] [CrossRef]
- Crews, T.E.; Rumsey, B.E. What agriculture can learn from native ecosystems in building soil organic matter: A review. Sustainability 2017, 9, 578. [Google Scholar] [CrossRef]
- Bolinder, B.A.; Janzen, H.H.; Gregorich, E.G.; Angers, D.A.; Vanden, B. An approach for estimating net primary productivity and annual carbon inputs into soil for common agricultural crops in Canada. Agric. Ecol. Environ. 2007, 118, 29–42. [Google Scholar] [CrossRef]
- De Oliveira, G.; Brunsell, N.A.; Sutherlin, C.E.; Crews, T.E.; DeHaan, L.R. Energy, water and carbon exchange over a perennial Kernza wheatgrass crop. Agric. For. Meteorol. 2018, 249, 120–137. [Google Scholar] [CrossRef]
- Cox, T.S.; Glover, J.D.; van Tassel, D.L.; Cox, C.M.; DeHaan, L.R. Prospects for developing perennial grain crops. BioScience 2006, 56, 649–659. [Google Scholar] [CrossRef]
- Mottet, A.; de Haan, C.; Falcucci, A.; Tempio, G.; Opio, C.; Gerber, P. Livestock: On our plates or eating at our table? A new analysis of the feed/food debate. Glob. Food Secur. 2017, 14, 1–8. [Google Scholar] [CrossRef]
- Kulshreshthra, S.; Grant, C.; Amiro, B.; Ominski, K.; Legesse, G.; Alemu, A. Economic and greenhouse gas emission impacts of doubling of forage area in Manitoba, Canada. Can. J. Soil Sci. 2017, 97, 487–496. [Google Scholar]
- Maas, S.E.; Glenn, A.J.; Tenuta, M.; Amiro, B.D. Net CO2 and N2O exchange during perennial forage establishment in annual crop rotation in the Red River Valley, Manitoba. Can. J. Soil Sci. 2013, 93, 639–652. [Google Scholar] [CrossRef]
- Bell, L.W.; Harrison, M.T.; Kirkegaard, J.A. Dual-purpose cropping—Capitalising on potential grain crop grazing to enhance mixed-farming profitability. Crop Pasture Sci. 2015, 66, i–iv. [Google Scholar] [CrossRef]
- Dolferus, R. To grow or not to grow: A stressful decision for plants. Plant Sci. 2014, 229, 247–261. [Google Scholar] [CrossRef] [PubMed]
- Arguello, M.N.; Mason, R.E.; Roberts, T.L.; Subramanian, N.; Acuña, A.; Addison, C.K.; Lozada, D.N.; Miller, R.G.; Gbur, E. Performance of soft red winter wheat subjected to field soil waterlogging: Grain yield and yield components. Field Crops Res. 2016, 194, 57–64. [Google Scholar] [CrossRef]
- Labra, M.H.; Struik, P.C.; Evers, J.B.; Calderini, D.F. Plasticity of seed weight compensates reductions in seed number of oilseed rape in response to shading at flowering. Eur. J. Agron. 2017, 84, 113–124. [Google Scholar] [CrossRef]
- Mariniello, P. Influence of agronomic factors on the relationship between forage production and seed yield in perennial forage grasses and legumes in a Mediterranean environment. Agronomie 1998, 18, 591–601. [Google Scholar] [CrossRef]
- Zhang, M.; Zhang, H.; Dai, D.; Li, X.; Chen, J.; Bao, J.; Ma, L. Identification of QTL’s for rice flower opening time in two environments. Euphytica 2017, 213, 181–192. [Google Scholar] [CrossRef]
- Wang, H.; Qin, F. Genome-wide association study reveals natural variations contributing to drought resistance in crops. Front. Plant Sci. 2017, 8. [Google Scholar] [CrossRef] [PubMed]
- Herben, T.; Šerá, B.; Klimešová, J. Clonal growth and sexual reproduction: Tradeoffs and environmental constraints. Oikos 2015, 124, 469–476. [Google Scholar] [CrossRef]
- Ehrlén, J. Selection on flowering time in a life cycle context. Oikos 2015, 124, 92–101. [Google Scholar] [CrossRef]
- Cattani, D.J.; Asselin, S.R. Extending the growing season: Forage seed production and perennial grains. Can. J. Plant Sci. 2017. [Google Scholar] [CrossRef]
- Jungers, J.M.; DeHaan, L.R.; Betts, K.J.; Sheaffer, C.C.; Wyse, D.L. Intermediate wheatgrass grain and forage yield responses to nitrogen fertilization. Agron. J. 2017, 109, 1–11. [Google Scholar] [CrossRef]
- Knowles, R.P. Recurrent mass selection for improved seed yields in intermediate wheatgrass. Crop Sci. 1977, 17, 51–54. [Google Scholar] [CrossRef]
- Wilkins, P.W.; Humphreys, M.O. Progress in breeding perennial forage grasses for temperate agriculture. J. Agric. Sci. 2003, 140, 129–150. [Google Scholar] [CrossRef]
- Prieto, I.; Litrico, I.; Violle, C.; Barre, P. Five species, many genotypes, broad phenotypic diversity: When agronomy meets functional ecology. Am. J. Bot. 2017, 104, 62–71. [Google Scholar] [CrossRef] [PubMed]
- Dewey, D.R.; Lu, K.H. A correlation and path-coefficient analysis of components of crested wheatgrass seed production. Agron. J. 1959, 51, 515–518. [Google Scholar] [CrossRef]
- Doffing, S.M.; Knight, C.W. Alternative model for path analysis of small-grain yield. Crop Sci. 1992, 32, 487–489. [Google Scholar] [CrossRef]
- Abel, S.; Gislum, R.; Boelt, B. Path and correlation analysis of perennial ryegrass (Lolium perenne L.) seed yield. J. Agron. Crop Sci. 2017, 203. [Google Scholar] [CrossRef]
- Yamasaki, Y.; Gao, F.; Jordan, M.C.; Ayele, B.T. Seed maturation associated transcriptional programs and regulatory networks underlying genotypic difference in seed dormancy and size/weight in wheat (Triticum aestivum L.). BMC Plant Biol. 2017, 17, 154. [Google Scholar] [CrossRef] [PubMed]
- Zhang, X.; Larson, S.R.; Gao, L.; Teh, S.L.; DeHaan, L.R.; Fraser, M.; Sallam, A.; Kantarski, T.; Frels, K.; Poland, J.; et al. Uncovering the genetic architecture of seed weight and size in intermediate wheatgrass through linkage and association mapping. Plant Genome 2017, 10. [Google Scholar] [CrossRef] [PubMed]
- Luo, Z.; Wang, M.; Long, Y.; Huang, Y.; Shi, L.; Zhang, C.; Liu, X.; Fritt, B.D.L.; Xiang, J.; Mason, A.S.; et al. Incorporating pleiotropic quantitative trait loci in dissection of complex traits: Seed yield in rapeseed as an example. Theor. Appl. Genet. 2017, 130, 1569–1585. [Google Scholar] [CrossRef] [PubMed]
- Wang, Y.; Zhang, J.; LaMontagne, J.M.; Lin, F.; Ye, J.; Yuan, Z.; Wang, X.; Hao, Z. Variation and synchrony of tree species mast seeding in an old growth temperate forest. J. Veg. Sci. 2017, 28, 413–423. [Google Scholar] [CrossRef]
- Ehrlén, J. Proximate limits to seed production in a herbaceous perennial legume, Lathryus vernus. Ecology 1992, 73, 1820–1831. [Google Scholar] [CrossRef]
- Hill, M.J.; Watkin, B.R. Seed production studies on perennial ryegrass, timothy and prairie grass 1. Effect of tiller age on tiller survival, ear emergence and seedhead components. J. Br. Grassl. Soc. 1975, 30, 63–71. [Google Scholar] [CrossRef]
- Hill, M.J.; Watkin, B.R. Seed production studies on perennial ryegrass, timothy and prairie grass 2. Changes in physiological components during seed development and time and method of harvesting for maximum seed yield. J. Br. Grassl Soc. 1975, 30, 131–140. [Google Scholar] [CrossRef]
- Wang, J.; Li, X.; Gao, S.; Li, Z.; Mu, C. Impacts of fall nitrogen application on seed production in Leymus chinensis, a rhizomatous perennial grass. Agron. J. 2013, 105, 1378–1384. [Google Scholar] [CrossRef]
- Berdahl, J.D.; Frank, A.B. Seed maturity in four cool-season forage grasses. Agron. J. 1998, 90, 483–488. [Google Scholar] [CrossRef]
- R Core Team. R: A Language and Environment for Statistical Computing; R Foundation for Statistical Computing: Vienna, Austria, 2015. [Google Scholar]
- Heide, O.M. Control of flowering and reproduction in temperate grasses. New Phytol. 1994, 128, 347–362. [Google Scholar] [CrossRef]
- Guo, Z.; Slafer, G.A.; Schnurbusch, T. Genotypic variation in spike fertility traits and ovary size as determinants of florets and grain survival rate in wheat. J. Exp. Bot. 2016, 67, 4221–4230. [Google Scholar] [CrossRef] [PubMed]
- Van Tassel, D.L.; DeHaan, L.R.; Cox, T.S. Missing domesticated plant forms: Can artificial selection fill the gap? Evol. Appl. 2010, 3, 434–452. [Google Scholar] [CrossRef] [PubMed]
- Wang, Q.; Cui, J.; Wang, X.; Zhang, T.; Zhou, H.; Hu, T.; Han, J. Algorithmic models of seed yield and its components in smooth bromegrass (Bromus inermis L.) via large sample size under field conditions. Euphytica 2012, 185, 363–375. [Google Scholar] [CrossRef]
- Jaikumar, N.S.; Snapp, S.S.; Sharkey, T.D. Older Thinopyrum intermedium (Poaceae) plants exhibit superior photosynthetic tolerance to cold stress and greater increases in two photosynthetic enzymes under freezing stress compared with young plants. J. Exp. Bot. 2016, 67, 4743–4753. [Google Scholar] [CrossRef]
- Zhang, X.; Sallam, A.; Gao, L.; Kantarski, T.; Poland, J.; DeHaan, L.R.; Wyse, D.L.; Anderson, J.A. Establishment and optimization of genomic selection to accelerate the domestication and improvement of intermediate wheatgrass. Plant Genome 2016, 9. [Google Scholar] [CrossRef] [PubMed]
- Menzies, J.G.; Turkington, T.K. An overview of the ergot (Claviceps purpurea) issue in western Canada: Challenges and solutions. Can. J. Plant Pathol. 2015, 37, 40–51. [Google Scholar] [CrossRef]
- Dung, J.K.S.; Alderman, S.C.; Kaur, N.; Walenta, D.L.; Frost, K.E.; Hamm, P.B. Identification of environmental factors related to Claviceps purpurea ascospore production in perennial ryegrass seed fields and development of predictive models. Plant Dis. 2017, 101, 895–906. [Google Scholar] [CrossRef]
- Deleuran, L.C.; Kristensen, K.; Gislum, R.; Boelt, B. Optimizing the number of consecutive seed harvests in red fescue (Festuca rubra L.) and perennial ryegrass (Lolium perenne L.) for yield, yield components and economic return. Acta Agric. Scand. Sect. B Soil Plant Sci. 2013, 63, 1–10. [Google Scholar]
- Cattani, D.J.; Smith, S.R., Jr.; Miller, P.R.; Feindel, D.E.; Gjuric, R. Seed yield and yield components of creeping bentgrass cultivars. Can. J. Plant Sci. 2004, 84, 117–124. [Google Scholar] [CrossRef]
- Hayward, M.D.; Vivero, J.L. Selection for yield in Lolium perenne. II. Performance of space plant selections under competitive conditions. Euphytica 1984, 33, 787–800. [Google Scholar] [CrossRef]
- Casler, M.D.; Brummer, E.C. Theoretical expected genetic gains for among-and-within-family selection methods in perennial forage crops. Crop Sci. 2008, 48, 890–902. [Google Scholar] [CrossRef]
- Balota, M.; Green, A.J.; Griffey, C.A.; Pitman, R.; Thomason, W. Genetic gains from physiological traits associated with yield in soft red winter wheat in the Eastern United States from 1919 to 2009. Eur. J. Agron. 2017, 84, 76–83. [Google Scholar] [CrossRef]
- Lawrence, T. Association of some plant characteristics in intermediate wheatgrass. Can. J. Plant Sci. 1962, 42, 276–279. [Google Scholar] [CrossRef]
- Schmer, M.R.; Hendrickson, J.R.; Liebig, M.A.; Johnson, H.A. Perennial plant establishment and productivity can be influenced by previous annual crops. Agron. J. 2017, 109, 1423–1432. [Google Scholar] [CrossRef]
Figure 1.
Linear regression and equations of relative seed yield plant−1 and mean relative seed yield plant−1 for 2012, 2013 and 2014.
Figure 1.
Linear regression and equations of relative seed yield plant−1 and mean relative seed yield plant−1 for 2012, 2013 and 2014.
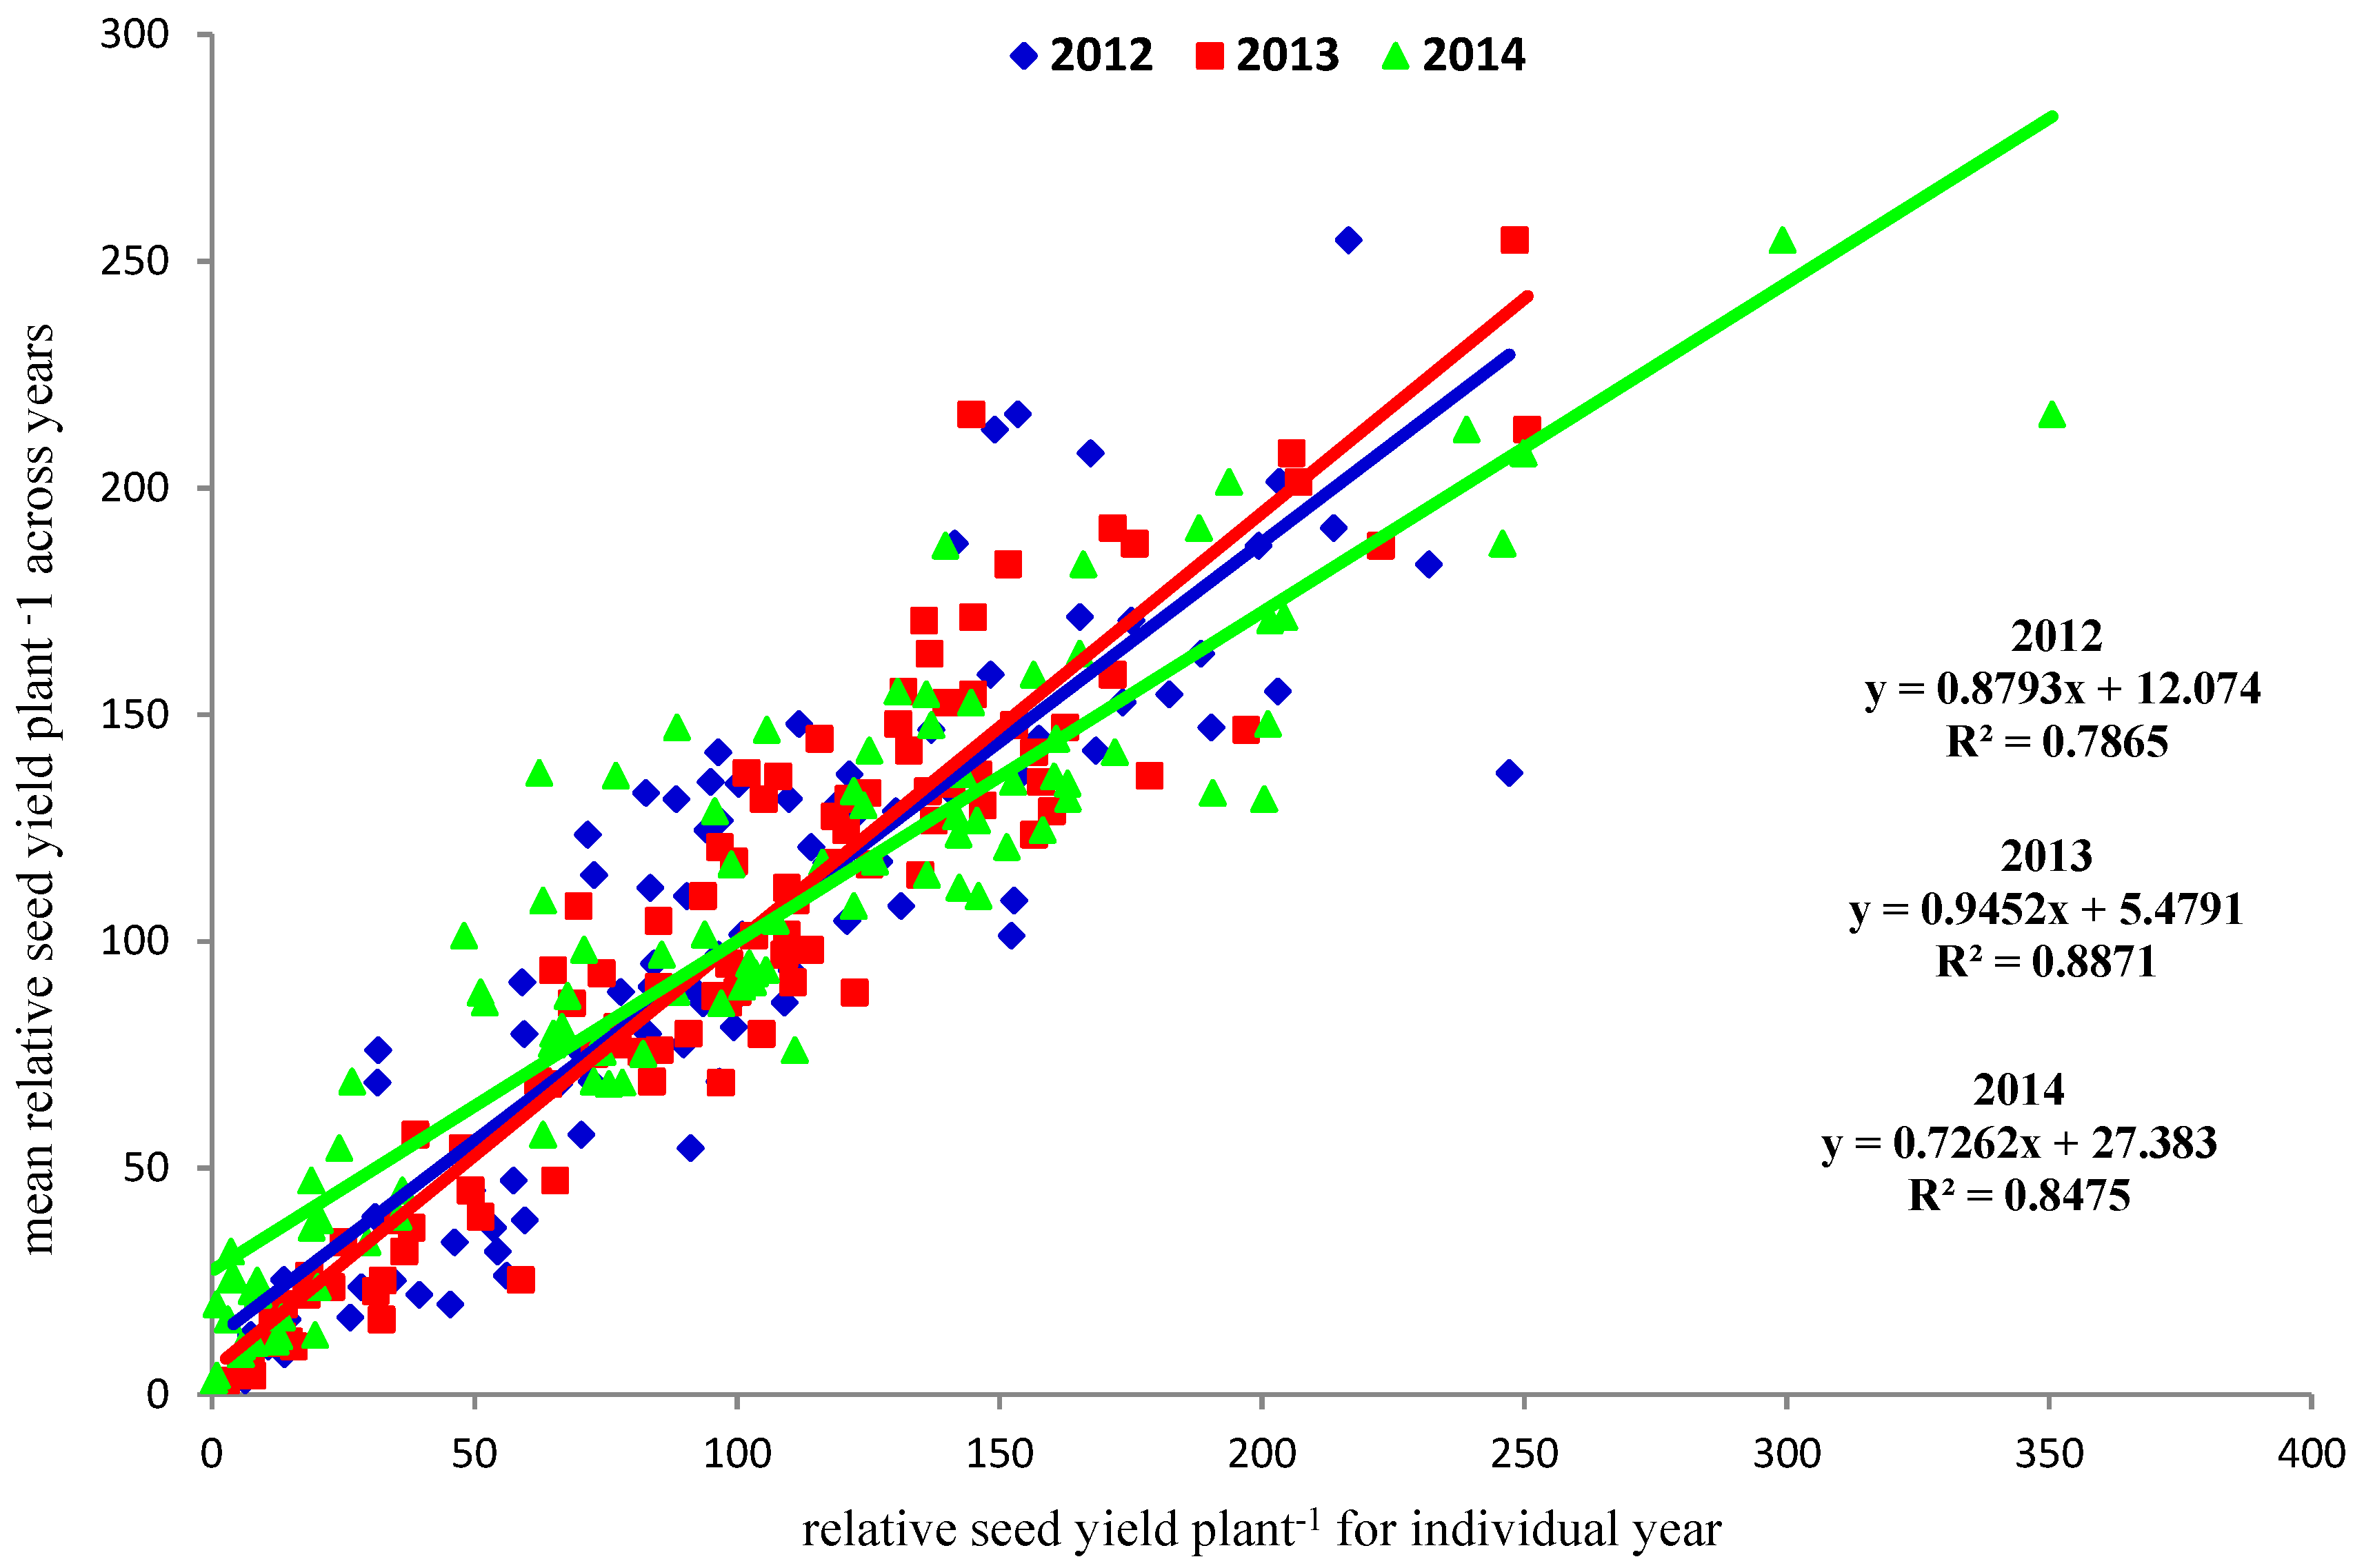
Figure 2.
Distribution of coefficient of variation values for Yield and relative seed yield for; (a) USDA-Germplasm Resources Information Network (GRIN) and (b) The Land Institute (TLI) materials.
Figure 2.
Distribution of coefficient of variation values for Yield and relative seed yield for; (a) USDA-Germplasm Resources Information Network (GRIN) and (b) The Land Institute (TLI) materials.
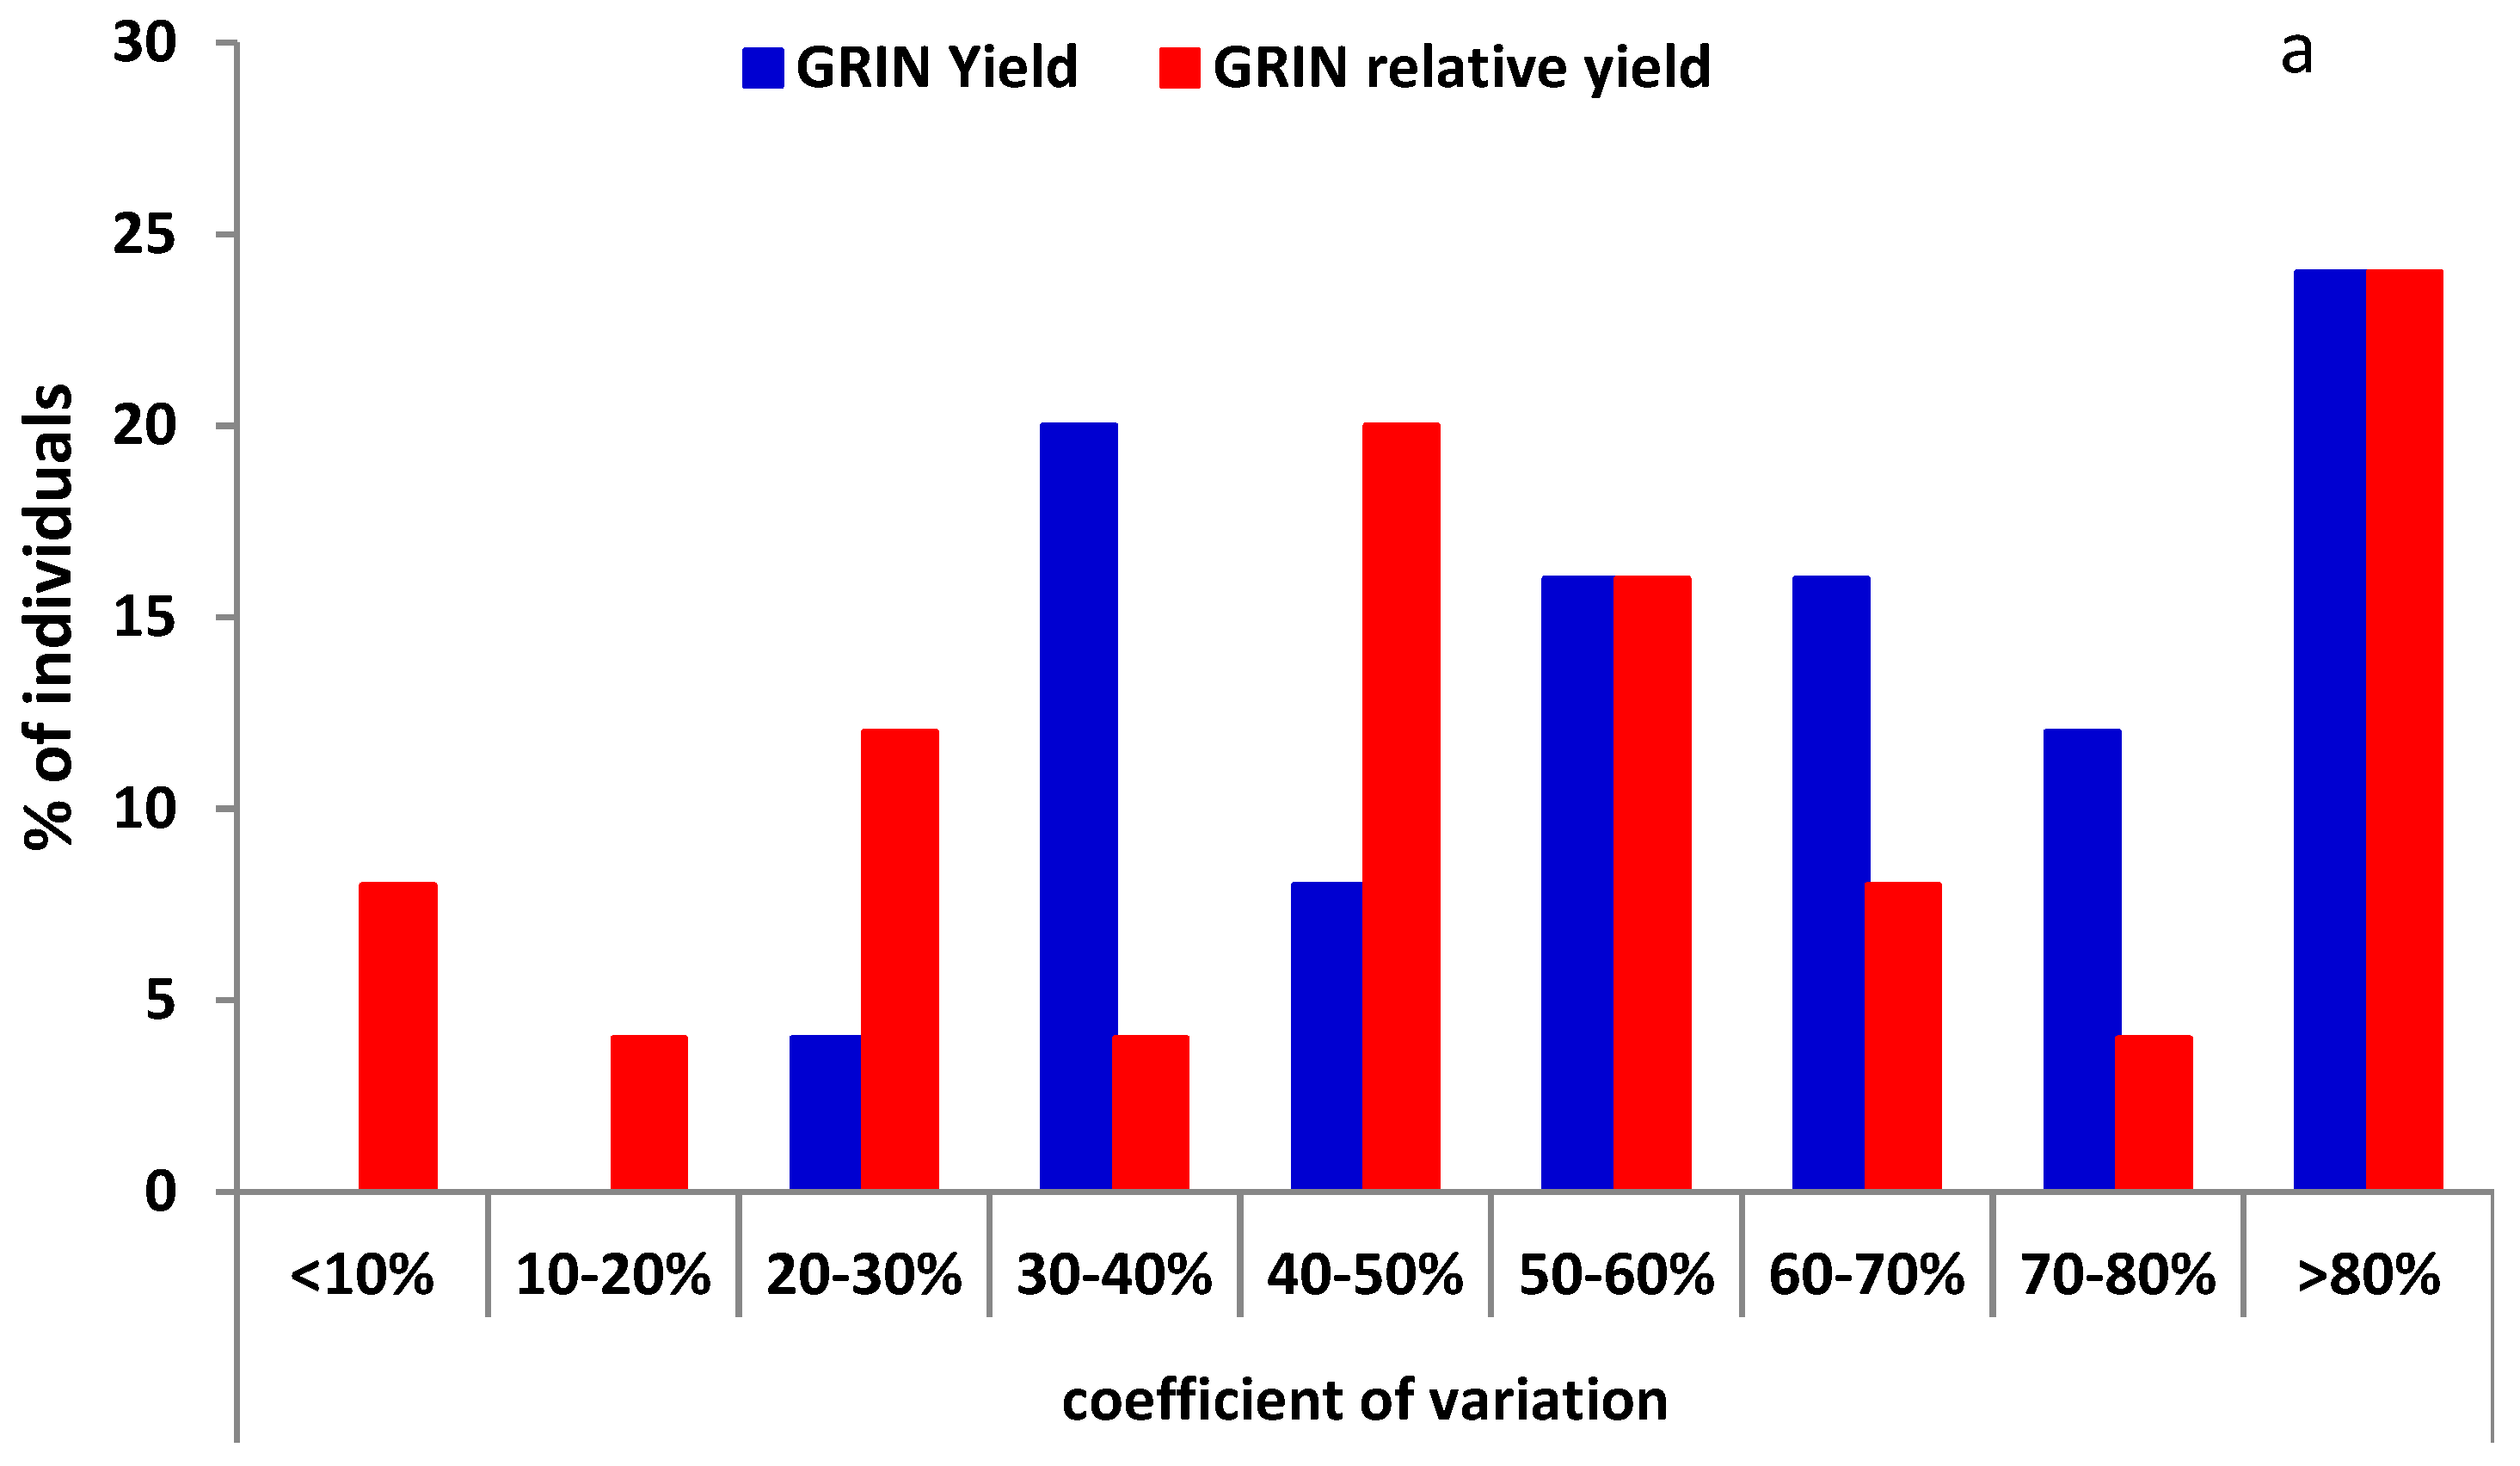
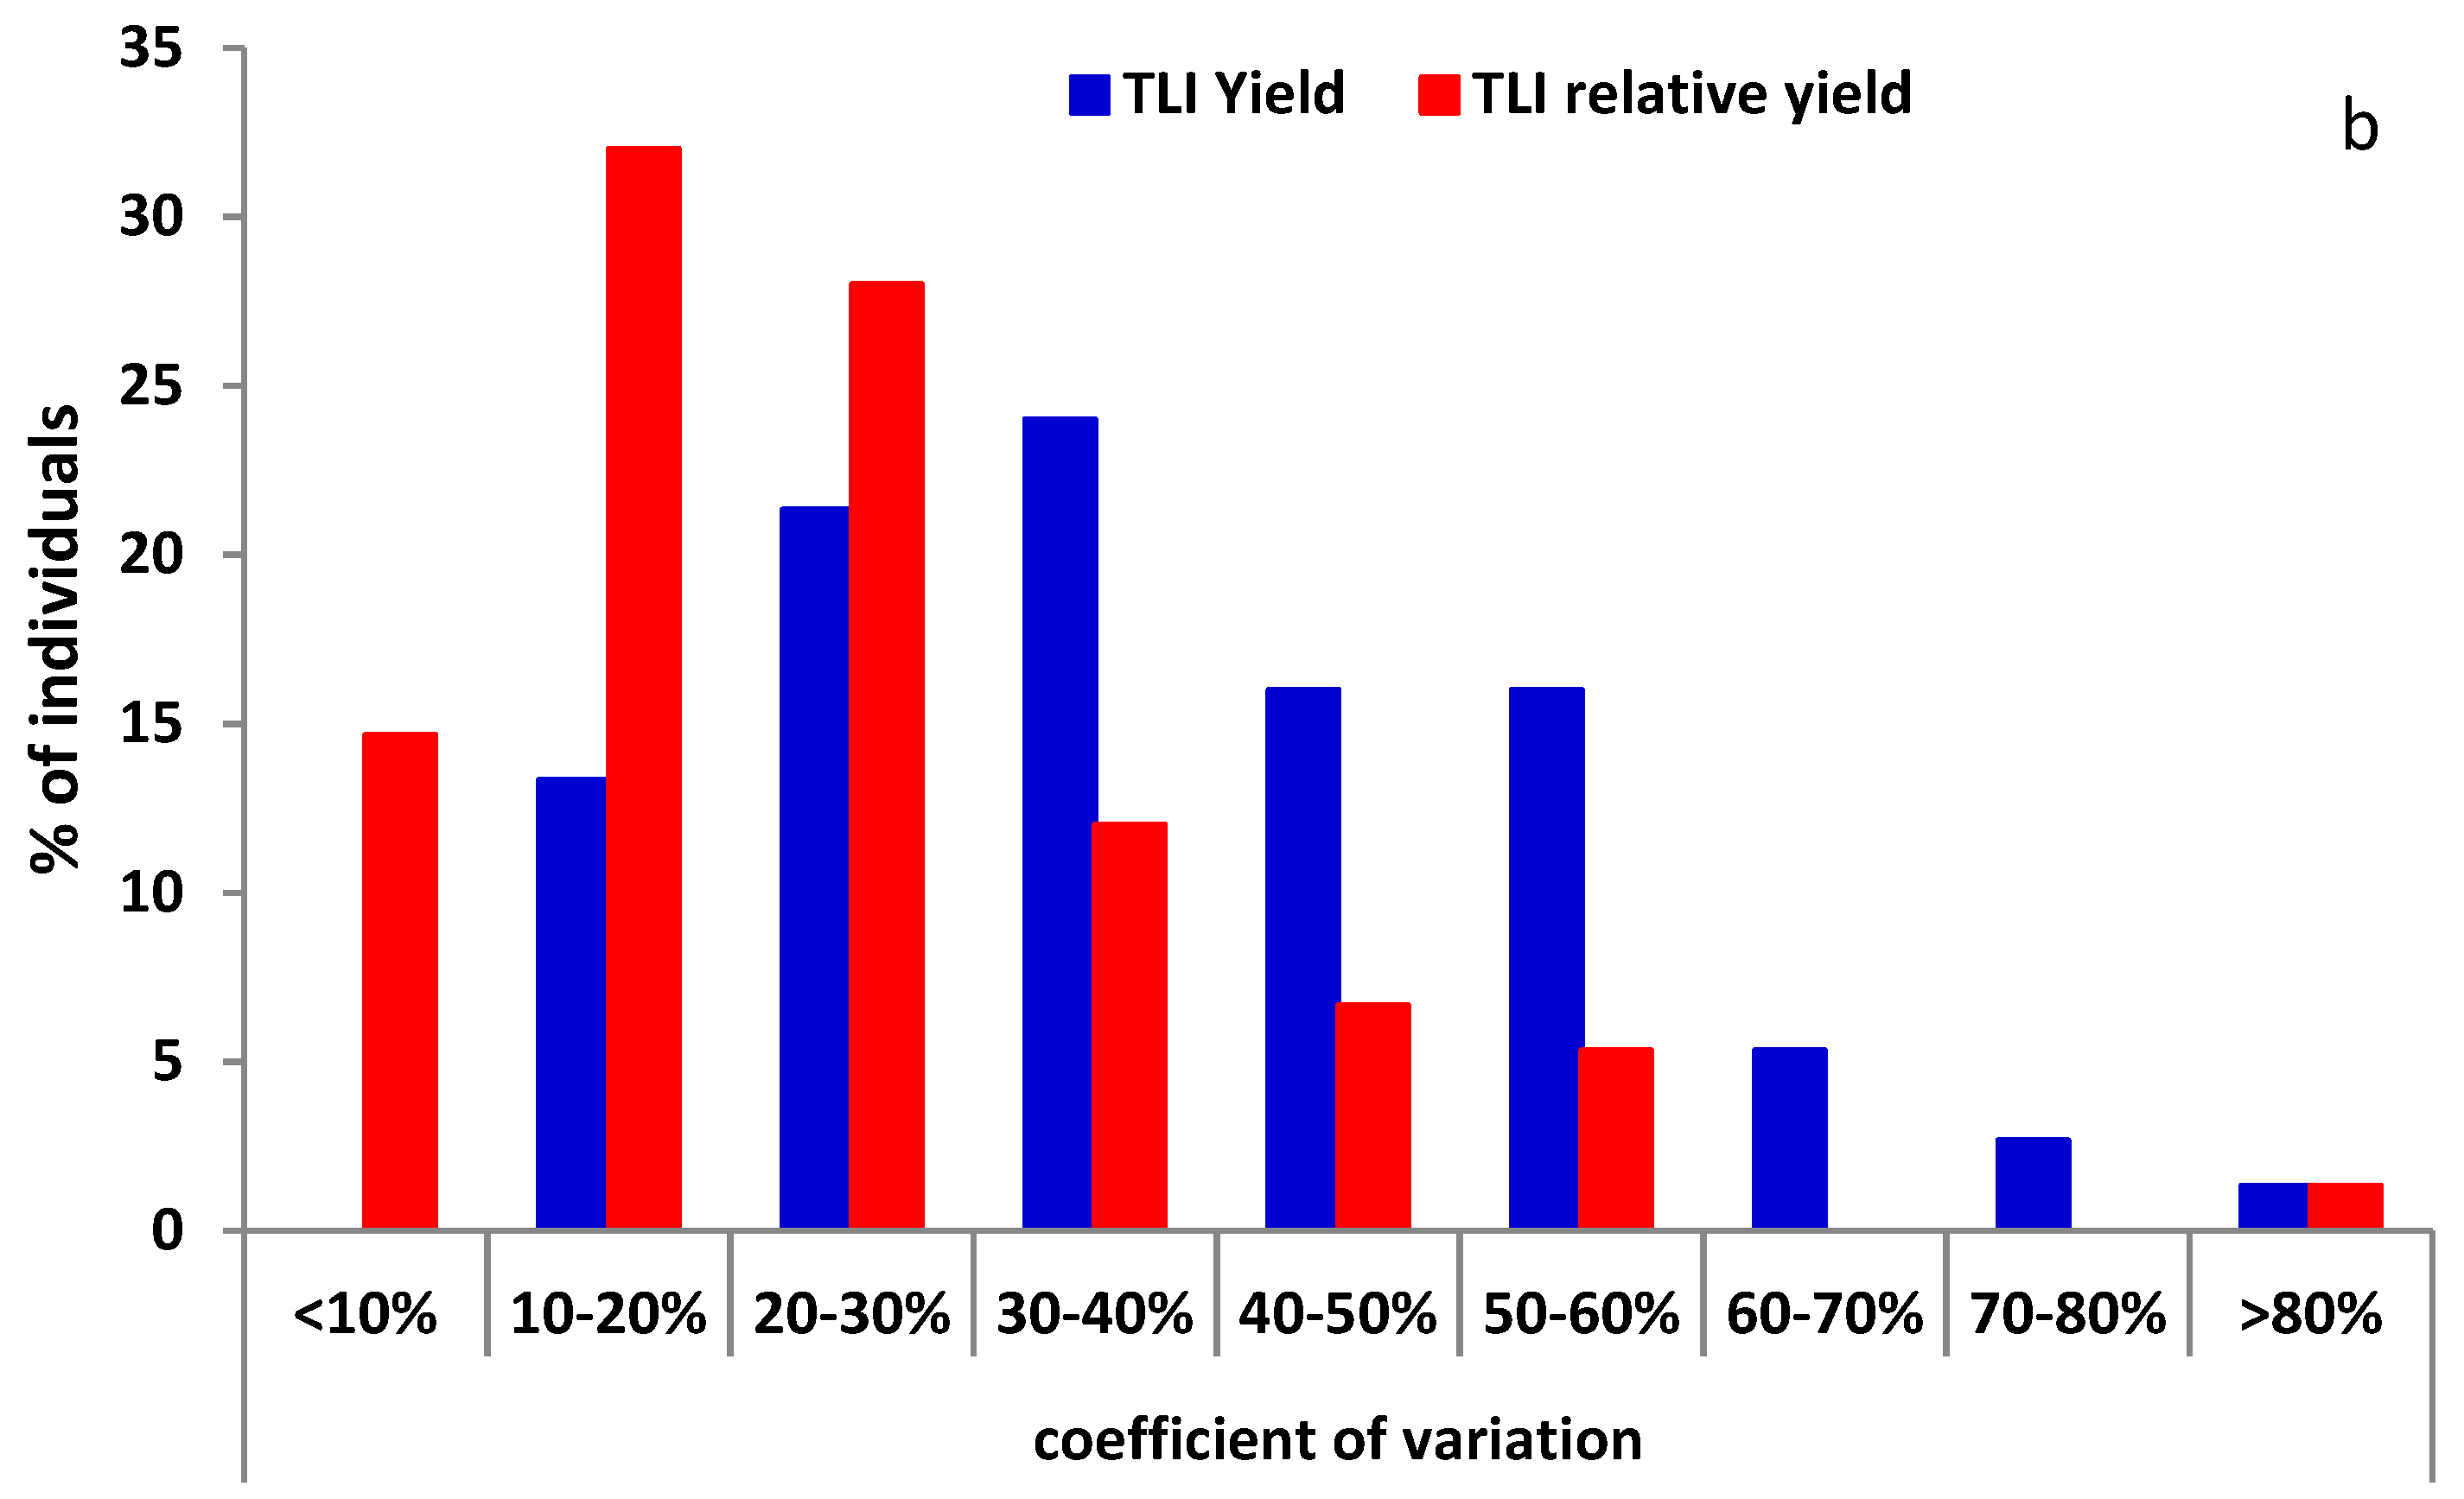
Figure 3.
Quadratic regression of percent ergot in five grams of seed on the date of the finish of flowering.
Figure 3.
Quadratic regression of percent ergot in five grams of seed on the date of the finish of flowering.
Figure 4.
Principal component analysis for The Land Institute materials (TLI, filled circles) and USDA-GRIN accessions (filled triangles) for 2012, 2013 and 2014: (a) first and second principal component axis; (b) first and third principal component axis.
Figure 4.
Principal component analysis for The Land Institute materials (TLI, filled circles) and USDA-GRIN accessions (filled triangles) for 2012, 2013 and 2014: (a) first and second principal component axis; (b) first and third principal component axis.


Table 1.
Mean value, standard deviation and range of values for phenological and phenotypic characteristics of the 100 plants of intermediate wheatgrass harvest in 2012, 2013 and 2014 at Carman, MB.
Table 1.
Mean value, standard deviation and range of values for phenological and phenotypic characteristics of the 100 plants of intermediate wheatgrass harvest in 2012, 2013 and 2014 at Carman, MB.
| Characteristic | Year | N | Mean | Std. Dev. | Min. | Max. |
|---|---|---|---|---|---|---|
| Heading date | 2012 | 100 | 170.2 | 3.5 | 159 | 177 |
| 2013 | 100 | 176.5 | 2.6 | 168 | 183 | |
| 2014 | 100 | 175.5 | 2.5 | 170 | 181 | |
| Flowering date | 2012 | 100 | 184.0 | 1.8 | 181 | 188 |
| 2013 | 100 | 186.1 | 2.0 | 183 | 192 | |
| 2014 | 100 | 190.5 | 3.0 | 188 | 198 | |
| Finished flowering date | 2012 | 100 | 198.6 | 3.5 | 192 | 205 |
| 2013 | 100 | 196.3 | 3.7 | 192 | 210 | |
| 2014 | 100 | 209.9 | 3.1 | 202 | 219 | |
| Harvest date | 2012 | 100 | 228.0 | 1.9 | 223 | 235 |
| 2013 | 100 | 229.4 | 5.9 | 220 | 238 | |
| 2014 | 100 | 233.9 | 4.23 | 227 | 239 | |
| Seedheads plant−1 | 2012 | 100 | 154.9 | 48.2 | 60 | 424 |
| 2013 | 100 | 277.6 | 122.3 | 69 | 1230 | |
| 2014 | 100 | 196.0 | 75.1 | 6 | 353 | |
| Seed yield plant−1 | 2012 | 100 | 49.33 | 28.3 | 2.00 | 121.92 |
| 2013 | 100 | 70.33 | 39.9 | 1.86 | 176.23 | |
| 2014 | 100 | 36.81 | 26.6 | 0.14 | 129.04 | |
| Harvest index | 2012 | 99 | 9.04 | 4.3 | 0.48 | 21.75 |
| 2013 | 100 | 9.85 | 4.7 | 1.04 | 24.82 | |
| 2014 | 100 | 9.67 | 5.6 | 0.19 | 23.06 | |
| thousand kernel weight (g) | 2012 | 100 | 7.43 | 1.5 | 3.56 | 10.59 |
| 2013 | 100 | 7.19 | 1.5 | 1.79 | 11.03 | |
| 2014 | 100 | 5.98 | 1.4 | 2.00 | 9.33 | |
| biomass plant (g) | 2012 | 99 | 532.9 | 192.5 | 110.9 | 1361 |
| 2013 | 100 | 688.8 | 223.7 | 141.2 | 1184 | |
| 2014 | 100 | 369.2 | 338.0 | 18.7 | 3464 | |
| Plant area (cm−2) | 2012 | 100 | 1007 | 547.9 | 156 | 3782 |
| 2013 | 100 | 1115 | 651.6 | 196 | 4761 | |
| 2014 | 100 | 1067 | 377.9 | 272 | 2989 | |
| seed yield cm−2 (mg) | 2012 | 100 | 55.9 | 34.2 | 1.8 | 168.7 |
| 2013 | 100 | 77.8 | 48.4 | 3.9 | 215.1 | |
| 2014 | 100 | 36.1 | 26.1 | 0.2 | 137.6 | |
| seedheads m−2 | 2012 | 100 | 1762 | 646.4 | 39.2 | 384.0 |
| 2013 | 100 | 2857 | 1134.0 | 85.1 | 762.3 | |
| 2014 | 100 | 1933 | 802.0 | 12.4 | 556.5 | |
| seed yield seedhead−1 (mg) | 2012 | 100 | 328.2 | 175.8 | 12.7 | 887.5 |
| 2013 | 100 | 274.1 | 156.1 | 15.3 | 932.5 | |
| 2014 | 100 | 173.9 | 106.4 | 8.8 | 512.1 | |
| threshing rating | 2012 | 100 | 5.7 | 1.4 | 3 | 9 |
| 2013 | 93 | 6.6 | 2.1 | 2 | 10 | |
| 2014 | 100 | 4.2 | 2.3 | 1 | 9 | |
| plant height (cm) | 2012 | 99 | 151.6 | 21.1 | 95 | 198 |
| 2013 | 100 | 142.2 | 19.8 | 92 | 180 | |
| 2014 | 100 | 129.5 | 16.7 | 64 | 170.5 | |
| florets spikelet−1 | 2013 | 100 | 6.6 | 1.10 | 4.25 | 9.83 |
| 2014 | 98 | 6.3 | 1.16 | 2.90 | 9.67 | |
| florets head−1 | 2013 | 100 | 126.5 | 34.1 | 39.7 | 232.7 |
| 2014 | 98 | 112.2 | 33.3 | 29.8 | 199.9 | |
| % ergot in five grams of seed | 2013 | 100 | 3.26 | 13.12 | 0.002 | 95.53 |
| 2014 | 100 | 5.31 | 11.74 | 0.002 | 71.43 | |
| flag leaf area (cm−2) | 2013 | 100 | 16.64 | 6.81 | 0.80 | 35.30 |
| 2014 | 98 | 7.26 | 3.88 | 0.94 | 17.15 |
Table 2.
Path-coefficient analysis on a seed yield plant−1 (Yield) basis with direct effects of variables biomass, heads and seed mass (SM) on Yield and of SM on heads for USDA-GRIN, The Land Institute and a combined analysis.
Table 2.
Path-coefficient analysis on a seed yield plant−1 (Yield) basis with direct effects of variables biomass, heads and seed mass (SM) on Yield and of SM on heads for USDA-GRIN, The Land Institute and a combined analysis.
| Direct on Yield | Direct on Heads | Direct on Yield | Direct on Heads | Direct on Yield | Direct on Heads | |
|---|---|---|---|---|---|---|
| 2012 | 2013 | 2014 | ||||
| GRIN Accessions | ||||||
| Area | −0.050 | −0.383 * | −0.583 ** | |||
| Biomass | 0.899 ** | 0.910 ** | 0.952 ** | |||
| Heads | −0.131 | 0.098 | 0.229 * | |||
| SM | 0.068 | −0.063 | 0.209 | −0.220 | 0.166 | 0.387 * |
| TLI Accessions | ||||||
| Area | 0.008 | 0.277 * | 0.150 | |||
| Biomass | 0.342 ** | 0.319 ** | 0.501 ** | |||
| Hds pl−1 | 0.324 ** | 0.327 ** | 0.283 ** | |||
| SM | 0.161 | −0.144 | 0.339 ** | −0.170 | 0.273 ** | −0.097 |
| Combined analysis | ||||||
| Area | −0.069 | −0.086 | −0.020 | |||
| Biomass | 0.643 ** | 0.546 ** | 0.515 ** | |||
| Hds pl−1 | −0.165 | 0.025 | 0.250 ** | |||
| SM | 0.266 ** | 0.231 * | 0.376 ** | −0.325 ** | 0.323 ** | 0.293 ** |
*, ** indicate significance at p = 0.05 and < 0.01 levels, respectively.
Table 3.
Path-coefficient analysis on a seed yield cm−2 of plant (SYA) with direct effects of variables, biomass cm−2 (BIOA), Heads cm−2 (SHA) and seed mass (SM) on SYA and of SM on SHA for USDA-GRIN, The Land Institute and a combined analysis.
Table 3.
Path-coefficient analysis on a seed yield cm−2 of plant (SYA) with direct effects of variables, biomass cm−2 (BIOA), Heads cm−2 (SHA) and seed mass (SM) on SYA and of SM on SHA for USDA-GRIN, The Land Institute and a combined analysis.
| Direct on SYA | Direct on SHA | Direct on SYA | Direct on SHA | Direct on SYA | Direct on SHA | |
|---|---|---|---|---|---|---|
| 2012 | 2013 | 2014 | ||||
| GRIN Accessions | ||||||
| BIOA | 0.479 ** | 0.707 ** | 0.534 ** | |||
| SHA | 0.103 | 0.120 | 0.364 * | |||
| SM | 0.345 * | −0.244 | 0.319 ** | −0.112 | 0.227 ** | 0.315 |
| TLI Accessions | ||||||
| BIOA | 0.574 ** | 0.409 ** | 0.314 ** | |||
| SHA | 0.173 | 0.434 ** | 0.500 ** | |||
| SM | 0.065 | −0.223 * | 0.353 ** | −0.039 | 0.329 ** | −0.024 |
| Combined analysis | ||||||
| BIOA | 0.657 ** | 0.493 ** | 0.321 ** | |||
| SHA | 0.040 | 0.241 ** | 0.407 ** | |||
| SM | 0.215 ** | −0.184 | 0.451 ** | 0.059 | 0.371 ** | 0.358 ** |
*, ** indicate significance at p = 0.05 and < 0.01 levels, respectively.
Table 4.
Mean daily maximum (TMax), minimum (TMin) and mean temperature (TAvg) in °C, total precipitation (PPT), growing degree days (base T = 5 °C), corn heat units (CHU) and days of precipitation from 16 June through 31 July and the number of days of precipitation in June and the split in precipitation between 16–30 June and July for 2012, 2013 and 2104 at Carman MB.
| Year | TMax | TMin | TAvg | PPT | GDD | CHU | PPT Days | PPT Days in June | June/July PPT |
|---|---|---|---|---|---|---|---|---|---|
| °C | °C | °C | (mm) | (mm) | |||||
| 2012 | 27.3 | 13.7 | 20.5 | 75.2 | 728.5 | 1108.6 | 14.0 | 8.0 | 47.4/27.8 |
| 2013 | 25.2 | 12.9 | 19.1 | 92.2 | 662.0 | 1064.1 | 20.0 | 4.0 | 43.0/49.2 |
| 2014 | 23.8 | 11.9 | 17.9 | 133.2 | 604.7 | 987.2 | 20.0 | 10.0 | 85.7/45.3 |
© 2018 by the authors. Licensee MDPI, Basel, Switzerland. This article is an open access article distributed under the terms and conditions of the Creative Commons Attribution (CC BY) license (http://creativecommons.org/licenses/by/4.0/).
Share and Cite
MDPI and ACS Style
Cattani, D.J.; Asselin, S.R. Has Selection for Grain Yield Altered Intermediate Wheatgrass? Sustainability 2018, 10, 688. https://doi.org/10.3390/su10030688
AMA Style
Cattani DJ, Asselin SR. Has Selection for Grain Yield Altered Intermediate Wheatgrass? Sustainability. 2018; 10(3):688. https://doi.org/10.3390/su10030688
Chicago/Turabian StyleCattani, Douglas J., and Sean R. Asselin. 2018. "Has Selection for Grain Yield Altered Intermediate Wheatgrass?" Sustainability 10, no. 3: 688. https://doi.org/10.3390/su10030688
Note that from the first issue of 2016, this journal uses article numbers instead of page numbers. See further details here.