An Optimization-LCA of a Prestressed Concrete Precast Bridge


Abstract
1. Introduction
2. Optimization
3. Life-Cycle Assessment
4. Case Study
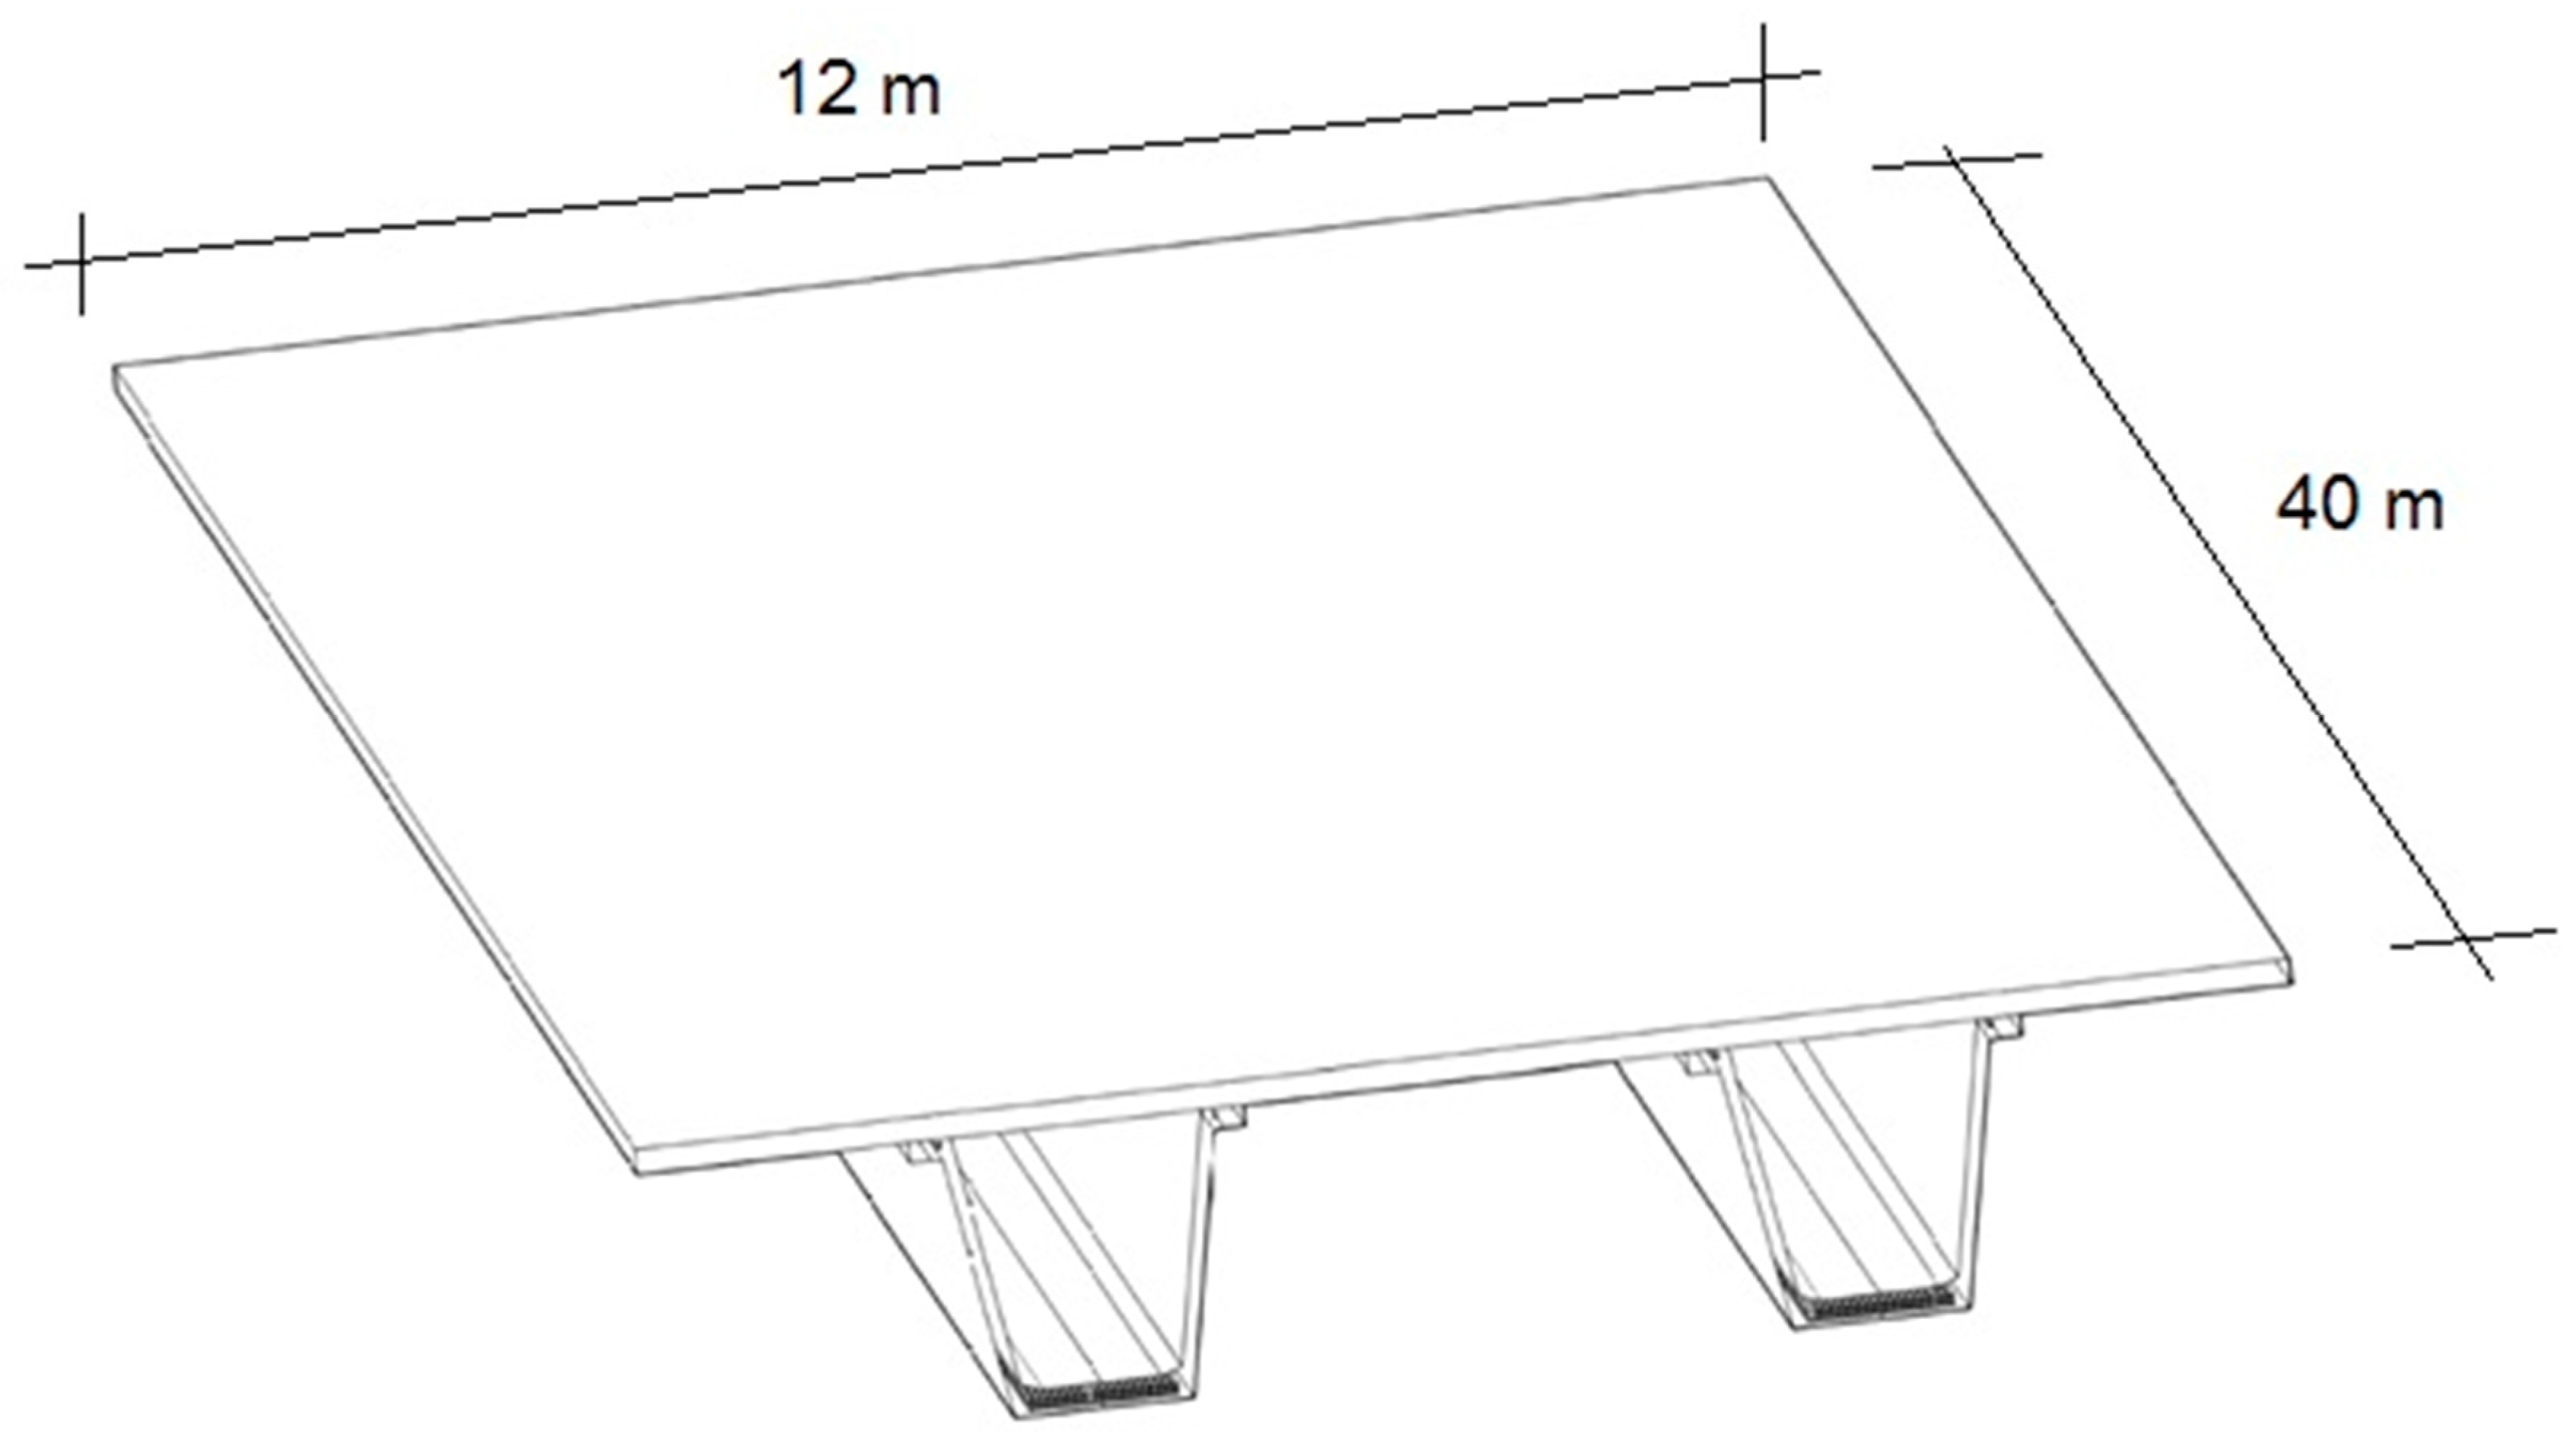
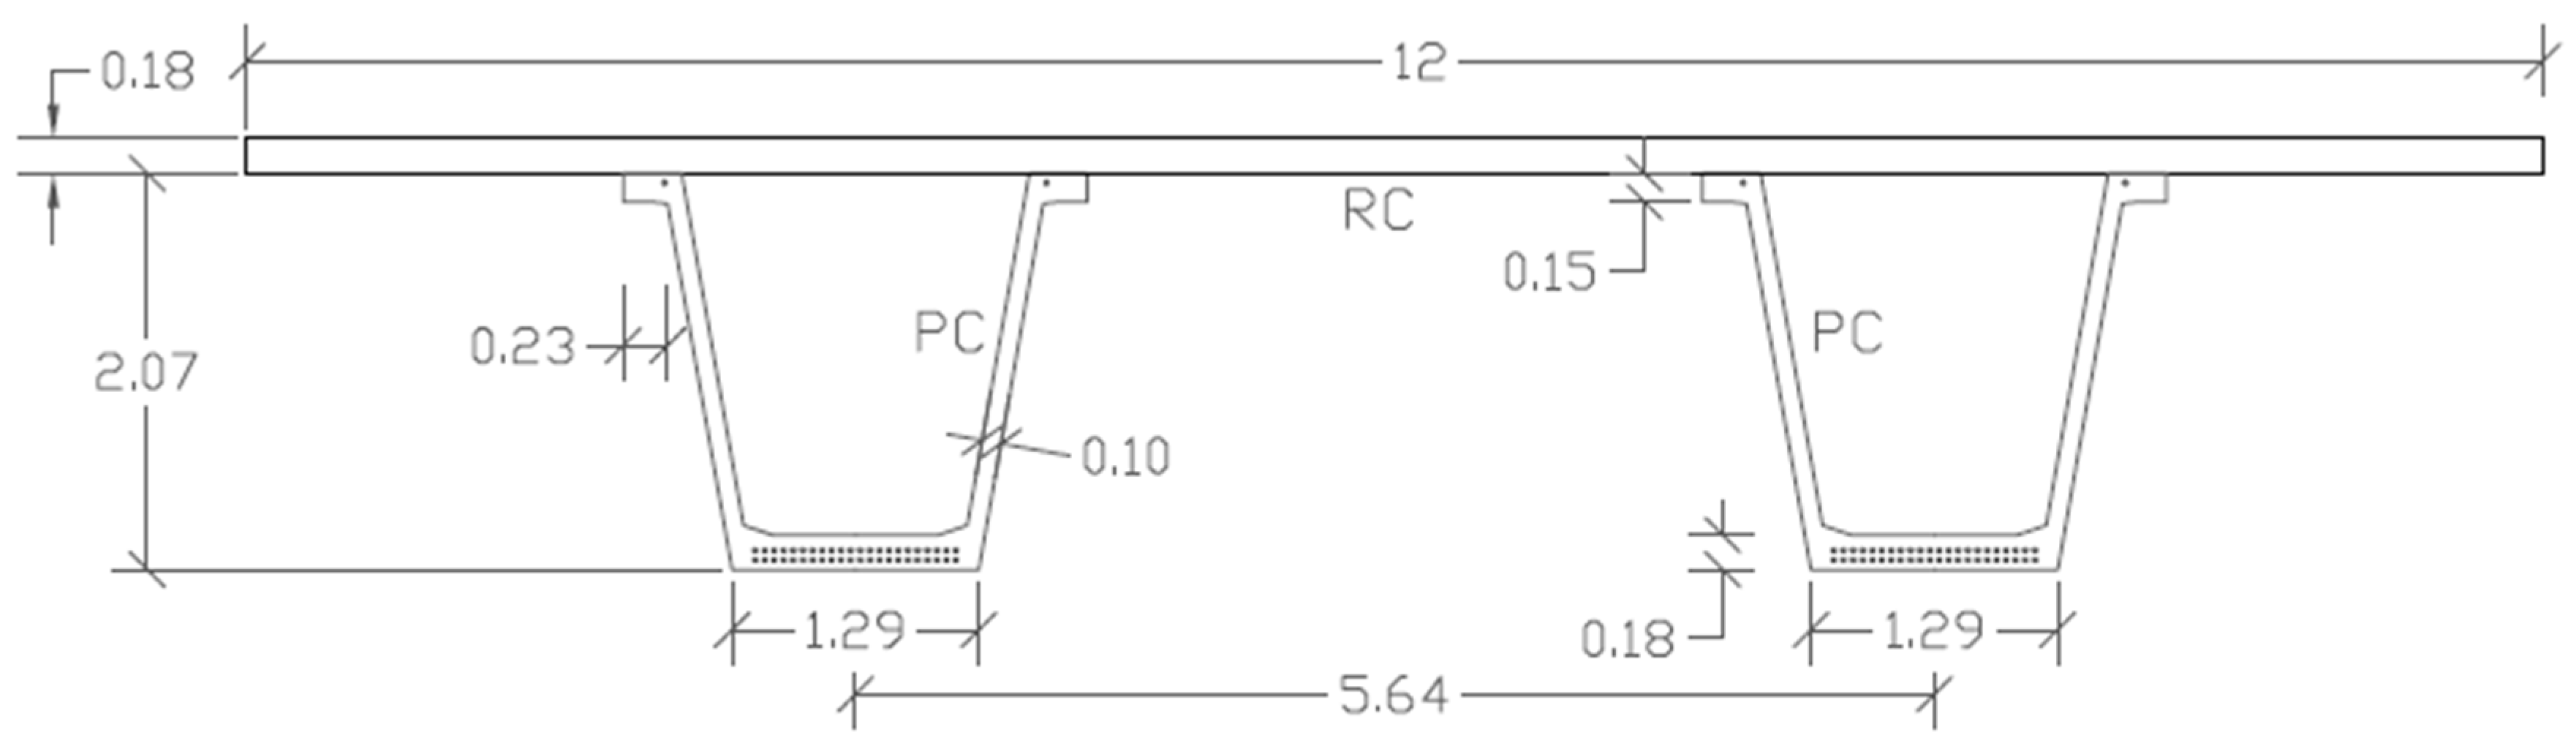
4.1. Bridge Description
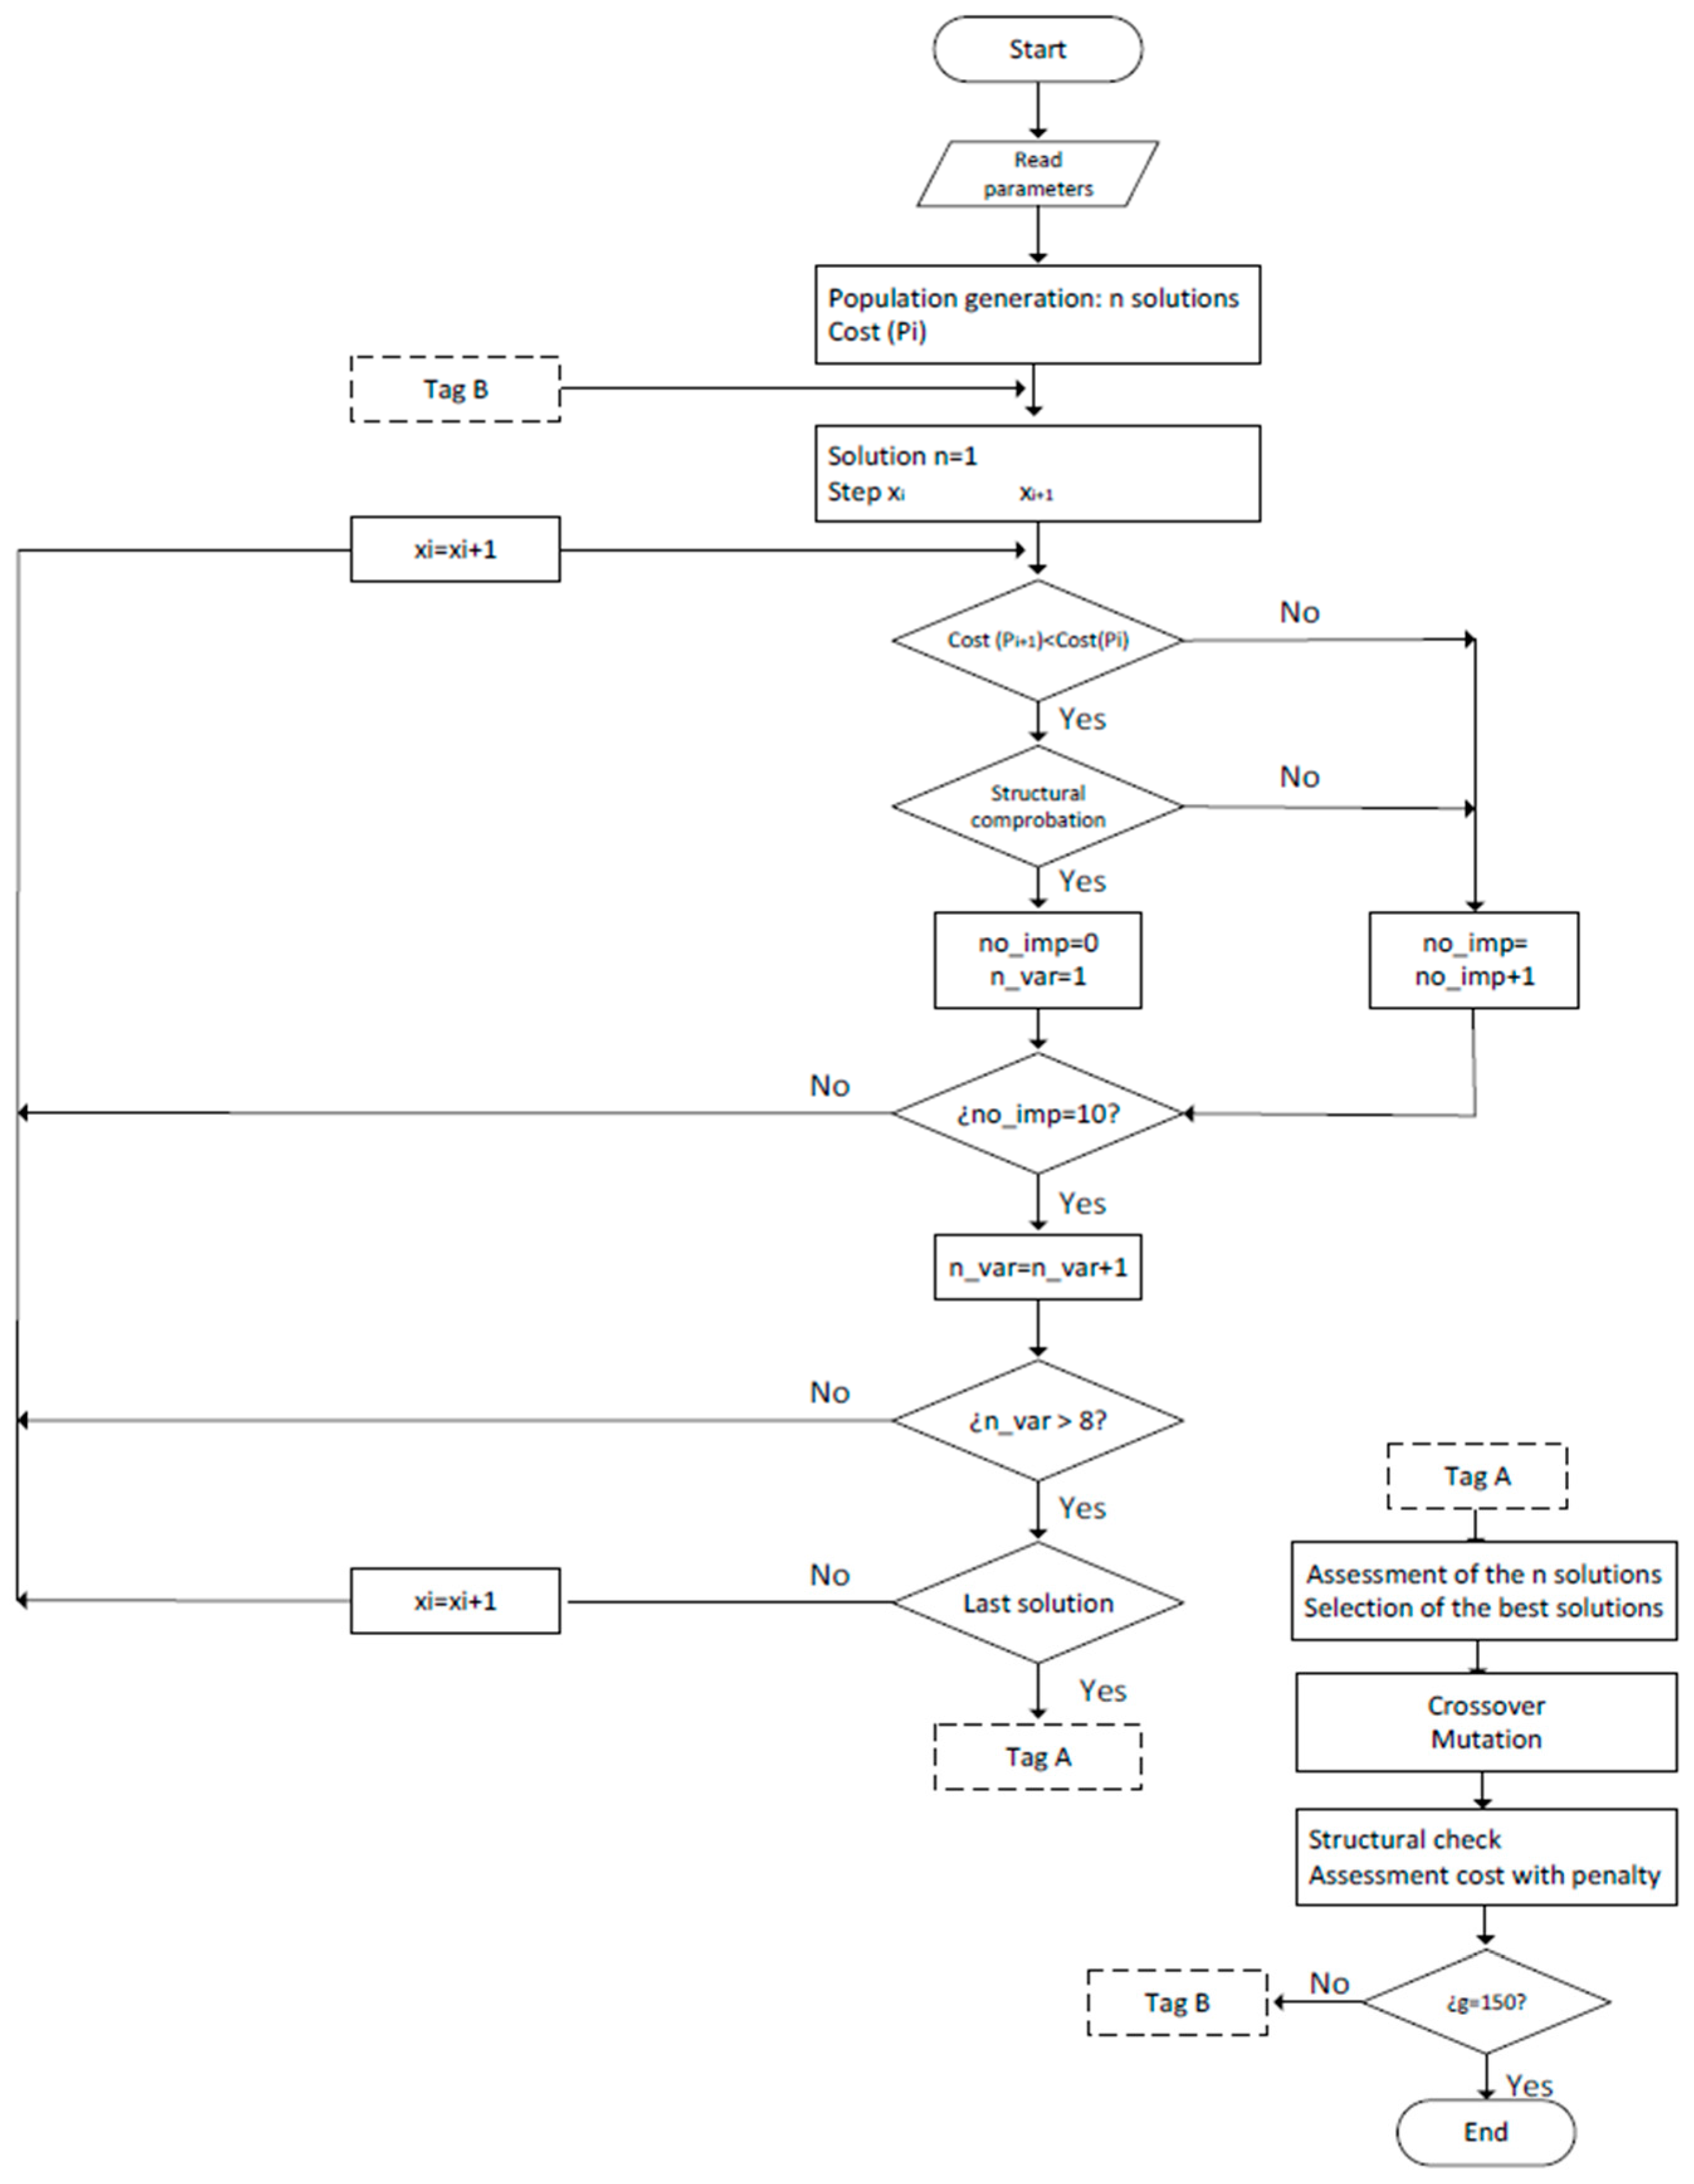
4.2. Optimization
4.3. Life-Cycle Assessment
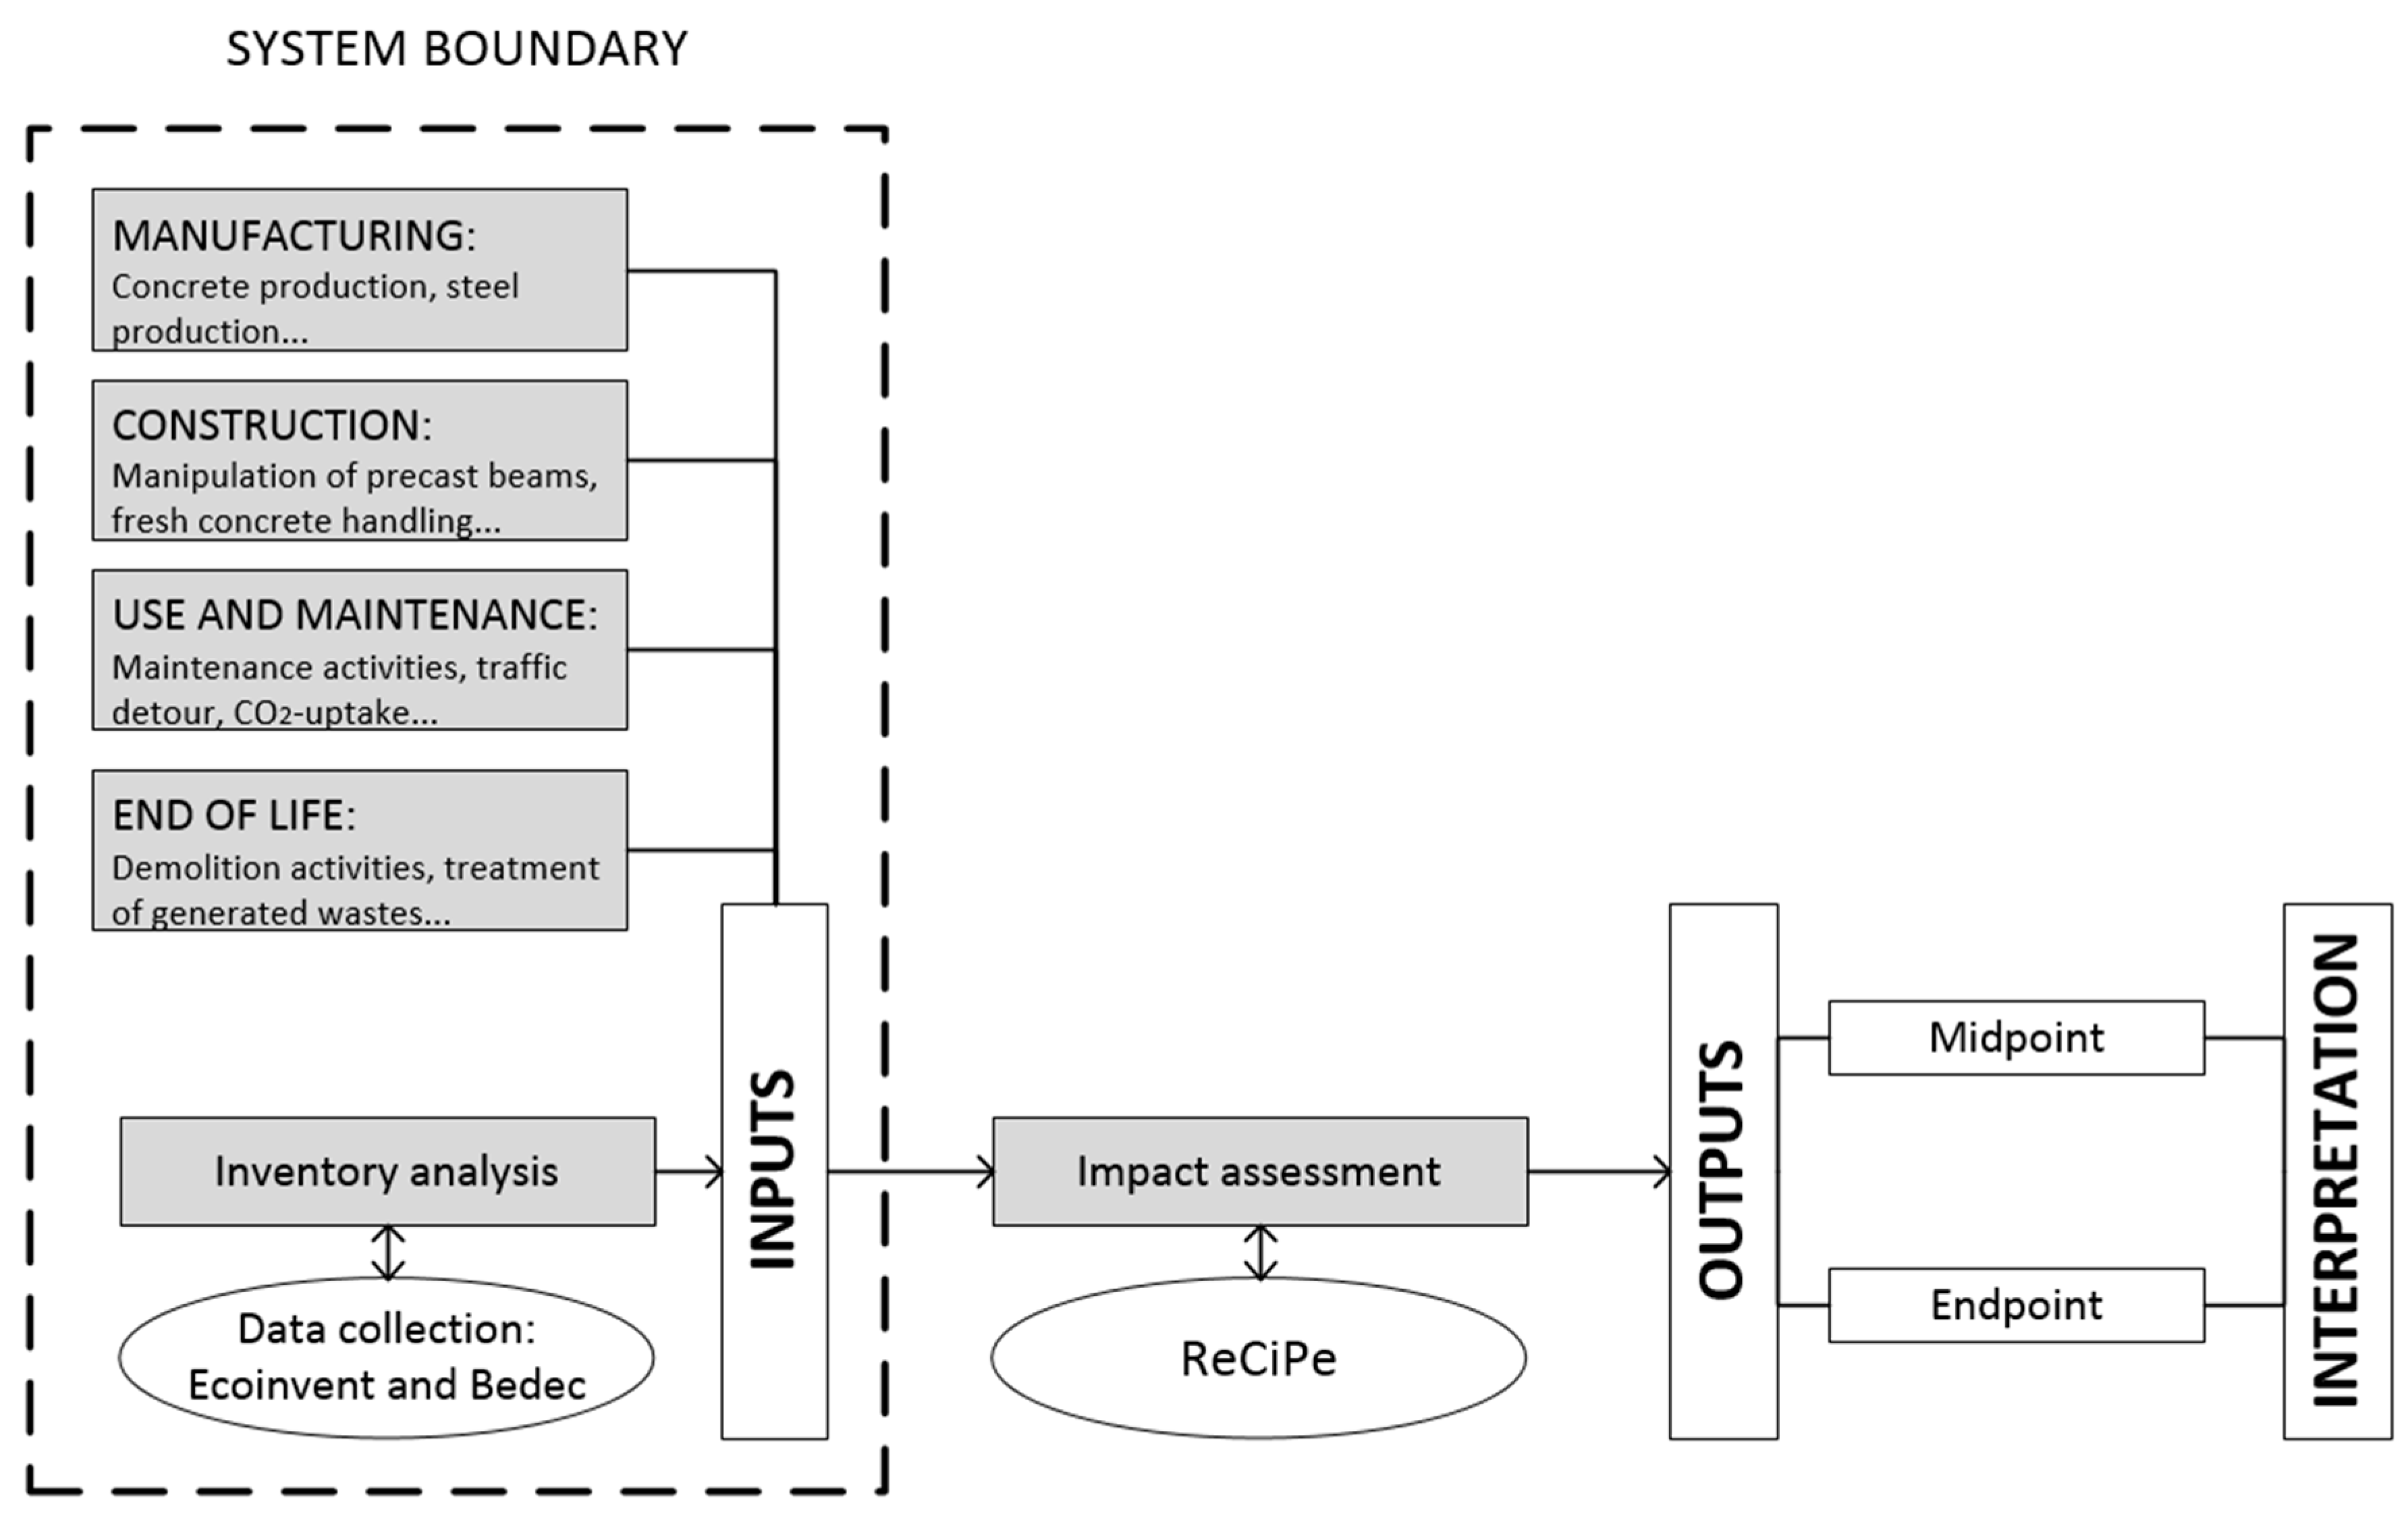
4.3.1. Goal and Scope
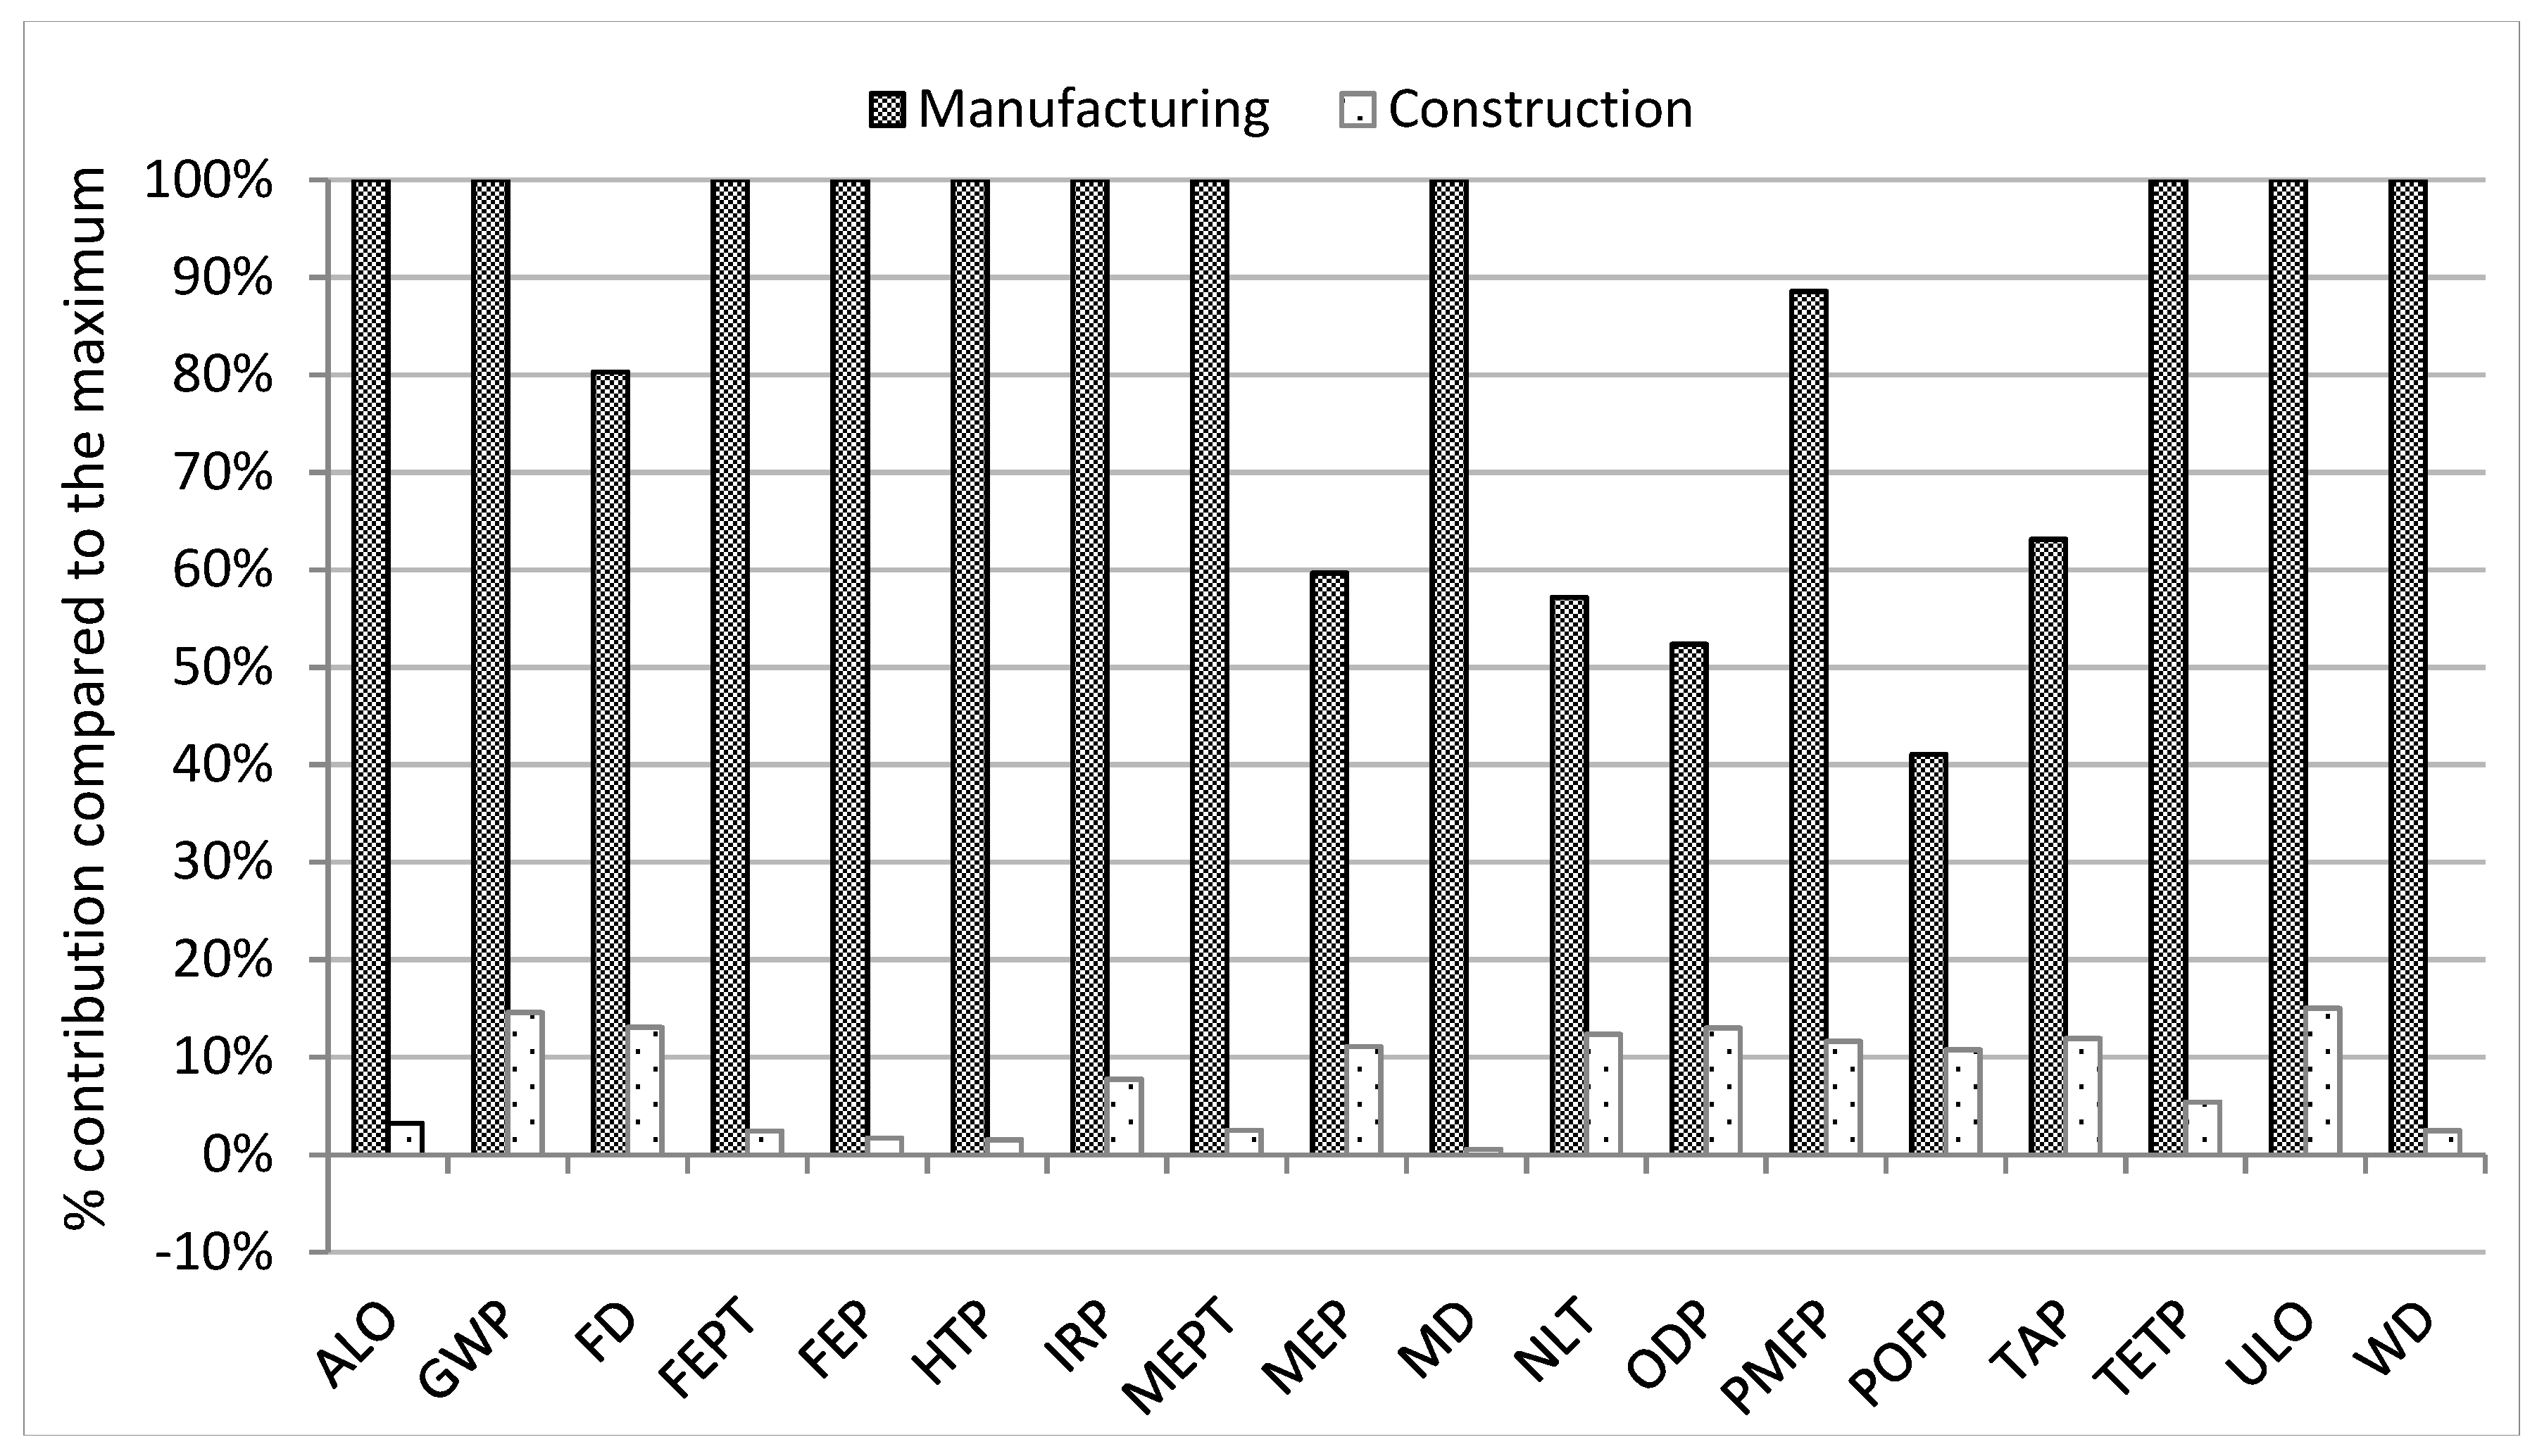
Manufacturing
Construction
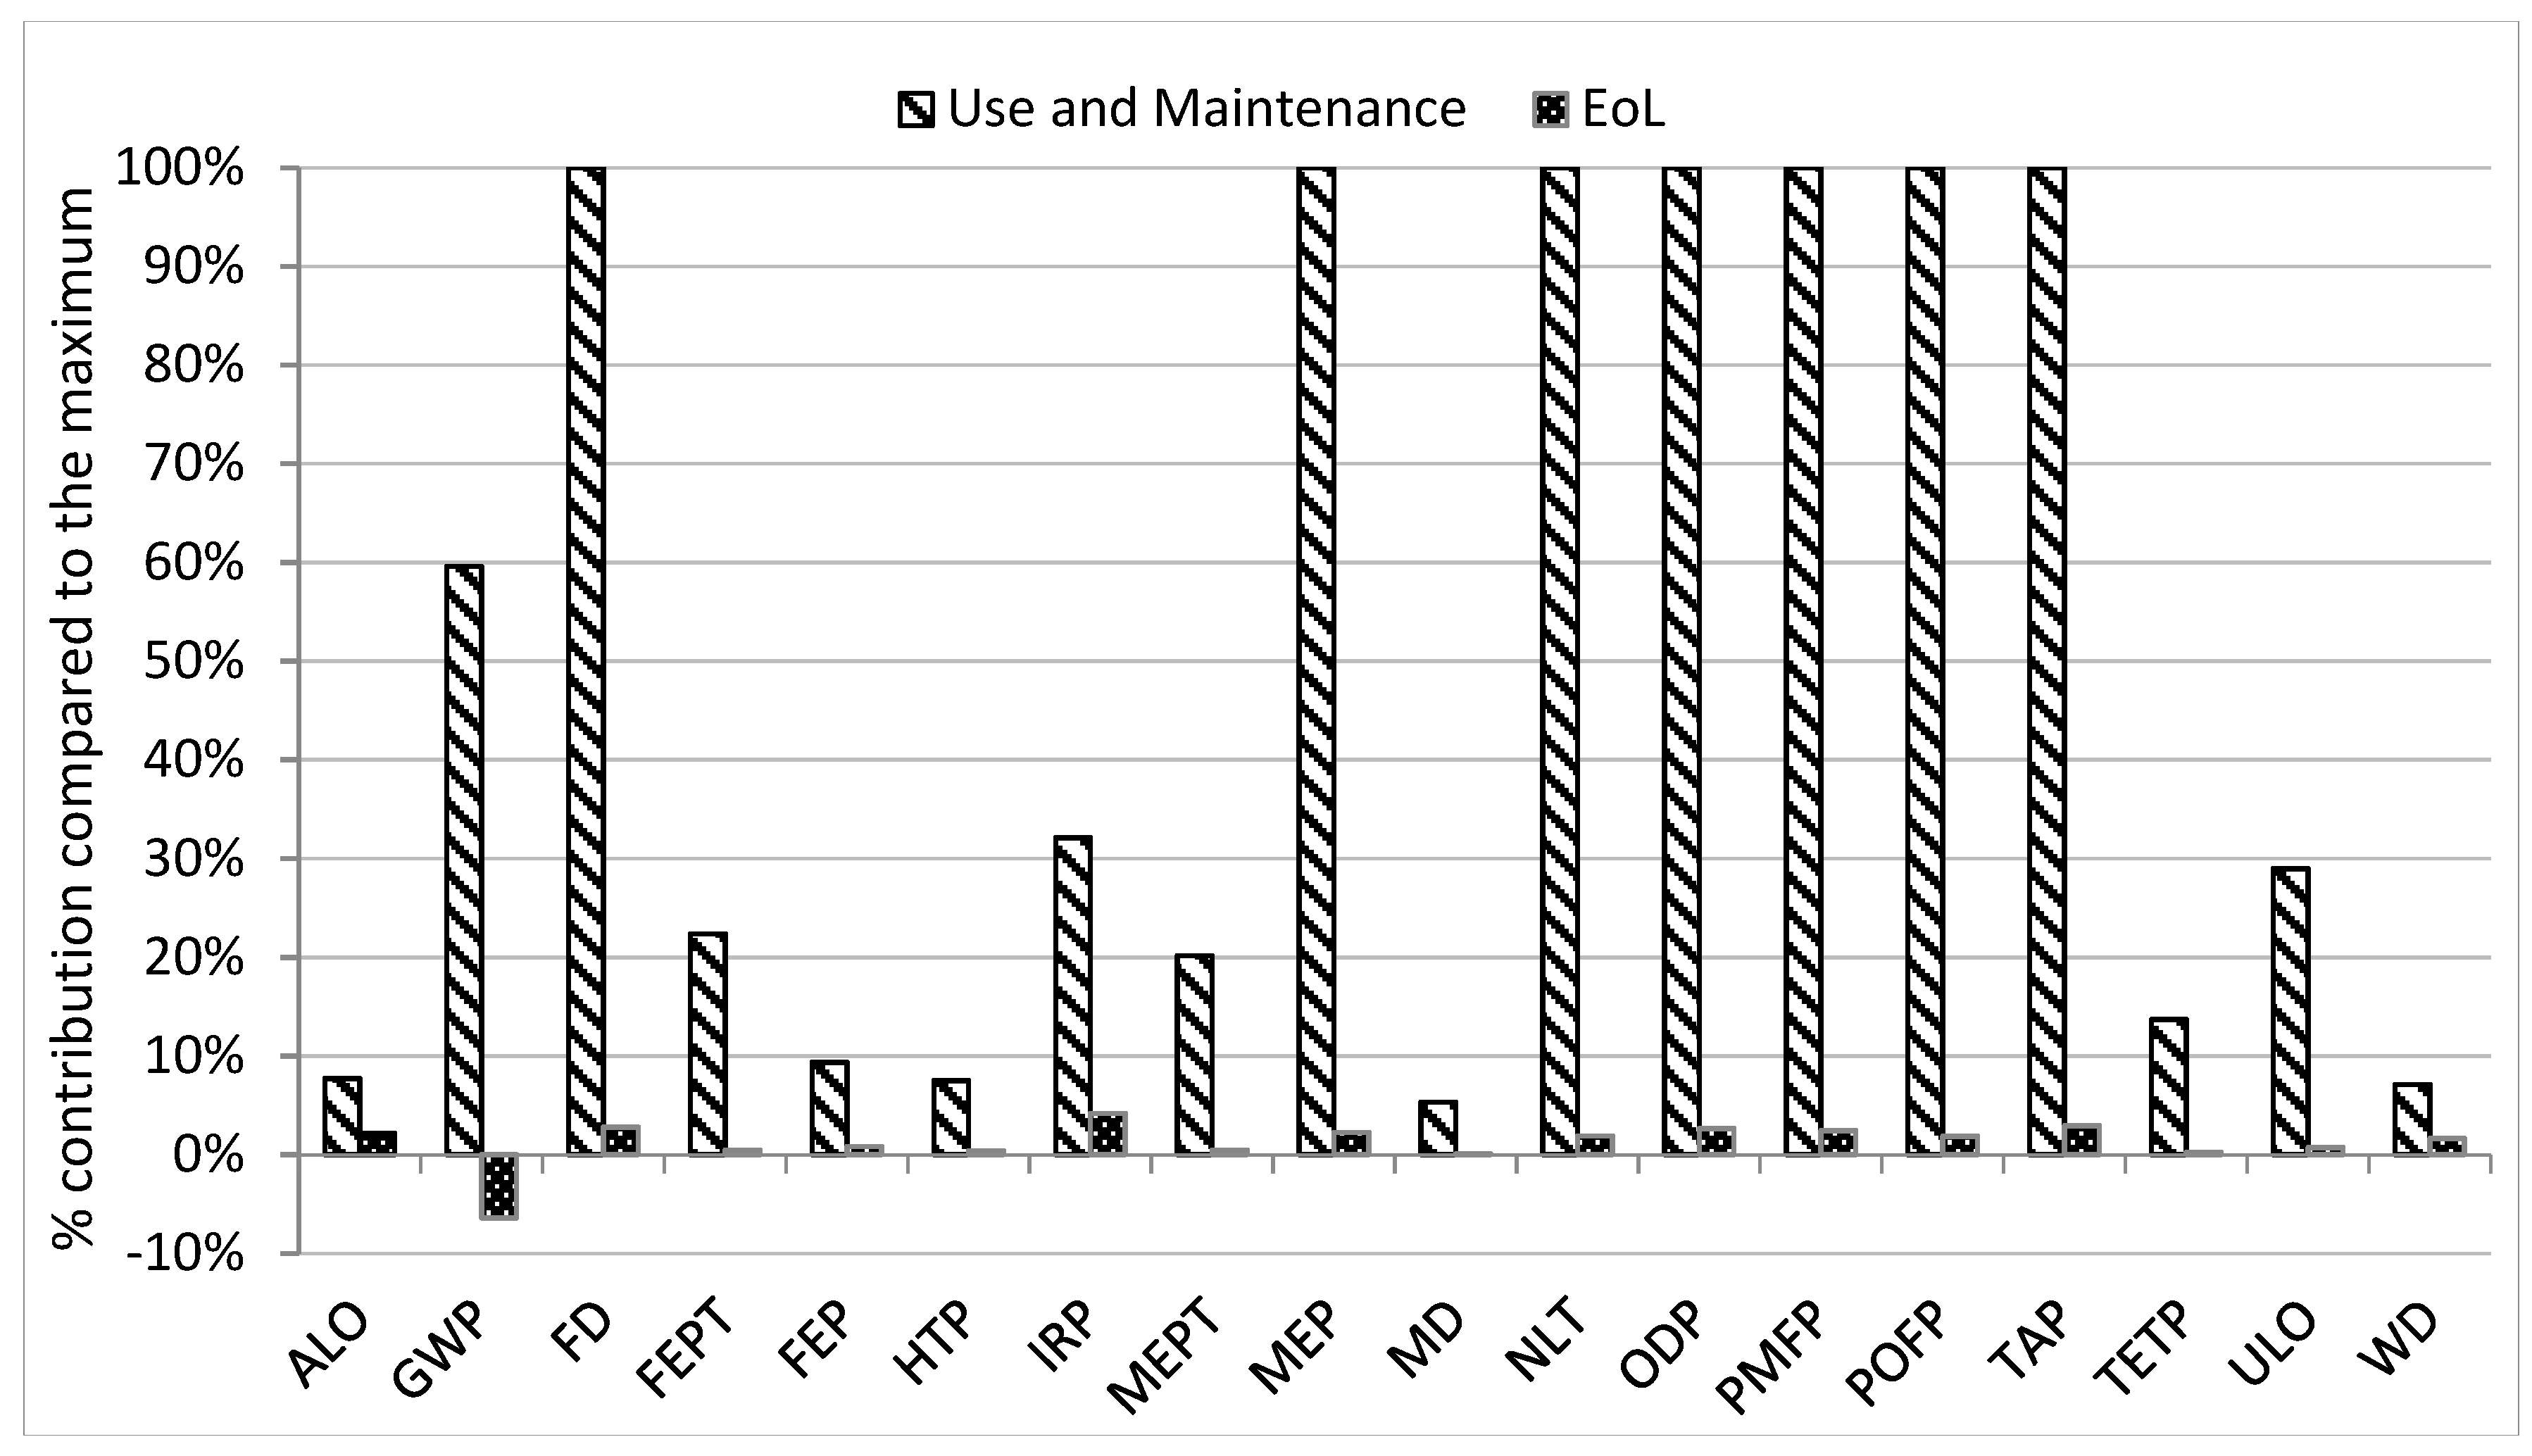
Use and Maintenance
End of Life
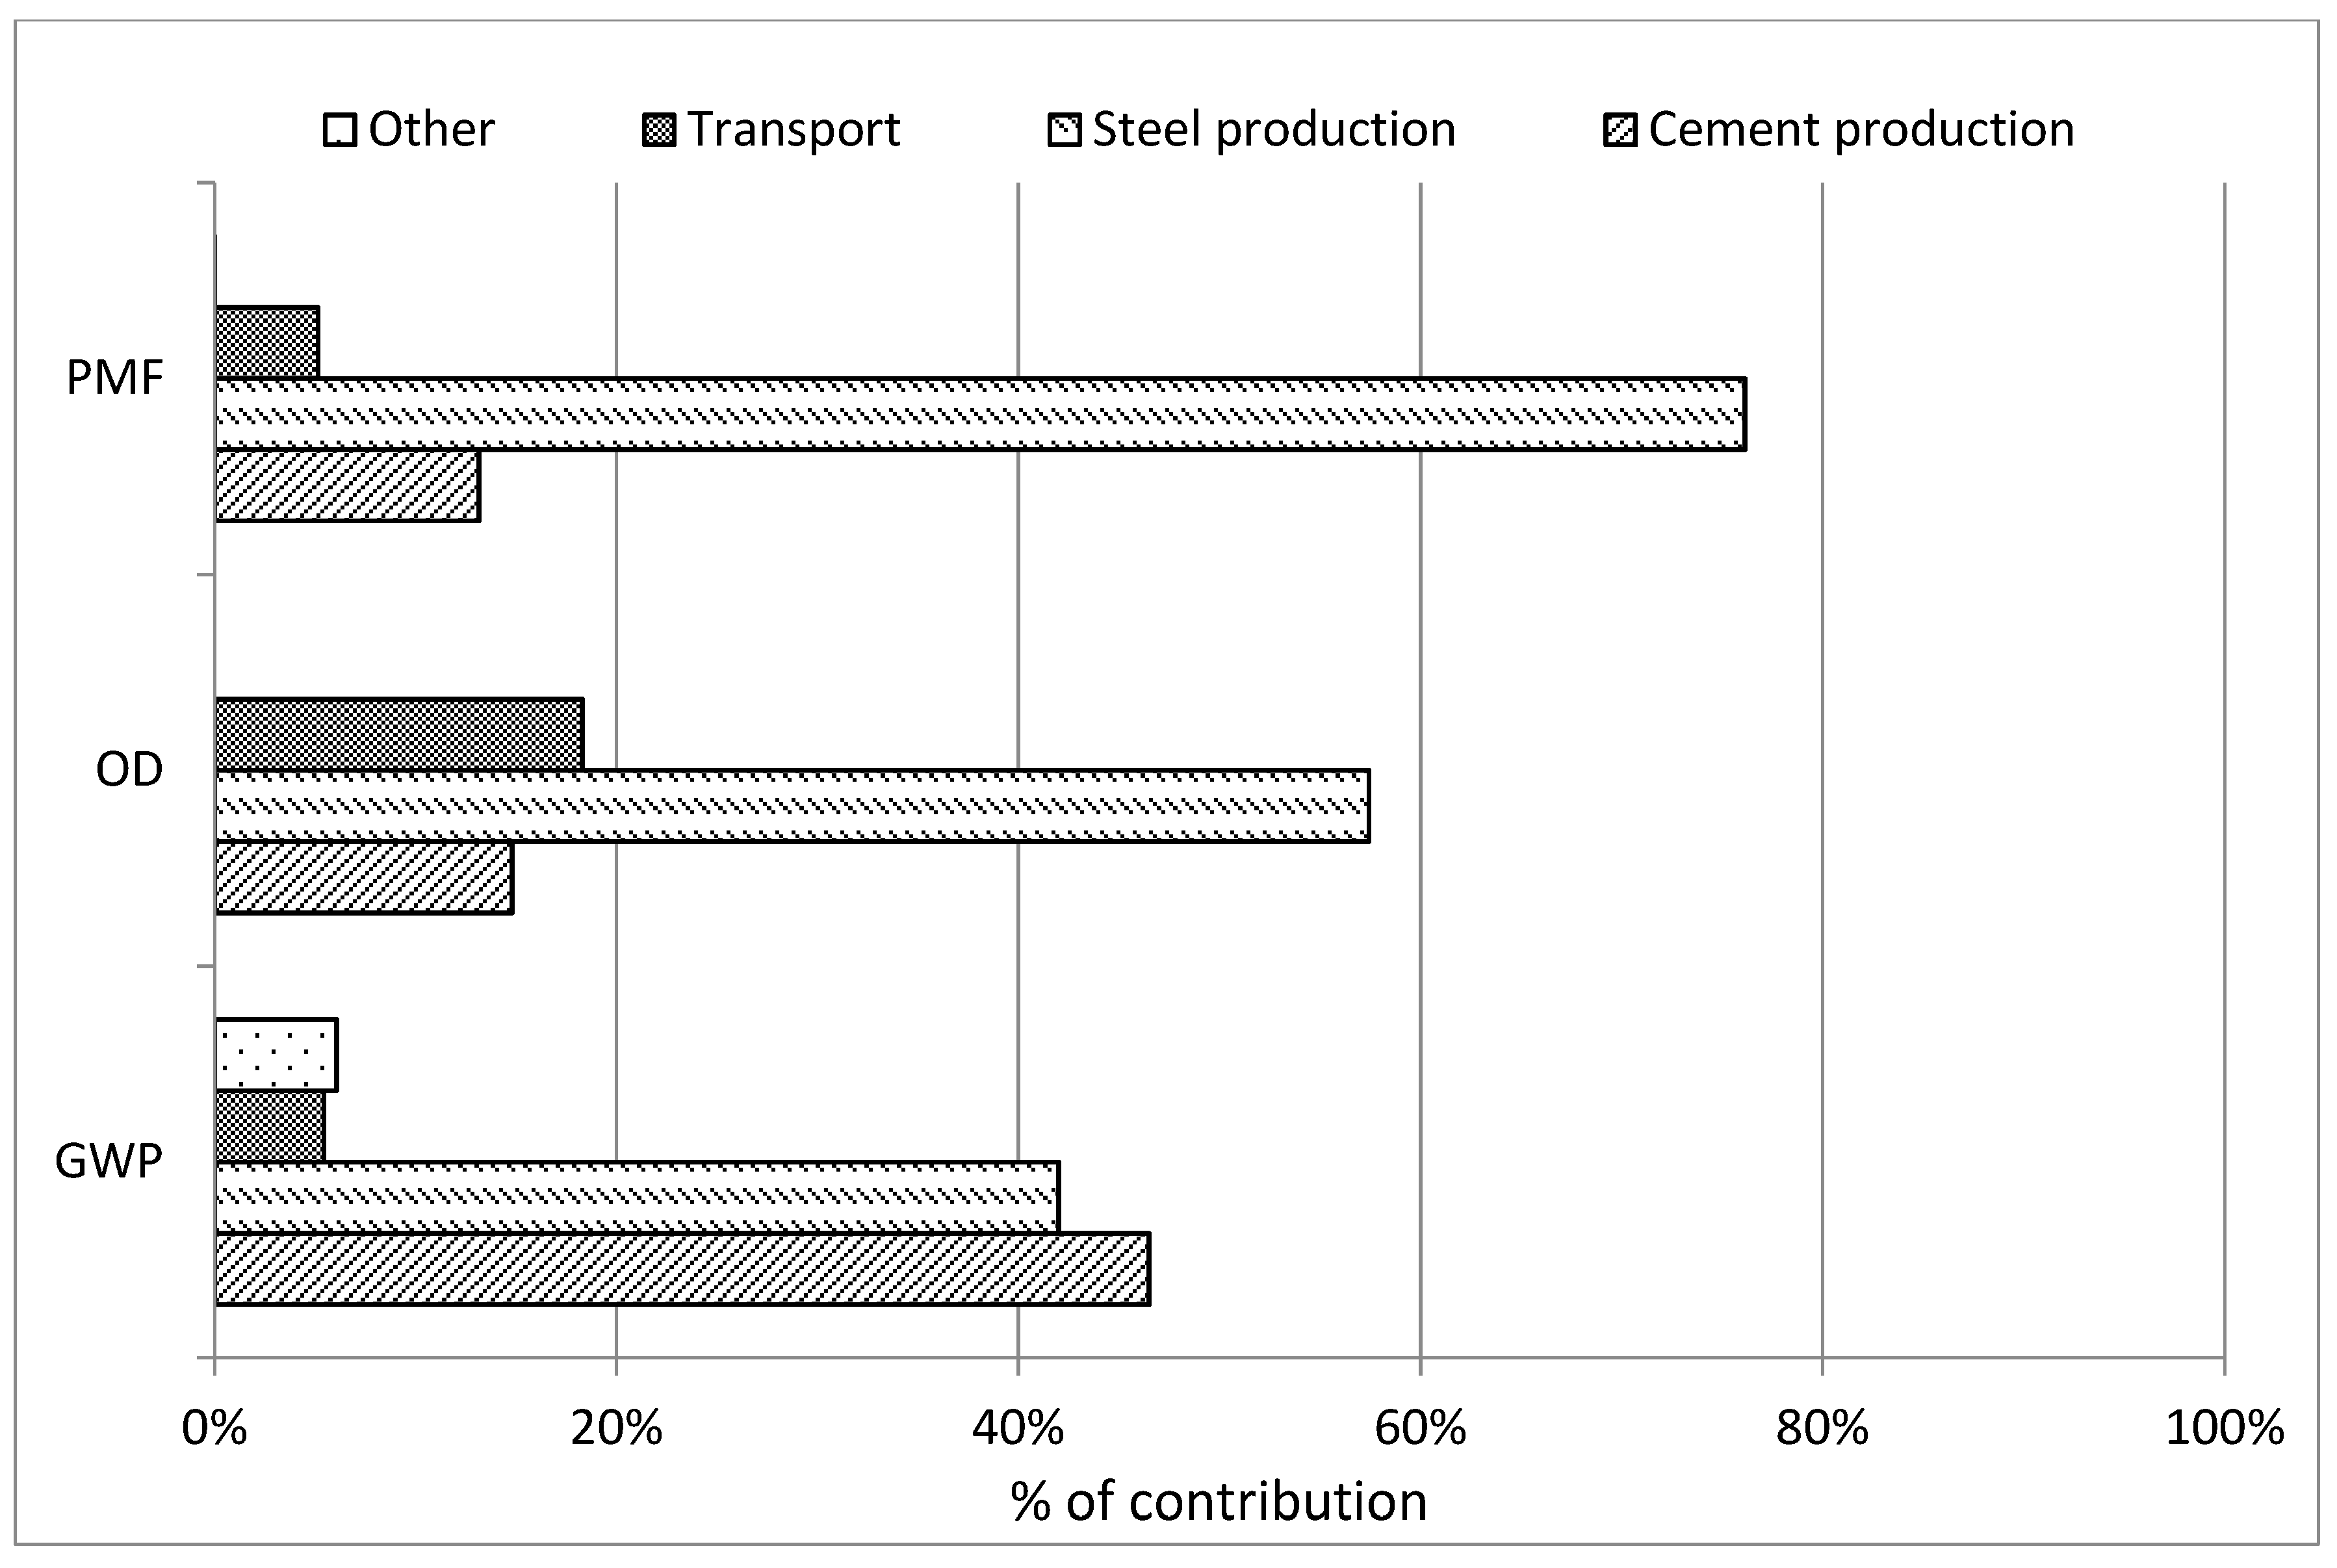
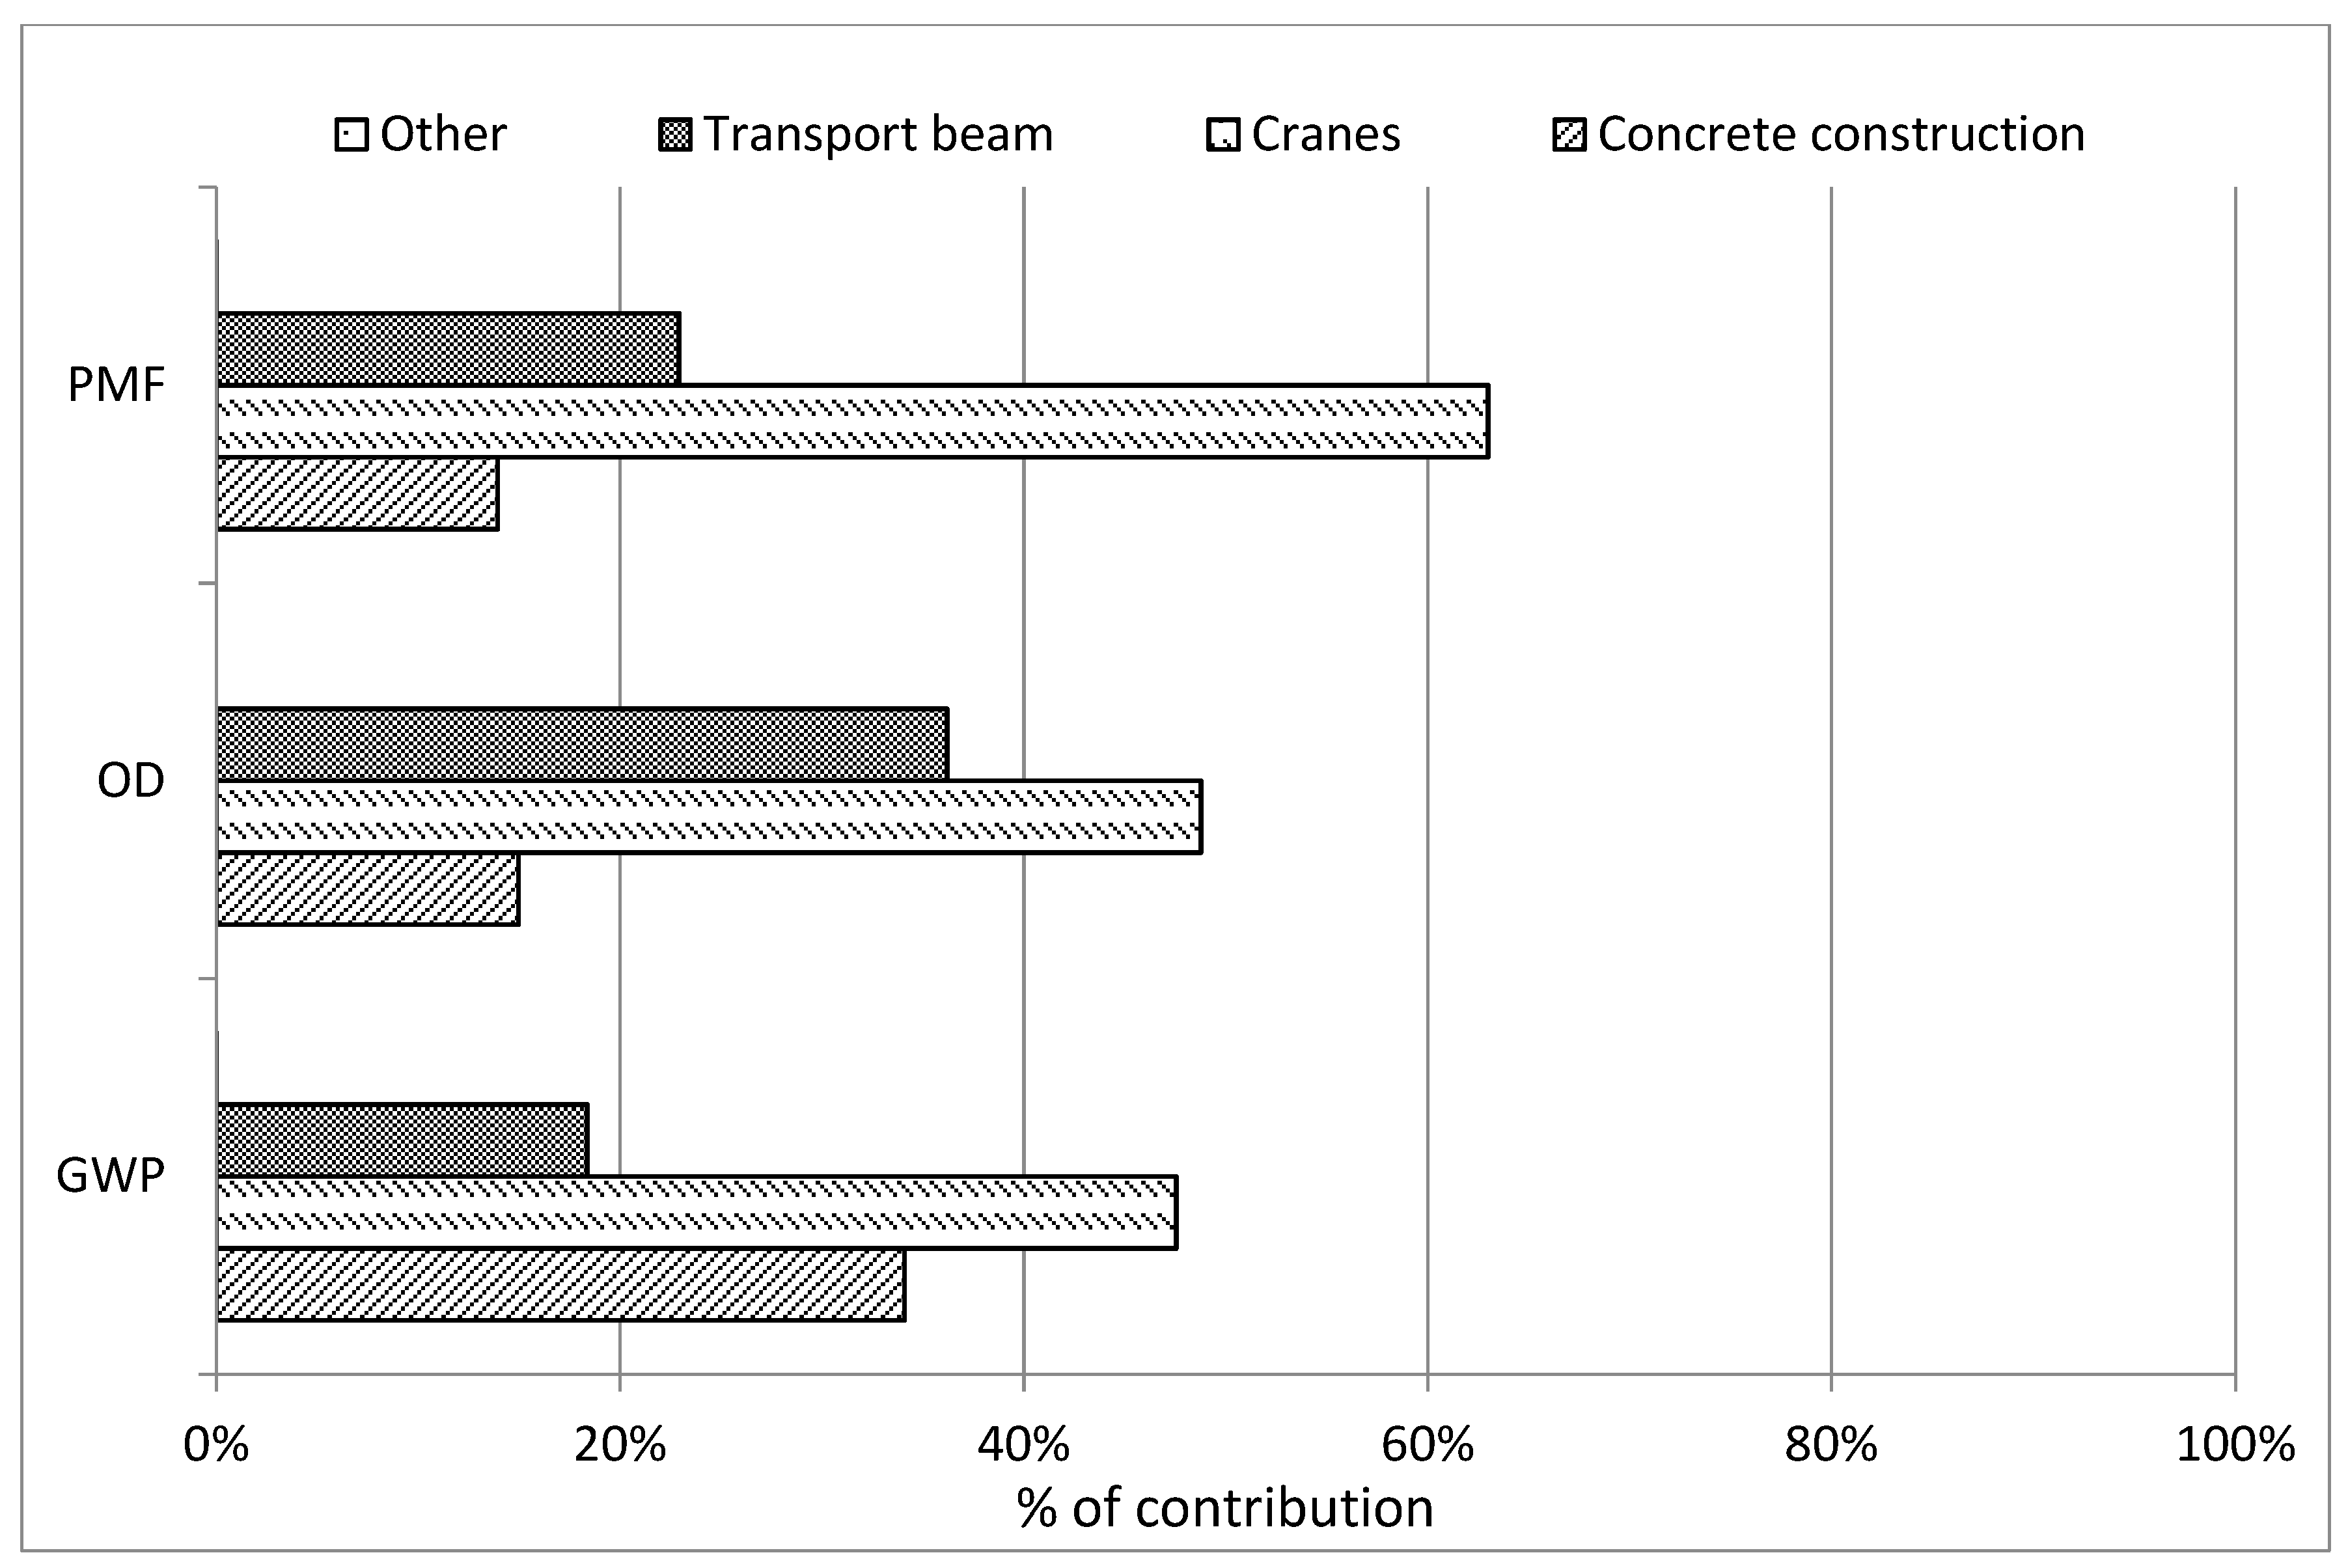
4.3.2. Inventory Analysis
4.3.3. Impact Assessment
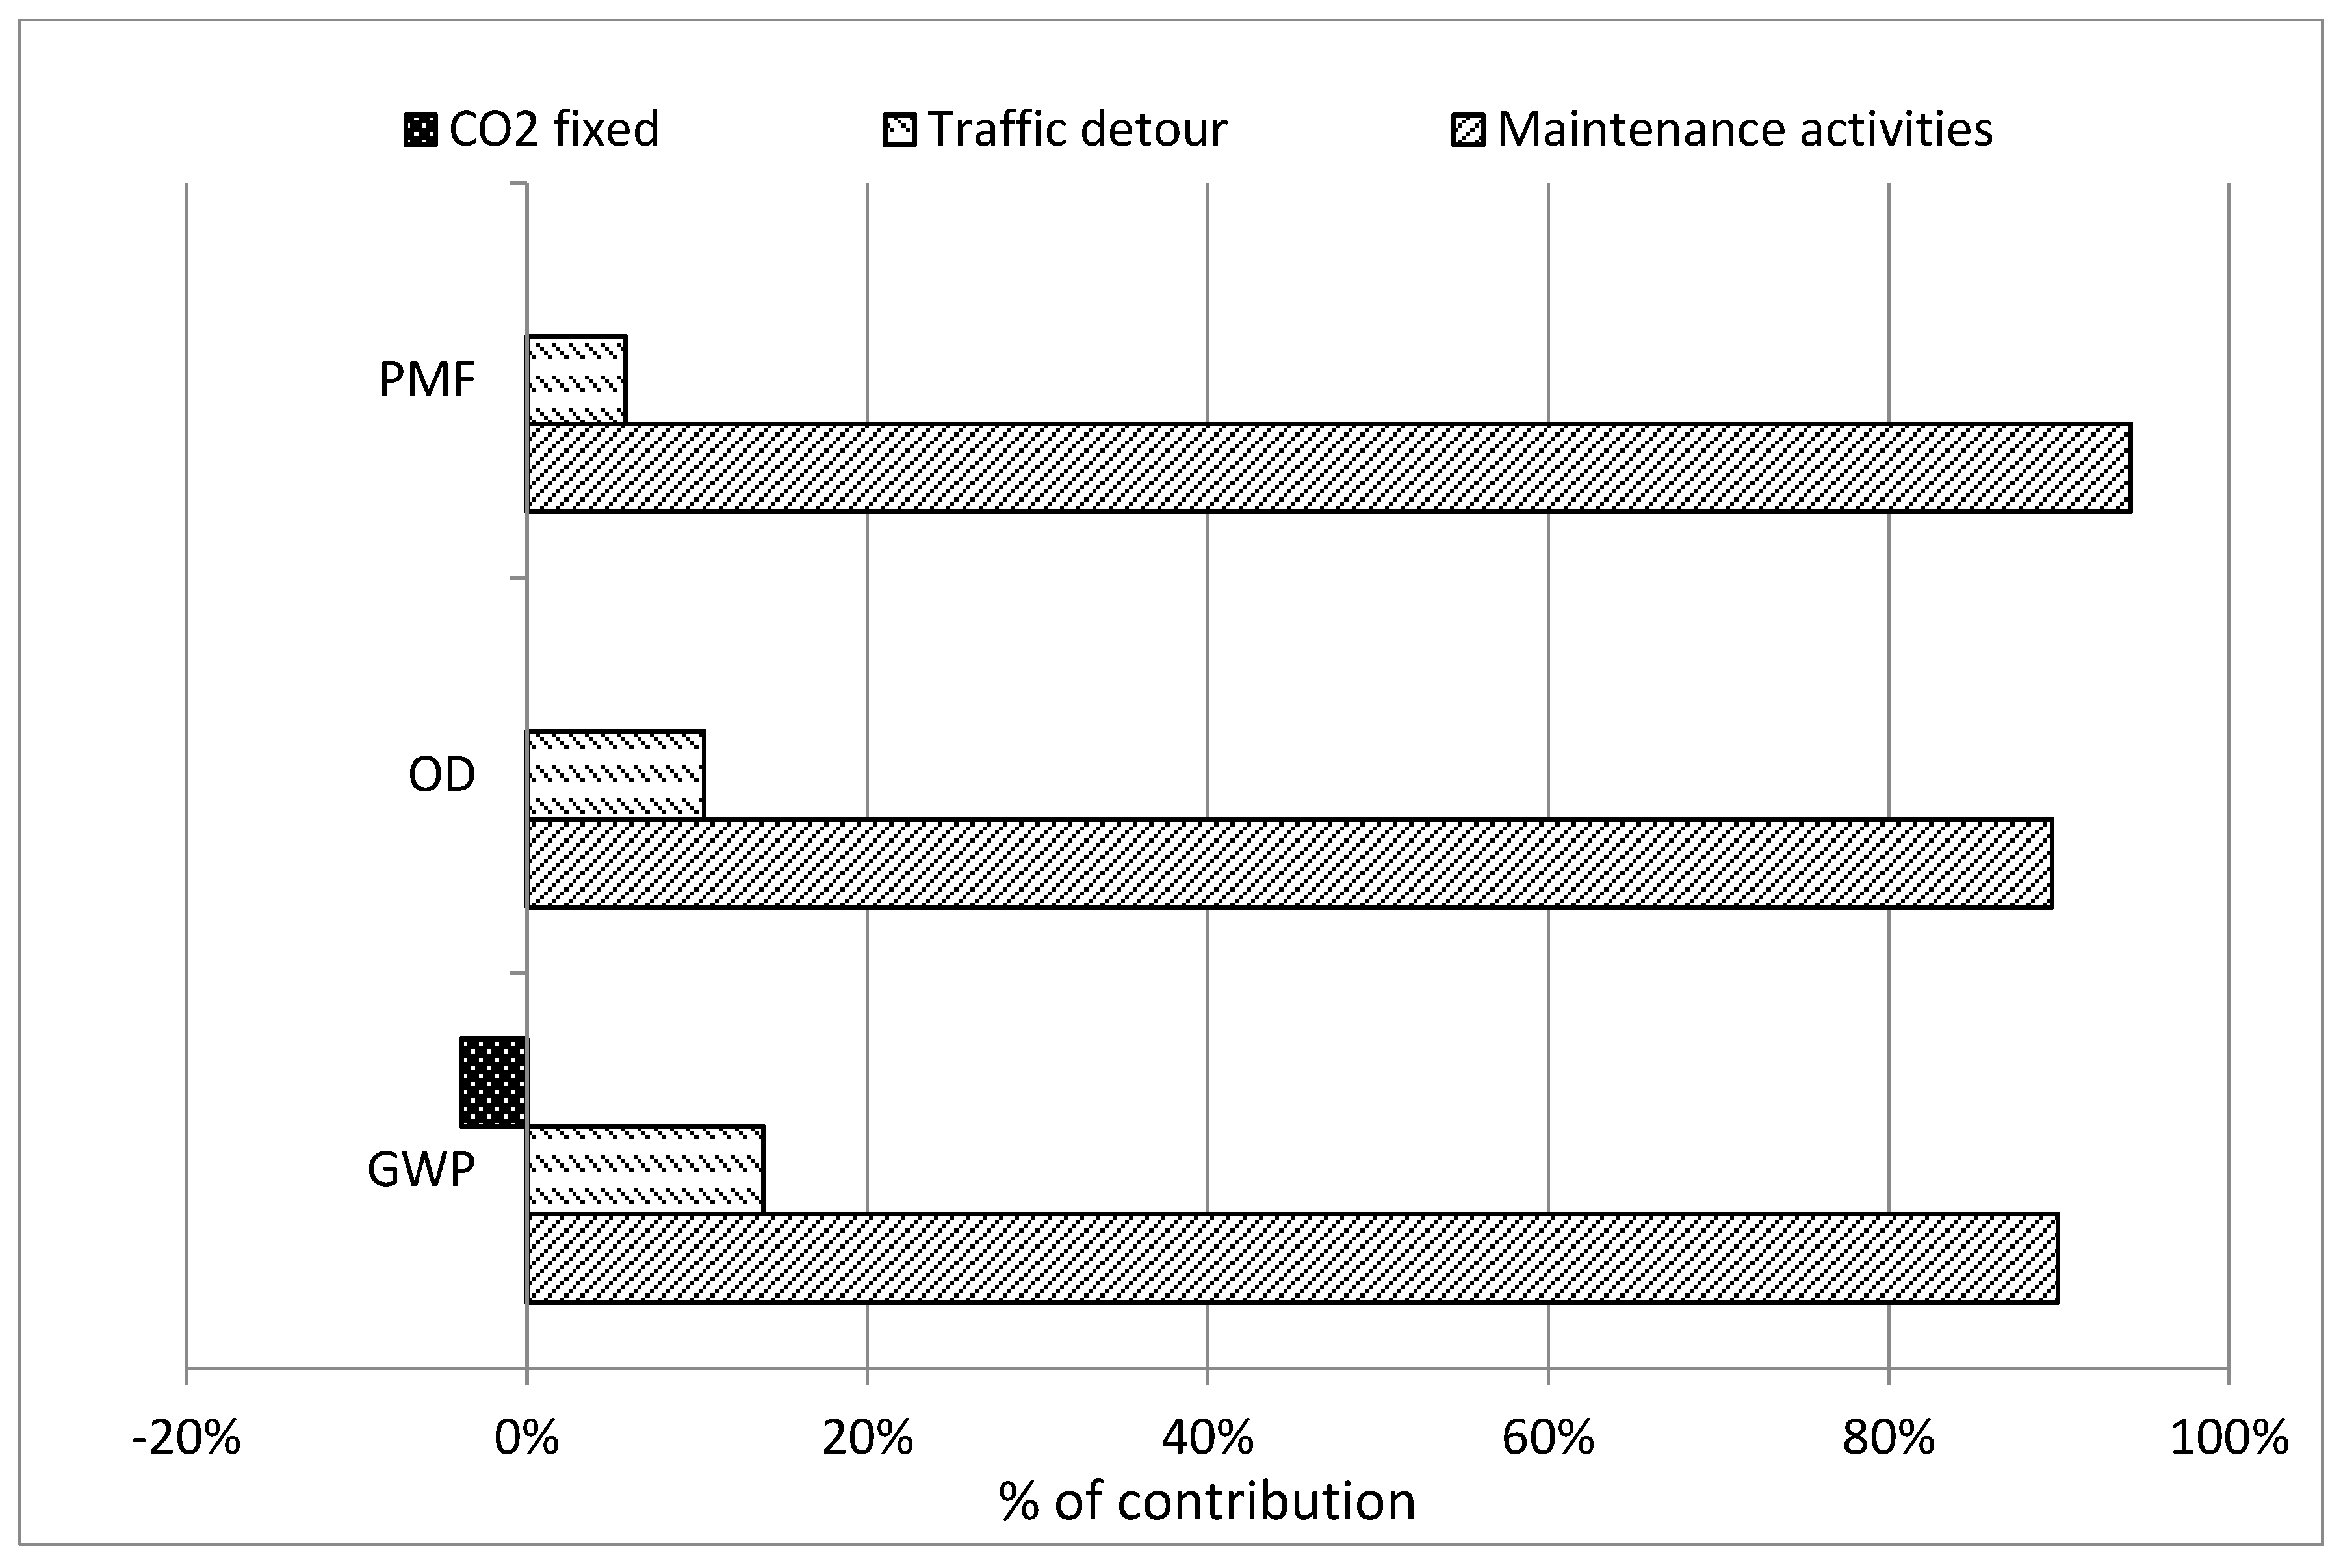
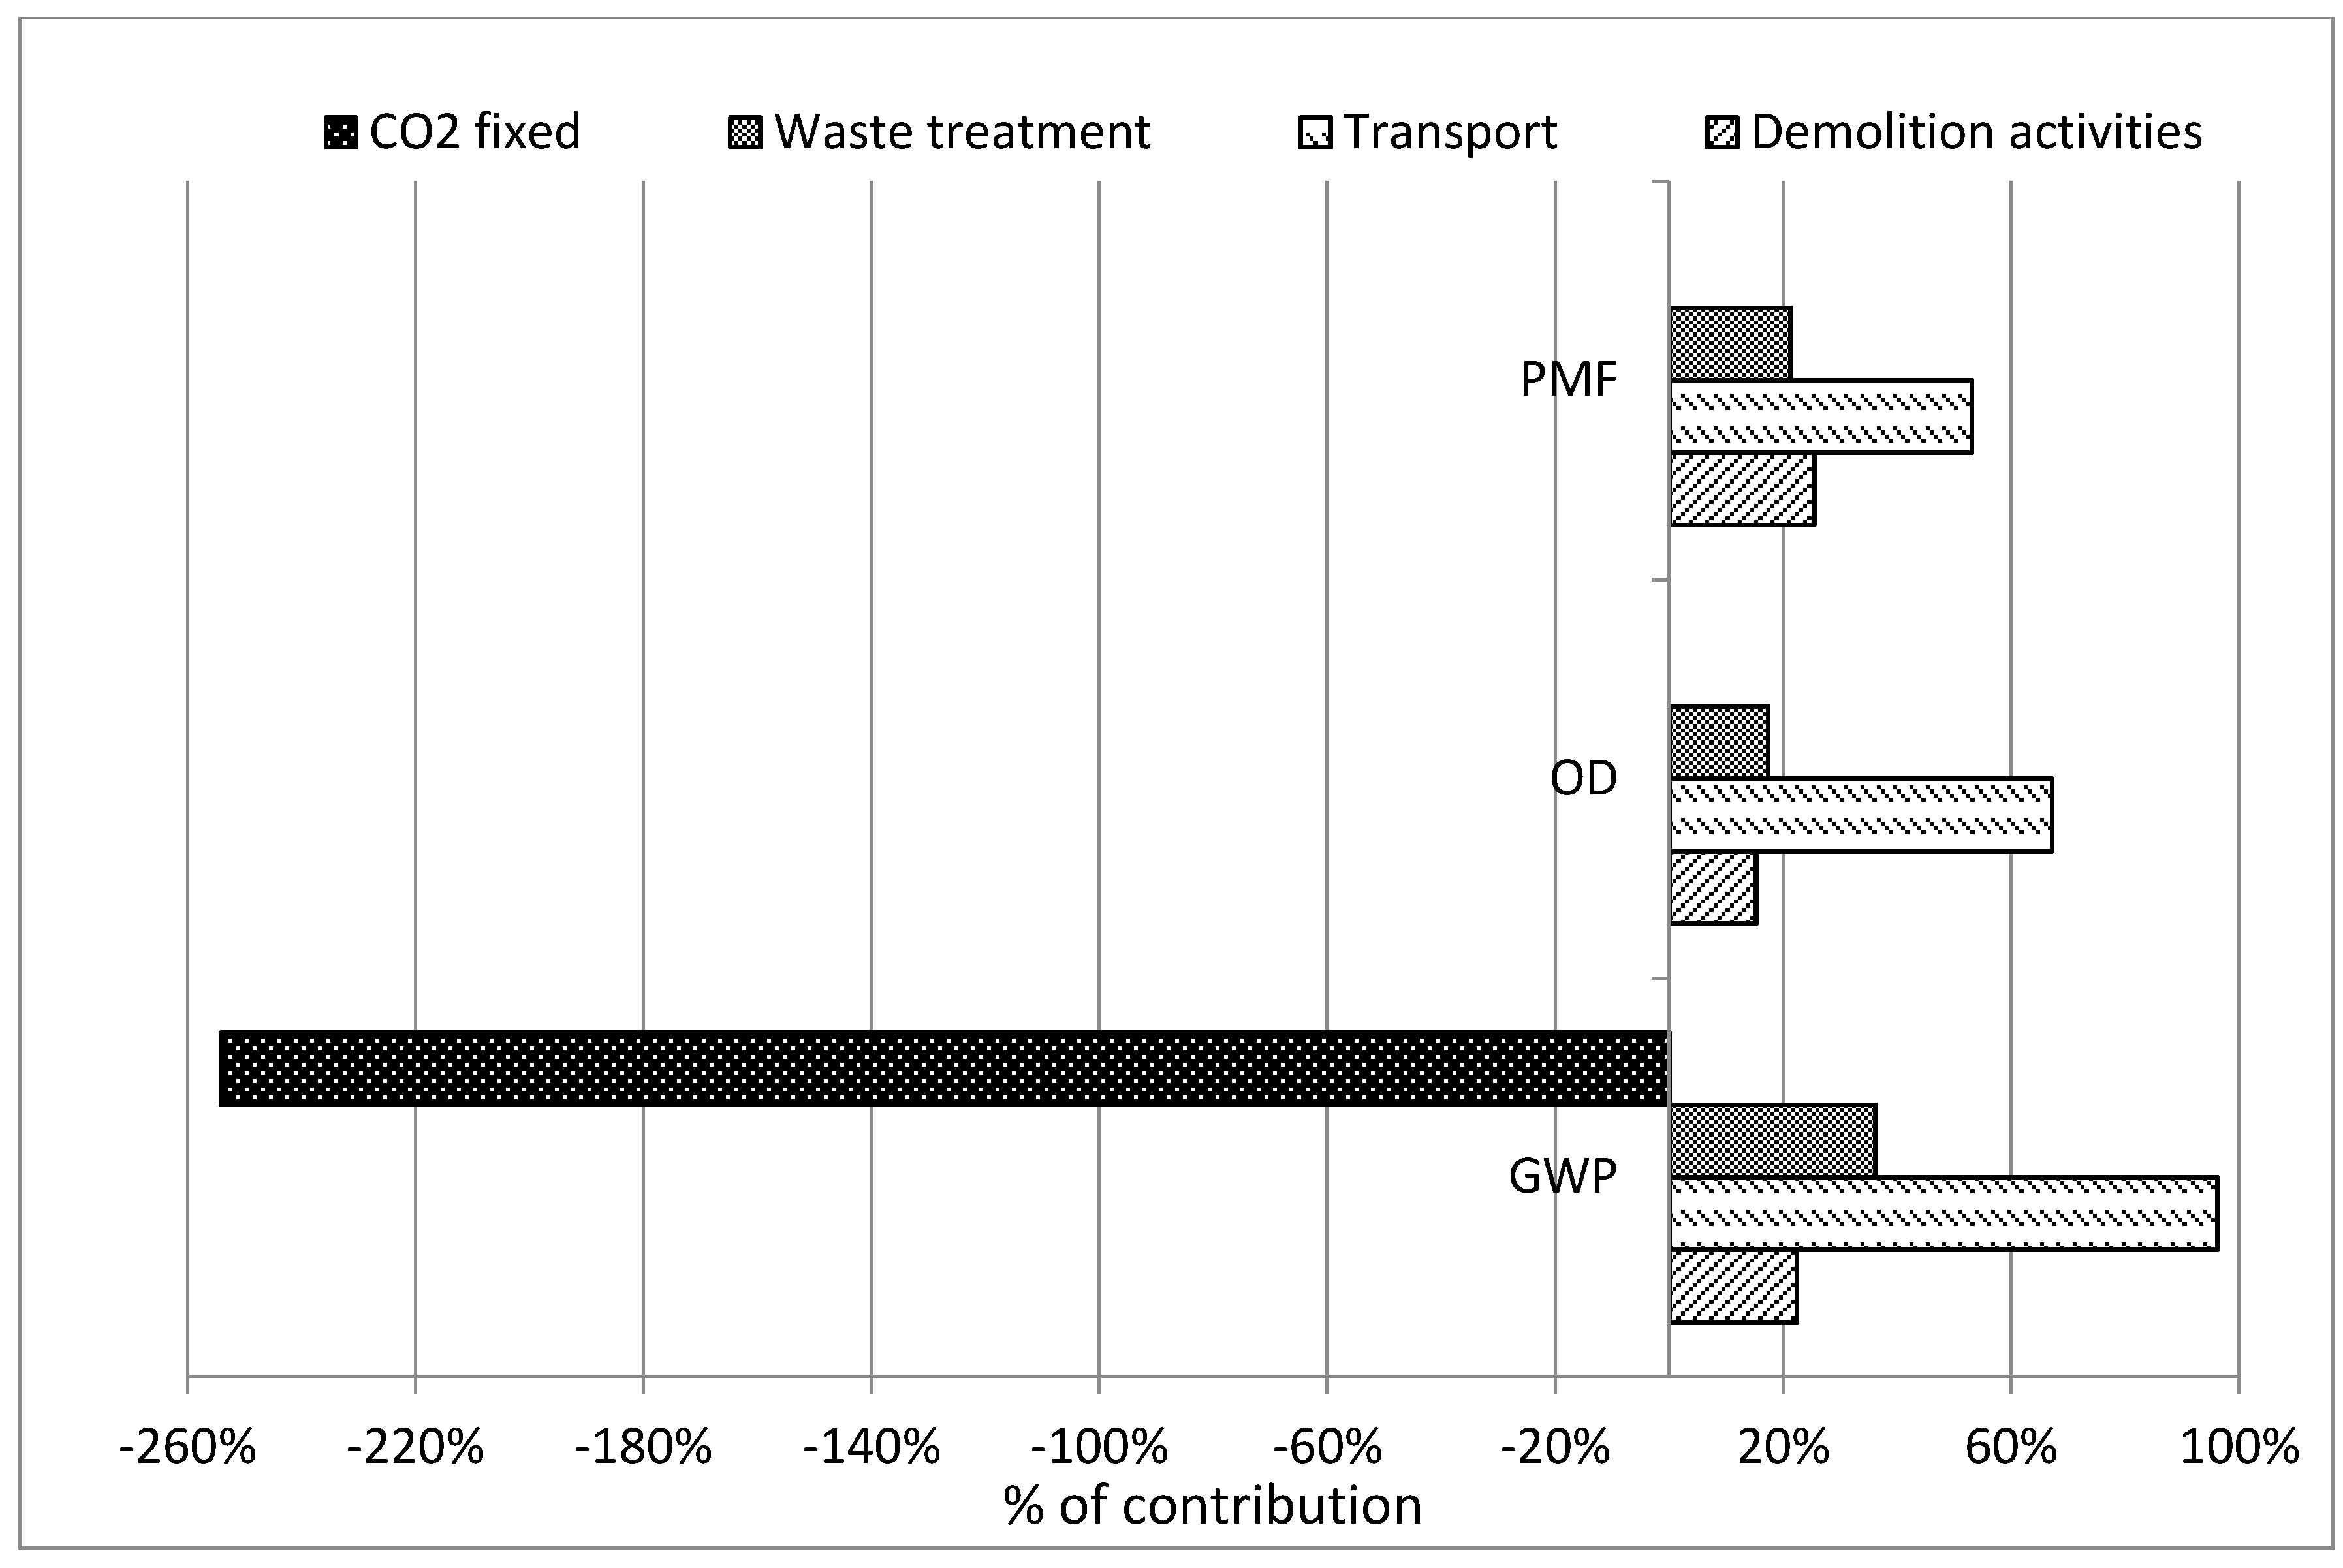
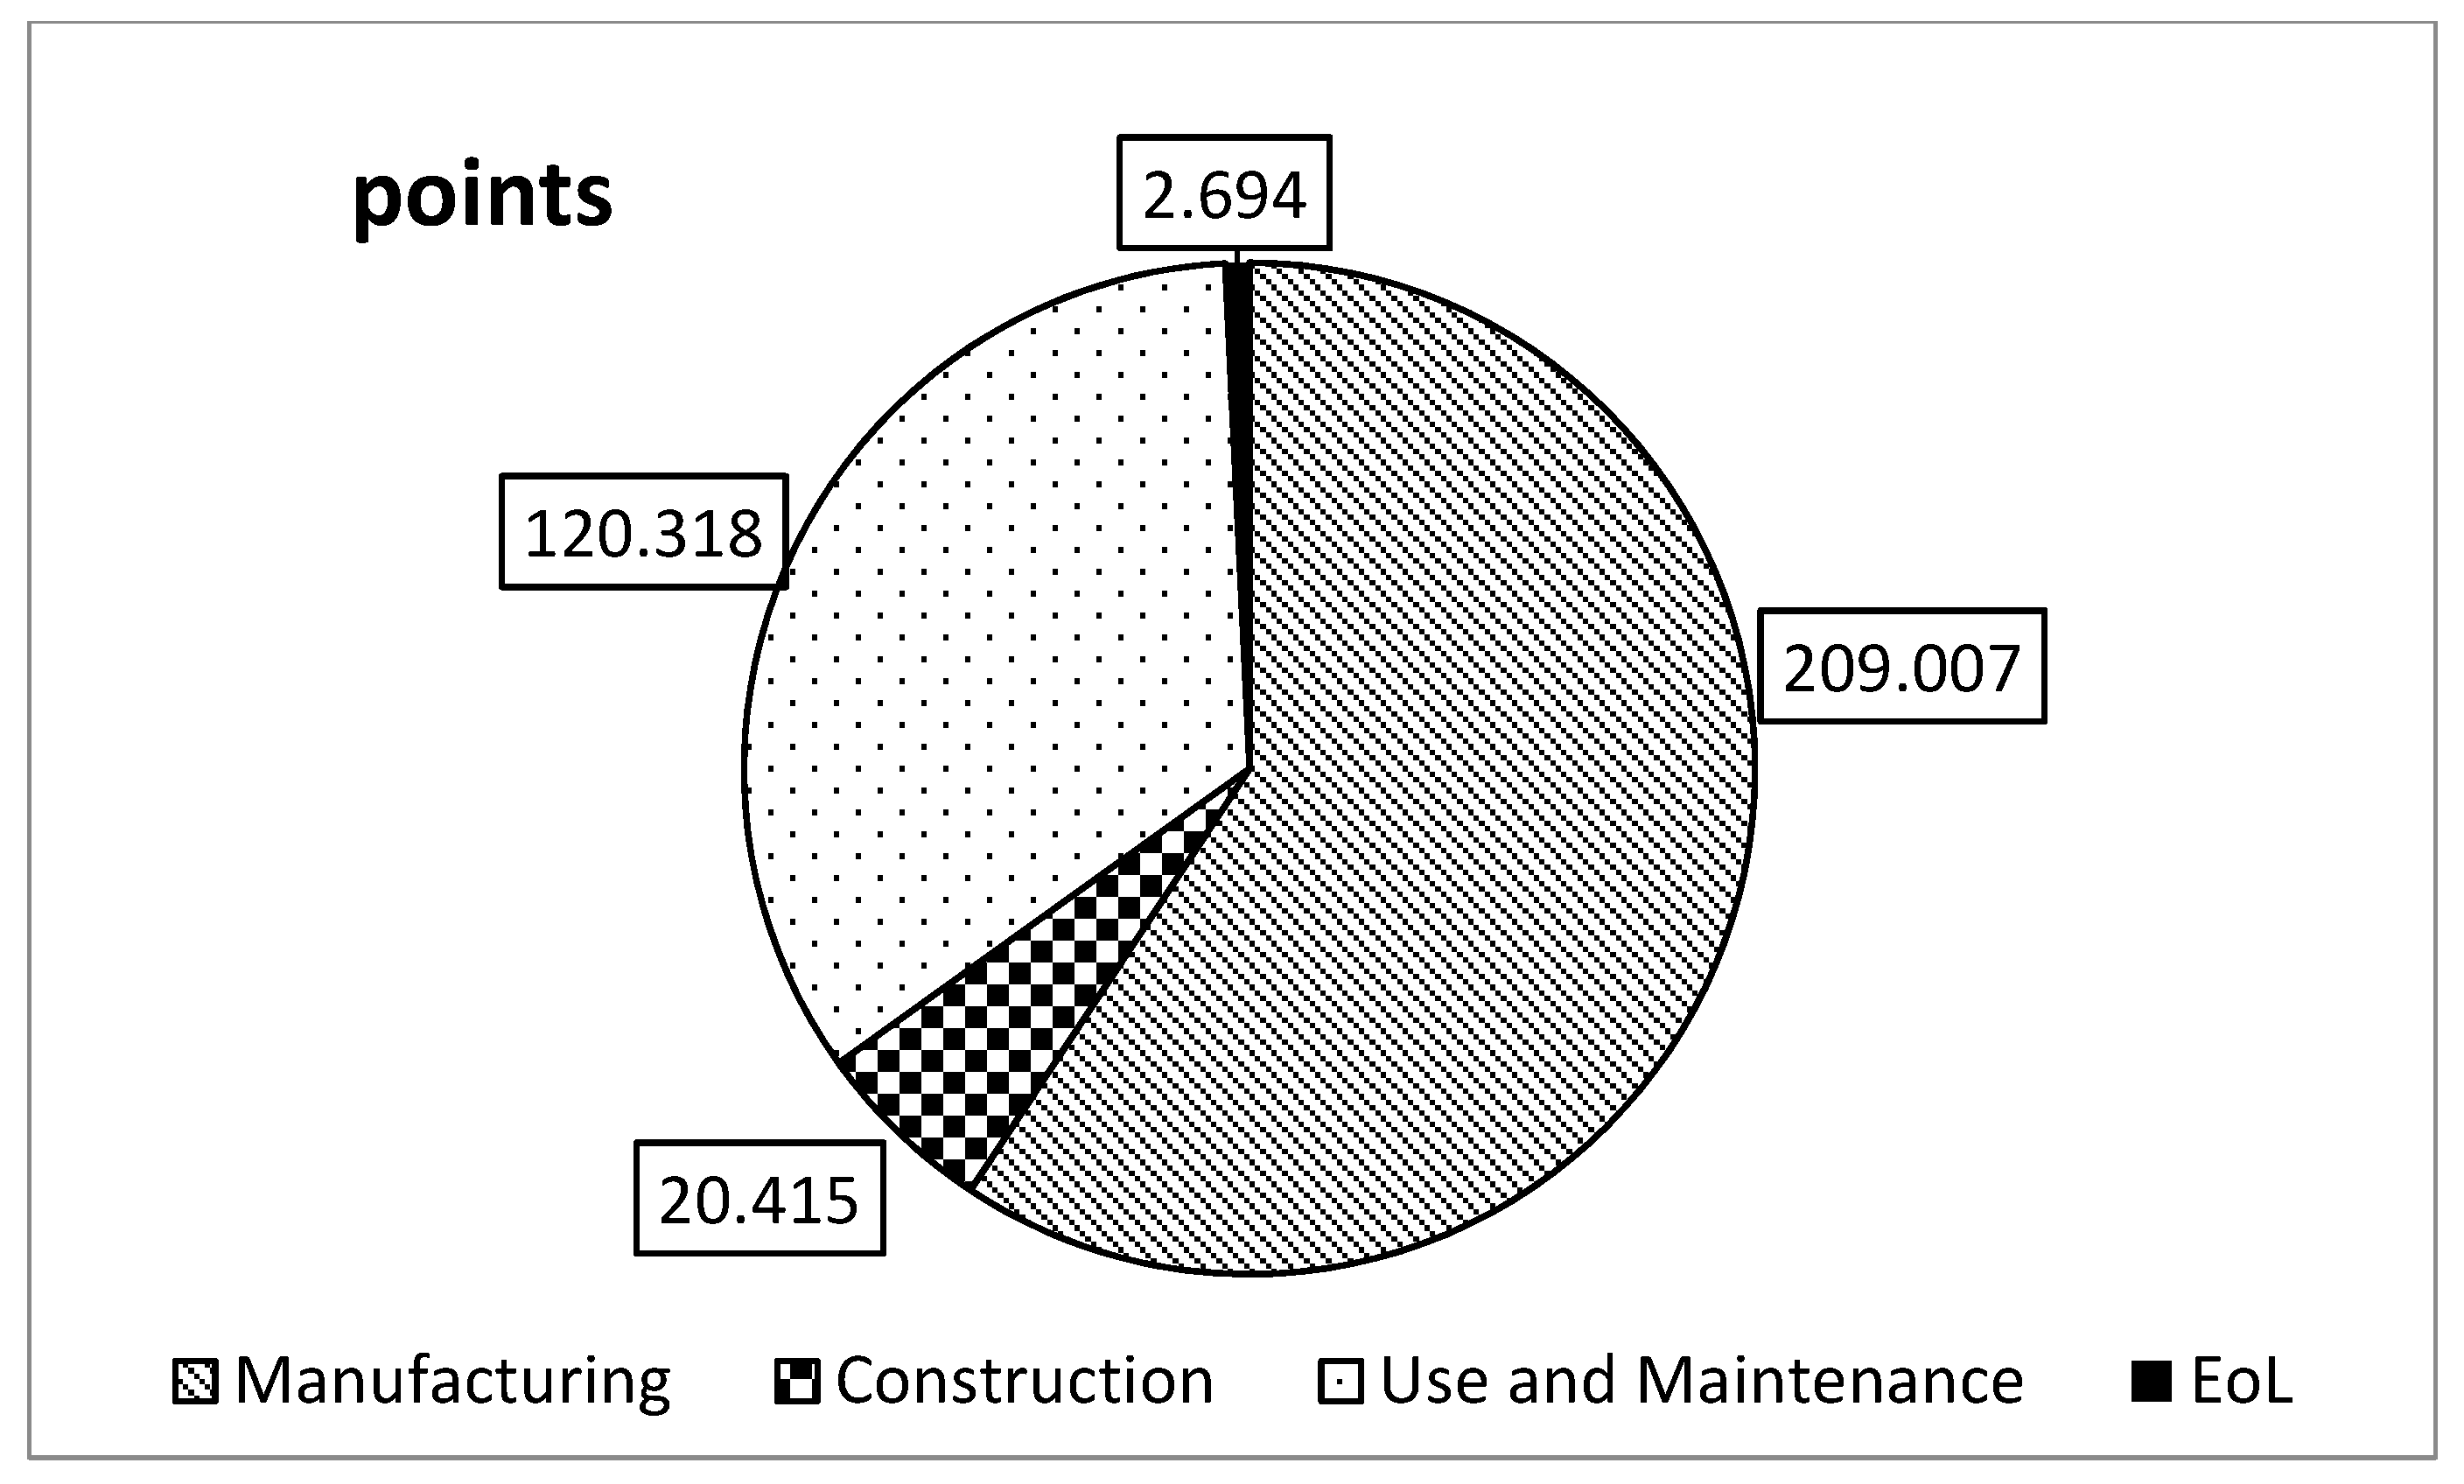
4.3.4. Interpretation
Midpoint Approach
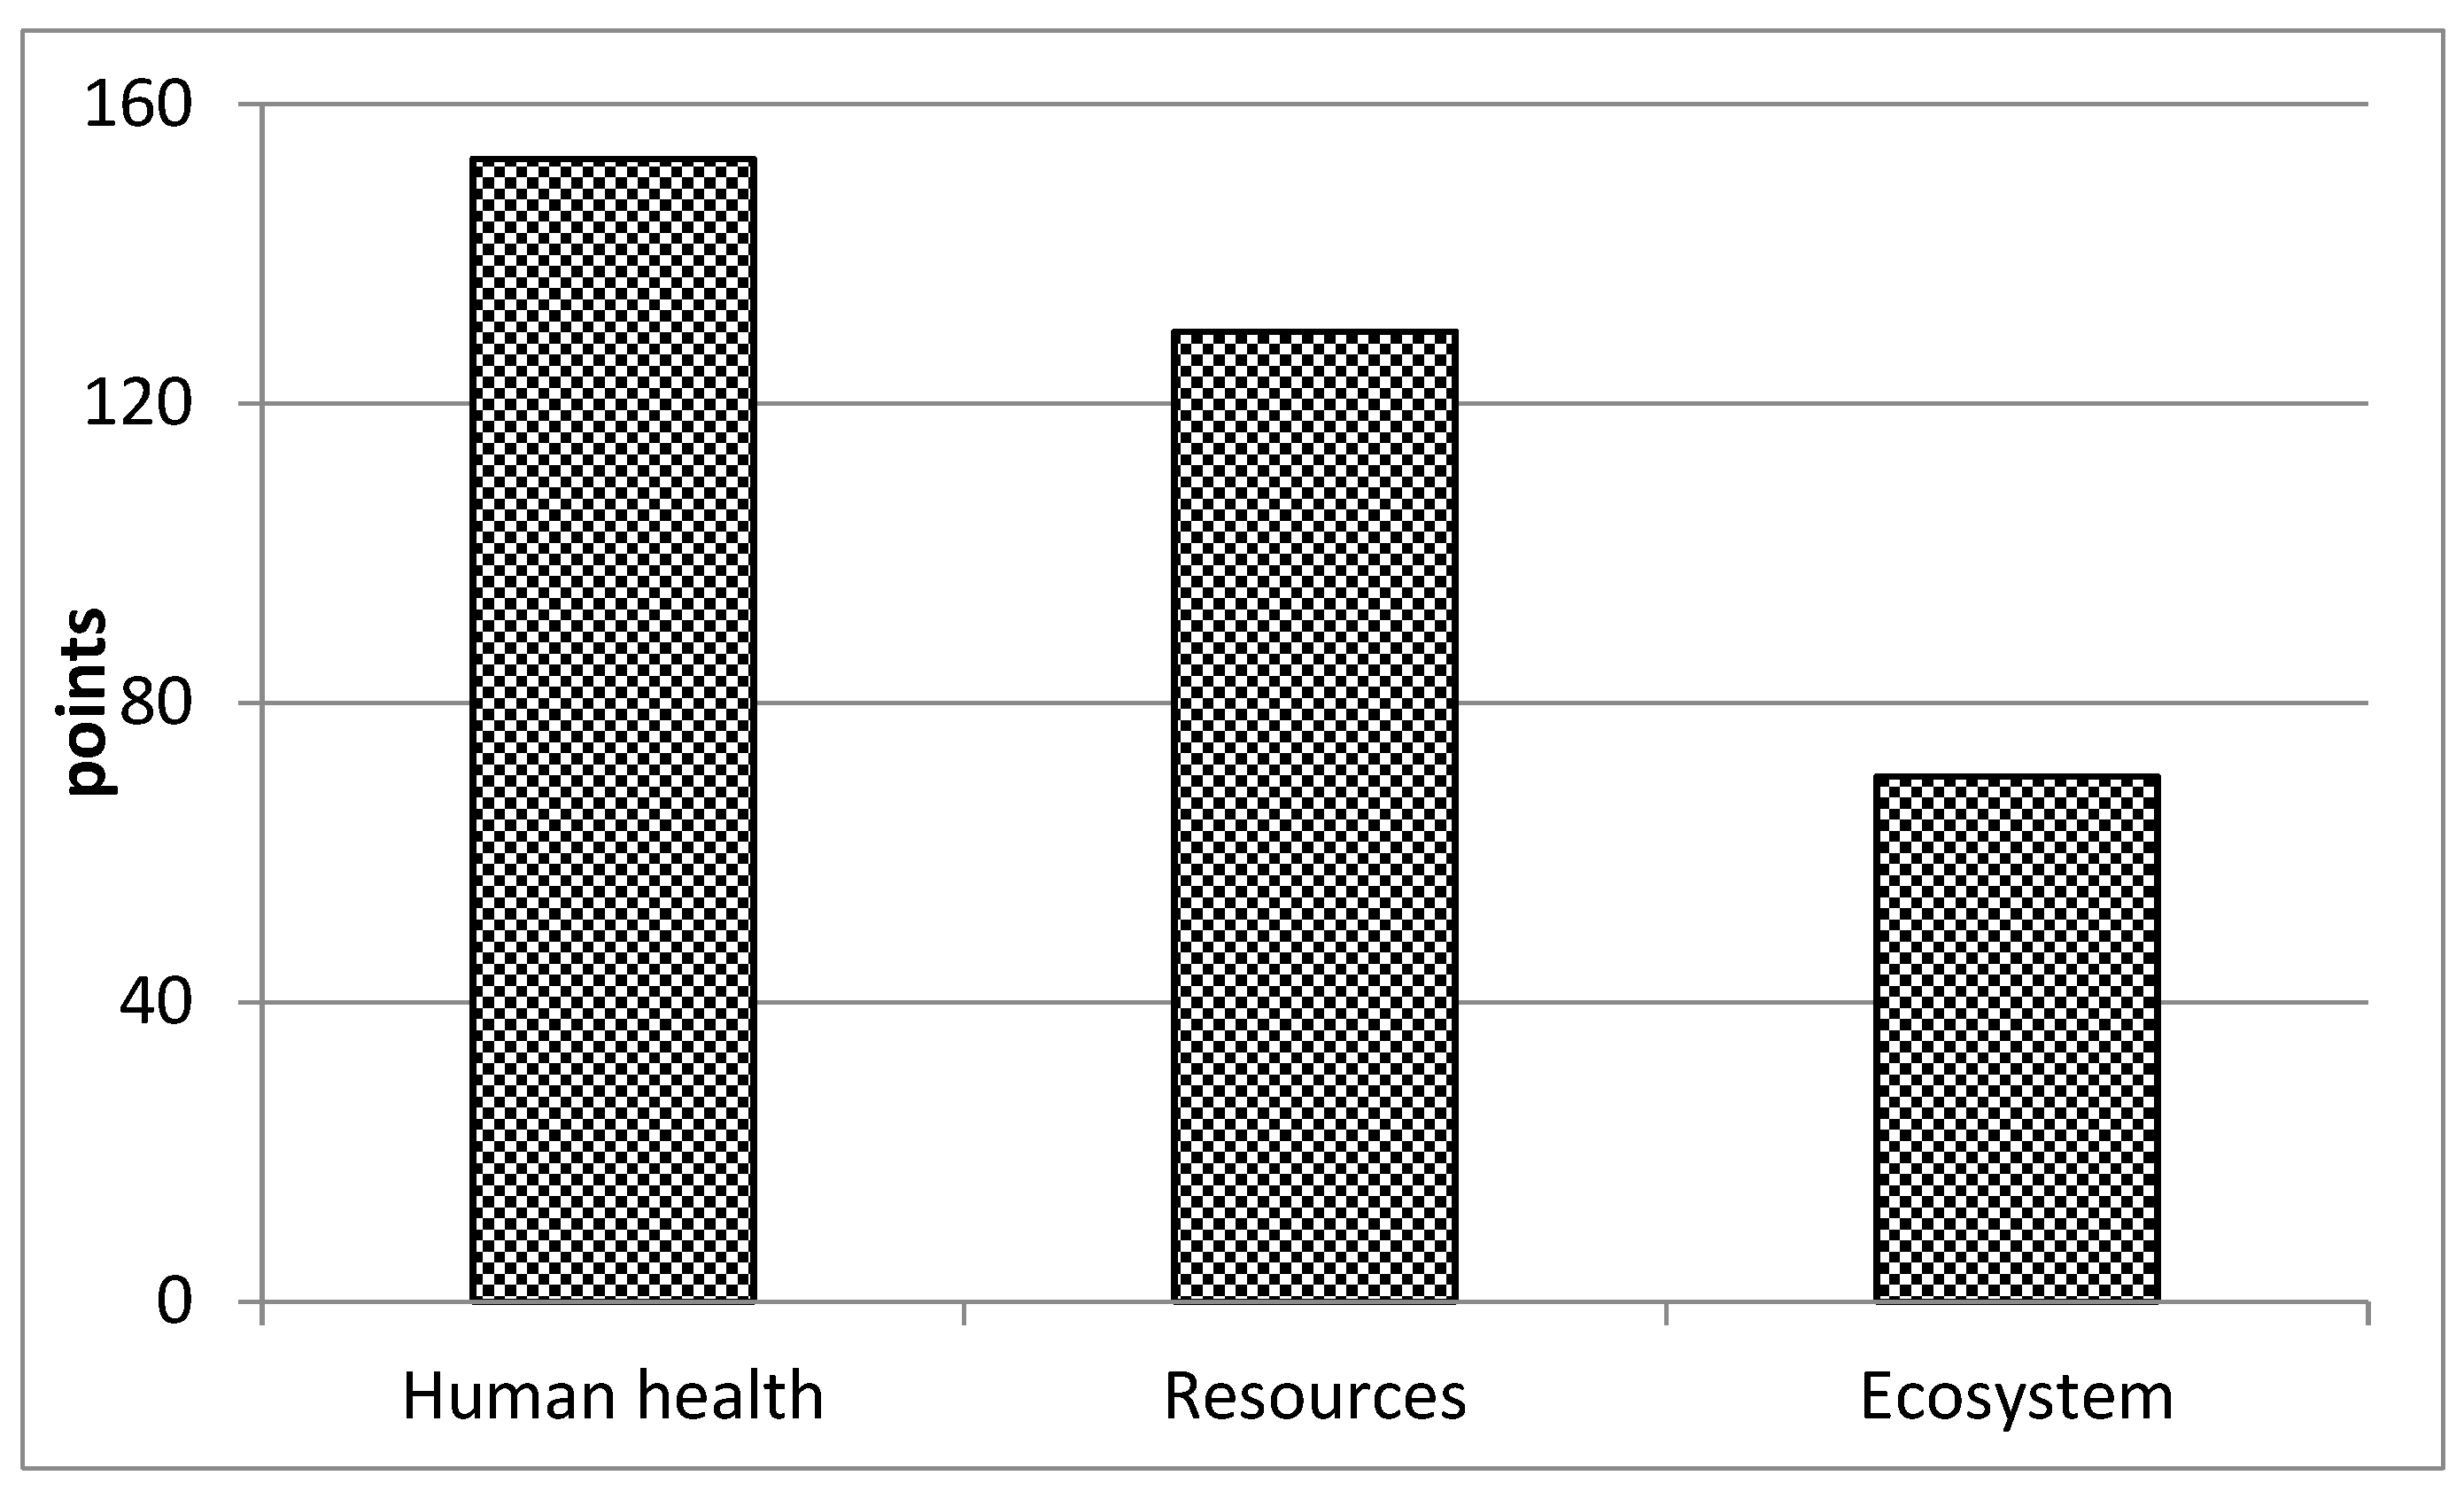
Endpoint Approach
5. Conclusions
Acknowledgments
Author Contributions
Conflicts of Interest
References
- United Nations. World Commission on Environment and Development Our Common Future; United Nations: New York, NY, USA, 1987. [Google Scholar]
- Waas, T.; Hugé, J.; Block, T.; Wright, T.; Benitez-Capistros, F.; Verbruggen, A. Sustainability Assessment and Indicators: Tools in a Decision-Making Strategy for Sustainable Development. Sustainability 2014, 6, 5512–5534. [Google Scholar] [CrossRef]
- Penadés-Plà, V.; García-Segura, T.; Martí, J.; Yepes, V. A review of multi-criteria decision-making methods applied to the sustainable bridge design. Sustainability 2016, 8, 1295. [Google Scholar] [CrossRef]
- Zavadskas, E.K.; Antucheviciene, J.; Vilutiene, T.; Adeli, H. Sustainable decision making in civil engineering, construction and building technology. Sustainability 2018, 10, 14. [Google Scholar] [CrossRef]
- Yepes, V.; Martí, J.V.; García-Segura, T. Cost and CO2 emission optimization of precast-prestressed concrete U-beam road bridges by a hybrid glowworm swarm algorithm. Autom. Constr. 2015, 49, 123–134. [Google Scholar] [CrossRef]
- Camp, C.V.; Assadollahi, A. CO2 and cost optimization of reinforced concrete footings using a hybrid big bang-big crunch algorithm. Struct. Multidiscip. Optim. 2013, 48, 411–426. [Google Scholar] [CrossRef]
- García-Segura, T.; Yepes, V.; Martí, J.V.; Alcalá, J. Optimization of concrete I-beams using a new hybrid glowworm swarm algorithm. Lat. Am. J. Solids Struct. 2014, 11, 1190–1205. [Google Scholar] [CrossRef]
- García-Segura, T.; Yepes, V. Multiobjective optimization of post-tensioned concrete box-girder road bridges considering cost, CO2 emissions, and safety. Eng. Struct. 2016, 125, 325–336. [Google Scholar] [CrossRef]
- García-Segura, T.; Yepes, V.; Frangopol, D.M. Multi-objective design of post-tensioned concrete road bridges using artificial neural networks. Struct. Multidiscip. Optim. 2017, 56, 139–150. [Google Scholar] [CrossRef]
- Laurent, A.; Olsen, S.I.; Hauschild, M.Z. Limitations of carbon footprint as indicator of environmental sustainability. Environ. Sci. Technol. 2012, 46, 4100–4108. [Google Scholar] [CrossRef] [PubMed]
- Du, G.; Karoumi, R. Life cycle assessment of a railway bridge: Comparison of two superstructure designs. Struct. Infrastruct. Eng. 2012, 9, 1149–1160. [Google Scholar] [CrossRef]
- Du, G.; Safi, M.; Pettersson, L.; Karoumi, R. Life cycle assessment as a decision support tool for bridge procurement: Environmental impact comparison among five bridge designs. Int. J. Life Cycle Assess. 2014, 19, 1948–1964. [Google Scholar] [CrossRef]
- Hammervold, J.; Reenaas, M.; Brattebø, H. Environmental life cycle assessment of bridges. J. Bridge Eng. 2013, 18, 153–161. [Google Scholar] [CrossRef]
- Pang, B.; Yang, P.; Wang, Y.; Kendall, A.; Xie, H.; Zhang, Y. Life cycle environmental impact assessment of a bridge with different strengthening schemes. Int. J. Life Cycle Assess. 2015, 20, 1300–1311. [Google Scholar] [CrossRef]
- Zastrow, P.; Molina-Moreno, F.; García-Segura, T.; Martí, J.V.; Yepes, V. Life cycle assessment of cost-optimized buttress earth-retaining walls: A parametric study. J. Clean. Prod. 2017, 140, 1037–1048. [Google Scholar] [CrossRef]
- Penadés-Plà, V.; Martí, J.V.; García-Segura, T.; Yepes, V. Life-cycle assessment: A comparison between two optimal post-tensioned concrete box-girder road bridges. Sustainability 2017, 9, 1864. [Google Scholar] [CrossRef]
- Ecoinvent Center Ecoinvent v3.3. 2016. Available online: http://www.ecoinvent.org/database/older- versions/ecoinvent-33/ecoinvent-33.html (accessed on 15 January 2018).
- Goedkoop, M.; Heijungs, R.; Huijbregts, M.; Schryver, A.D.; Struijs, J.; Van Zelm, R. ReCiPe 2008. A Life Cycle Impact Assessment Which Comprises Harmonised Category Indicators at Midpoint and at the Endpoint Level; Ministerie van Volkshuisvesting, Ruimtleijke Ordening en Milieubeheer: Den Haag, The Netherlands, 2009; Available online: https://www.researchgate.net/profile/Mark_Goedkoop/publication/230770853_Recipe_2008/links/09e4150dc068ff22e9000000.pdf (accessed on 15 January 2018).
- Cohn, M.Z.; Dinovitzer, A.S. Application of structural optimization. J. Struct. Eng. 1994, 120, 617–650. [Google Scholar] [CrossRef]
- Blum, C.; Puchinger, J.; Raidl, G.R.; Roli, A. Hybrid metaheuristics in combinatorial optimization: A survey. Appl. Soft Comput. 2011, 11, 4135–4151. [Google Scholar] [CrossRef]
- Martí, J.V.; García-Segura, T.; Yepes, V. Structural design of precast-prestressed concrete U-beam road bridges based on embodied energy. J. Clean. Prod. 2016, 120, 231–240. [Google Scholar] [CrossRef]
- International Organization for Standardization (ISO). Environmental Management—Life Cycle Assessment—Principles and Framework; ISO: Geneva, Switzerland, 2006. [Google Scholar]
- Yi, S.; Kurisu, K.H.; Hanaki, K.; Hanaki, K. Life cycle impact assessment and interpretation of municipal solid waste management scenarios based on the midpoint and endpoint approaches. Int. J. Life Cycle Assess. 2011, 16, 652–668. [Google Scholar] [CrossRef]
- European Committee. European Committee for Standardization EN 206-1 Concrete—Part1: Specification, Performance, Production and Conformity; European Committee: Brussels, Belgium, 2000. [Google Scholar]
- Ministerio de Fomento. EHE-08: Code on Structural Concrete; Ministerio de Fomento: Madrid, Spain, 2008. [Google Scholar]
- Ministerio de Fomento. IAP-11: Code on the Actions for the Design of Road Bridges; Ministerio de Fomento: Madrid, Spain, 2011. [Google Scholar]
- Moscato, P. On Evolution, Search, Optimization, Genetic Algorithms and Martial Arts—Towards Memetic Algorithms; California Institute of Technology: Pasadena, CA, USA, 1989. [Google Scholar]
- Dawkins, R. The Selfish Gene; Claarendon Press: Oxford, UK, 1976. [Google Scholar]
- Catalonia Institute of Construction Technology. BEDEC PR/PCT ITEC Material Database 2016. Available online: https://www.itec.cat/nouBedec.c/bedec.aspx (accessed on 15 January 2018).
- García-Segura, T.; Yepes, V.; Frangopol, D.M.; Yang, D.Y. Lifetime reliability-based optimization of post-tensioned box-girder bridges. Eng. Struct. 2017, 145, 381–391. [Google Scholar] [CrossRef]
- Lagerblad, B. Carbon Dioxide Uptake during Concrete Life Cycle—State of the Art; Cement och Betong Institutet: Stockholm, Sweeden, 2005. [Google Scholar]
- García-Segura, T.; Yepes, V.; Alcalá, J. Life cycle greenhouse gas emissions of blended cement concrete including carbonation and durability. Int. J. Life Cycle Assess. 2014, 19, 3–12. [Google Scholar] [CrossRef]
- Frischknecht, R.; Jungbluth, N.; Althaus, H.-J.; Doka, G.; Dones, R.; Heck, T.; Hellweg, S.; Hischier, R.; Nemecek, T.; Rebitzer, G.; et al. The ecoinvent database: Overview and methodological framework. Int. J. Life Cycle Assess. 2005, 10, 3–9. [Google Scholar] [CrossRef]
- Ciroth, A.; Muller, S.; Weidema, B.; Lesage, P. Empirically based uncertainty factors for the pedigree matrix in ecoinvent. Int. J. Life Cycle Assess. 2016, 21, 1339–1348. [Google Scholar] [CrossRef]
- Itoh, Y.; Kitagawa, T. Using CO2 emission quantities in bridge lifecycle analysis. Eng. Struct. 2003, 25, 565–577. [Google Scholar] [CrossRef]
- Bouhaya, L.; Le Roy, R.; Feraille-Fresnet, A. Simplified environmental study on innovative bridge structure. Environ. Sci. Technol. 2009, 43, 2066–2071. [Google Scholar] [CrossRef] [PubMed]


| Limit States |
|---|
| Flexure |
| Vertical shear |
| Longitudinal shear |
| Punching shear |
| Torsion |
| Torsion combined with flexure and shear |
| Fatigue |
| Crack width <0.2 mm |
| Compression and tension stress. Decompression in post-tensioned steel depth |
| Deflection for the quasipermanent combination <1/1000 |
| Precast Concrete Beam | Concrete Slab | |
|---|---|---|
| Strength (MPa) | 35 | 40 |
| Reinforcing steel (kg/m2) | 12.52 | 23.92 |
| Prestressed steel (kg/m2) | 10.53 | – |
| Concrete (m3/m2) | 0.1117 | 0.1797 |
| Cement (kg/m3) | 300 | 320 |
| Gravel (kg/m3) | 848 | 829 |
| Sand (kg/m3) | 1088 | 1102 |
| Water (kg/m3) | 160 | 162 |
| Superplasticizer (kg/m3) | 4 | 5 |
| Acronym | Reference Unit | Manufacturing | Construction | Use and Maintenance | EoL | ||||
|---|---|---|---|---|---|---|---|---|---|
| m | cv (%) | m | cv (%) | m | cv (%) | m | cv (%) | ||
| ALO | m2 × year | 79.76 | 3.77% | 2.59 | 7.46% | 6.16 | 14.09% | 1.73 | 6.84% |
| GWP | kg CO2 eq | 1838.55 | 16.86% | 267.85 | 9.61% | 1095.77 | 5.29% | −117.68 | −6.97% |
| FD | kg oil eq | 316.90 | 6.90% | 51.48 | 17.52% | 394.59 | 4.94% | 11.00 | 16.57% |
| FEPT | kg 1,4-DB eq | 38.15 | 2.93% | 0.93 | 18.86% | 8.53 | 26.70% | 0.19 | 7.94% |
| FEP | kg P eq | 0.82 | 4.19% | 0.01 | 10.56% | 0.08 | 14.00% | 0.01 | 7.16% |
| HTP | kg 1,4-DB eq | 1470.92 | 3.01% | 22.58 | 16.26% | 110.30 | 16.36% | 5.77 | 7.80% |
| IRP | kg U235 eq | 244.70 | 12.29% | 18.96 | 10.35% | 78.57 | 5.22% | 10.22 | 7.14% |
| MEPT | kg 1,4-DB eq | 37.90 | 2.92% | 0.96 | 17.91% | 7.65 | 26.08% | 0.17 | 8.01% |
| MEP | kg N eq | 0.29 | 8.79% | 0.05 | 20.79% | 0.49 | 2.90% | 0.01 | 22.26% |
| MD | kg Fe eq | 926.19 | 3.22% | 5.34 | 17.35% | 49.38 | 11.06% | 0.77 | 22.90% |
| NLT | m2 | 0.24 | 8.28% | 0.05 | 18.78% | 0.43 | 4.67% | 0.01 | 24.03% |
| ODP | kg CFC-11 eq | 0.00 | 8.59% | 0.00 | 17.82% | 0.00 | 4.61% | 0.00 | 17.63% |
| PMFP | kg PM10 eq | 3.84 | 5.67% | 0.50 | 19.84% | 4.33 | 3.12% | 0.11 | 20.31% |
| POFP | kg NMVOC | 5.76 | 9.12% | 1.51 | 21.63% | 14.03 | 2.77% | 0.26 | 26.69% |
| TAP | kg SO2 eq | 5.30 | 8.90% | 1.00 | 19.21% | 8.40 | 3.12% | 0.25 | 16.97% |
| TETP | kg 1,4-DB eq | 0.45 | 4.60% | 0.02 | 27.71% | 0.06 | 12.68% | 0.00 | 15.79% |
| ULO | m2 × year | 23.29 | 9.86% | 3.50 | 29.32% | 6.75 | 21.00% | 0.17 | 8.93% |
| WD | m3 | 8807.20 | 8.35% | 219.49 | 7.63% | 625.36 | 11.89% | 146.17 | 6.83% |
| Damage Category | Reference Unit | Manufacturing | Construction | Use and Maintenance | EoL | ||||
|---|---|---|---|---|---|---|---|---|---|
| m | cv (%) | m | cv (%) | m | cv (%) | m | cv (%) | ||
| Human health | DALY | 2.03 × 10⁻⁵ | 11.69% | 2.36 × 10⁻⁶ | 11.68% | 1.01 × 10⁻⁵ | 4.89% | −8.86 × 10⁻⁷ | 11.70% |
| Resource | $ | 1.19 × 10² | 4.01% | 8.78 × 100 | 16.90% | 6.91 × 101 | 5.60% | 1.88 × 100 | 16.86% |
| Ecosystem | Species per year | 4.58 × 10⁻³ | 13.53% | 5.18 × 10⁻⁴ | 9.75% | 2.75 × 10⁻³ | 6.26% | −1.33 × 10⁻⁴ | 7.64% |
© 2018 by the authors. Licensee MDPI, Basel, Switzerland. This article is an open access article distributed under the terms and conditions of the Creative Commons Attribution (CC BY) license (http://creativecommons.org/licenses/by/4.0/).
Share and Cite
Penadés-Plà, V.; García-Segura, T.; Martí, J.V.; Yepes, V. An Optimization-LCA of a Prestressed Concrete Precast Bridge. Sustainability 2018, 10, 685. https://doi.org/10.3390/su10030685
Penadés-Plà V, García-Segura T, Martí JV, Yepes V. An Optimization-LCA of a Prestressed Concrete Precast Bridge. Sustainability. 2018; 10(3):685. https://doi.org/10.3390/su10030685
Chicago/Turabian StylePenadés-Plà, Vicent, Tatiana García-Segura, José V. Martí, and Víctor Yepes. 2018. "An Optimization-LCA of a Prestressed Concrete Precast Bridge" Sustainability 10, no. 3: 685. https://doi.org/10.3390/su10030685
APA StylePenadés-Plà, V., García-Segura, T., Martí, J. V., & Yepes, V. (2018). An Optimization-LCA of a Prestressed Concrete Precast Bridge. Sustainability, 10(3), 685. https://doi.org/10.3390/su10030685