Article

Visualizing the Academic Discipline of Knowledge Management

1
Faculty of Management and Economics, Dalian University of Technology, Dalian 116024, China
2
Research Center of Science Technology and Society, Dalian University, Dalian 116622, China
*
Author to whom correspondence should be addressed.
Sustainability 2018, 10(3), 682; https://doi.org/10.3390/su10030682
Submission received: 29 December 2017 / Revised: 15 February 2018 / Accepted: 18 February 2018 / Published: 2 March 2018

Abstract

:
The aim of this paper was to evaluate the research status of knowledge management (KM) and identify the characteristics of KM in the literature. We selected and studied in detail 7628 original research articles from the Web of Science from 1974 to 2017. Although many studies have contributed to the evolution of the KM domain, our results showed that a comprehensive bibliometric and visualization investigation was required. The literature on KM has grown rapidly since the 1970s. The United States of America, as the original contributing country, has also internationally collaborated the most in this field of study. The National Cheng Kung University has made the highest number of contributions. The majority of authors contributed a small number of publications. Additionally, the most common category in KM research was management. The main publications for KM research include Journal of Knowledge Management, and Knowledge Management Research & Practice. A keywords analysis determined that “knowledge sharing”, “innovation”, “ontology”, and “knowledge management” were consistent hotspots in knowledge management research. Through a document co-citation analysis, the intellectual structures of knowledge management were defined, and four emerging trends were identified that focus on new phenomenon, the practice of knowledge management, small and medium enterprises (SMEs) management based on knowledge perspective, innovation and performance, and big data-enabled KM. We also provide eight research questions for future studies. Our results will benefit academics, researchers, and research students who want to rapidly obtain an overview of knowledge management research. This study can also be a starting point for communication between academics and practitioners.

1. Introduction

With the advent of the era of the knowledge economy, knowledge management (KM) has become an important factor for promoting sustainable development of organizations and the economy. KM is also an increasingly important topic in the cross-disciplinary fields of management, computer science, and information science. KM has considerably progressed, attracting attention from researchers, practitioners, and policy-makers [1,2,3]. KM involves a series of managing activities that mainly concern the adoption, creation, storage, transfer, sharing, and application of knowledge. These activities could be divided into two main macro-processes: knowledge management adoption and knowledge management development [4,5,6,7]. The development process includes five phases: creation, storage, transfer, sharing, and application [7,8,9]. The intellectual antecedents of knowledge management can be traced back to the classical Greek era, which defined the epistemological debate in Western philosophy. Modern KM research can be traced back to the mid-1970s [10]. Many researchers have contributed to the evolution of knowledge management [10,11]. In the 1980s, some new aspects of knowledge management, including knowledge acquisition, knowledge engineering, and knowledge-based systems, contributed by artificial intelligence research, systematically developed the field of knowledge management [12]. In the 1990s, knowledge management initiatives were flourishing with the help of information technology (IT). KM has helped to address and solve some of the challenges faced by Total Quality Management (TQM) and business process re-engineering [13]. The importance of managing knowledge has become a focus for all types of organizations, as KM is increasingly impacting large companies, SMEs, startups, supply chains, etc. In addition, the development of big data has created new issues for knowledge management [14,15,16,17,18,19].
Given the depth and breadth of KM practice, the numbers of publications in this field are growing rapidly. Professional journals, such as the Journal of Knowledge Management, Knowledge Management Research & Practice, Academy of Management Review, Strategic Management Journal, Sloan Management Review, Harvard Business Review, and the Journal of the Association for Information Science and Technology and Scientometrics, are now dedicated to different aspects of KM [20,21]. Largely due to the widespread use of KM, efforts have been increasingly invested into tracing the change trajectory of KM research, and its disciplinary characteristics.
However, two main problems remain evident in the existing reviews in the field of KM: some studies draw their conclusions based on subjective judgment, which may create controversies due to the limitations of the researcher's personal knowledge, and the previous qualitative analyses, such as bibliometric and scientometric analyses or systematic reviews, have been limited in terms research scope, timeframe, analytical unit, or focus on specific KM themes [11,18,22]. A bibliometric and visualization perspective of prior publications is lacing. Therefore, a bibliometric and visualizing investigation of the global KM research status is important for understanding the research advances and emerging trends. Unlike previous reviews of KM research, we conducted a bibliometric visualization review and obtained an overall picture of this fast-growing field between 1974 and 2017.
The objectives of this study are as follows. First, we wanted to identify the distribution of KM research including publications over time, countries and territories, institutes, authors, sources, and categories in KM-related research. Second, through co-word analysis of the keywords, we wanted to determine the main research topics. Third, we provided an of KM Intellectual Structure by hiring Citespace. Finally, the ultimate goal of this paper was to identify emerging trends.
To achieve these goals, we posed the following eight questions:
(1)
What are the characteristics and growth trends of KM publications?
(2)
What are the international collaborating countries that have the most KM research?
(3)
Where are the active contributors located?
(4)
What are the characteristics of the authorship distribution?
(5)
What are the core KM disciplines and journals?
(6)
What are the core KM research keywords?
(7)
What is the intellectual structure of KM research?
(8)
What are the emerging trends in KM research?
Based on the answers to these eight questions, these results obtained in this study benefit academics, researchers, and management students who want to quickly obtain an overview of knowledge management research. Our findings could assist researchers to better understand the current research progress in the KM domain and to identify the bibliometric characters of KM research. Our results about the emerging trends of KM will help researchers choose valuable research topics in the future. In addition, the research results can be a starting point for communication between academics and practitioners.

2. Related Work

Several studies investigated the performance and characteristics of knowledge management, with a wide variety of results. Styhre examined the KM research and found that KM is moving in the progressive direction [23]. Butler analyzed the KM field and suggested that KM could be divided into general, strategy-oriented, information-oriented, human-oriented, and process-oriented perspectives [24]. Lee and Chen visualized the trends in KM with KM data prior to 2006, and determined the 10 most important current research trends in KM [25]. Lee and Chen also revealed the research themes and trends in KM from 1995 to 2010 [26]. Li et al. analyzed the KM research status in China, and obtained some new findings by comparing current with previous KM-related research [27]. Gu found that KM had become an interdisciplinary theory developing on the boundaries of a variety of scientific disciplines [11]. Yogesh et al. provided an overview of 1043 articles for the period of 1974 to 2008, suggesting that KM systems and KM environment were the two most popular topics [28]. Serenko and Bontis ranked the knowledge management and intellectual capital academic journals, and found the top five academic journals in this field [29]. Serenko and Dumay found that the KM discipline is at the pre-science stage and the majority of KM citations exhibited a bimodal citation distribution peak [30]. Serenko applied a meta-analysis technique to integrate the overall findings of KM articles [31]. Akhavan et al. found that the most cited articles in KM were from the United States and the United Kingdom [32]. Considering the literature outlined above, some limits in terms of with the choice of research scope, timeframe, and analytical unit were noted. A bibliometric and visualization perspective of prior publications was also lacking.
Thus, we completed a wider investigation of the challenges faced by KM by profiling a large set of existing KM publications in terms of publication year, author, country, keywords, intelligence structure, and emerging trends. By doing this, we provide a comprehensive investigation of KM research.

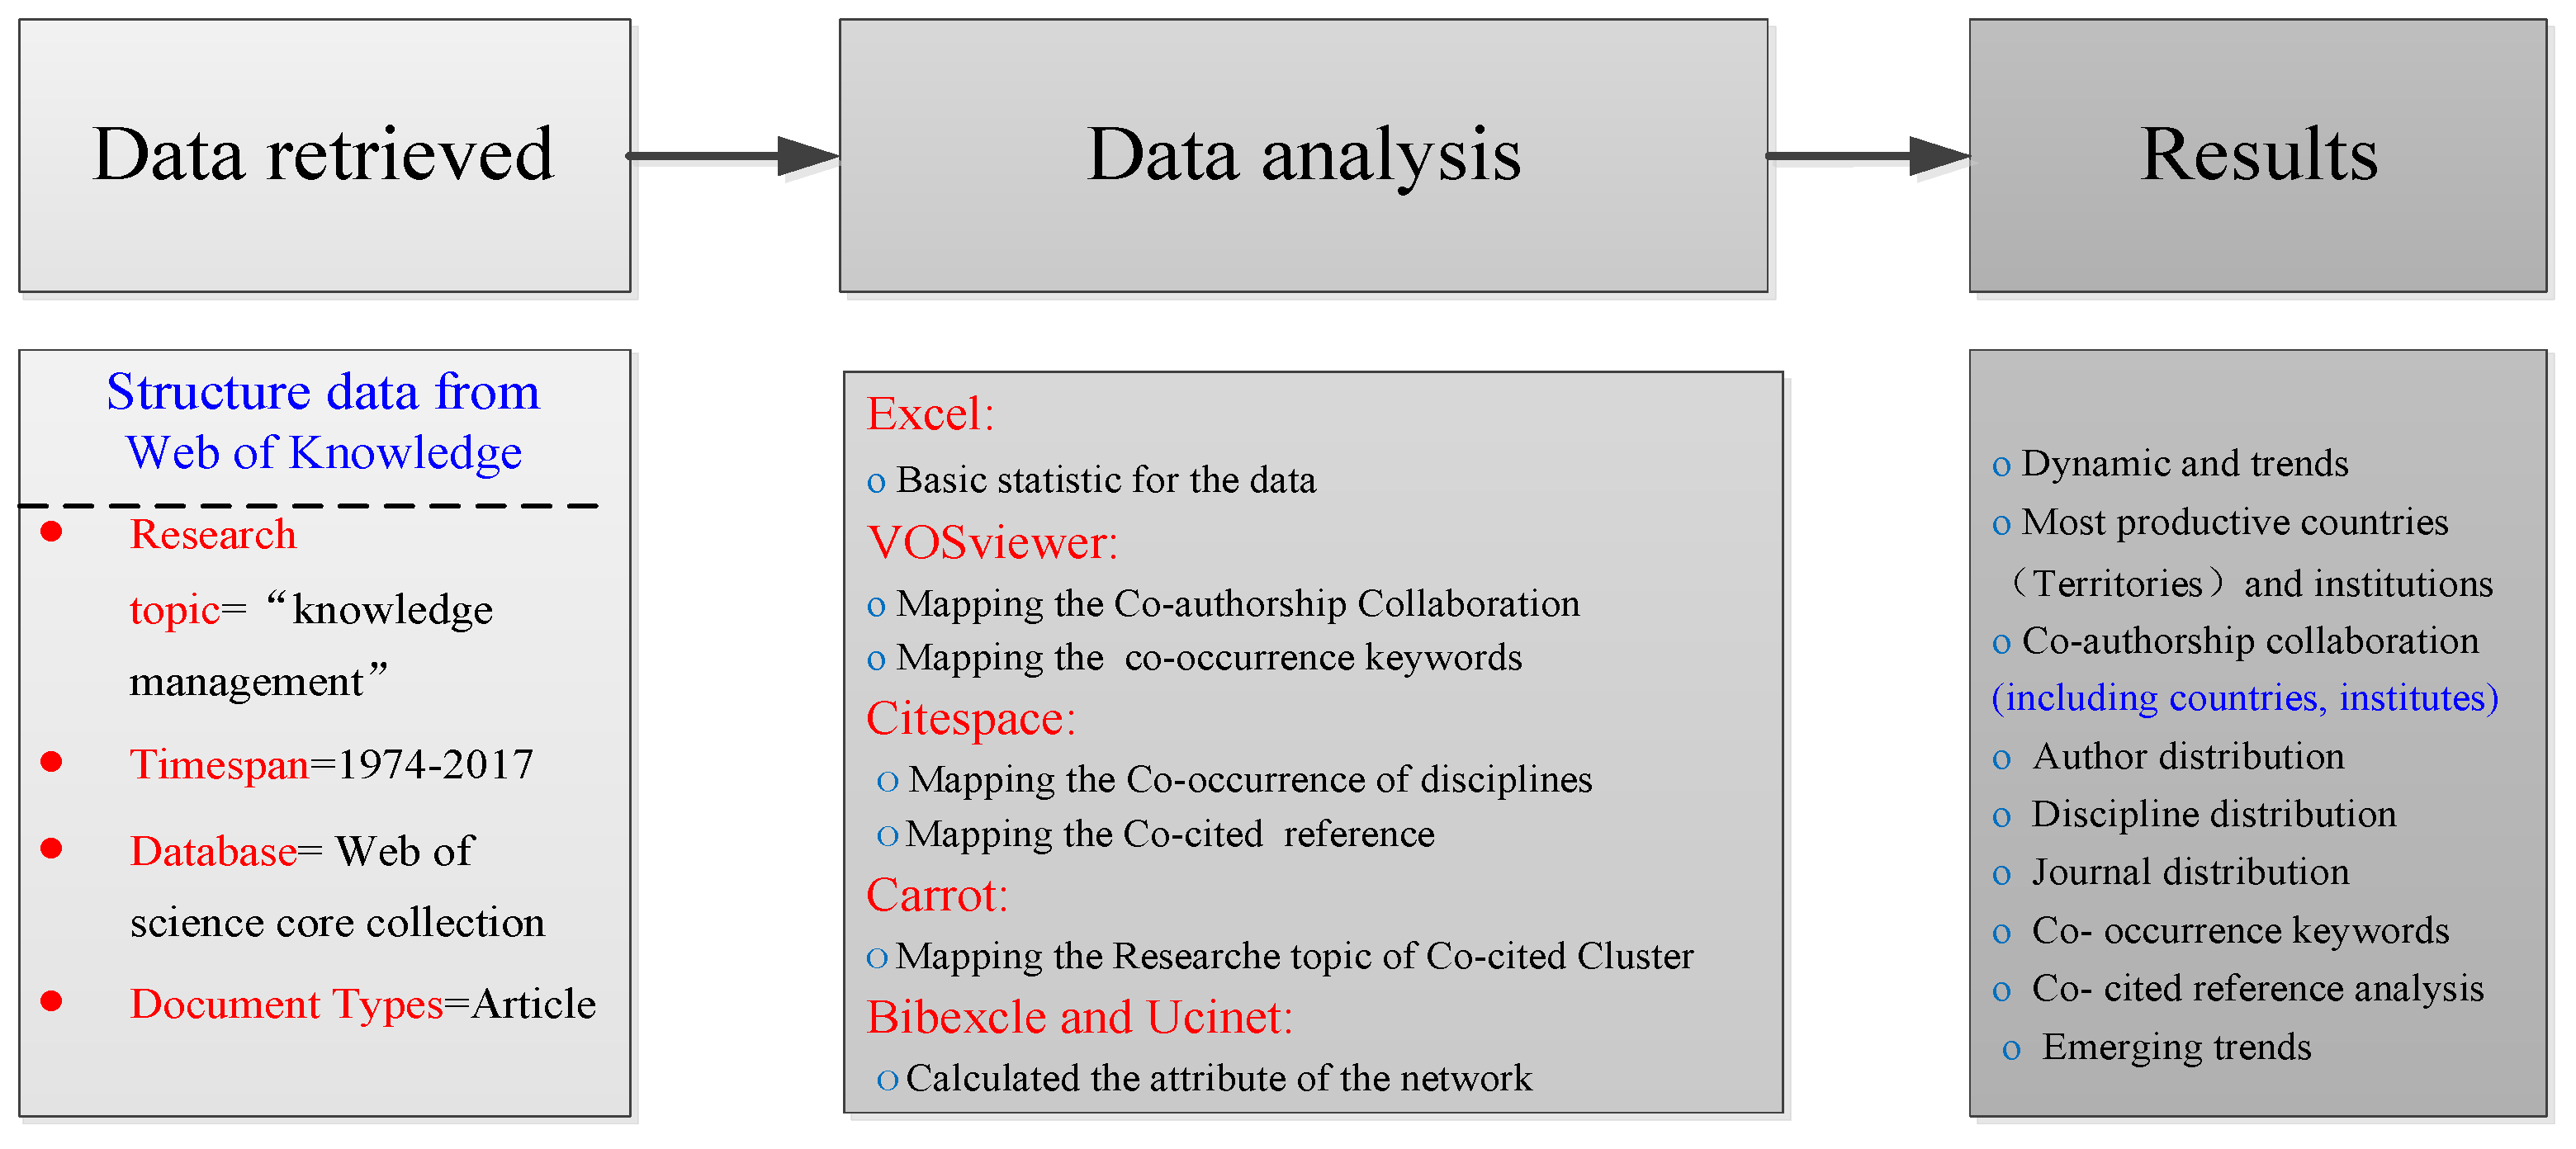
3. Materials and Methods

The data used for this study were obtained from the Web of Science Core collection database, a Web-based user interface of Web of Knowledge developed by Clarivate Analytics. We adapted the same search strategy used by Lee and Chen to search for papers with the term “knowledge management” in titles, abstracts, or indexing terms [25]. As a result, we obtained 19,393 records prior to the end of 2017. For this study, we considered only articles, because they are the higher ranked scientific contributions. Although the reviews receive a greater number of citations, their scientific contribution is less important, and may introduce considerable noise into our analysis because they often contain too many topics [20,21]. After filtering out the less representative record types, the dataset was reduced to 7628 original research articles that were assumed to be in some way related to KM.
Bibliometric analysis is an effective way to investigate and examine performance in one knowledge domain [33]. Bibliometric analysis can be defined as a statistical method of determining the quantitative features of bibliographic information, literature, articles, and journals. The popularity of bibliometric studies is mainly due to the intrinsic characteristics of the raw data. Among the methodological options for an investigation study, bibliometric approaches have received increasing amounts of attention in various areas of research. Bibliometric studies have been completed for information systems, organizational studies, marketing-related subjects, operations management, and strategic management [34]. These works present an overview of the evolution of the publication years, document types, number of citations, most cited papers, influential authors, institutions, and countries. In other studies, visualization tools were used to provide a map of the bibliometric results. Detecting emerging research trends has been a focus for many researchers [35]. Various methods have been advocated for the purpose of detecting emerging research trends, such as historiography mapping [36,37], document co-citation [38], author co-citation [39], co-word analysis [40], and journal mapping [41].
Bibliometric mapping is usually used to display a structural overview of an academic field or a journal [42]. Some widespread mapping techniques have been designed and developed as computer programs like VOSviewer and Citespace. Compared with other quantitative literature review methods, a bibliometric review is usually used to display the quantitative characteristics of an academic field. Conversely, a systematic review provides an in-depth study and highlights strengths and weaknesses in the literature, evidence research gaps, and identifies appropriate research questions. To achieve objective of this study of investigating and visualizing the global research status in the KM field, we chose the bibliometric and bibliometric mapping method.
In this study, we present a bibliometric profile of KM. In addition, some research tools were used in this study. For example, we used Bibexcel to construct a co-occurrence matrix [43]. Citespace was used for co-citation analysis [44]. Ucinet [45] and Vosviewer [46] were used for social network analysis and visualization and Carrot was used for cluster analysis [47]. Other tools such as Excel were also used for basic statistical analysis and visualization of the bibliometric results. To evaluate the present KM situation, some indicters were used in this paper. For instance, frequency is one of the most commonly used indicators in the bibliometric knowledge domain and is considered the main indicator that highlights the present situation in a research field. Some network indicators were also used in this paper, such as degree centrality and betweenness centrality [45]. The reason for choosing these indicators was that they were also the most commonly used indicators in knowledge network analysis. For the emerging trends analysis, a method was introduced by Chen [44] that combines modularity and a burst index. This method is widely used and has been proven to be able to detect the emerging research trends in other domain. The overall approach and methodology is shown in Figure 1.

4. Results

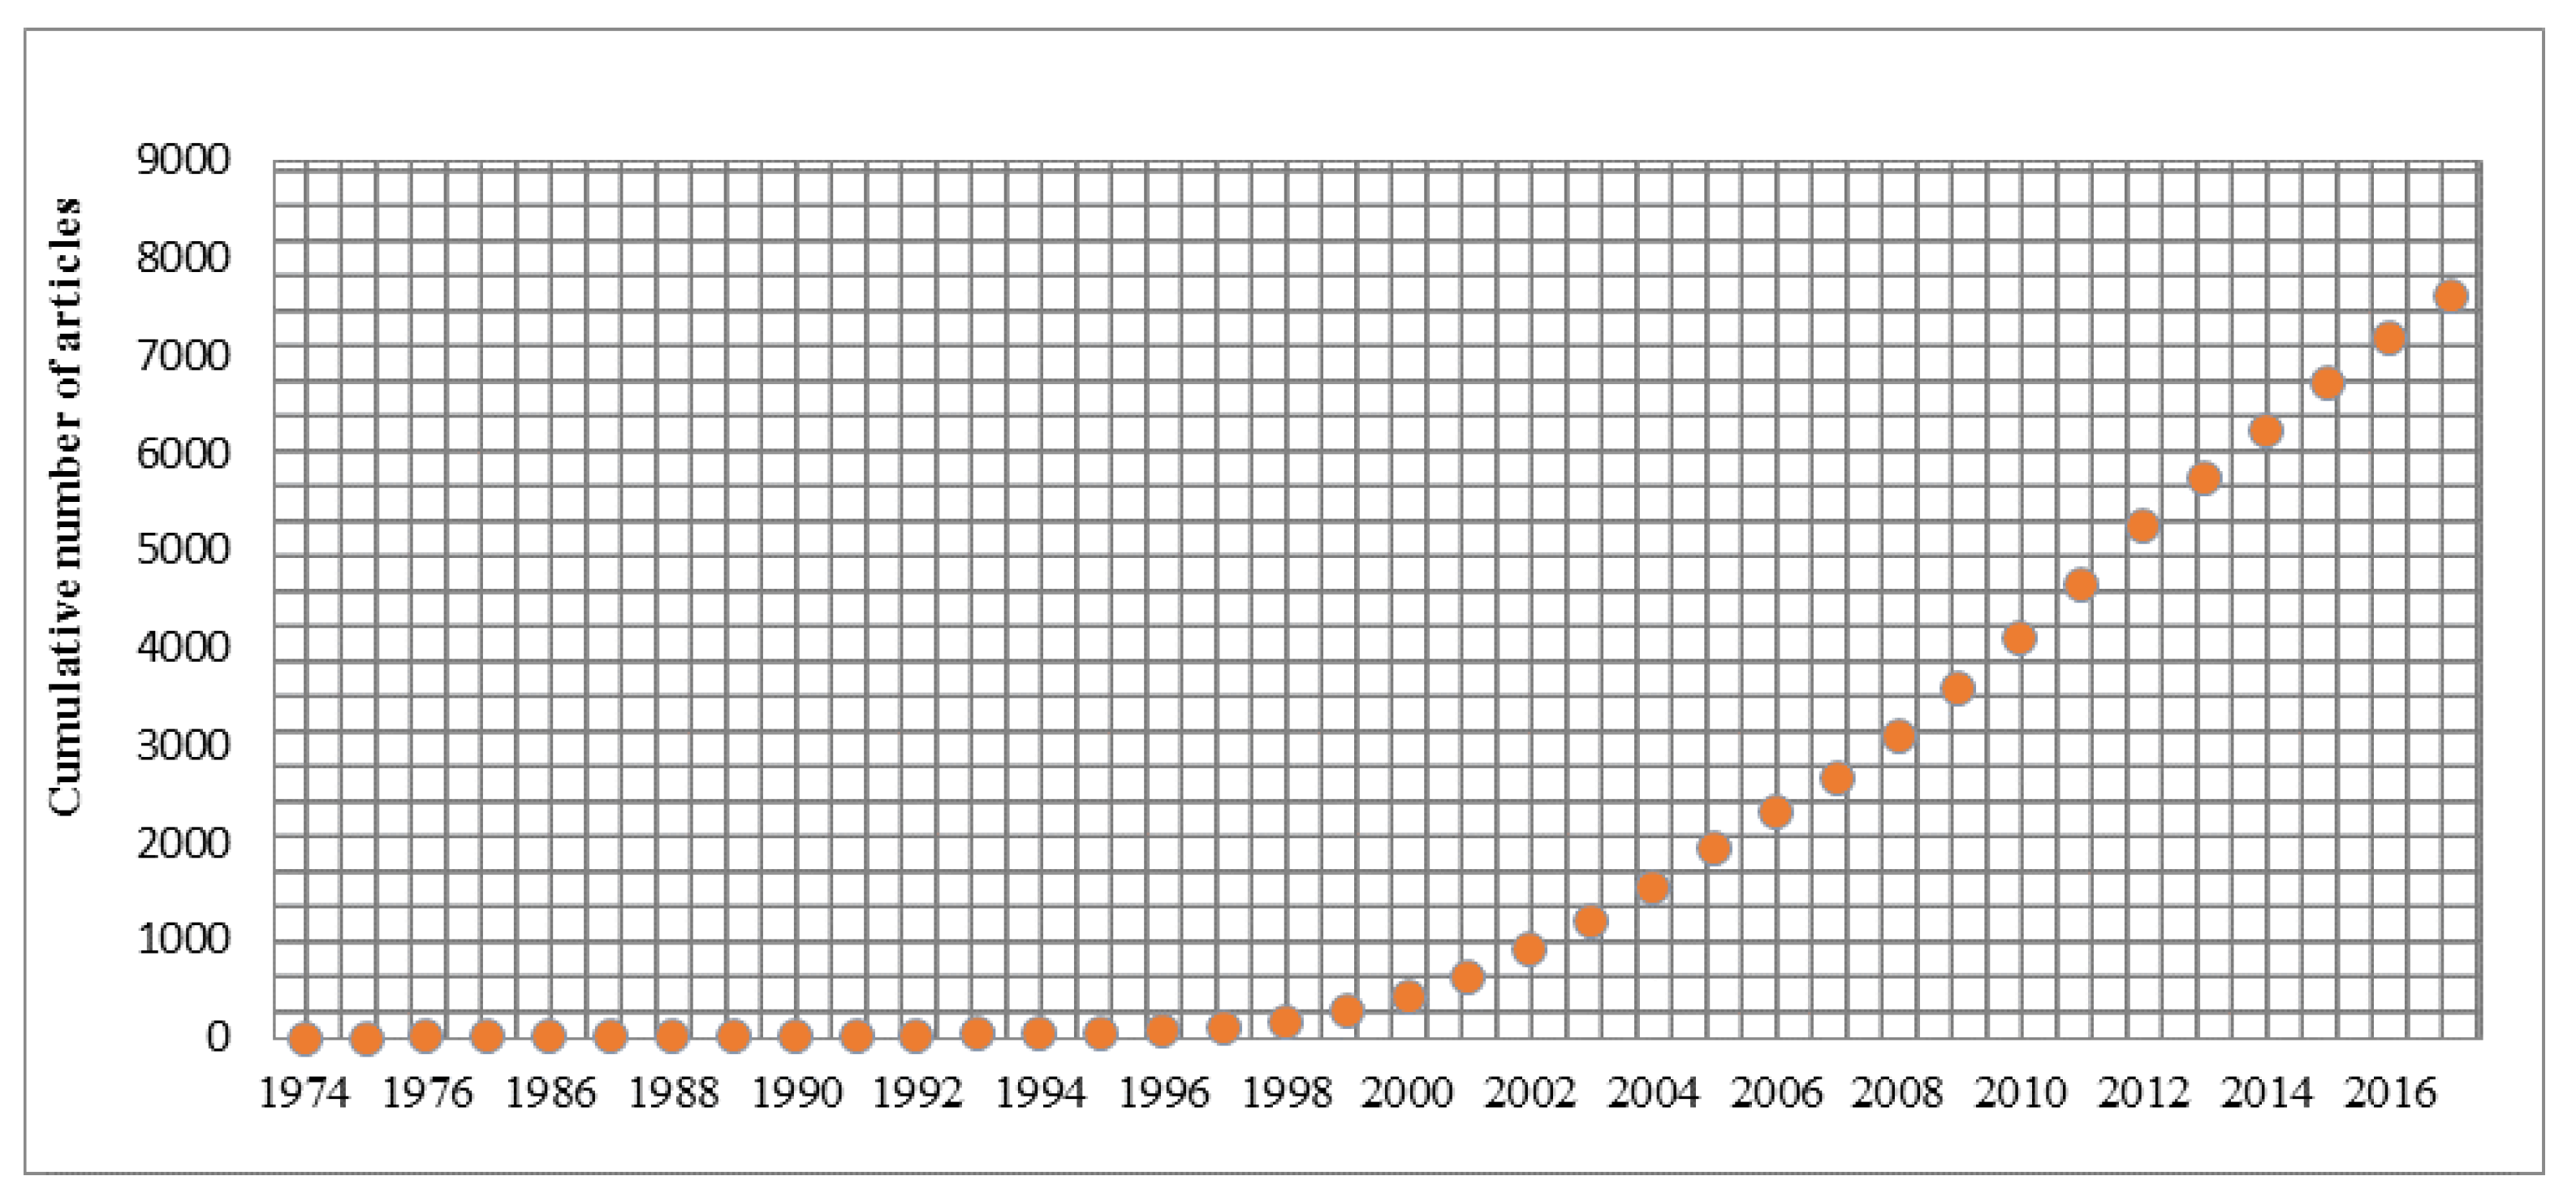
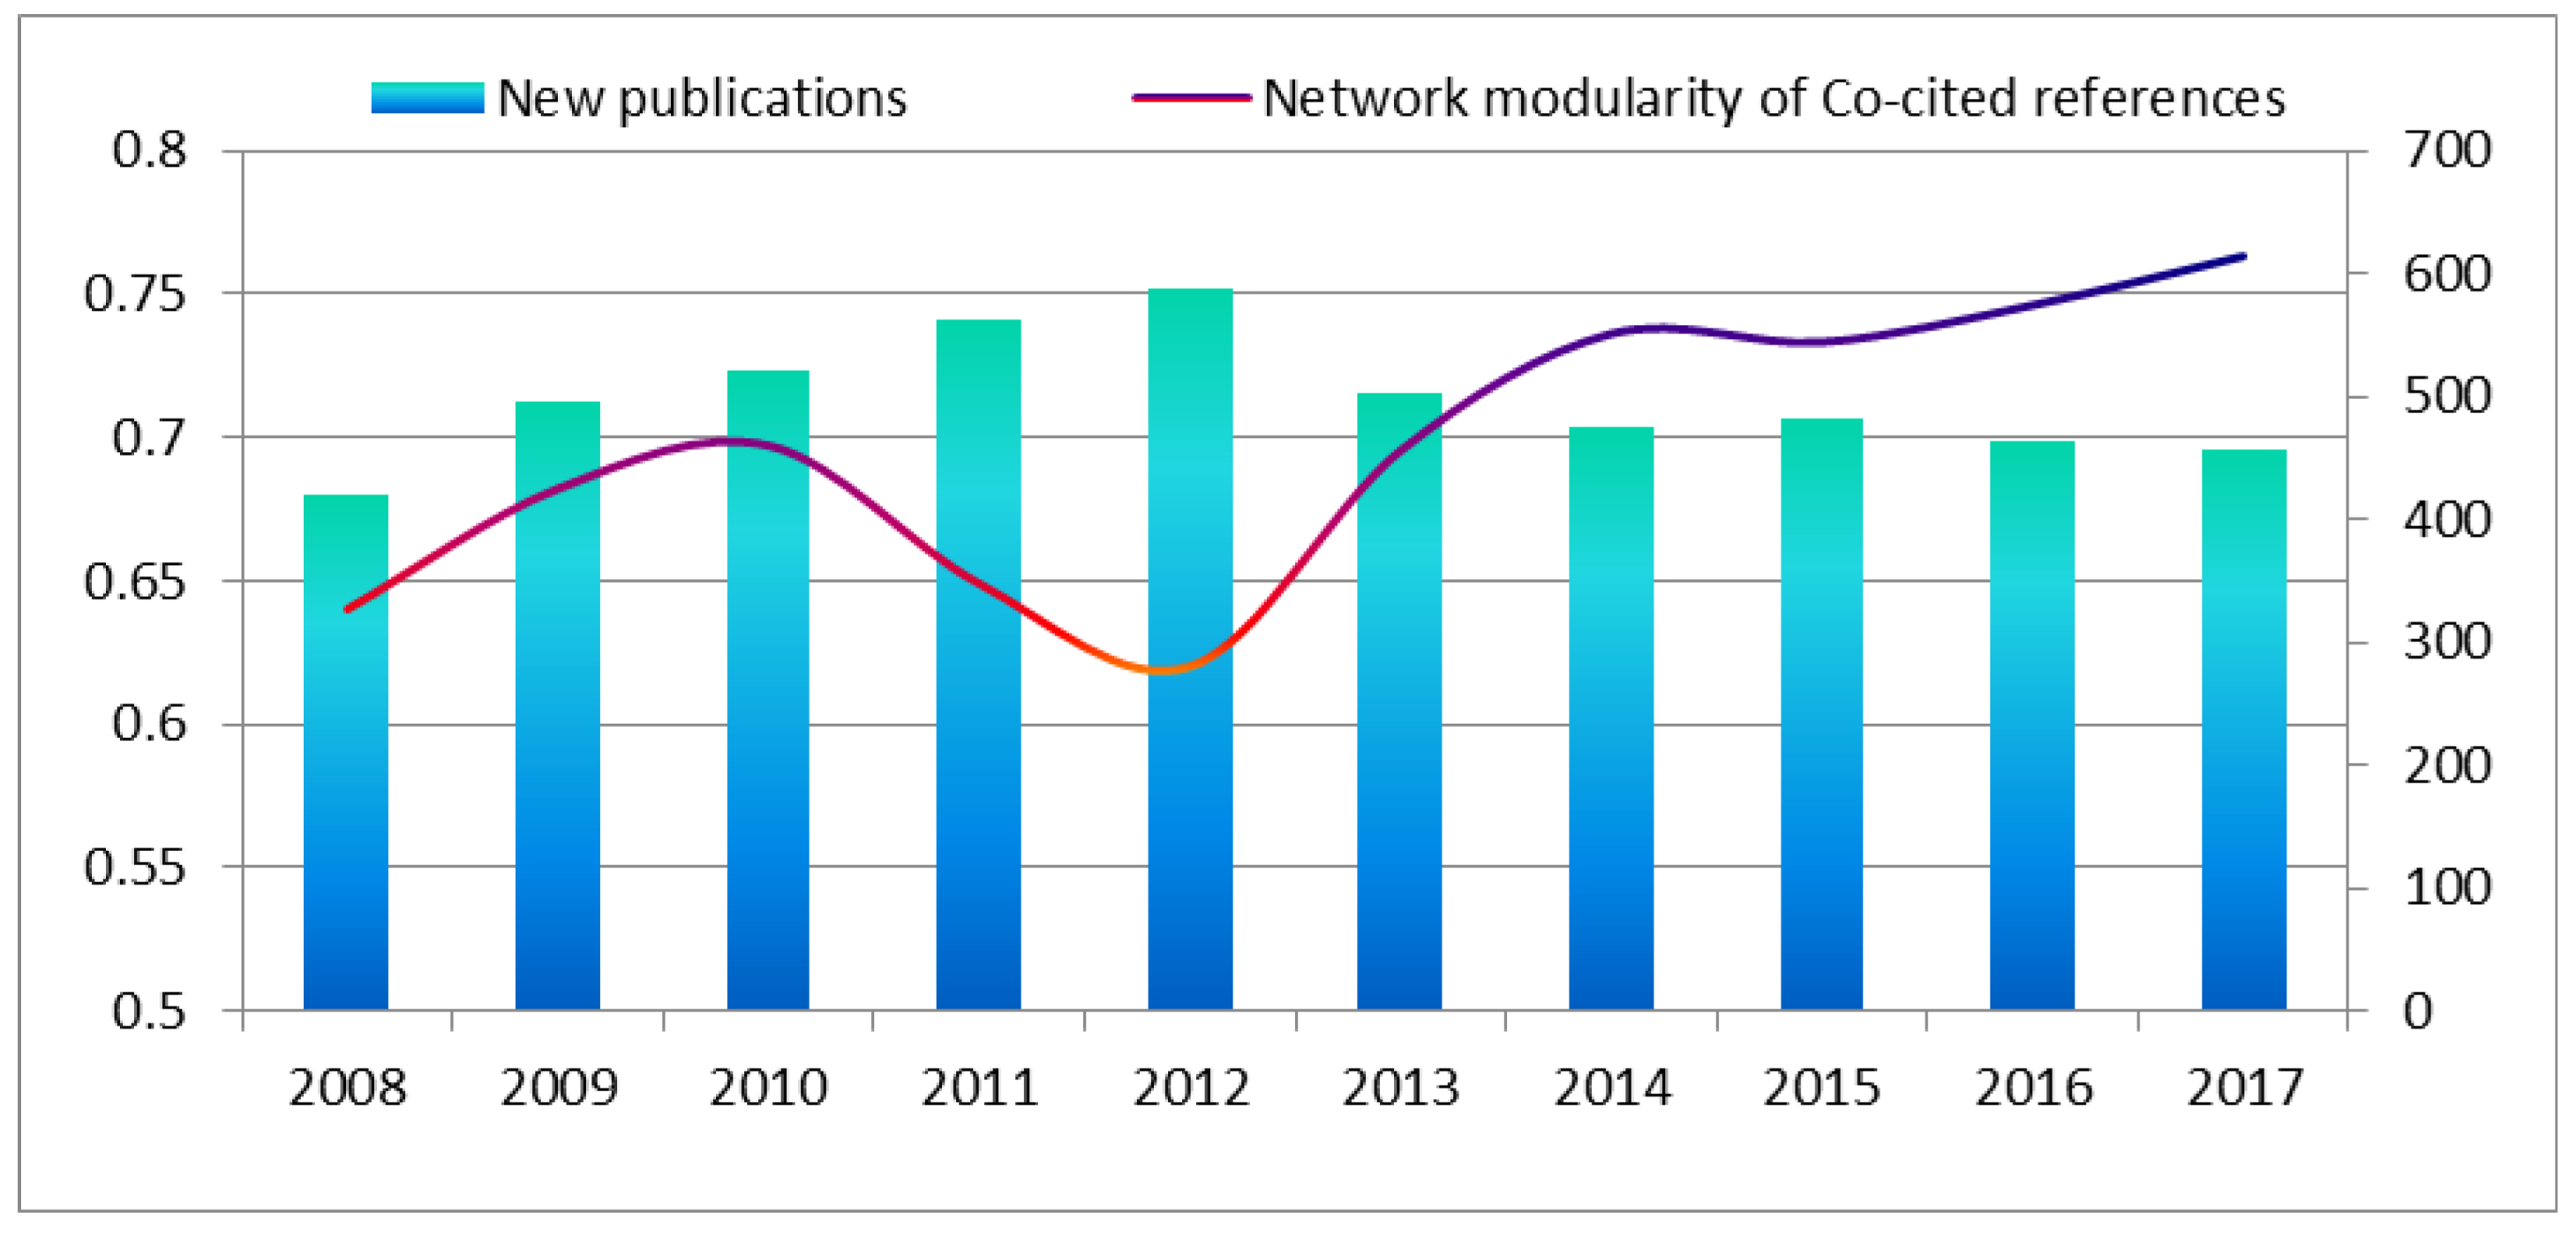
4.1. Distribution by Publication Year

Table 1 displays several characteristics of KM-related publications based on the year of publication. The annual number of articles and countries and the average number of authors and cited references increased significantly during the period of 1974 to 2017. Through checking the published papers over time, only one article was published in 1974, with an increasing number of KM publications after 1999. In 2012, a peak of 588 articles were published. After 2013, the number of publications steadily declined. Each KM publication had an average of 1.7 authors between 1974 and 1998, whereas the number steadily increased to 2.7 for 1999–2017. The annual number of countries participating in KM research also quickly increased from one country in 1974 to 77 in 2011, whereas the average number of cited references declined from 27.2 from 1974–1998 to 21.8 from 1999 to 2017. The correlation between Times Cited (TC) for an article and the length of time since its publication is shown in Table 1. The average length of an article fluctuated slightly, with an overall average of 13.5 pages.
In this study period, the growth in cumulative publications fit an exponential S-shaped function. S-shaped growth is a typical characteristic of a relatively mature stag research field [30]. Figure 2 indicates that KM research areas have entered the mature stage as of 2013.

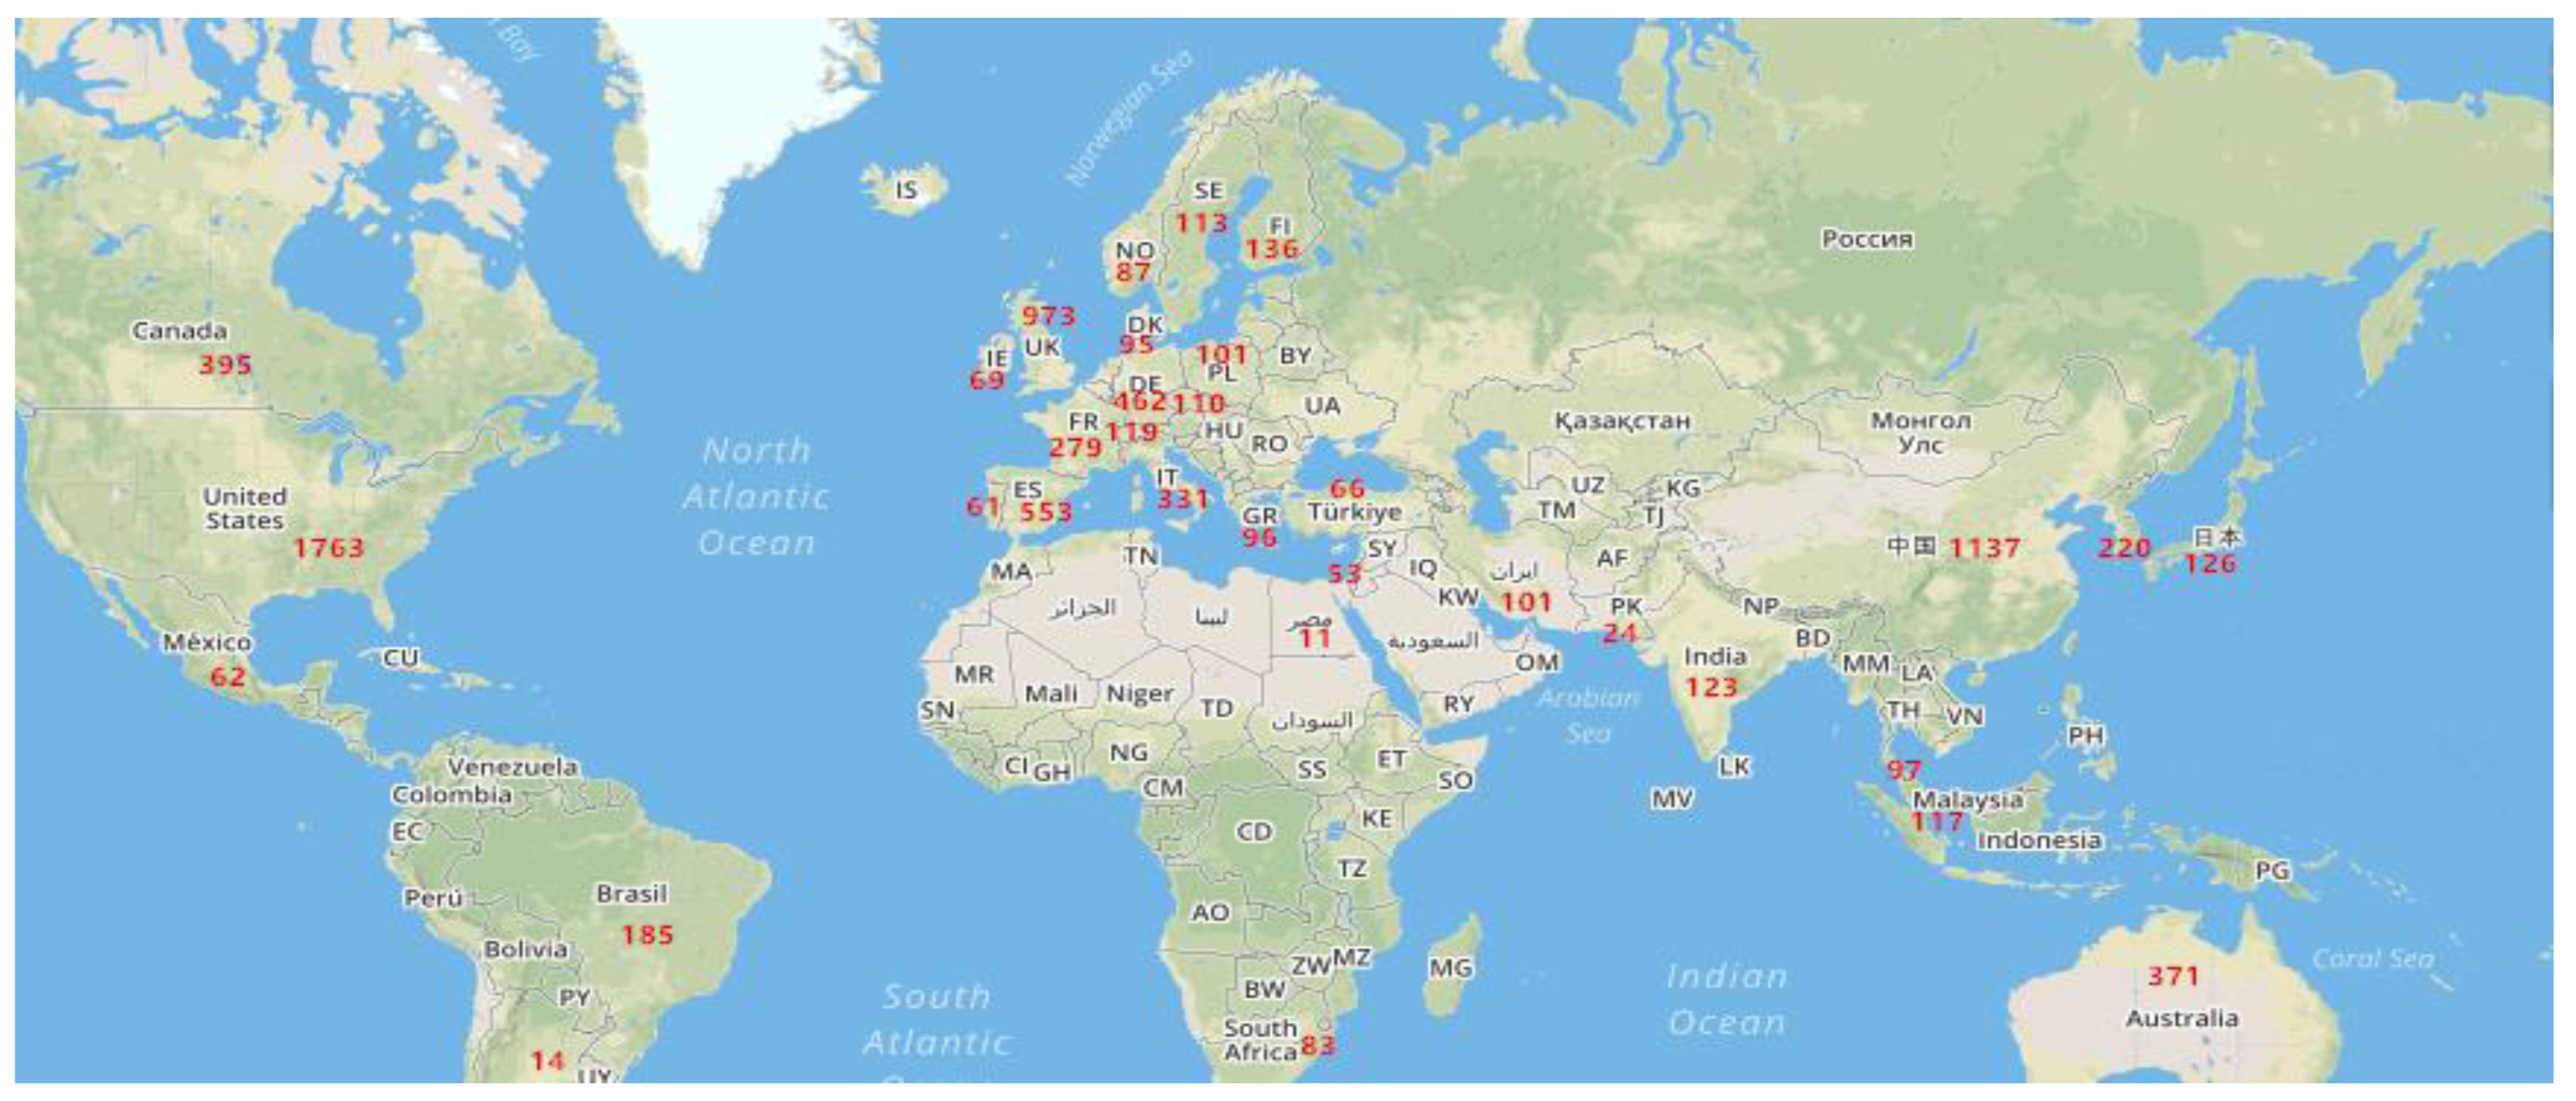
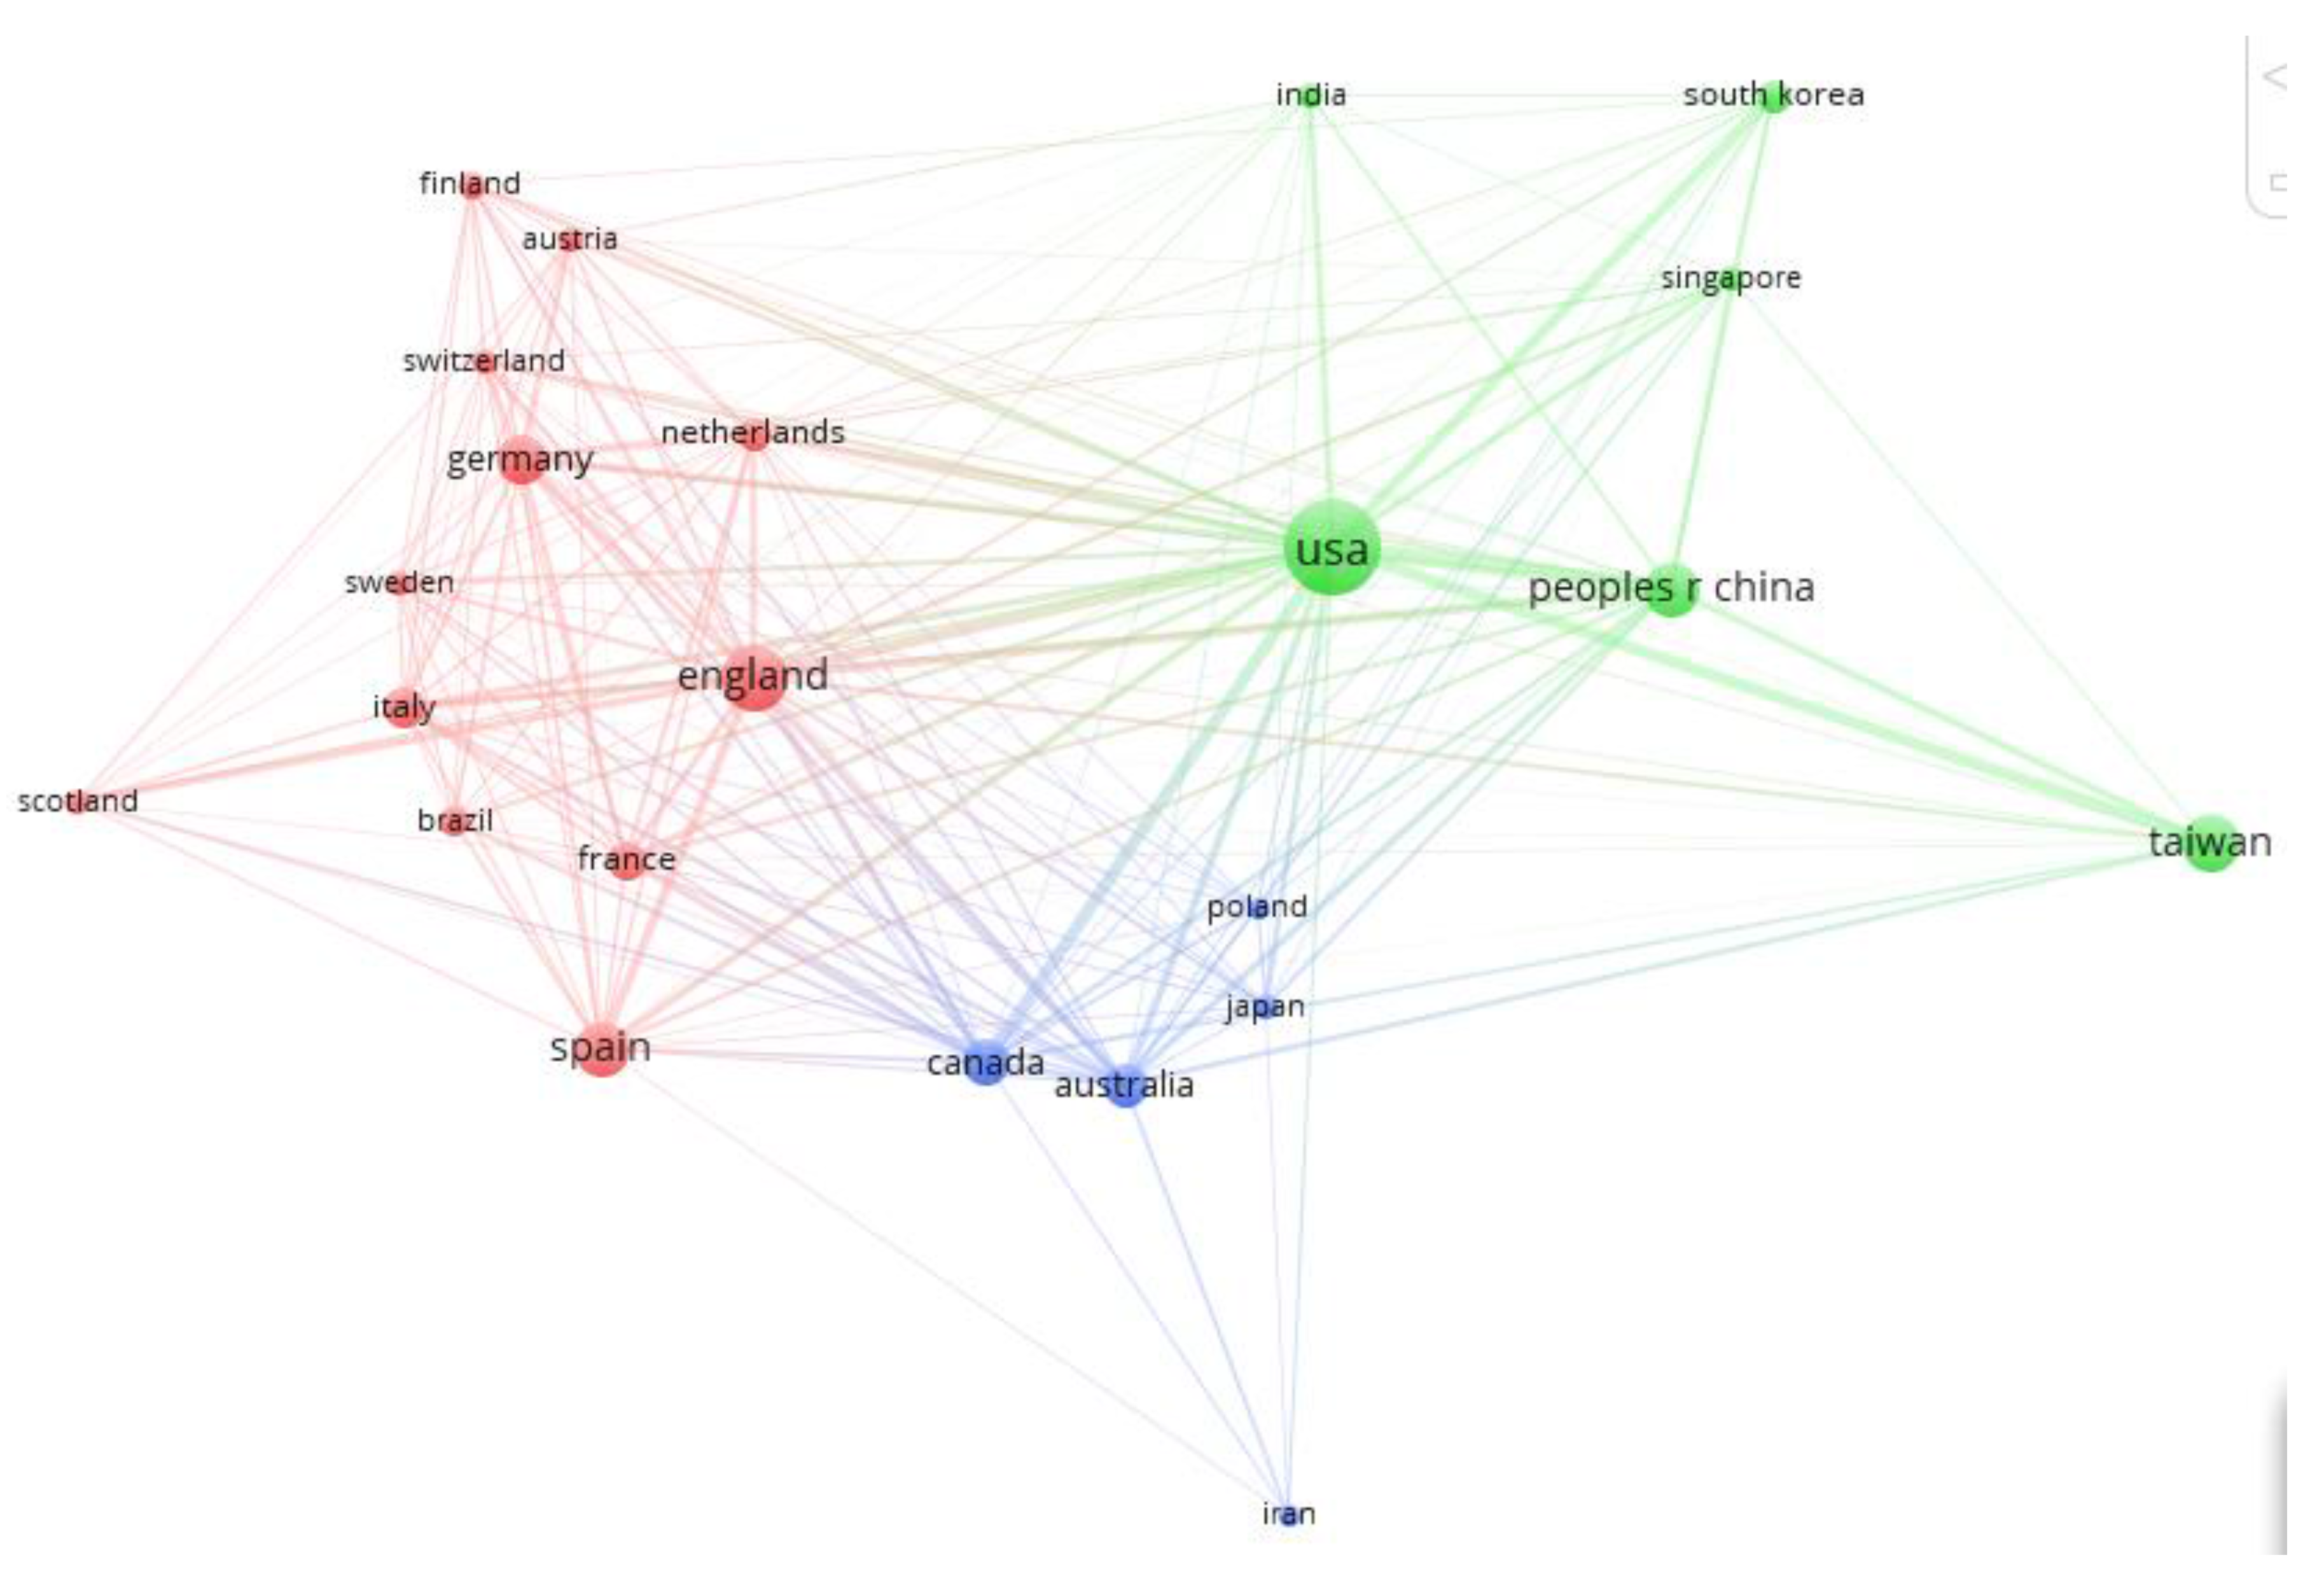
4.2. Distribution and International Collaboration among Countries (Territories)

A total of 123 countries (territories) participated in KM publication activities from 1974 to 2017. Figure 3 shows the geographical distribution of the important countries (territories). Table 2 ranks the number of articles for each country contributing to KM publications. Notably, an article may be authored by many authors in several different countries. Therefore, the sum of articles published by each country may be larger than the total number of articles. The 1624 institutions in the U.S. published 1,763 (25.26%) articles and had the largest number of authored papers. England (territories) was ranked second and Taiwan (territories) ranked third. China contributed 579 (7.6%) articles from 576 institutions and Spain published 553 (7.3%) articles out of 602 institutions.
By investigating citations from papers according to country distribution (Table 2), we found U.S.-authored papers were cited by 17,462 articles with 58,283 citations, accounting for 42.2% of all citations. U.S.-authored papers also had the highest average number of citations per article with a frequency of 33.06. The publications from England were next, distantly following the U.S., cited by 13,954 articles with 16,733 (11%) citations. The subsequent countries (territories) include Taiwan, China, and Spain.
International collaboration in science is both a reality and a necessity, and it is in the interest of all nations [48]. A network consisting of nodes with the collaborating countries between 1974 and 2017 is shown in Figure 4. The connection strength that determines the collation frequency between nodes (countries or territories) shows that the U.S. had the closest collaborative relationships with China, Canada, and England. England had the closest collaborative relationships with the U.S., Spain, and China. Taiwan had the closest collaborative relationships with Australia, the U.S., and some Asian countries. Germany had the closest collaborative relationships with European countries, such as Austria, England, and France, and China, the fifth-ranked country, had the closest relationships with the U.S., England, and Germany.
Table 3 shows the collaboration frequency distribution of papers from the main nations in the KM field. Table 2 and Table 3 indicate that the USA is not only the original contributing country, but also the largest international collaborating country. England is a close second with 377 collaborations compared with the rank of the published number of articles. China and Australia rose in the rankings in terms of international collaboration. However, an opposite trend was observed in Taiwan, ranking fourth. Spain maintained a stable ranking, at fifth place. Table 3 also presents a summary of the Ucinet statistical results of four common parameters of each country: degree centrality, betweenness centrality, effective size, and constraint [33].
Degree centrality is defined as the number of links incident upon a node. It is a count of the number of ties directed to the node. In an international collaboration network, degree centrality often interpreted as a form of popularity or gregariousness. Betweenness centrality, a centrality measure within a graph, quantifies the number of times a node acts as a bridge along the shortest path between two other nodes. In an international collaboration network, the country or institution with a high probability of occurring on a randomly chosen shortest path between two randomly chosen vertices will have high betweenness. From Table 3, the U.S. and Canada had the highest degree centrality, whereas England, Australia, Italy, the Netherlands, Spain, and Sweden were placed second with 21, and China and Switzerland were ranked third.
Betweenness centrality, an indicator for measuring nodes’ control capacity over the network, also showed the USA and Canada played an important role in the top 23 international collaboration network. The other two parameters, effective size and constraint, confirmed the important role of the USA, Canada, and England.
In a comprehensive view, the collaboration mainly appears in high yield and developed countries. Previous studies indicated cooperation with foreign institutions did not achieve high cited papers. International cooperation does not embody high influence, but it has a very important impact on small and developing countries. [29,32] Therefore, small and developing countries should strengthening international cooperation to improving the publications influence.

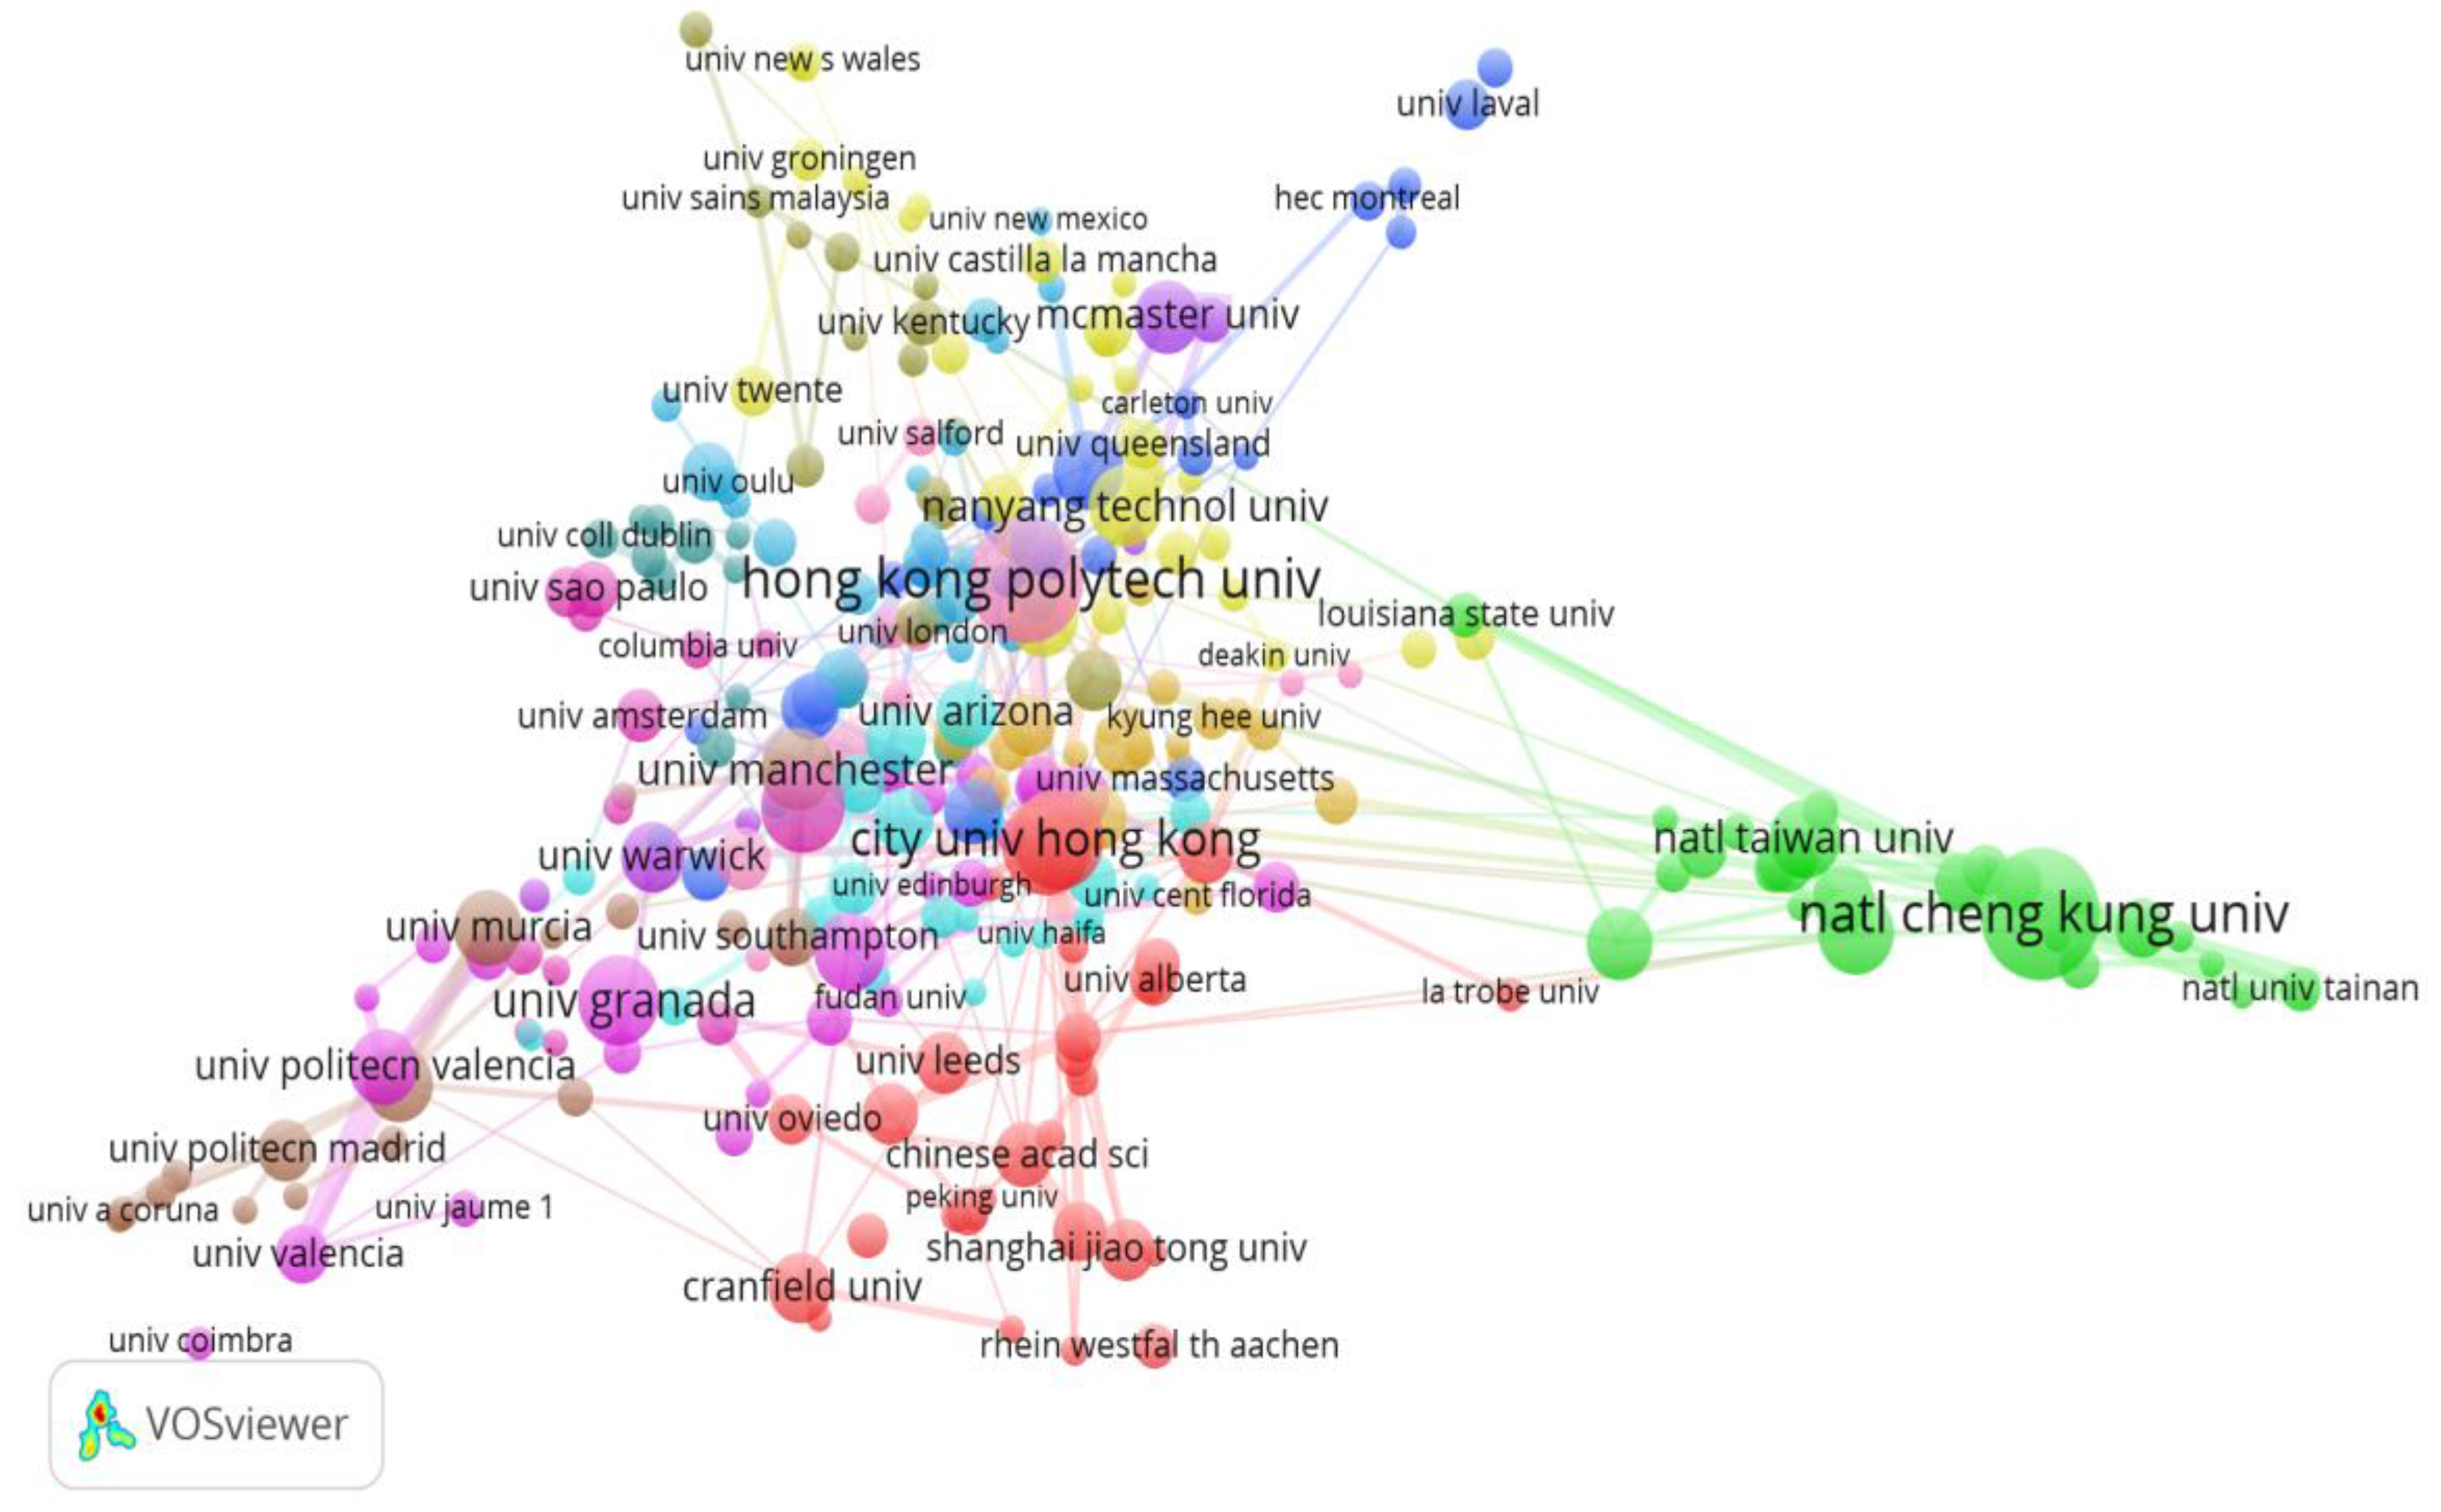
4.3. Institution Distribution and Collaboration

A total of 4801 institutions participated in KM-related research, with 66.8% participating only once, 12.2% participating twice, and 22% participating more than twice. The top 25 of the most productive institutions are displayed in Table 4. National Cheng Kung University had the highest number of publications with 82 papers, followed by Hong Kong Polytechnic University with 77 papers, and the City University of Hong Kong ranked third with 56 papers. The subsequent countries include the National University of Singapore and the University of Cambridge. Simultaneously, the cited numbers for each paper are also displayed in Table 4. Harvard University was cited the most with 4263 citations, and the average number of times cited was 121.8. The University of Illinois followed closely with 2685 citations and with an average number of times cited of 63.9. The City University of Hong Kong ranked third with 2435 citations and an average number of times cited of 43.5.
Then the top 297 institutions with more than or equal to 10 publications were chosen for our collaboration network analysis. The collaboration network map displayed in Figure 5 was created using VOSviewer. In the collaboration analysis, we were concerned about the collaboration frequency between two institutions. In Figure 5, the thickness of the linking lines between the two institutions is directly proportional to their collaboration frequency.
In the network map, the centrality of a node representing an institution is a graph-theoretical property that quantifies the importance of the node’s position in a network. Table 5 presents a summary of the statistical results obtained using Ucinet. The statistical results of two common centralization indexes, degree centrality and betweenness centrality, for each institution qualitatively confirms the above findings.
From Table 5, City University of Hong Kong was ranked first for degree centrality. Aalto University was second place with a degree centrality value of 710, and the Chinese Academy of Sciences ranked third. Compared with the rank of the betweenness centrality, City University of Hong Kong was not only the first-ranked country in terms of degree centrality, but also had the highest betweenness centrality. The National University of Singapore ranked second and University of Cambridge ranked third.

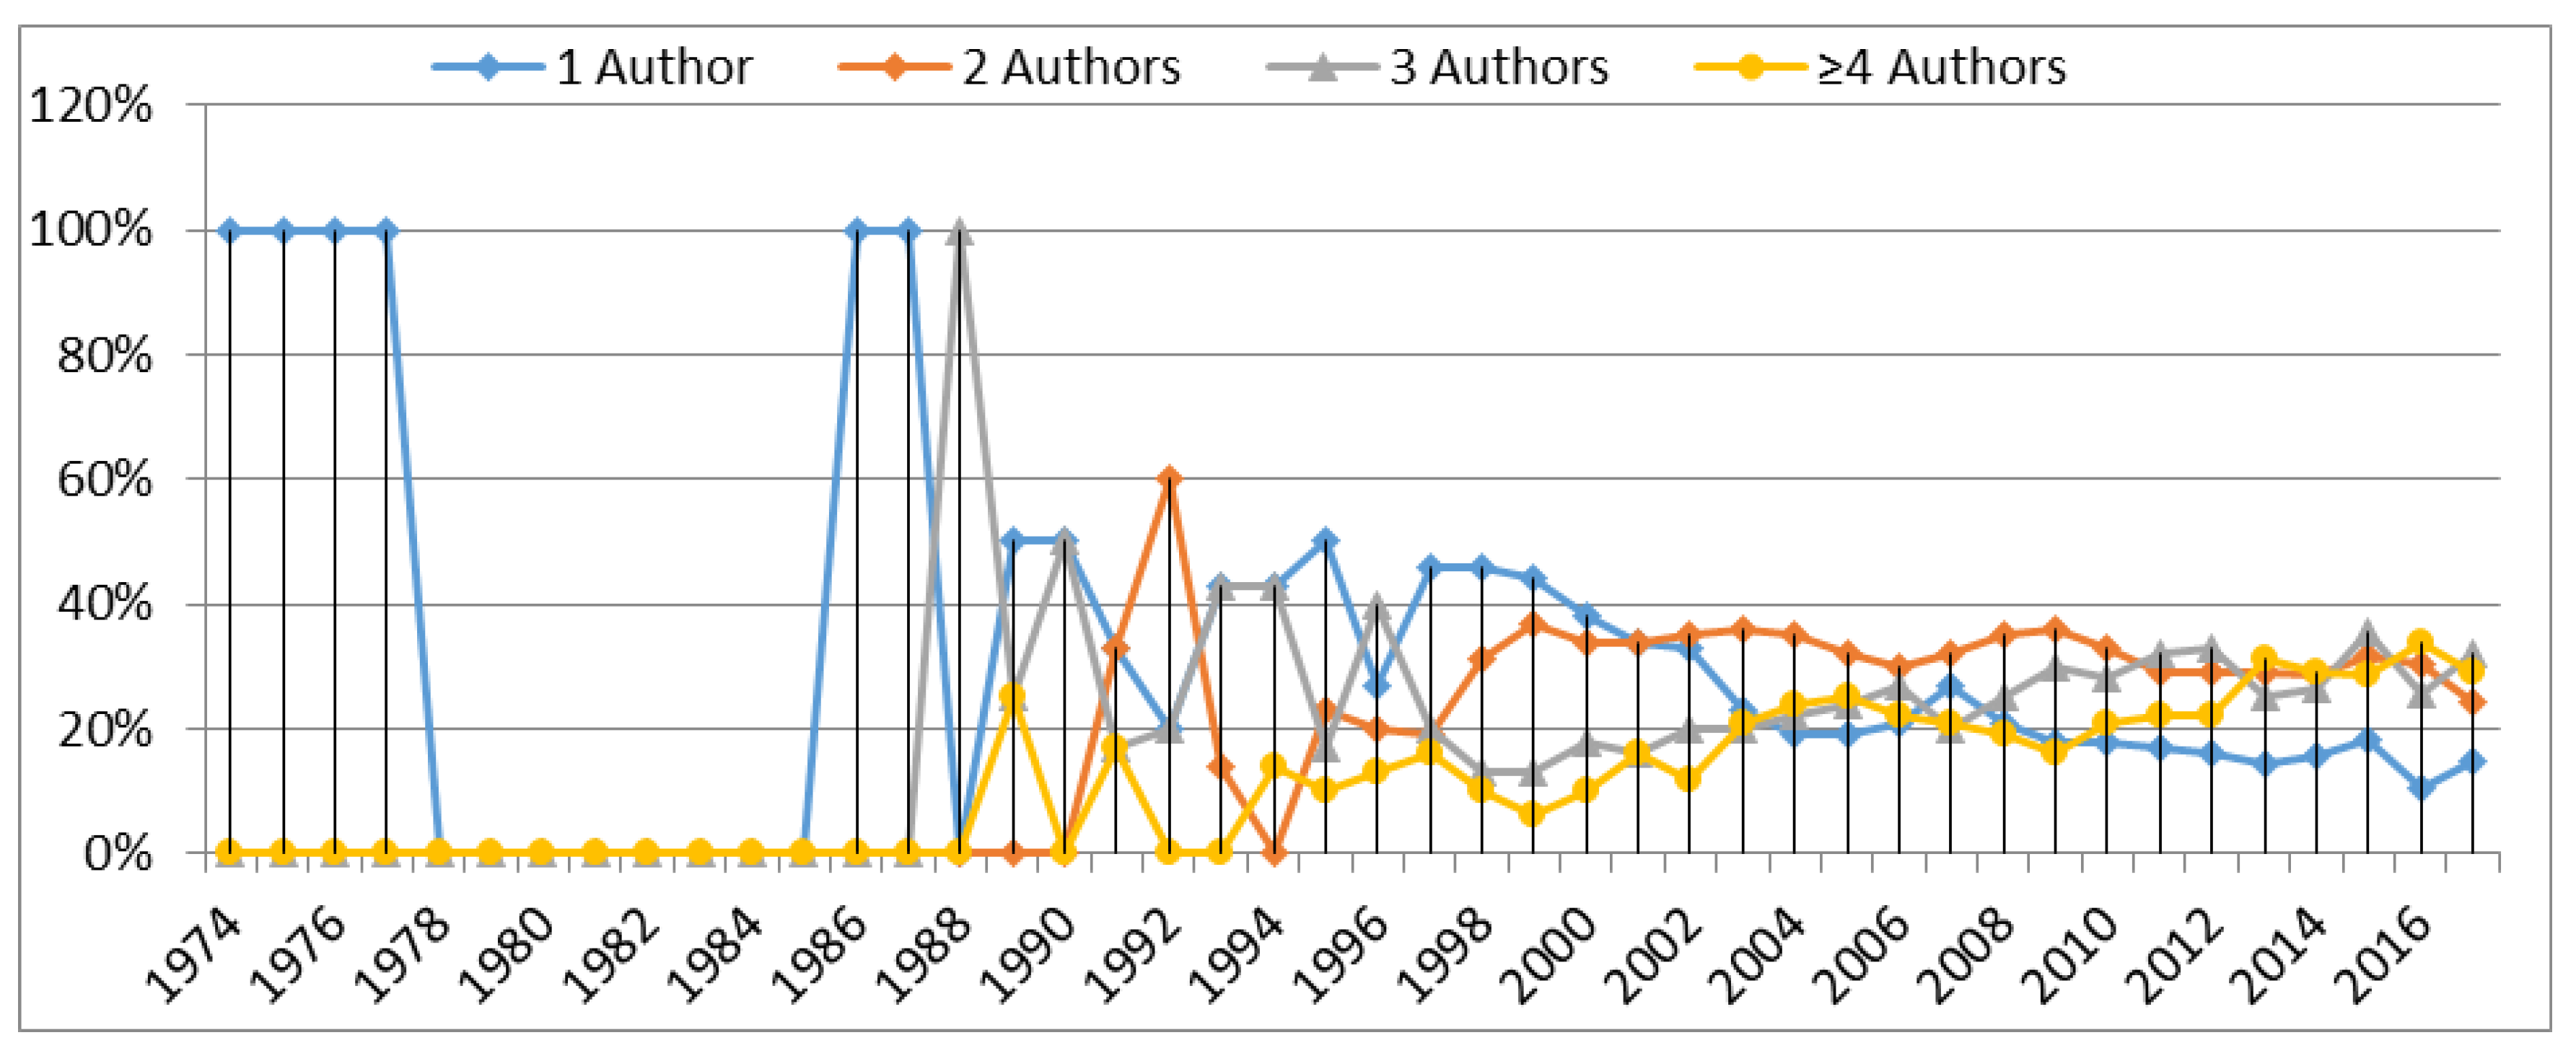
4.4. Authorship Distribution

The total number of authors who contributed to the output set was 15,380. From 1974 to 2017, the average number of authors per article was 2.8. Table 6 shows the distribution of the number of authors with different numbers of articles. The large majority of authors contributed a very small number of publications, and 12,409 authors had only one article, 1820 authors had two articles, and 578 authors published three articles. The most productive author in the field KM articles was Chen from National Cheng Kung University. The second most productive author was Bontis from McMaster University. The third most productive author is Chen from National Cheng Kung University. Gottschalk and Serenko were ranked fourth, from Lakehead University and BI Norwegian Business School, respectively.
Figure 6 displays the articles with number of authors by years. An upward trend was observed in the number of authors per article. The output of single-author papers is waning; the rate of single authorship had fallen drastically in KM research. Of the top 100 highly cited papers, single-author papers accounted for 27%. Although previous research indicated a strong positive correlation exists between the number of authors and the number of quotes, the higher the number of authors, the more often they are cited [30]. Additionally, the single-authored paper may be endangered in many fields, but this research still provides the methods and means for advancing research.

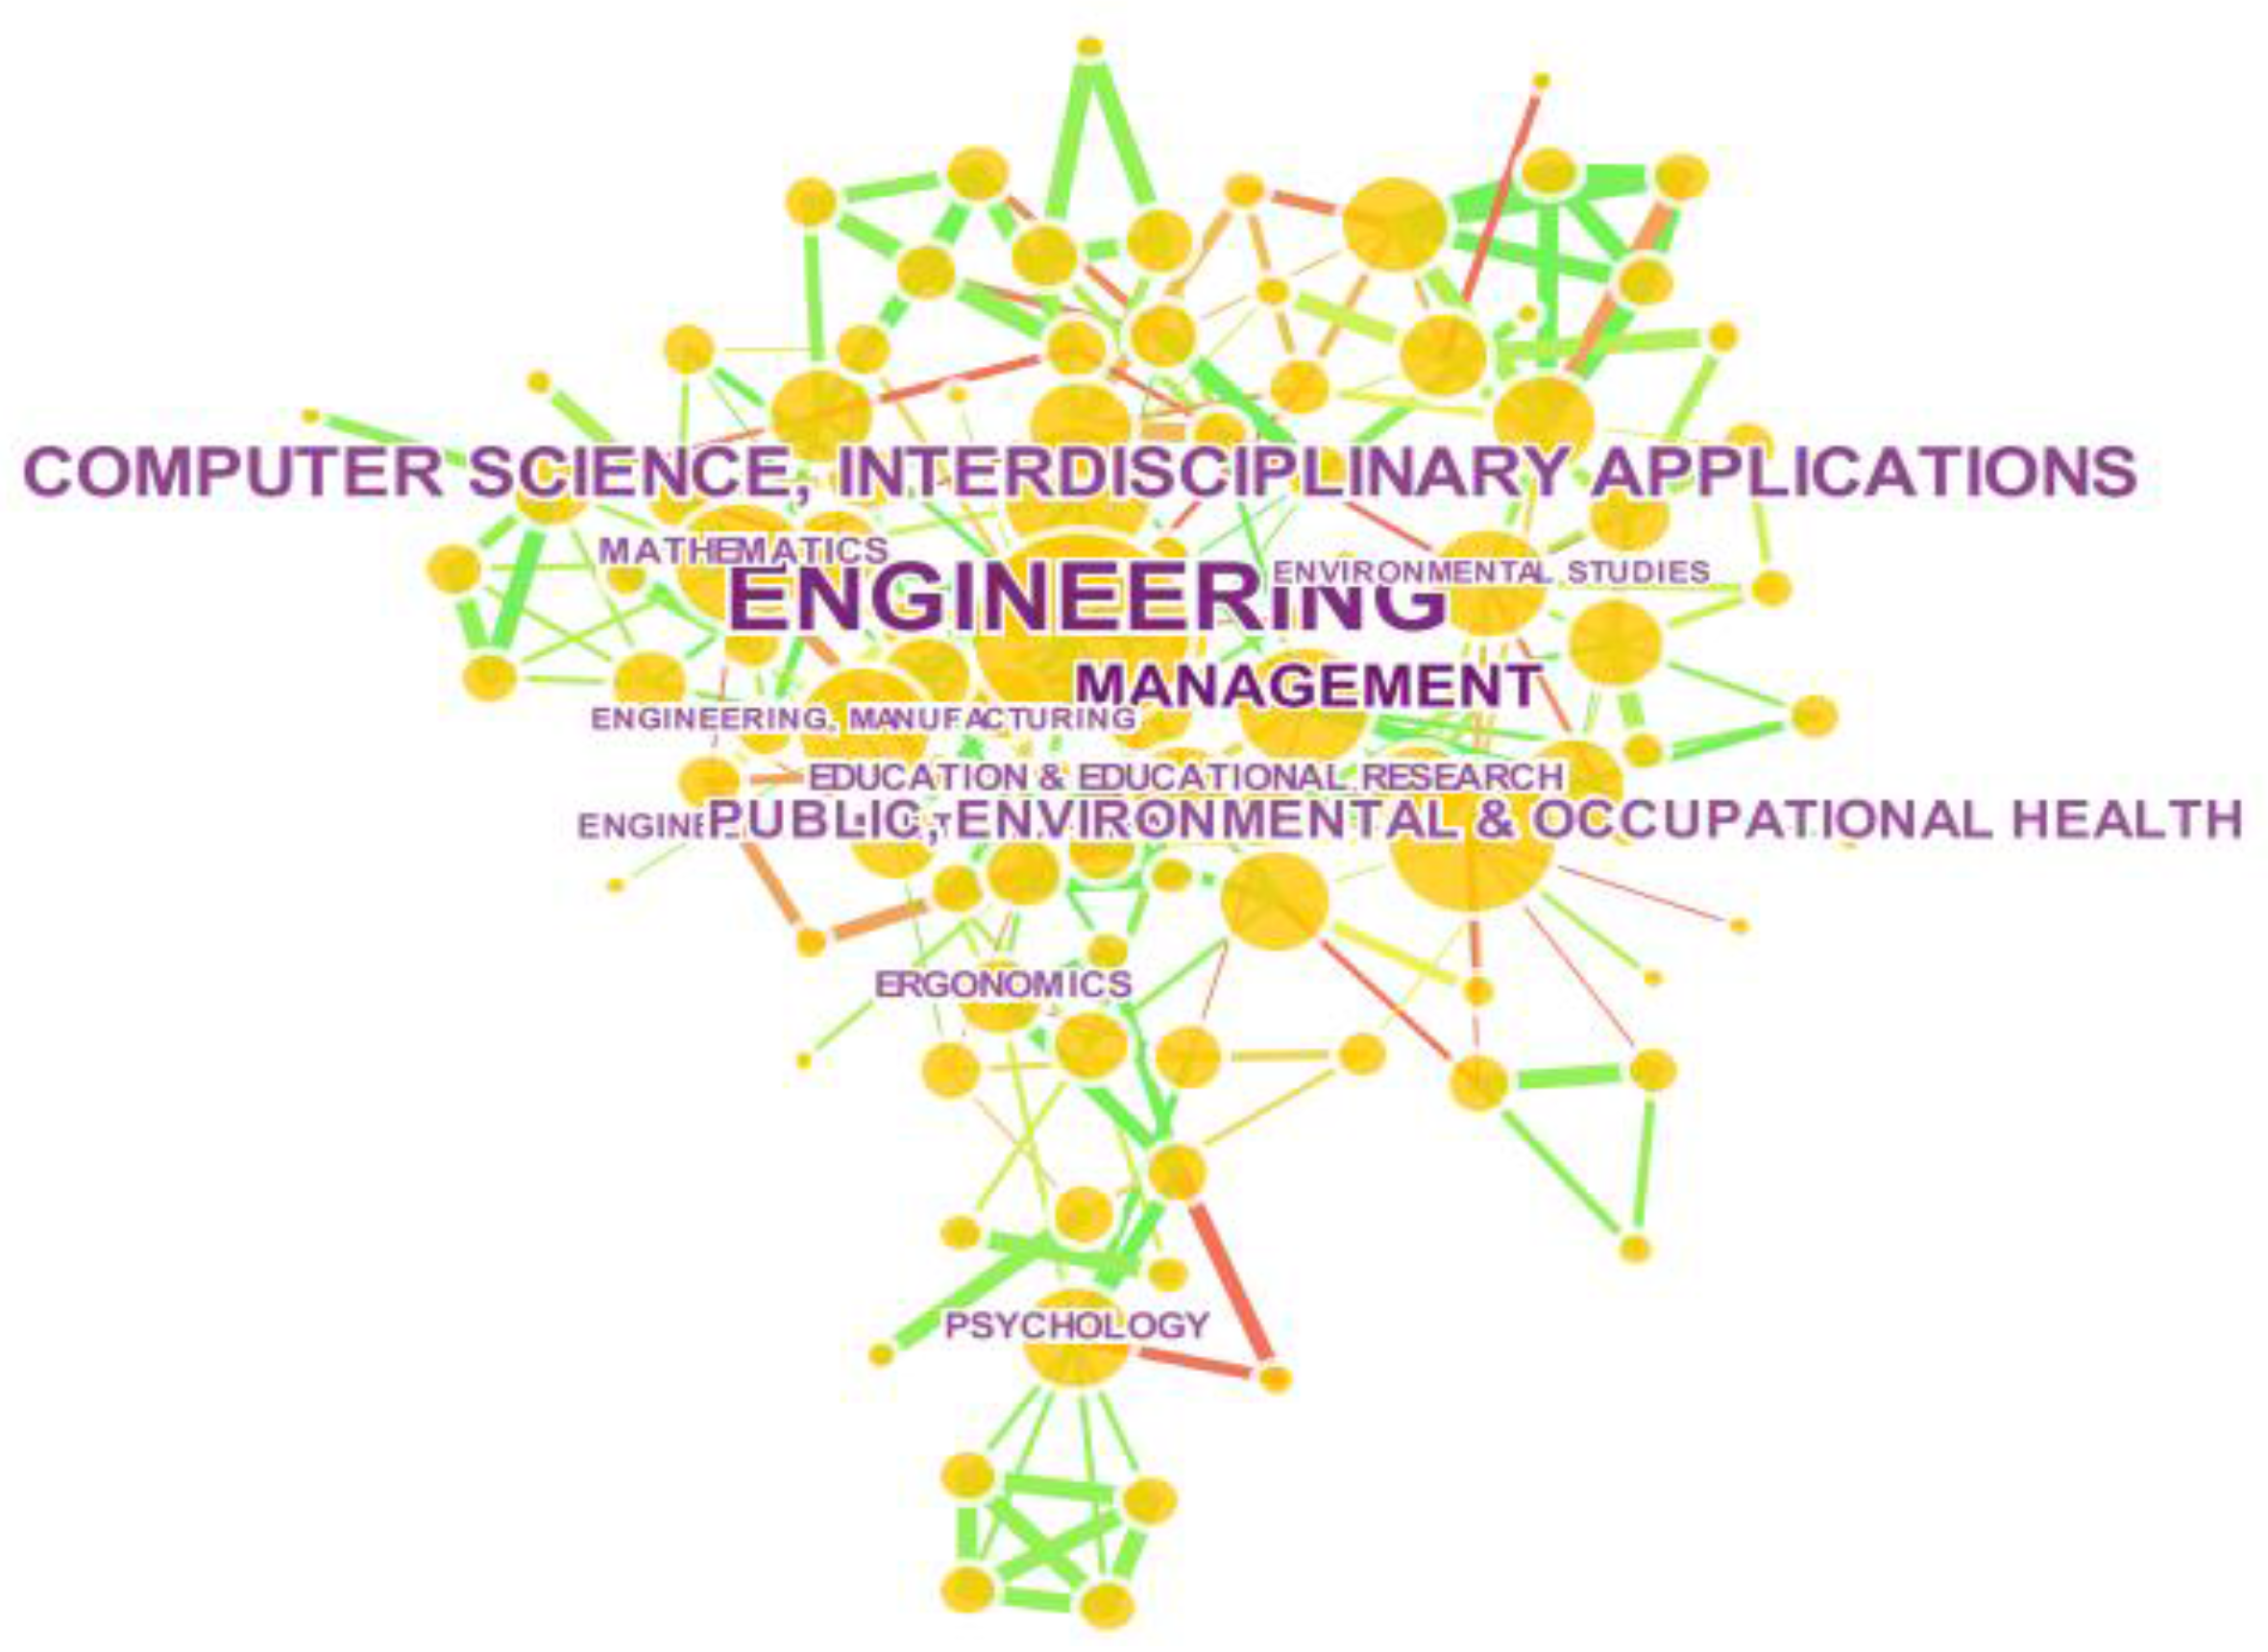
4.5. Distribution of Subject Categories

Table 7 displays the top 30 KM categories ranked in terms of the number of publications. The most common category was Management with 2334 records, followed by business economics with 1723 records, and Computer Science Information Systems with 1349 records.
Figure 7 shows a betweenness centrality network of these categories by using Citespace after being simplified with Minimum Spanning Tree network scaling, which retains the most salient connections. The nodes represent a category in which the number of articles had high betweenness centrality. From Table 8, the centrality of the Engineering, Computer Science, Interdisciplinary Applications, Management, Public, Environmental, and Occupational Health, and Psychology categories are notable. Burst, an indicator used to detect emerging trends, was used to detect emerging KM research subject categories. From Table 8, Computer Science, Theory, and Methods was ranked first with a burst value of 119.2, followed by Computer Science, Artificial Intelligence, and Computer Science. This means that KM research belonging to these three categories has been rapidly increasing in recent years.

4.6. Journal Distribution

KM research was published in 1558 journals. The top 20 journals are displayed in Table 9. Knowledge management research publications were highly concentrated in these top journals and approximately one-third of the articles were found in these most productive journals. This is a phenomenon that follows Bradford’s law and is consistent with observations in other fields. Of these top 20 journals, 1.3% of the 1558 journals had published 2449, or 32.1%, of the 7628 total articles. The major KM research journals include Journal of Knowledge Management, Knowledge Management Research & Practice, Lecture Notes in Computer Science, Lecture Notes in Artificial Intelligence, Expert Systems with Applications, International Journal of Technology Management, Decision Support Systems, and Journal of Universal Computer Science, with more than 100 articles each.

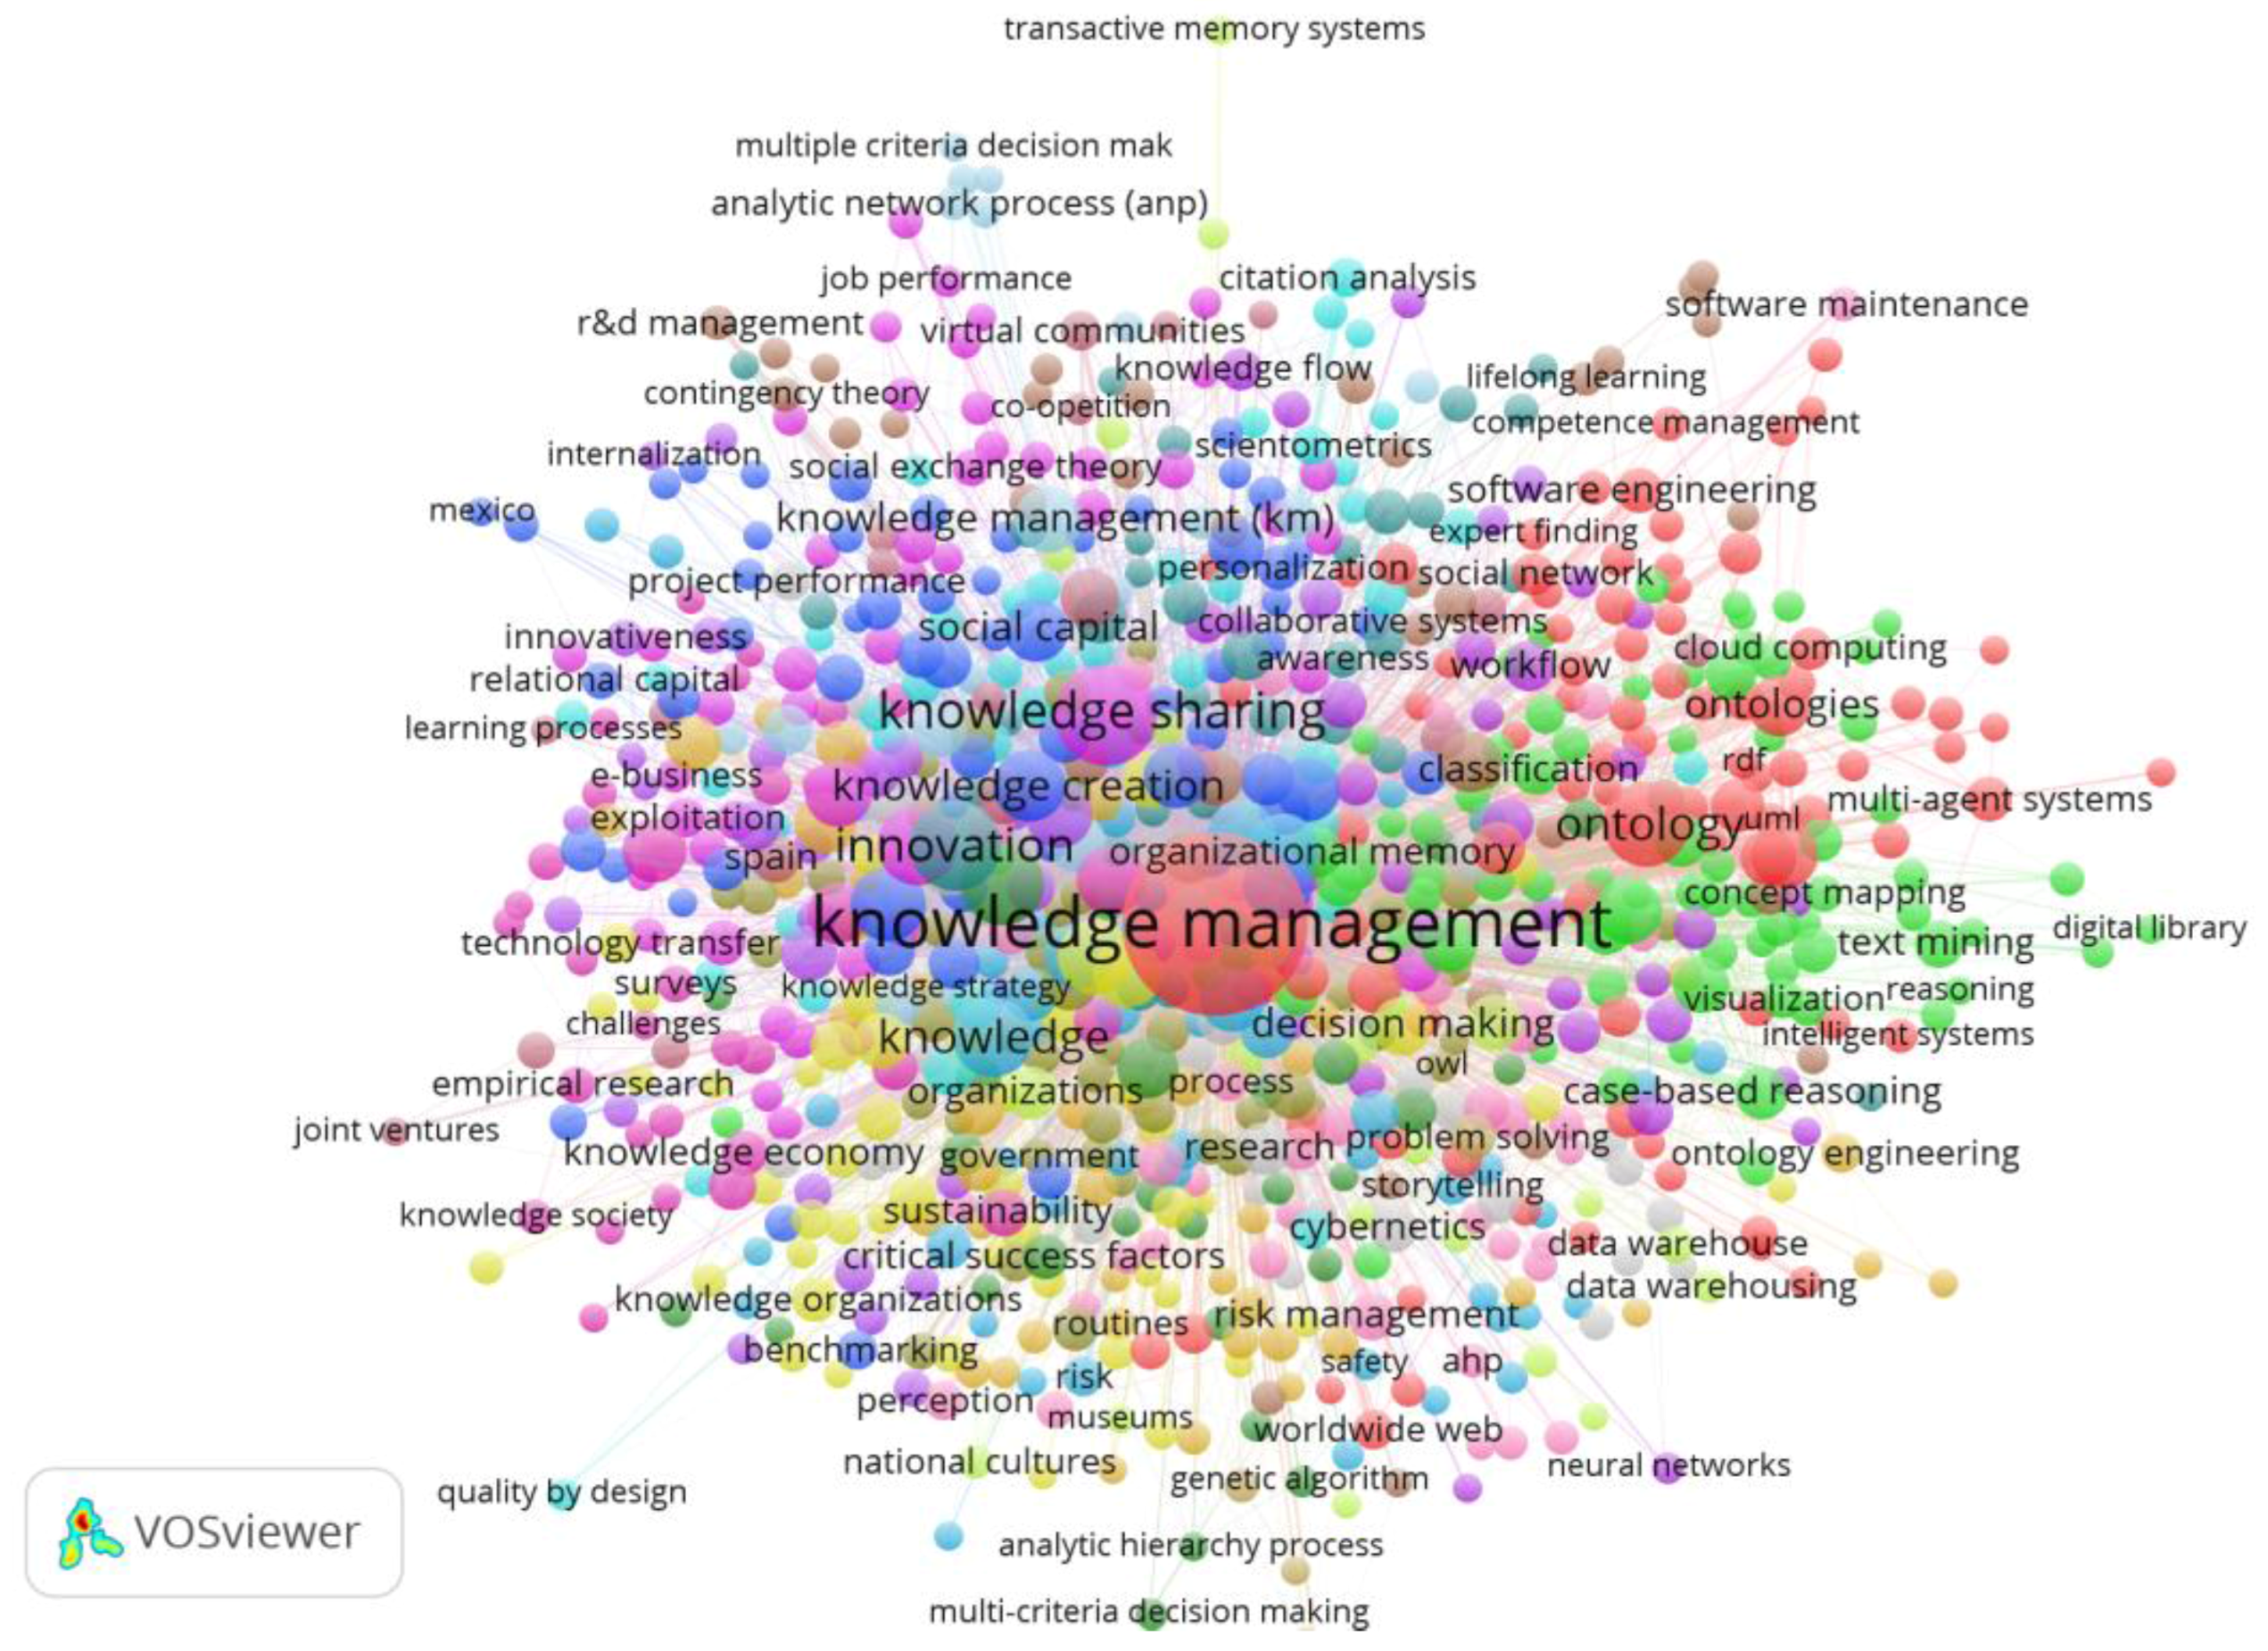
4.7. Keyword Co-Word Network

Co-word analysis is based on the theory that research fields can be characterized and analyzed based on patterns of keyword usage in publications, which has been successfully used for examining the dynamic evolution of science [41]. Co-word analysis is a content analysis technique that is effective for mapping the strength of the association between keywords in textual data. The network map based on co-word analysis represents the search topics of a specific discipline, which is especially appropriate for describing the development of multidisciplinary fields that combine more complex knowledge. A prior study confirmed the reliability and adequacy of the co-word method for mapping the structure of a scientific field [49], which satisfactorily identified groups of research themes and the process by which fields evolved. In this study, we analyzed a total of 7628 published articles related to KM extracted from the ISI database for the period of 1974 to 2017. After processing, we obtained 13,012 keywords. Most keywords appeared only on one occasion, and only 32 keywords appeared more than 50 times. Table 10 shows the most important keywords ranked by frequency. From Table 10, Knowledge Management, with an occurrence frequency of 3401, was ranked first, followed by keywords Knowledge Sharing, Innovation, Ontology, and Knowledge Management Systems (KMs).
In the introduction, we defined the concept of knowledge management. Here, we introduce other main concepts. Knowledge sharing is an activity through which knowledge, namely information, skills, or expertise, is exchanged among people, friends, families, communities, or organizations. In the KM domain, many studies discussed the different aspects of knowledge sharing. Innovation, consistent with the OECD definition, is defined as a new or significantly improved product (a good or service), process (production or delivery method), marketing method, or managerial method [50]. In the KM field, many studies discussed the relationship between KM and innovation and found that knowledge management plays an important role in innovation. Ontology, a useful technology for KMs or KM identification, storage, and knowledge integration, has also received considerable attention from researchers and practitioners [51]. Knowledge management systems (KMs) can be defined as an information system used to collect, process, and sharing the knowledge, promoting the learning, re-use, and innovation of knowledge, and strengthening the core competence of the organization. Specifically, according to the literature, KMSs are divided into two groups: IT-based tools defined in the literature as KM-Tools, and the organizational practices defined as KM-practices [10,52,53,54].
Then the top 835 keywords with a frequency greater than or equal to five were chosen for our co-occurrence network analysis. The co-word network map displayed in Figure 8 was with VOSviewer. In the co-occurrence keyword analysis, we investigated the co-occurrence frequency of two co-occurrence keywords. The higher the co-occurrence frequency of the two words, the closer the relationship between them, which is represented by the location of the two words. The size of the node represents the frequency of the keyword co-occurrence with other keywords. We drew the following conclusion that Knowledge Sharing has a higher co-occurrence frequency with Innovation, Knowledge Creation and Ontology have a higher co-occurrence frequency with Algorithm and Ontology Change Management, and Knowledge has a higher co-occurrence frequency with Management and Competitive Advantage (Figure 8).
To statistically quantify the importance of each keyword within the co-word network, we used social network analysis. Table 11 presents a summary of the statistical results obtained using the Ucinet too. We ranked the keywords according to degree centrality and Freeman’s betweenness centrality. The degree centrality indicates Knowledge Management, Knowledge Sharing, Innovation, Knowledge Transfer, and Organizational learning play an important role in KM research. Betweenness centrality confirmed the degree centrality analysis result, and highlights the keyword ontology.

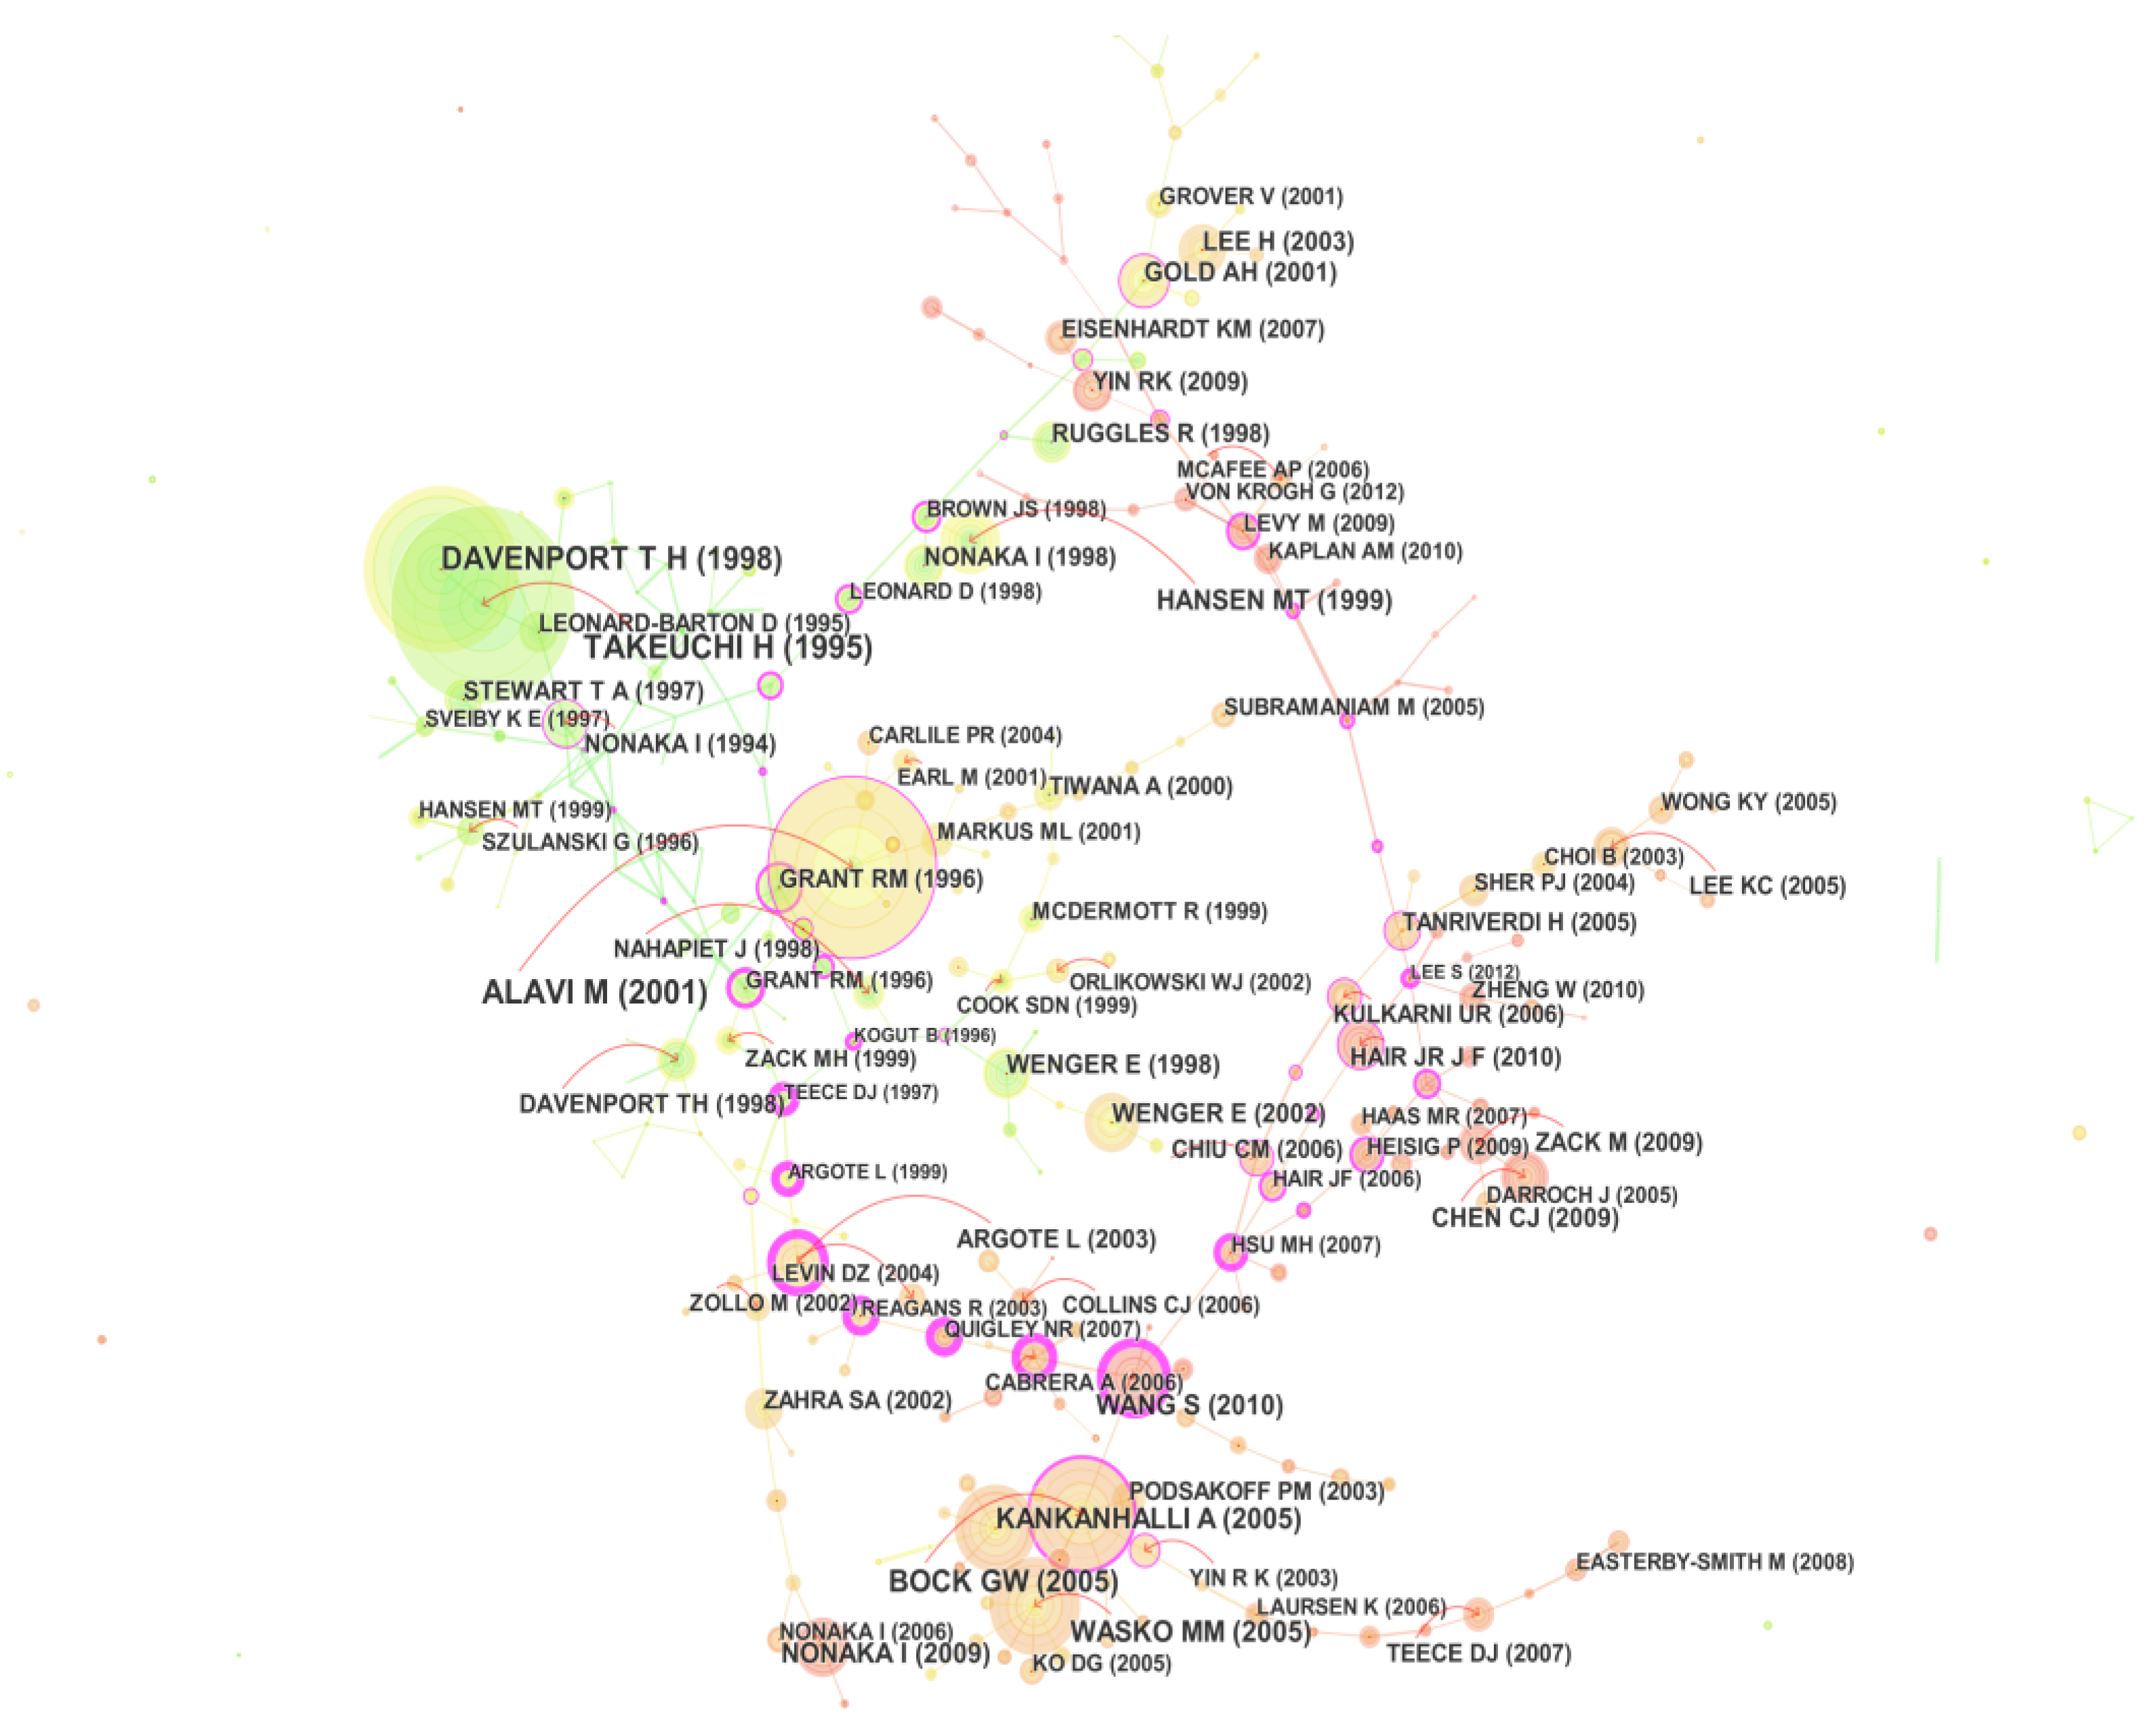
4.8. Intellectual Structure of Knowledge Management

Small first introduced the notion of co-citation and used the node-link network to visualize the co-citation relationship of 10 famous particle physics papers. Since then, many studies have created a visualization of co-citation relationships [39]. In a series of subsequent co-citation studies, White and Griffith documented the co-citation analysis principles and applications to map the advance of science, and identified the dynamic intellectual structure of science as a whole, or of particular domains [40]. Researchers later extended the unit of analysis from papers to authors, leading to author co-citation analysis (ACA) [55]. With many self-reflective co-citation research studies, two major types of co-citation analyses, Document Co-Citation Analysis (DCA) and Author Co-Citation Analysis (ACA) of Information Science, were used to visualize the intellectual structure of a whole domain, or of particular fields of study [40]. For this study, we used Document Co-citation Analysis (DCA) to explore the intellectual structure of knowledge management. Citespace, a tool for visualizing the intellectual structure, was used [56].
In this section, an individual network was derived from the 50 most cited articles published in the corresponding time period of two years, which ranging from 1974 to 2017. Then, these networks were merged into a network of 295 co-cited references that form an overview of the evolution of a scientific field over time (Figure 9). To improve the clarity of a visualized evolution network, we used a simplified network using pruning [31]. Here, a topology-based approach instead of a threshold-based approach was chosen for to more extensively consider intrinsic topological properties [56,57,58]. In this study, pathfinder network scaling instead of minimal spanning trees was used to preserve the chronological growth patterns in the co-citation networks. In Figure 9, the size of a node indicates the number of citations received by the associated reference. Each node is depicted with a series of citation tree-rings across the time frame slices. The structural properties of a node are displayed with a purple ring. The thickness of the purple ring indicates the degree of its betweenness centrality. Table 12 shows the most cited articles with detailed indicators.
From Table 12, the most cited papers by citation counts were during the period of 1995 to 2010. There are two main reasons for this phenomenon. The first is that modern knowledge management rapidly gained in popularity after 2000. The second is that the papers published in recent years need approximately 13–15 years to reach the highest number of citations.
To further investigate the features of the intellectual structure of KM research, we used cluster mapping of co-citation document networks to complete a visualization analysis of the evolution of the intellectual base in the KM field. Based on the co-citation document networks, we used Citespace to divide the co-citation network into a number of clusters of co-cited references. These references are tightly connected within the same clusters, but loosely connected between different clusters. Table 13 lists 15 major clusters by their size, that is, the number of members in each cluster. Clusters with fewer members tend to be less representative than larger clusters because small clusters are likely to be formed by the citing behavior of a small number of publications.
Cluster #0 was the largest clusters, containing 26 nodes, and the value of the silhouette is 0.961. As the cluster was the largest cluster in the literature co-citation network, the theme of this cluster was relatively fragmented. To obtain more information about Cluster #0, we used Carrot to explain Cluster #0 in more detail. Table 14 outlines Cluster #0 using the lingo algorithm.
Table 14 shows that the earliest article in Cluster #0, “Knowledge management, innovation and firm performance” [60], mainly described the relationship between knowledge management and firm performance, which was then followed by the studies of Hair [61] and Haas [62]. Ranked by cited frequency, the core members of Cluster #0 represent major milestones in relation to knowledge management in or across organizations, including knowledge performance, competency, knowledge for innovation, and knowledge sharing. The second largest clusters (#1 and #2) both have 20 members and silhouette values of 0.971 and 0.991, respectively. We also used Carrot to explain Cluster #1 in more detail (Table 15). Ranked by cited frequency, the core members of Cluster #1 represent major milestones in relation to knowledge value, including the basic theory of knowledge value for firms, knowledge assets, and knowledge value.
Table 16 details Cluster #2. From Table 16, the most active citation in the cluster was “Behavioral Intention Formation in Knowledge Sharing: Examining the Roles of Extrinsic Motivators, Social-Psychological Factors, and Organizational Climate". The core members of Cluster #2 represent major milestones of knowledge management research from the psychological perspective.
We also sorted the citation curve that includes the betweenness centrality and burst. The betweenness centrality of a node in the network measures the importance of the position of the node in the network. Table 17 shows 10 essential references in the synthesized network with high centrality. These references are important in terms of how they connect individual nodes in the network, and how they connect aggregated groups of nodes, such as co-citation clusters. Four of these nodes are in Cluster #11 and Cluster #4. These works can be seen as landmark works in the context of our broadly defined area of management.
A citation burst has two attributes: the intensity of the burst and the length of the burst status. Table 18 lists references with the strongest citation bursts across the entire dataset during the study period of 1974 to 2017. The first article with a strong citation burst is “Working Knowledge: How Organizations Manage What They Know” from Cluster #24. The second-ranked article is “Situated Learning: Legitimate Peripheral Participation” and “Multivariate Data Analysis” is ranked third.

4.9. Emerging Trends

The modularity of a network measures the degree to which nodes in the network can be divided into a number of groups, such that nodes within the same group are connected tighter than the nodes in different groups. The collective intellectual structure of the knowledge of a scientific field can be represented as associated networks of co-cited references. These networks evolve over time. Newly published articles may introduce profound structural variation or have little or no impact on the structure. Figure 10 shows the changes in the modularity of networks during the past 10 years. Each network was constructed based on a two-year sliding window. The number of publications per year increased considerably. The modularity dipped in 2012 and then returned to the previous level. Based on this observation, groundbreaking works plausibly appeared in 2012.
Therefore, we specifically investigated potential emerging trends in 2012, and attempted to explain the significant decrease in the modularity of the network. If the publications in 2012 had a subsequent citation burst, then we expected that the publication played an important role in changing the overall intellectual structure. Ten publications in 2012 were found to have subsequent citation bursts (Table 19). Notably, from Table 19, Krogh [63] and Andreeva [64] were ranked first and second on the list. Both introduced research topics about new phenomena and the practice of knowledge management, and have current citation bursts after 2014. Other articles on the list address other research topics about SMEs management based on knowledge perspective, innovation, performance, and big data. These observations suggest that the modularity change in 2012 is an indication of an emerging trend in these areas.

5. Discussion and Conclusions

5.1. Discussion

Considering the limitations imposed by subjective judgment, chosen research scope in terms of time frame, analytical unit, and the lack of visualization perspective of prior publications, our paper comprehensively investigates global knowledge management from 1974 to 2017 to provide a quick overview of KM research. In this study, a coherent comprehensive bibliometric evaluation framework was used to investigate an emerging and promising cross-disciplinary domain, KM. We outlined the key development landscape of KM, including the growth pattern, international collaboration of countries, institutions, author distribution, intellectual structure, and emerging trends. The growth analysis showed that the scientific KM research is emerging as a cross-disciplinary domain among computer science, information science, management, and other research areas. The published KM papers significantly increased since 1991 in an S-shaped pattern, which is consistent with the analysis performed by Styhre [23]. The subsequent country (territory) comparative analysis indicated the U.S., England, Taiwan, and China are the four largest contributors of the published KM literature. Compared with the findings of Gu, Japan and Canada were replaced by Taiwan and China [11]. The scientific research cooperation network analysis indicated that the U.S. is not only the original contributor, but also the largest international collaborating country. England is a close second with 246 international collaborated articles and China ranked third. National Cheng Kung University in Taiwan, Hong Kong Polytechnic University in China, and City University of Hong Kong (China) were the three largest contributors. We observed a decline in single-authored studies and relative stability in studies with two or three authors, and a clear growth trend in multi-authored articles, which is consistent with the analysis of single-authored and multi-authored KM studies [32].
The major publications for knowledge management research include Journal of Knowledge Management, Knowledge Management Research & Practice, and Lecture Notes in Computer Science. These findings agree with prior scientometric research that only highlighted the importance of Journal of Knowledge Management [11,23,32].
The visual co-word keyword analysis determined that Knowledge Management, Knowledge Sharing, Innovation, Ontology, KMs, Knowledge Management Systems, and Knowledge are consistent hotspots in KM research. The co-words network analysis showed that the central term Knowledge Management is closely related to the terms Ontology, Organizational Learning, Knowledge Sharing, and Information Technology. These combinations of related issues show that the KM research is focused on knowledge acquisition and sharing to improve knowledge management performance and organization dynamic capacity. This finding supports the conclusion on KM research in business literature as an independent stream, as stated by Akhavan et al [32].
With the visual co-citation network analysis of references performed with CiteSpace and Carrot, we defined the intellectual structures of knowledge management, and found that four emerging research topics focus on new phenomena and the practice of knowledge management, SMEs management based on knowledge perspective, innovation and performance, and big data-enabled KM.
For new phenomena and the practice of knowledge management, rapid technological changes affect the information and communication technologies that are providing new data mining and predictive analytics solutions. Additionally, the rapid development of social networks, such as Facebook and Twitter [66,67], also influences knowledge management. So, given this context, we can formulate the first research questions (RQ):
RQ1: 
How do different emerging technologies change knowledge management?
Secondly, for SMEs management based on the knowledge perspective, some studies have emphasized the importance of the role of KM in small- and medium-sized enterprises. A consensus conclusion shows that SMEs are starting to make focus on KM practices. However, little research has been completed about the KM of SMEs. Most notably, few empirical studies have been performed on SMEs [6,7,15]. Some academics have focused on SMEs and discussed the KM of SMEs, but some important research issues have been neglected. Given this context, we formulated the next two research questions:
RQ2: 
What are the critical difference between SMEs KM and large companies?
RQ3: 
How should the effective development of SMEs KM be promoted?
Third, innovation and performance based on KM or a KM-based viewpoint is a hot topic in the KM domain. Many studies discussed the relationship between knowledge management and innovation and performance. However, its mechanism is still unclear [21,50]. In additional, most studies focused on large companies. SMEs and startup company innovation and performance research based on the KM perspective should be highlighted. It was then possible to formulate the fourth research question:
RQ4: 
How to promote the mechanism research among knowledge management, innovation and performance, not only in large companies but also in SMEs and startups?
Fourth is big data-enabled KM. The rapid development of big data has created many challenges for KM. Big data can be considered as a knowledge asset, and thus the field of knowledge management gained new momentum with the introduction of big data analytics for knowledge creation. [14] So, we formulated the fifth research question:
RQ5: 
How should big data be managed to address the challenges of KM caused by big data?
For additional studies, we examined the papers’ abstracts, and found that most of the literatures on knowledge transfer and knowledge sharing have introduced various measures to promote knowledge sharing, but few were successful in practice. Therefore, we must strengthen the transfer between KM academic research and KM practice. From this, we propose the next research question:
RQ6: 
How can the communication between KM academic research and KM practice be strengthened?
Another research gap was also observed. Previous studies usually focused on the research of knowledge sharing, transfer, and creation, and lacked research on KM failures, such as knowledge hiding and knowledge hoarding [68,69]. Some scholars have begun to focus on this kind of behavior. However, the critical factors leading to these behaviors are still unclear. Therefore, determining the critical factors is an important task for future knowledge management research about negative behavior. From this, we propose the last two research questions:
RQ7: 
What are the main behaviors leading to KM failure?
RQ8: 
What are the critical factors leading to KM failure?

5.2. Implications for Academics and Practitioners

Based on the above proposed research gaps and questions, our results provide guidance and draw implications for future research and practices. For academics, these implications may offer some possible areas or interesting questions for the development of KM.
On the other hand, the findings above have implications for both academics and practitioners. Firstly, the research presented in this paper particularly benefits academics, researchers, and research students wanting to quickly obtain a visualization overview of knowledge management research.
The research topic analysis, which was based on co-keywords, can also be useful for curriculum designing. For example, considering their importance in KM research, knowledge sharing, knowledge and innovation, ontology, knowledge management systems, knowledge transfer, organizational learning, and knowledge creation should be included in curricula for graduate and undergraduate programs about KM.
Based on our findings about the emerging trends in KM, researchers can better understand the development of KM and quickly and efficiently determine valuable research topics for the future. New phenomena and the practice of knowledge management, SMEs management based on knowledge perspective, innovation and performance, and big data-enabled KM are emerging research topics, which should receive more attention from researchers in this field.
Moreover, by identifying the current KM research status, this study provides an opportunity for practitioners and academics to check the extent to which academic research is keeping pace with the KM issues confronted by managers. This may become a starting point for communication between academics and practitioners.

5.3. Limitations and Direction for Future Research

The results from our study should be interpreted in light of several potential limitations due to the research design and the intrinsic drawbacks of bibliometric methods. First, by focusing on two research objectives, we used 7628 original research articles retrieved from the Web of Science core collection for bibliometric analyses, which may be criticized. Although the Web of Science core collection is an effective and good data source for bibliometric analysis, some limitations exist if it is used as a unique database. Future research can address this limitation by expanding the data sources used and merging the data from various databases, like Scopus, Emerging, and PubMed.
Secondly, we mainly used the frequency indicator to outline the present KM situation because frequency is the most commonly used indicator in bibliometric analyses. However, some valuable units may be ignored. Although betweenness centrality and degree centrality were also used to improve our analysis of international collaboration of among countries, distribution and collaboration of institution, and co-word keyword networks, future research is still needed to integrate various indicators.
Lastly, in the intellectual structure analysis section, our study followed the general paradigm of bibliometric research, and did not analyze the epistemology and ontology problems in the articles, which may cause some misunderstanding for readers. This is due to the limited functions of the intrinsic drawbacks of bibliometric analyses. However, we believe that considering the problems about epistemology and ontology in the articles is important and valuable. Therefore, we hope to address up this gap by introducing more methods, like rounded theory method and systematic reviews, in future research.

Acknowledgments

This research is funded by National Natural Science Foundation of China (71372085). The authors are very grateful for the valuable comments and suggestions of the anonymous reviewers, which significantly improved the article.

Author Contributions

Peng Wang designed this research and collected the data set for the experiment. Fang-Wei Zhu analyzed the data to show the validity of this paper. Hao-Yang Song, Jianhua Hou and Jin-Lan Zhang wrote the paper.

Conflicts of Interest

The authors declare no conflict of interest.

References

  1. Spender, J.C. Making knowledge the basis of a dynamic theory of the firm. Strateg. Manag. J. 1996, 17, 45–62. [Google Scholar] [CrossRef]
  2. Nissen, M.E. Redesigning reengineering through measurement-driven inference. MIS Q. 1998, 22, 509–534. [Google Scholar] [CrossRef]
  3. Pirró, G.; Mastroianni, C.; Talia, D. A framework for distributed knowledge management: Design and implementation. Future Gener. Comput. Syst. 2010, 26, 38–49. [Google Scholar] [CrossRef]
  4. Wiig, K.M. Knowledge management: Where did It Come From and Where Will It Go? Expert Syst. Appl. 1997, 13, 1–14. [Google Scholar] [CrossRef]
  5. Bhatt, G.D. Organizing knowledge in the knowledge development cycle. J. Knowl. Manag. 2004, 1, 15–26. [Google Scholar] [CrossRef]
  6. Wong, K.Y.; Aspinwall, E. An empirical study of the important factors for knowledge management adoption in the SME sector. J. Knowl. Manag. 2005, 9, 64–82. [Google Scholar] [CrossRef]
  7. Centobelli, P.; Cerchione, R.; Esposito, E. Knowledge management systems: The hallmark of SMEs. Knowl. Manag. Res. Pract. 2017, 15, 294–304. [Google Scholar] [CrossRef]
  8. Money, W.; Turner, A. Knowledge Management Information Technology User Acceptance: Assessing the Applicability of the Technology Acceptance Model. In Knowledge Management in Modern Organizations; Jennex, M., Ed.; Idea Group Inc.: Calgary, AB, USA, 2007; pp. 233–254. [Google Scholar]
  9. Nikabadi, S.M. Framework for knowledge management processes in supply chain. Ira. J. Inf.process. Manag. 2014, 28, 611–642. [Google Scholar]
  10. Alavi, M.; Leidner, D.E. Knowledge management and knowledge management systems: Conceptual foundations and research issues. MIS Q. 2001, 25, 107–136. [Google Scholar] [CrossRef]
  11. Gu, Y. Global knowledge management research: A bibliometric analysis. Scientometrics 2004, 61, 171–190. [Google Scholar] [CrossRef]
  12. Henry, N. Bureaucracy, technology, and knowledge management. Public Adm. Rev. 1975, 35, 572–578. [Google Scholar] [CrossRef]
  13. Barclay, B.R.O.; Murray, P.C. What is knowledge management? Knowledge Praxis, 11 May 2009. Available online: http://www.mediaaccess.com/whatis.html (accessed on 5 May 2017).
  14. Esposito, C.; Ficco, M.; Palmieri, F.; Castiglione, A. A knowledge-based platform for big data analytics based on publish/subscribe services and stream processing. Knowl.-Based Syst. 2015, 79, 3–17. [Google Scholar] [CrossRef]
  15. Durst, S.; Edvardsson, I.R. Knowledge management in SMEs: A literature review. J. Knowl. Manag. 2012, 16, 879–903. [Google Scholar] [CrossRef]
  16. Cerchione, R.; Esposito, E.; Spadaro, M.R. A literature review on knowledge management in SMEs. Knowl. Manag. Res. Pract. 2016, 14, 169–177. [Google Scholar] [CrossRef]
  17. Cerchione, R.; Esposito, E. A systematic review of supply chain knowledge management research: State of the art and research opportunities. Int. J. Prod. Econ. 2016, 182, 276–292. [Google Scholar] [CrossRef]
  18. Inkinen, H. Review of empirical research on knowledge management practices and firm performance. J. Knowl. Manag. 2016, 20, 230–257. [Google Scholar] [CrossRef]
  19. Centobelli, P.; Cerchione, R.; Esposito, E. Knowledge management in startups: Systematic literature review and future research agenda. Sustainability 2017, 9, 361. [Google Scholar] [CrossRef]
  20. Nordenflycht, A.V. What is a professional service firm? Toward a theory and taxonomy of knowledge-intensive firms. Acad. Manag. Rev. 2010, 35, 155–174. [Google Scholar] [CrossRef]
  21. Leiponen, A.; Helfat, C.E. Innovation objectives, knowledge sources, and the benefits of breadth. Strateg. Manag. J. 2010, 31, 224–236. [Google Scholar] [CrossRef]
  22. Ensign, P.C.; Hébert, L. How reputation affects knowledge sharing among colleagues. MIT Sloan Manag. Rev. 2010, 51, 79–81. [Google Scholar]
  23. Styhre, A. Understanding Knowledge Management: Critical and Post-Modern Perspectives; Business School Press: Copenhagen, Denmark, 2003. [Google Scholar]
  24. Butler, F.A.; Stevens, R. Standardized assessment of the content knowledge of English language learners k–12: Current trends and old dilemmas. Lang. Test. 2001, 18, 409–427. [Google Scholar]
  25. Lee, M.R.; Chen, T.T. Visualizing Trends in Knowledge Management. Knowledge Science, Engineering and Management; Springer: Berlin, Germany, 2007; pp. 362–371. [Google Scholar]
  26. Lee, M.R.; Chen, T.T. Revealing research themes and trends in knowledge management: From 1995 to 2010. Knowl.-Based Syst. 2012, 28, 47–58. [Google Scholar] [CrossRef]
  27. Li, C.; Guo, F.; Zhi, L.; Han, Z.; Liu, F. Knowledge management research status in china from 2006 to 2010: Based on analysis of the degree theses. Scientometrics 2013, 94, 95–111. [Google Scholar] [CrossRef]
  28. Dwivedi, Y.K.; Venkitachalam, K.; Sharif, A.M.; Al-Karaghouli, W.; Weerakkody, V. Research trends in knowledge management: Analyzing the past and predicting the future. Inf. Syst. Manag. 2011, 28, 43–56. [Google Scholar] [CrossRef]
  29. Serenko, A.; Bontis, N. Global ranking of knowledge management and intellectual capital academic journals. J. Knowl. Manag. 2009, 13, 4–15. [Google Scholar] [CrossRef]
  30. Serenko, A.; Dumay, J. Citation classics published in knowledge management journals. Part-i: Articles and their characteristics. J. Knowl. Manag. 2015, 19, 401–431. [Google Scholar] [CrossRef]
  31. Serenko, A. Meta-analysis of scientometric research of knowledge management: Discovering the identity of the discipline. J. Knowl. Manag. 2013, 17, 773–812. [Google Scholar] [CrossRef]
  32. Akhavan, P.; Ebrahim, N.A.; Fetrati, M.A.; Pezeshkan, A. Major trends in knowledge management research: A bibliometric study. Scientometrics 2016, 107, 1–16. [Google Scholar] [CrossRef]
  33. Wallace, D.P.; Fleet, C.V.; Downs, L.J. The research core of the knowledge management literature. Int. J. Inf. Manag. 2011, 31, 14–20. [Google Scholar] [CrossRef]
  34. Romo-Fernández, L.M.; Guerrero-Bote, V.P.; Moya-Anegón, F. Co-word based thematic analysis of renewable energy (1990–2010). Scientometrics 2013, 97, 743–765. [Google Scholar] [CrossRef]
  35. Braun, T.; Schubert, A. A quantitative view on the coming of age of inter-disciplinarity in the sciences 1980–1999. Scientometrics 2003, 58, 183–189. [Google Scholar] [CrossRef]
  36. Rinia, E.J.; Leeuwen, T.N.V.; Vuren, H.G.V.; Raan, A.F.J.V. Comparative analysis of a set of bibliometric indicators and central peer review criteria: Evaluation of condensed matter physics in the netherlands. Res. Policy 1998, 27, 95–107. [Google Scholar] [CrossRef]
  37. Takeda, Y.; Mae, S.; Kajikawa, Y.; Matsushima, K. Nanobiotechnology as an emerging research domain from nanotechnology: A bibliometric approach. Scientometrics 2009, 80, 23–38. [Google Scholar] [CrossRef]
  38. Garfield, E. Historiographic mapping of knowledge domains literature. J. Inf. Sci. 2004, 30, 119–145. [Google Scholar] [CrossRef]
  39. Small, H. Co-citation in the scientific literature: A new measure of the relationship between two documents. J. Am. Soc. Inf. Sci. 1973, 24, 265–269. [Google Scholar] [CrossRef]
  40. White, H.D.; Griffith, B.C. Author co-citation: A literature measure of intellectual structure. J. Am. Soc. Inf. Sci. 1981, 32, 163–171. [Google Scholar] [CrossRef]
  41. Callon, M.; Courtial, J.P.; Laville, F. Co-word analysis as a tool for describing the network of interactions between basic and technological research: The case of polymer chemsitry. Scientometrics 1991, 22, 155–205. [Google Scholar] [CrossRef]
  42. Leydesdorff, L. Top-down decomposition of the journal citation reportof the social science citation index: Graph-and factor-analytical approaches. Scientometrics 2004, 60, 159–180. [Google Scholar] [CrossRef]
  43. Persson, O.; Danell, R.; Schneider, J.W. How to use Bibexcel for various types of bibliometric analysis. In Celebrating Scholarly Communication Studies: A Festschrift for Olle Persson at his 60th Birthday; Umeå University Library: Umeå, Sweden, 2009; pp. 9–24. [Google Scholar]
  44. Chen, C. Citespace ii: Detecting and visualizing emerging trends and transient patterns in scientific literature. J. Am. Soc. Inf. Sci. Technol. 2006, 57, 359–377. [Google Scholar] [CrossRef]
  45. Borgatti, S.P.; Everett, M.G.; Freeman, L.C. Ucinet for Windows: Software for social network analysis. 2002. Available online: http://www.citeulike.org/group/11708/article/6031268 (accessed on 20 February 2018).
  46. Van Eck, N.J.; Waltman, L. Software survey: VOSviewer, a computer program for bibliometric mapping. Scientometrics 2010, 84, 523–538. [Google Scholar] [CrossRef] [PubMed]
  47. Cobos, C.; Muñoz-Collazos, H.; Urbano-Muñoz, R.; Mendoza, M.; León, E.; Herrera-Viedma, E. Clustering of web search results based on the cuckoo search algorithm and Balanced Bayesian Information Criterion. Inf. Sci. 2014, 281, 248–264. [Google Scholar] [CrossRef]
  48. Wagner, C.S.; Leydesdorff, L. Network structure, self-organization, and the growth of international collaboration in science. Res. Policy 2005, 34, 1608–1618. [Google Scholar] [CrossRef]
  49. Whittaker, J. Creativity and conformity in science: Titles, keywords and co-word analysis. Soc. Stud. Sci. 1989, 19, 473–496. [Google Scholar] [CrossRef]
  50. Manley, K.; McFallan, S.; Kajewski, S. Relationship between construction firm strategies and innovation outcomes. J. Constr. Eng. Manag. 2009, 135, 764–771. [Google Scholar] [CrossRef]
  51. Fensel, D. Ontology-based knowledge management. Computer 2002, 35, 56–59. [Google Scholar] [CrossRef]
  52. Fink, K.; Ploder, C. Knowledge Management Toolkit for SMEs. Int. J. Knowl. Manag. 2009, 5, 46–60. [Google Scholar] [CrossRef]
  53. Centobelli, P.; Cerchione, R.; Esposito, E. Aligning enterprise knowledge and knowledge management systems to improve efficiency and effectiveness performance: A three-dimensional Fuzzy-based decision support system. Expert Syst. Appl. 2018, 91, 107–126. [Google Scholar] [CrossRef]
  54. Cerchione, R.; Esposito, E. Using knowledge management systems: A taxonomy of SME strategies. Int. J. Inf. Manag. 2017, 37, 1551–1562. [Google Scholar] [CrossRef]
  55. Zhang, J.; Chen, C.; Li, J. Visualizing the intellectual structure with paper-reference matrices. IEEE Trans. Vis. Comput. Graph. 2009, 15, 1153–1160. [Google Scholar] [CrossRef] [PubMed]
  56. Chen, C. Searching for intellectual turning points: Progressive knowledge domain visualization. Proc. Natl. Acad. Sci. USA 2004, 101, 5303–5310. [Google Scholar] [CrossRef] [PubMed]
  57. Small, H.; Upham, P. Citation structure of an emerging research area on the verge of application. Scientometrics 2009, 79, 365–375. [Google Scholar] [CrossRef]
  58. Skuce, D.; Lethbridge, T.C. Code4: A unified system for managing conceptual knowledge. Int. J. Hum. Comput. Stud. 1995, 42, 413–451. [Google Scholar] [CrossRef]
  59. Chen, C.; Ibekwe-Sanjuan, F.; Hou, J. The structure and dynamics of cocitation clusters: A multiple-perspective co-citation analysis. J. Am. Soc. Inf. Sci. Technol. 2010, 61, 1386–1409. [Google Scholar] [CrossRef] [Green Version]
  60. Darroch, J. Knowledge management, innovation and firm performance. J. Knowl. Manag. 2005, 9, 101–115. [Google Scholar] [CrossRef]
  61. Hair, J.F.; Black, W.C.; Babin, B.J.; Anderson, R.E. Multivariate Data Analysis: A Global Perspective; Prentice Hall: Upper Saddle River, NJ, USA, 2006. [Google Scholar]
  62. Haas, M.R.; Hansen, M.T. Different knowledge, different benefits: Toward a productivity perspective on knowledge sharing in organizations. Strateg. Manag. J. 2007, 28, 1133–1153. [Google Scholar] [CrossRef]
  63. Krogh, G.V. How does social software change knowledge management? Toward a strategic research agenda. J. Strateg. Inf. Syst. 2012, 21, 154–164. [Google Scholar] [CrossRef]
  64. Andreeva, T.; Kianto, A. Does knowledge management really matter? Linking knowledge management practices, competitiveness and economic performance. J. Knowl. Manag. 2012, 16, 617–636. [Google Scholar] [CrossRef]
  65. Marks, M.S.; Marsh, M.C.; Schroer, T.A.; Stevens, T.H. An alarming trend within the biological/biomedical research literature toward the citation of review articles rather than the primary research papers. Traffic 2013, 14, 1. [Google Scholar] [CrossRef] [PubMed]
  66. Xu, W.W.; Chiu, I.H.; Chen, Y.; Mukherjee, T. Twitter hashtags for health: Applying network and content analyses to understand the health knowledge sharing in a twitter-based community of practice. Qual. Quant. 2015, 49, 1361–1380. [Google Scholar] [CrossRef]
  67. Pi, S.M.; Chou, C.H.; Liao, H.L. A study of Facebook groups members’ knowledge sharing. Comput. Hum. Behav. 2013, 29, 1971–1979. [Google Scholar] [CrossRef]
  68. Freudenthal, G. The role of shared knowledge in science: The failure of the constructivist programme in the sociology of science. Soc. Stud. Sci. 1984, 14, 285–295. [Google Scholar] [CrossRef]
  69. Connelly, C.E.; Zweig, D.; Webster, J.; Trougakos, J.P. Knowledge hiding in organizations. J. Organ. Behav. 2012, 33, 64–88. [Google Scholar] [CrossRef]
Figure 1. Research methodology.
Sustainability 10 00682 g001
Figure 2. Cumulative growth in knowledge management publications, 1974–2017.
Sustainability 10 00682 g002
Figure 3. Geographic distribution of KM research articles.
Sustainability 10 00682 g003
Figure 4. International collaboration network of the top 23 countries in KM research. The network was created using VOSviewer. The thickness of the linking lines between two countries is directly proportional to their collaboration frequency.
Sustainability 10 00682 g004
Figure 5. Collaboration network for institutions with more than two articles published contains 791 nodes.
Sustainability 10 00682 g005
Figure 6. The percentage of articles with different numbers authors by year.
Sustainability 10 00682 g006
Figure 7. Disciplines involved in KM.
Sustainability 10 00682 g007
Figure 8. The co-words network of author keywords.
Sustainability 10 00682 g008
Figure 9. Citations in knowledge management research, shown as a Pathfinder network of cited references.
Sustainability 10 00682 g009
Figure 10. The modularity of the network.
Sustainability 10 00682 g010
Table 1. Knowledge management (KM) research article characteristics by year from 1974 to 2017.
Publication YearNP (%) of 7628 PapersNo. Cr (TE)AV. AUAV. NRAV. TCAV. PG
19741 (0.013%)1137228
19754 (0.052%)11251.36.3
19761 (0.013%)1148413
19771 (0.013%)1122615
19862 (0.026%)2126718.5
19871 (0.013%)11247412
19881 (0.013%)133098
19894 (0.052%)2220.814.311.8
19902 (0.026%)12885.5
19916 (0.079%)4217.73.717.3
19925 (0.066%)51.815.41.511.2
19937 (0.092%)5227.66.621.3
19947 (0.092%)7220.69510
199512 (0.157%)41.822.49.816.3
199615 (0.179%)72.328.299.115.7
199738 (0.498%)9223.740.412.3
199857 (0.747%)17223.961.413.4
1999104 (1.363%)241.926.554.612.0
2000153 (2.006%)282.026.740.513.5
2001209 (2.740%)312.331.445.614
2002290 (3.802%)402.325.330.312
2003290 (3.802%)432.626.229.413
2004330 (4.326%)482.828.824.512.6
2005395 (5.178%)492.733.128.513.9
2006383 (5.021%)572.634.826.413.7
2007346 (4.536%)542.641.424.215.4
2008420 (5.506%)562.643.219.614.1
2009496 (6.502%)642.641.521.714.0
2010520 (6.817%))622.748.718.014.5
2011562 (7.368%)773.051.115.615.1
2012588 (7.708%)692.851.610.914.8
2013503 (6.594%)703.256.410.215.4
2014475 (6.227%)703.058.28.115.0
2015481 (6.306%)673.261.94.816.0
2016463 (6.070%)743.158.21.815.4
2017456 (5.978%)673.165.60.516.4
Total6285/100%123----
Noted: NP = number of publications; No. CR (TE) = number of countries; AV. AU = average number of authors; AV. NR = average numbers of references; AV. TC = average number of Times Cited; AV. PG = average number of pages.
Table 2. Knowledge management (KM) research country (territory) ranked by the number of articles (>100 publications).
RankCountry
(Territory)
No. of Articles (%)Citations (%)AverageCiting Articles (%)Institution
1U.S.1763 (23.1%)58,283 (42.2%)33.0617,462 (48.8)1624
2England837 (11 %)16,733 (12.1%)19.9913,953 (18.3)856
3Taiwan595 (7.8%)10,428 (7.6%)17.538028 (10.5)233
4China579 (7.6%)8924 (6.5%)15.417461 (9.8)576
5Spain553 (7.3%)7485 (5.4%)13.546352 (8.3%)602
6Germany462 (6.1%)4707 (3.4%)10.194385 (5.8%)735
7Canada395 (5.2%)9937 (5.7%)20.097124 (9.3%)507
8Australia371 (4.9%)5499 (4.0%)14.825142 (6.7%)367
9Italy331 (4.3%)3843 (2.8%)11.613564 (4.7%)471
10France279 (3.7%)3758 (2.7%)13.473729 (4.9%)533
11Netherlands223 (2.9%)3918 (2.8%)17.573687 (4.8%)394
12South Korea220 (2.9%)3895 (2.8%)17.73394 (4.5%)208
13Brazil185 (2.4%)1190 (0.9%)6.431148 (1.5%)310
14Finland136 (1.8%)1819 (1.3%)13.381680 (2.2%)130
15Japan126 (1.7%)2540 (1.8%)20.162471 (3.2%)209
16India124 (1.6%)1194 (0.9%)9.631121 (1.5%)254
17Switzerland119 (1.6%)1906 (1.4%)16.021846 (2.4%)308
18Singapore117 (1.5%)3321 (2.4%)28.382985 (3.9%)159
19Sweden113 (1.5%)2350 (1.7%)20.802246 (2.9%)267
20Scotland111 (1.5%)2011 (1.5%)18.121936 (2.5%)157
21Austria110 (1.4%)1170 (0.8%)10.641161 (1.5%)221
22Iran102 (1.4%)616 (0.4%)6.04566 (0.7%)91
23Poland101 (1.3%)638 (0.5%)6.32610 (0.8%)165
Table 3. A social network analysis of the international collaboration network of the top 24 countries.
CountryNO.ICANO.ICCDCBC
USA596772211.705
England37768214.339
Taiwan9924140.545
China24942202.695
Spain195682110.032
Germany16547192.311
Canada180612211.705
Australia184492110.973
Italy11456214.339
France12251192.1
The Netherlands10443214.339
South Korea6726141.111
Brazil4944191.837
Finland4529141.703
Japan4638196.607
India4246180.907
Switzerland6252203.231
Singapore6134191.889
Sweden5848214.339
Scotland5030120.182
Austria4734182.404
Iran291350
Poland3134180.907
Note: NO.ICA = number of international collaboration articles, NO.ICC = number of international collaboration countries, DC = degree centrality, and BC = betweenness centrality.
Table 4. The most productive institutions for KM articles.
RankInstitutionCountryArticle% of 7628NO.TCAV.TC
1National Cheng Kung UniversityTaiwan821.1%141917.3
2The Hong Kong Polytechnic UniversityChina771.0%154220
3City University of Hong KongChina560.7%243543.5
4National University of SingaporeSingapore540.7%218640.5
5University of CambridgeEngland510.7%155330.5
6Universidad de GranadaSpain480.6%66013.8
7National Chiao Tung UniversityTaiwan440.6%90220.5
8The University of ManchesterEngland440.6%85719.5
9Nanyang Technological UniversitySingapore420.6%51812.3
10University of IllinoisUSA420.6%268563.9
11National Taiwan UniversityTaiwan410.5%90022
12Loughborough UniversityEngland410.5%88721.6
13University of TorontoCanada410.5%173742.4
14Polytechnic University of ValenciaSpain390.5%40010.3
15Universidad Carlos III de MadridSpain380.5%103220.2
16University of MurciaSpain380.5%88423.3
17McMaster UniversityEngland370.5%93625.3
18National Sun Yat-sen UniversityTaiwan370.5%105928.7
19Cranfield UniversityEngland360.5%80022.2
20The University of ArizonaUSA360.5%65218.1
21University of WarwickEngland360.5%91725.5
22Harvard UniversityUSA350.5%4263121.8
23Indiana UniversityUSA350.5%135338.7
24University of CaliforniaUSA350.5%193055.1
25aKorea Advanced Institute of Science & TechnologySouth Korea330.4%165450.1
25bNational Tsing Hua UniversityTaiwan330.4%54316.5
Note: NO.TC = number of citations, AV.TC = average number of citations.
Table 5. A social network analysis of the collaboration network of the top 16 KM research institutions.
RankResearch InstitutionDegree CentralityResearch InstitutionBetweenness Centrality
1City University of Hong Kong44City University of Hong Kong1042.8
2Aalto University31National University of Singapore710.0
3Chinese Academy of Sciences31University of Cambridge451.0
4Boston College29Indiana University399.5
5Brunel University29The Hong Kong Polytechnic University356.3
6Carnegie Mellon University29Chinese Academy of Sciences352.0
7National University of Singapore29The University of Arizona338.7
8Brigham and Women's Hospital28Carnegie Mellon University334.4
9Arizona State University27Aalto University331.7
10Beihang University27University of Illinois331.3
11Boston University27Brunel University325.3
12Aston University26Arizona State University308.4
13Auburn University25Boston University292.1
14Cardiff University25Universitat de Barcelona289.3
15BI Norwegian Business School24The University of Maryland274.0
16Chang Jung Christian University24University of Oxford273.5
17Chung Hua University24Brigham and Women's Hospital266.0
18Universities in Asia23Beihang University218.0
19University of Cambridge23Penn State University216.0
20aBar Ilan University22National Cheng Kung University214.2
20bIndiana University22University of Warwick202.3
Table 6. The distribution of number of author with different numbers of articles.
NO.AU111221257511151926414112532814,808
NO.AR252120191817151413121110987654≤3
Table 7. The top 30 KM categories ranked by the number of publications.
Subject CategoryRecords% of Total
Management233430.6%
Information Science Library Science172322.6%
Computer Science Information Systems134917.7%
Computer Science Artificial Intelligence105013.8%
Operations Research Management Science78210.2%
Business7049.2%
Computer Science Interdisciplinary Applications5897.7%
Engineering Industrial4666.1%
Computer Science Theory Methods4616.0%
Computer Science Software Engineering3925.1%
Engineering Electrical Electronic3614.7%
Engineering Manufacturing3124.1%
Engineering Multidisciplinary3054.0%
Engineering Civil1682.2%
Education Educational Research1602.1%
Computer Science Cybernetics1542.0%
Economics1512.0%
Medical Informatics1512.0%
Health Care Sciences Services1241.6%
Environmental Sciences1091.4%
Social Sciences Interdisciplinary971.3%
Planning Development941.2%
Telecommunications931.2%
Public Environmental Occupational Health891.2%
Psychology Multidisciplinary831.1%
Ergonomics811.1%
Environmental Studies741.0%
Construction Building Technology710.9%
Automation Control Systems670.9%
Table 8. The betweenness centrality distribution and burst value of the KM subject.
RankRank by Betweenness CentralityRank by Burst
SubjectBetweenness CentralitySubjectBurst
1Engineering0.41Computer Science, Theory, and Methods84.68
2Computer Science, Interdisciplinary Applications0.31Computer Science, Artificial Intelligence78.32
3Management0.25Computer Science62.86
4Public, Environmental, and Occupational Health0.23Computer Science, Software Engineering30.63
5Psychology0.16Computer Science, Interdisciplinary Applications16.05
6Mathematics0.16Engineering, Multidisciplinary14.57
7Education and Educational Research0.16Science and Technology—Other Topics14.54
8Ergonomics0.16Psychology, Experimental13.8
9Engineering, Multidisciplinary0.14Computer Science, Information Systems12.25
10Engineering, Manufacturing0.13Environmental Sciences12.04
11Environmental Studies0.12Green and Sustainable Science and Technology11.7
12Psychology, Applied0.12Environmental Studies10.9
13Science & Technology - Other Topics0.11Mathematical and Computational Biology8.29
14Environmental Sciences and Ecology0.1Psychology, Multidisciplinary8.21
15aEngineering, Chemical0.1Psychology8.17
15bAgriculture0.1
Table 9. The top 20 knowledge management publication journals.
RankSource TitleRecords% of Total
1Journal of Knowledge Management4185.5%
2Knowledge Management Research &Practice2443.2%
3Lecture Notes in Computer Science2403.1%
4Lecture Notes in Artificial Intelligence2222.9%
5Expert Systems with Applications1982.6%
6International Journal of Technology Management1391.8%
7Decision Support Systems1091.4%
8Journal of Universal Computer Science1041.4%
9International Journal of Information Management981.3%
10Industrial Management Data Systems941.2%
11Information Management640.8%
12Knowledge Based Systems620.8%
13Journal of Computer Information Systems610.8%
14Journal of Information Science600.8%
15Kybernetes590.8%
16Journal of the American Society for Information Science and Technology580.8%
17Journal of Business Research560.7%
18Management Decision550.7%
19Computers In Human Behavior540.7%
20International Journal of Production Research540.7%
Table 10. The most important key words ranked by frequency with more than 25 uses.
Author KeywordFrequencyAuthor KeywordFrequency
knowledge management3401case study83
knowledge sharing371semantic web79
innovation245data mining78
Ontology/ontologies268knowledge acquisition77
knowledge management systems178communities of practice75
knowledge160collaboration73
organizational learning156project management71
knowledge transfer174social capital67
intellectual capital121organizational performance66
knowledge creation115absorptive capacity64
tacit knowledge98performance63
information management95competitive advantage58
information technology94management57
information systems93new product development56
organization culture87Web 2.056
learning83trust
Table 11. Keywords by degree centrality, betweenness centrality, and effective size.
KeywordDegree CentralityKeywordBetweenness Centrality
knowledge management804knowledge management409,205.3
knowledge sharing323knowledge sharing33,225.5
innovation248innovation17,793.34
knowledge transfer194ontology10,521.03
organizational learning185knowledge transfer10,416.32
knowledge184organizational learning8946.413
ontology176knowledge8879.887
knowledge creation158knowledge management systems6898.824
knowledge management systems155knowledge creation6300.001
learning148learning5458.257
information systems136information systems5039.425
tacit knowledge134tacit knowledge4859.399
collaboration127information management4369.465
information management122collaboration4126.945
information technology119information technology3869.026
intellectual capital118intellectual capital3704.719
knowledge acquisition114knowledge management (km)3635.064
performance106semantic web3409.226
semantic web104knowledge acquisition3283.395
communities of practice102communities of practice2992.594
social capital100performance2686.415
management98project management2570.325
project management96data mining2569.916
case study95management2496.138
organizational culture95social capital2375.459
data mining89case study2216.155
absorptive capacity88new product development2071.063
new product development87organizational culture1976.951
knowledge management (km)86internet1751.147
competitive advantage83absorptive capacity1730.339
Table 12. The top 15 most cited papers by citation counts.
RankCitation CountsFirst AuthorJournal (Book)Year
1231NonakaOxford University Press1995
2212AlaviMIS Quarterly2001
3199DavenportHarvard Business School Press1998
4133BockMIS Quarterly2005
5118WaskoMIS Quarterly2005
6109KankanhalliMIS Quarterly2005
780HansenHarvard Business Review1999
877WangHuman Resource Management Review2010
977NonakaOrganization Science2009
1076WengerHarvard Business School Press2002
1170WengerSystems Thinker1998
1267GoldJournal of Management Information Systems2001
1366LeeJournal of Management Information Systems2003
1465ChenJournal of Business Research2009
15a63ArgoteManagement Science2003
15b63HairPrentice-Hall2010
Table 13. Summary of the largest 15 KM clusters.
IDSizeSilhouetteLabel (TF*IDF)Label (LLR)Label (MI)Mean
Year
0260.961profitabilityAsia; call center; case study; modularity; dynamic capabilityknowledge acquisition; knowledge creation; knowledge sharing; knowledge transfer; barriers and facilitator2009
1200.974profitabilityknowledge management system; new product development; organizational knowledge management; corporate strategy; product developmentquality; knowledge management system; dimension; customer orientation; information system2000
2200.991social constructionist analysis; pseudo-knowledge sharingtechnology mediated learning; knowledge sharing; identity; gender; enjoymentservice quality; strategy; model;
satisfaction; performance; success
2004
3180.961empirical analysisboundary spanning; ERP system;
ERP usage; key user; information technology professional
innovation; thinking; managing knowledge; systems thinking; information2011
4180.975information sharing; work groupshuman resource management; innovation; ultra-peripheral region; manufacturing performance; knowledge managementhuman capital; human resource management; innovation; start up; human resource management2007
5180.936business format; conceptknowledge organization; product development; creation theory; management; communitydynamic capability; process alignment; organizational learning culture; competitive advantage; information technology2001
6180.93knowledge management tutorial; peopleknowledge management; cognitive congruence; schema; relationship script; resource-based viewresource based view; competitive advantage; firm; epistemology; creativity1999
7180.93knowledge management; knowledge assetsorganizational impact of knowledge-based system; knowledge engineering; core competency; job quality; knowledge-based systemintellectual capital measurement; knowledge management; intangible assert cognition1995
8180.835information technology management; successful knowledge management projectsstrategic alliance; knowledge transfer; causal ambiguity; organizational learning; knowledge managementresource based view; competitive advantage; firm; epistemology; creativity1995
9170.919biotechnology sectortransitive memory system; team performance; field study; group decision making; coordinating expertisehuman capital; human resource management; innovation; start up; corporate2002
10150.8information technology management; information technologySocio technical system; organizational memory; firm; appropriation problem; technological changemanagement of technology; technological learning; knowledge management; knowledge transfer; strategy1994
11150.894impact; innovationinformation sharing/withholding; knowledge transfer; reference group; profession; scienceknowledge market; dyadic knowledge; knowledge management; knowledge exchange; intangible knowledge2000
12140.953social media research; influenceknowledge based view; information system; social software; open innovation; managing knowledgeknowledge acquisition; knowledge creation; knowledge sharing; knowledge transfer; barriers and facilitator2010
13130.954fundamental issue; antecedentsinformation technology; organizational performance; business performance; competitive advantage; research propositiondynamic capability; process alignment; organizational learning culture; competitive advantage; information technology2005
14100.949learning processes; firm level perspectiveorganizational change; product development; model; transformation; technologysocial interaction; organization; innovation performance; manufacturing firm2006
Note: Clusters are referred to in terms of the labels selected by the TF*IDF, LLR (log-likelihood ratio), and MI (mutual information) methods. In information retrieval, TF*IDF, short for term frequency–inverse document frequency, is a numerical statistic that is intended to reflect how important a word is to a document in a collection or corpus, whereas those chosen by log-likelihood ratio(LLR) tests and mutual information(MI) tend to reflect a unique aspect of a cluster [44,59].
Table 14. Details of the largest cluster (Cluster #0).
Cluster DetailsCited Articles (ranked by citations)
Sustainability 10 00682 i001FrequencyFirst AuthorYearTitle
65Chen2009Strategic human resource practices and innovation performance: the mediating role of knowledge management capacity
63Hair2010Multivariate data analysis: A global perspective
55Zack2009Knowledge management and organizational performance: an exploratory analysis
43Heisig2009Harmonisation of knowledge management—comparing 160 KM frameworks around the globe
40Zheng2010Linking organizational culture, structure, strategy, and organizational effectiveness: Mediating role of knowledge management
38Hair2006Multivariate data analysis: A global perspective
36Haas2007Different knowledge, different benefits: Toward a productivity perspective on knowledge sharing in organizations.
36Hsu2007Knowledge sharing behavior in virtual communities: The relationship between trust, self-efficacy, and outcome expectations
35Darroch2005Knowledge management, innovation and firm performance
33He2009A comparison of purchase decision calculus between potential and repeat customers of an online store
Table 15. Details of the second largest cluster (Cluster #1).
Cluster DetailsCited articles (ranked by number of citations)
Sustainability 10 00682 i002FrequencyFirst AuthorYearTitle
80Hansen1999What’s your strategy for managing knowledge?
67Gold2001Knowledge Management: An Organizational Capabilities Perspective
66Lee2003Market Process Reengineering through Electronic Market Systems: Opportunities and Challenges
61Nonaka1998The concept of ‘Ba’: building a foundation for knowledge creation.
57Ruggles1998The state of the notion: knowledge management in practice
43Lee2001Exploring mediation between environmental and structural attributes: the penetration of communication technologies in manufacturing organizations
37Brown1998Organizing Knowledge
31Liao2003Knowledge management technologies and applications-literature review from 1995 to 2002
30Dell1998If Only We Knew What We Know: Identification and Transfer of Internal Best Practices
29Becerra-Fernandez2001Organizational Knowledge Management: A Contingency Perspective
Table 16. Details of the second largest cluster (Cluster #2).
Cluster DetailsCited Articles (Ranked by Number of Citations)
Sustainability 10 00682 i003FrequencyFirst AuthorYearTitle
133Bock2005Behavioral intention formation in knowledge sharing: examining the roles of extrinsic motivators, social-psychological factors, and organizational climate
118Wasko2005Why should I share? Examining social capital and knowledge contribution in electronic net- works of practice
109KankanHalli2005Contributing knowledge to electronic knowledge repositories: an empirical investigation
50Podsakoff2003Common method biases in behavioral research: A critical review of the literature and recommended remedies
44Ko2005Antecedents of Knowledge Transfer from Consultants to Clients in Enterprise System Implementations
34Lin2007A stage model of knowledge management: An empirical investigation of process and effectiveness
32Garud2005Vicious and Virtuous Circles in the Management of Knowledge: The Case of Infosys Technologies
29Ardichvili2003Motivation and barriers to participation in virtual knowledge-sharing communities of practice
28Alavi2005An Empirical Examination of the Influence of Organizational Culture on Knowledge Management Practices
28Delone2003Information System Success: A Ten Years Update
Table 17. Betweenness centrality ranking of the citations.
CentralityFirst AuthorYearSourceCluster ID
0.91Wang2010Human Resource Management Review4
0.89Teece1997Strategic Management Journal11
0.84Cabrera2006The International Journal of Human Resource Management4
0.81Argote2003Management Science11
0.81Reagans2003Administrative Science Quarterly11
0.81Argote1999Springer, Berlin11
0.8Quigley2007Organization Science11
0.67Hsu2007International Journal of Human-Computer Studies0
0.48Grant1996Organization Science11
0.41Lee2012Journal of Knowledge Management0
Table 18. Top 15 references with strongest citation bursts.
StrengthReferenceBurst Start YearBurst End Year
106.699Spender, J.C.; 1996, Strategic Management Journal19962003
78.583Grant, R.M.; 1996, Strategic Management Journal20052009
70.1433Nonaka, I.; 1995, Oxford University Press19992006
30.9065Alavi, M.; 2001, MIS Quart20102013
29.37Davenport, T.H.; 1998, Harvard Business School Press20132017
29.1145Bock, G.W.; 2005, MIS Quart20052002
26.2479Wang, S.; 2010, Human Resource Management Review20102013
25.7965Nonaka, I.; 1994, Organization Science20092013
25.3509Wasko, M.M.; 2005, MIS Quart,20052007
24.9287Kankanhalli, A.; 2005, MIS Quart20132017
24.7793Hansen, M.T.; 1999, Harvard Business Review20002006
23.7432Hair, J.F., Jr.; 2010, Prentice-Hall20102003
22.1144Wenger, E.; 1998, Cambridge University Press19982005
22.0813Leonard-Barton, D.; 1995, Harvard Business School Press20002006
21.9779Stewart, T.A.; 1997, Crown Business19972004
Table 19. Articles published in 2012 with subsequent citation bursts in descending order of local citation counts.
ReferenceCitationsTitleSourceBurstDuration
Krogh35How does social software change knowledge management? Toward a strategic research agendaJournal of Strategic Information Systems15.83912014–2017
Andreeva32Does knowledge management really matter? Linking knowledge management practices competitiveness and economic performanceJournal of Knowledge Management14.99192014–2017
Durst30Knowledge management in SMEs: a literature reviewJournal of Knowledge Management13.9632014–2017
Chen21Business intelligence and analytics: from big data to big impactMIS Quarterly10.03752014–2017
Zhou18How knowledge affects radical innovation: Knowledge base, market knowledge acquisition, and internal knowledge sharingStrategic Management Journal8.49992014–2017
Guthire14Reflections and projections: A decade of Intellectual Capital Accounting ResearchBritish Accounting Review7.84662015–2017
Lee18An integrated view of knowledge management for performanceJournal of Knowledge Management7.80462014–2017
McAfee12Big data: the management revolution.Harvard Business Review6.72342015–2017
Podsakoff14Sources of method bias in social science research and recommendations on how to control it.Annual Review of Psychology6.4572015–2017
Chan11An empirical investigation of factors affecting e-collaboration diffusion in SMEsInternational Journal of Production Economics5.61262014–2017
Four articles published in 2012 with subsequent citation bursts were review articles. Therefore, we deduced that review articles provide easier access to more citations in a short time period than other types of publications. This is consistent with previous studies [65].

