Taking the First Steps beyond GDP: Maryland’s Experience in Measuring “Genuine Progress”


1
Department of Political Science, Dalhousie University, Halifax, NS B3H 4R2, Canada
2
School of Environmental Science and Engineering, Shanghai Jiao Tong University, Shanghai 200240, China
*
Author to whom correspondence should be addressed.
Sustainability 2018, 10(2), 462; https://doi.org/10.3390/su10020462
Submission received: 6 November 2017
/
Revised: 4 February 2018
/
Accepted: 5 February 2018
/
Published: 9 February 2018
Abstract
:Gross Domestic Product’s (GDP) limitations as a prosperity indicator are now widely recognized, leading to a search for “beyond-GDP” alternatives. The US state of Maryland has calculated one such alternative, the Genuine Progress Indicator (GPI), since 2010. What effect is Maryland’s GPI having in practice? Is there any evidence to date that the GPI has shaped policy and public priorities in ways that live up to its supporters’ hopes—whether for a transformative shift beyond the economic-growth paradigm or simply better policymaking? What key obstacles exist to fulfilling those goals? This article draws on semi-structured interviews with elite respondents—including Maryland’s former governor, senior public servants, academics, non-governmental organization employees and foundation leaders—involved in producing, advocating and using the GPI, along with analysis of relevant documents. Although significant impacts on policy are not yet evident and a change of governor has removed high-level support, the GPI initiative has revealed innovative possibilities for more environmentally and socially minded policymaking and introduced new ideas with potential long-term impacts. However, various challenges remain, including strengthening the political constituency behind the GPI, more deeply embedding it into the policymaking process and addressing the GPI’s own limitations in supporting a beyond-GDP economic narrative.
1. Introduction
Gross National Product “measures neither our wit nor our courage, neither our wisdom nor our learning, neither our compassion nor our devotion to our country, it measures everything in short, except that which makes life worthwhile. And it can tell us everything about America except why we are proud that we are Americans.”Robert F. Kennedy, quoted by Maryland Governor Martin O’Malley [1]
Gross National Product (GNP) and Gross Domestic Product (GDP), which measure the monetary value of goods and services produced in an economy, have often been treated as proxies for progress or wellbeing, despite their long-recognized limitations for that role [2]. Among other limitations are the failure to account for environmental costs, inequitable distribution and the value of non-market economic activity—much of which is undertaken by women [3,4,5]. Some critics argue that in a world in which ecological constraints are increasingly evident, further GDP growth can generate environmental and social costs that exceed economic benefits—in other words, “uneconomic growth” [6,7,8]. Critics of the growth paradigm similarly argue that, beyond a threshold where core material needs are met, little if any association exists between continued GDP growth and happiness, life satisfaction, or wellbeing e.g., [9,10,11,12].
Many proponents of alternative prosperity indicators see them as potentially transformative e.g., [8,13]—a key step in dethroning economic growth as a dominant priority in favour of sustainability, equity and less consumption-intensive sources of wellbeing. Yet interest in beyond-GDP measurement has also grown among policymakers, economists and organizations who see them as a reformist tool for better policymaking without directly questioning the growth paradigm e.g., [14,15].
Many beyond-GDP alternatives aiming to better measure wellbeing and sustainability have emerged [16]. These include composite indices that aggregate multiple social and ecological indicators into a single number (e.g., the Human Development Index), dashboards of multiple measures [15] and subjective wellbeing measures based on surveys of individuals [17]. Other alternative measurement systems make adjustments to GDP, such as the Genuine Progress Indicator (GPI). It starts with personal or household consumption expenditures, which are adjusted for inequality before incorporating estimated monetary values for a range of economic, social and environmental costs and benefits—such as underemployment, pollution and environmental degradation, the value of housework and volunteer work and leisure time, etc. [18,19,20,21]. (See Appendix A for more detail).
In 2010, Governor Martin O’Malley’s administration announced that Maryland would begin calculating the GPI, making it the front-runner among US states. Maryland is the wealthiest state—measured by median household income—in one of the world’s richest countries in per-capita GDP terms. However, like the United States as a whole, it is quite unequal [22,23], with some of America’s most affluent communities [24] and concentrations of poverty. At the centre of the state is the ecologically rich Chesapeake Bay, which provides many economic and social benefits, while facing threats from development, polluting runoff and other challenges [19]. The state has experienced considerable suburban sprawl and—in the region bordering Washington, DC—America’s worst traffic congestion [25] (p. 18), along with policy responses aiming for “smart growth.” Although its per-capita CO2 emissions are relatively low by US standards, they remain high by international comparison. Maryland thus offers an interesting setting to consider wellbeing and “genuine progress” measurement.
Supporters hailed Maryland’s GPI launch as a “major step forward in developing a new model for measuring economic performance” [26], “a bold and transparent step toward a working relationship between nature, people and the economy” [27], and—in the words of environmentalist Paul Hawken—a “significant leap into an economy that will benefit this and future generations” [28]. With Maryland and others in mind, one media headline proclaimed that “States are ditching GDP” [29], while an academic article stated that Maryland had adopted the GPI as its “main measure of economic welfare (replacing GDP) … Policy options are now valued in terms of their impact on GPI instead of GDP” [30] (p. 165).
In fact, neither Maryland nor any other state has abandoned the GDP or its sub-national equivalent, the Gross State Product (GSP). While Maryland has taken important steps toward more comprehensive prosperity measurement, the overstatement in some accounts of what has occurred suggests a need for careful analysis of the state’s GPI. What have the impacts been of Maryland’s GPI initiative? Is there any evidence to date that the GPI has shaped policy and public priorities in ways that live up to supporters’ expectations, whether for better policymaking or more radical transformation? What key obstacles exist to fulfilling those expectations?
2. Methods
To answer these questions, one important source of information is 14 semi-structured interviews, 11 of which were conducted with elite respondents—including former Governor O’Malley, senior public servants, academics, non-governmental organization (NGO) employees and foundation leaders—involved in the Maryland GPI initiative. (See Appendix B for Interviewee list). We also draw on interviews with three individuals involved in other US GPI initiatives, whose experience and analysis has relevance to issues in Maryland. (This article is part of a wider research project looking at numerous beyond-GDP initiatives, with initial work on Canada and Britain [31,32] and research in progress on Vermont). Interviewees were identified based on: the authors’ existing contacts with people working in this field, a review of websites and documents produced by organizations involved in these issues and snowball techniques as initial interviewees provided further contacts. After writing a first draft, we contacted respondents again to review and, if necessary, revise or update points from their interviews. The goal of these interviews is not to generalize from the sample to any larger population but rather to draw on insiders’ knowledge of Maryland’s GPI initiative, the hopes for it, its impacts and obstacles encountered.
Another key source of data on these same issues is the analysis of documents—such as press releases, speeches and reports—from government agencies and NGOs involved in producing, using and supporting the GPI. These include documents provided by interviewees and GPI-related materials found on the websites of the Maryland General Assembly, State Archives and Department of Natural Resources (DNR). We also reviewed all news items on the Maryland GPI found on the Lexis Nexis database, Google and the websites of two major area newspapers—the Baltimore Sun and the Washington Post (which serves many readers in D.C.’s Maryland suburbs)—using “genuine progress indicator” and “GPI” as search terms.
3. Beyond-GDP and Sustainability Indicators: Literature on Impacts, Uses and Obstacles
Beyond-GDP measurement has raised hopes of significant social change e.g., [33] (p. 255) and might over time play a role in the emergence of a “green state” that prioritizes ecologically sustainable and socially just outcomes while favouring a less consumption-oriented vision of wellbeing [31]. Yet research has so far struggled to find evidence of direct policy impacts, not only for recent beyond-GDP wellbeing measurement initiatives [30,31,32,34,35] but also for the sustainable-development indicators that proliferated globally after the 1992 Earth Summit [36,37,38,39]. Much effort has gone into designing and improving indicators but even if well-constructed technically and policymakers are aware of them, policy impact is not guaranteed [36]. Indeed, alternative indicators have long suffered from a “vain expectation that data in itself would inform policy and the more data the better” [40] (p. 19; see also [36] (p. 34)). One issue has been the need for more emphasis on linking indicators to policy action and effectively embedding them in decision-making processes [35,38]. Another is that policy-making in practice rarely lives up to the rationalist-positivist vision of indicators serving as tools that lead directly to “evidence-based policymaking” and better decisions [37,40,41]. Influences on policymakers include ideology, interests, information and institutional constraints—information being only one of four “I’s” [36]. Indeed, there can be ideologically motivated resistance to new indicators and other evidence that runs counter to a predetermined political agenda [31]—a seemingly growing challenge with the rise of “post-factual politics.”
Researchers have identified many other obstacles to the use and influence of beyond-GDP indicators. One way to categorize them is “context” (or “policy”), “indicator” and “user” factors [30,39]. Some barriers arise from the political and policy context, such as difficulties in challenging GDP’s dominance during the recent recession when restoring economic growth dominated political debate [30], or the lack of strong political demand for governments to use new indicators [32,35]. Indicator factors refer to alternative measurements’ quality, robustness and underlying methods (e.g., disagreements over the validity and desirability of economic valuation of environmental and social costs), problems with data availability and timeliness, etc. [30,35]. User factors are barriers related to potential users of new indicators and their expertise, preferences and beliefs, including the incompatibility of some alternative wellbeing measures with the needs of actors in the policy process [30,36].
Also among the challenges is finding the right language to name indicators and construct a compelling political narrative alongside them, avoiding the resistance and even mockery that greets some terminology (as discussed below) [32,35]. Existence of numerous alternative measures has created difficulties in reaching consensus on which beyond-GDP measure(s) to prioritize [31,32,35] and a “cacophony of signals” from multiple indicators to be “digested by indicator users” [36] (p. 20). The economic-growth paradigm’s continued dominance of mainstream politics creates strong obstacles to the extent that beyond-GDP measurement is seen as a challenge to that paradigm [32,35,36]. Questions have also been raised about the democratic legitimacy of alternative indicators [35], especially those emerging through technical debates without participatory consultation and democratic deliberation, which some observers consider essential for indicators to have impact e.g., [40].
While such obstacles have to date limited the direct influence of sustainability and wellbeing indicators as inputs into specific policy and decision outcomes—i.e., “instrumental use”—some researchers highlight the possibility of indirect pathways of influence over a longer term through “conceptual use,” in other words, by introducing new ideas and reshaping frameworks of thought and mental models [37,39,41,42,43]. Another key category is “political use,” in which indicators serve as “ammunition” to support users’ positions—including legitimizing predetermined positions—and persuade others to see problems in a particular way. There is also “tactical” use of indicators as a “delaying tactic, as a substitute for action or to deflect criticisms” and “symbolic use” that gives “ritualistic assurances that those who make the decisions hold appropriate attitudes towards decision-making” [42]—which can be grouped under “political” use [37,39]. We draw on the concepts of instrumental, conceptual and political use to understand Maryland’s GPI experience.
4. Maryland’s GPI Initiative
4.1. Overview
Democrat Martin O’Malley became governor in January 2007. In its first year, his administration established an Office for a Sustainable Future. Its sustainability policy director, Sean McGuire, trained in environmental policy and ecological economics at University of Maryland, proposed that the Office examine alternative progress measures [44,45,46]. That idea was taken forward to the governor, who agreed the Office should pursue it [46]. O’Malley explained that one reason for his openness to the idea was that he had been “inspired by the words and spirit of Robert Kennedy’s campaign in 1968. I always remembered that quote that the ‘gross national product measures everything except that which makes us proud to be Americans [and] makes life worth living’ [47].”
In 2009, a working group with officials from the Department of Natural Resources and other state agencies was established to explore alternative measures to complement the Gross State Product [19,44]. The working group considered other alternatives; McGuire was initially more interested in the New Economics Foundation’s Happy Planet Index (HPI) [44,48]. Obstacles to using the HPI quickly became apparent, including data availability as two of three necessary indicators were lacking. Mocking reaction was another concern; McGuire explained that in his experience politicians inevitably responded with laughter to being told of the “Happy Planet Index” [44].
In contrast, data necessary for the GPI was readily available without much additional work [19,44,46]. The GPI offered an “established” framework that was “academically accepted” [44]. Although not a decisive factor, the GPI had the “virtue” of a “Maryland intellectual provenance” [49], as it grew out of University of Maryland ecological economist Herman Daly’s Index of Sustainable Economic Welfare [50]. Working group members saw advantages to a measure based on monetary values as “numbers matter and monetary numbers matter even more” in policymaking [19] (p. 53), while monetization made the GPI the “most comparable to GDP” among the alternative options and easily understandable as it is based on “logical units of benefit or cost” [51]. Another benefit of a measure based on monetary valuation was greater ease of using it in a budgetary decision than an index between zero and 100 or another non-monetary scale [44]. That said, an indicator based on monetary valuation of numerous environmental and social factors had to contend with the “perception that we’re making numbers up”—using “Yahtzee dice and Ouija boards,” as one critic alleged [44]. (Other criticisms of the GPI are discussed below).
The Maryland GPI’s official launch took place in February 2010. Although academics and others had previously calculated the GPI for some American states e.g., [52], Maryland had the first state government to do so—and the only one to update figures annually [53]. In 2012 and 2013, Governor O’Malley hosted two national GPI summits [26,54]; the second, larger summit attracted delegates from more than 20 states.
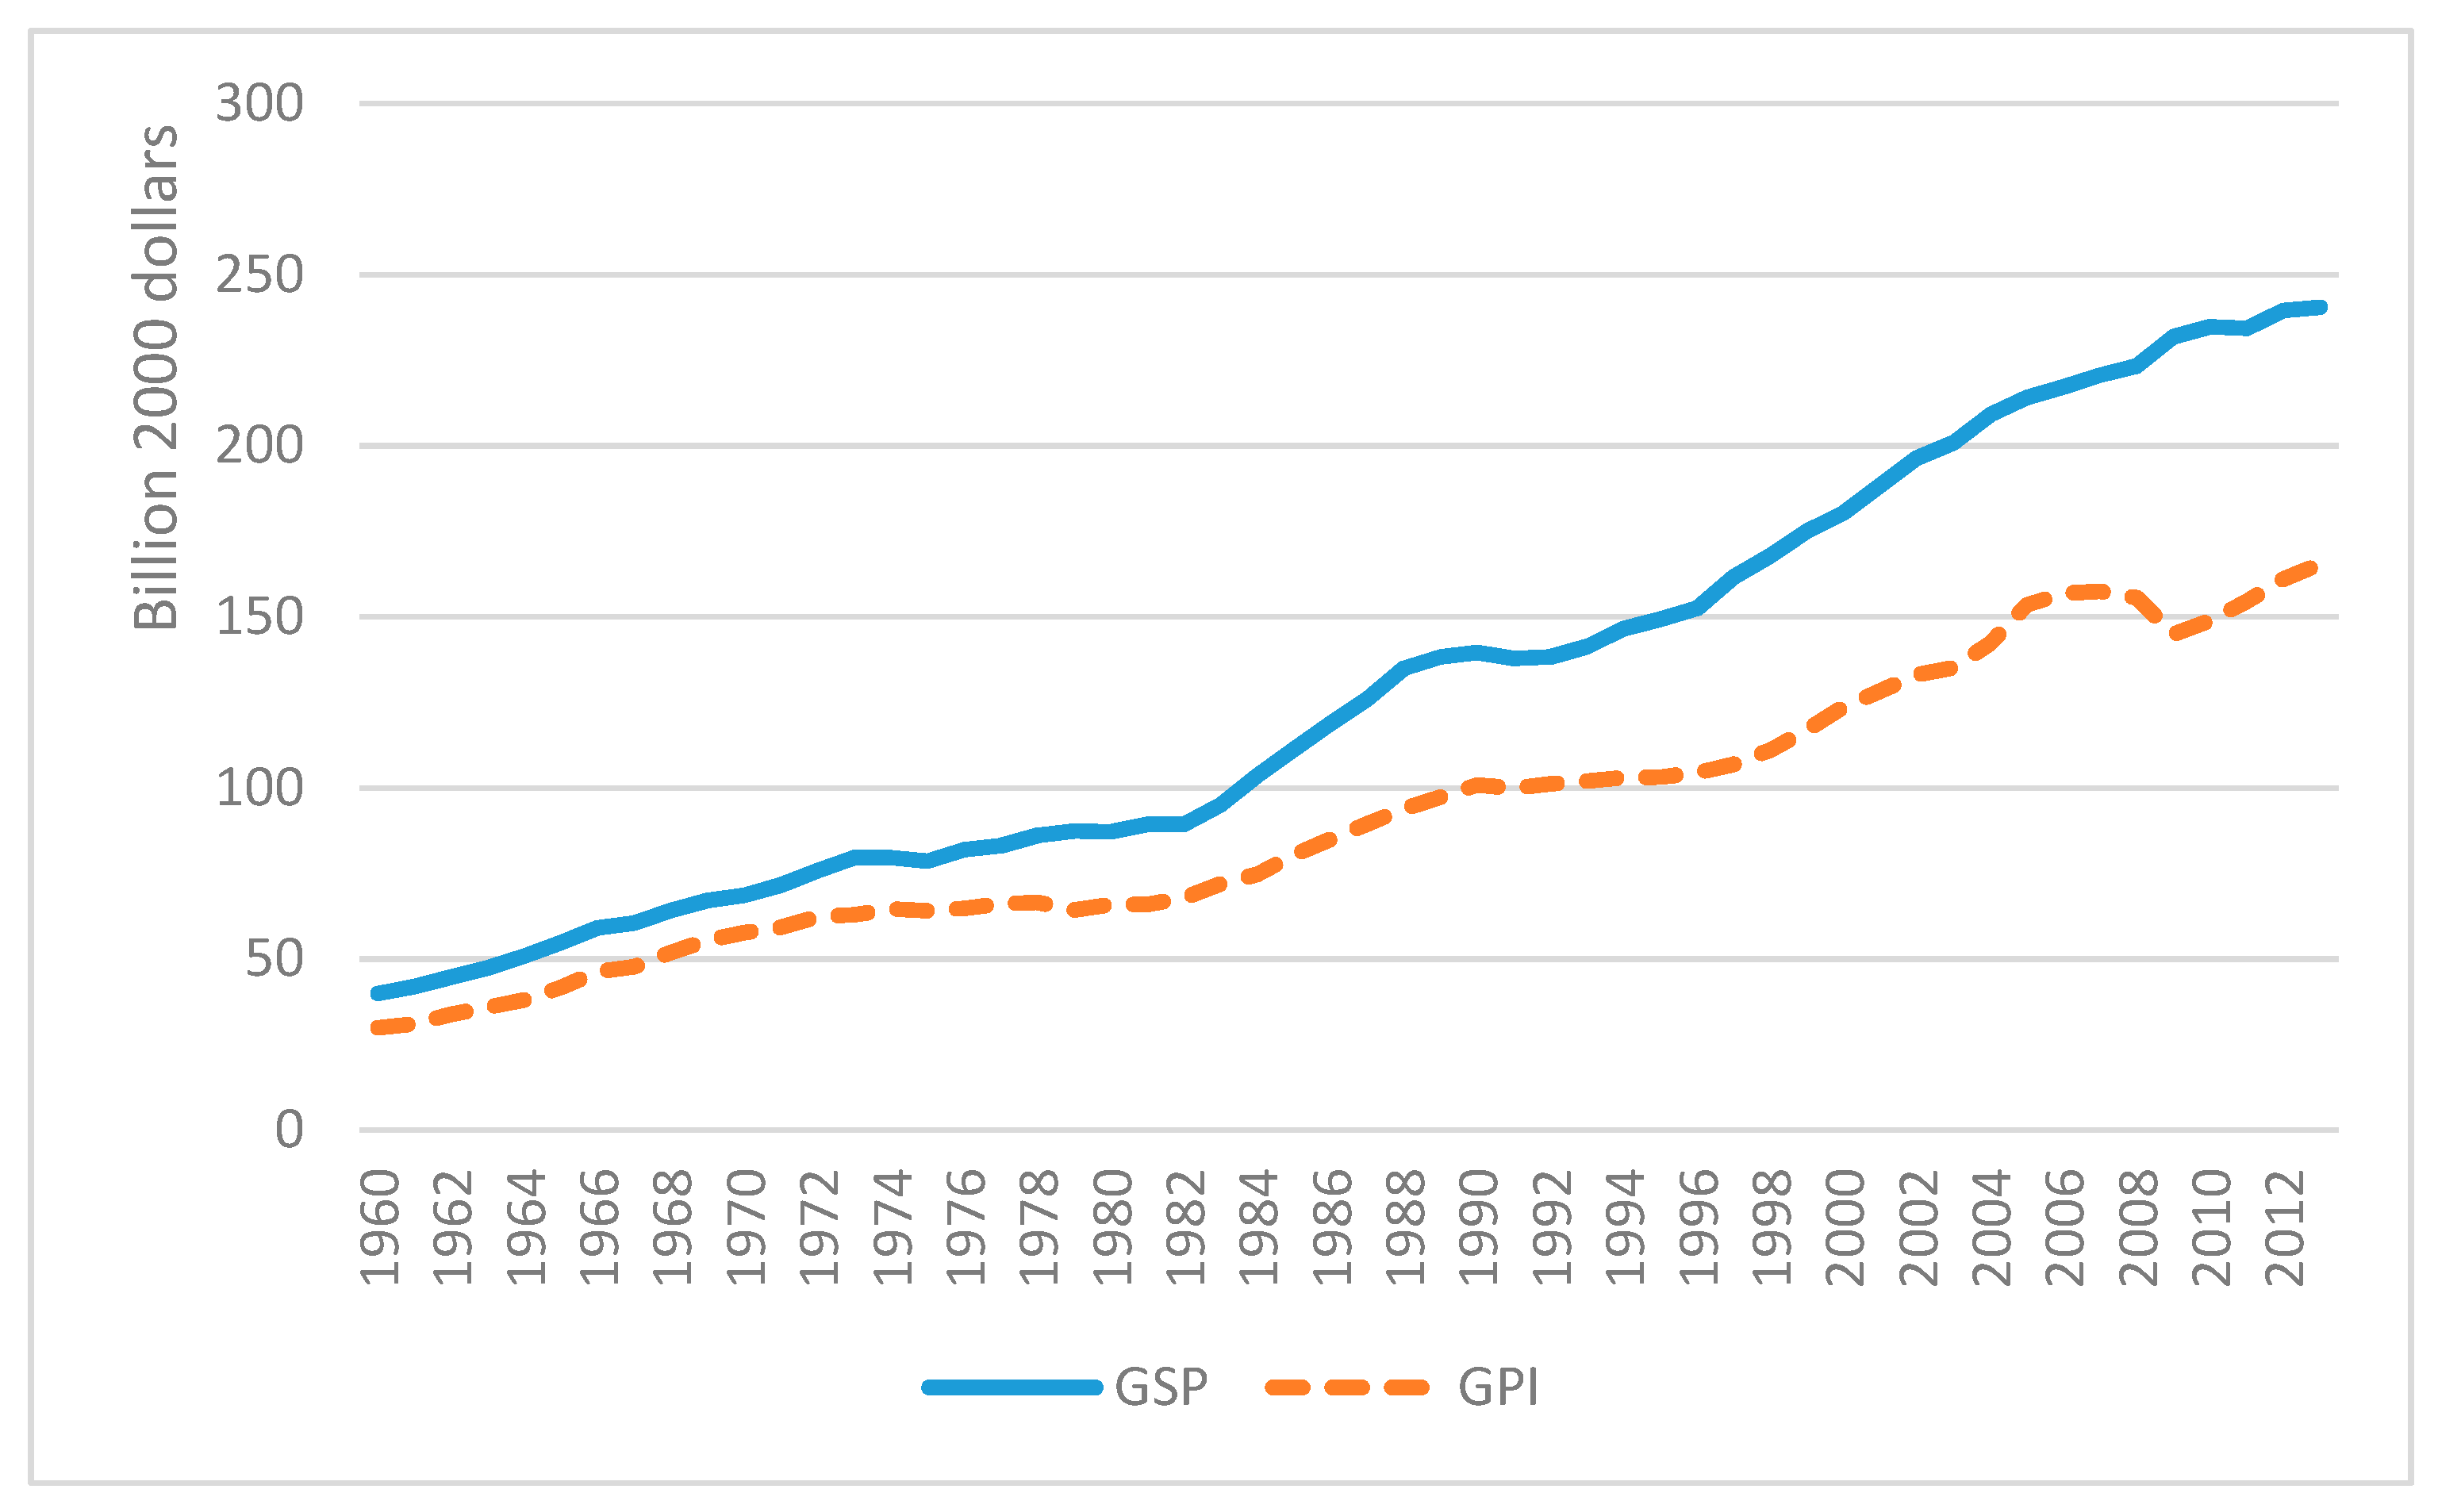
Maryland’s first GPI data, released in 2010, used the “GPI 1.0” methodology, incorporating 26 economic, social and environmental variables (see Appendix A). It showed that GPI, at roughly $150 billion, was only about two-thirds as high as the Gross State Product of $220 billion [55,56]. This GPI-GSP gap was relatively small from 1960 until the mid-1980s, before widening substantially (Figure 1), driven largely by growing income inequality [57,58]. The data did not, however, support the “threshold” hypothesis of ecological economists, who argue that GDP/GSP growth no longer improves quality of life once a certain threshold of material needs is crossed [12], or the related idea that growth had become “uneconomic” in high-income nations [6,7,8]. Although Maryland’s GPI grew more slowly than GSP and dropped even more sharply than GSP during the 2008–2009 recession, it showed no sign of plateauing [53].
Maryland produced a series of GPI 1.0 updates, resulting in time-series data from 1960 to 2013 (Figure 1). This showed a strong GPI recovery after the recession, increasing 14 percent from 2009 to 2013 [56]. Later releases used an updated 2.0 methodology (see Appendix A), which state officials contributed to developing. GPI 2.0 data from 2012 to 2015 showed a 6 percent GPI increase over that time [21]. Related work by the state and NGOs also emerged, such as pilot Net Present Value Plus (NPV+) analysis, a push for “GPI notes” on the impact of proposed policies and a broad Quality of Life Initiative, discussed below.
O’Malley’s second term ended in January 2015. Under his Republican successor, Larry Hogan, some work on GPI applications came to a halt, while the governor’s GPI web page was removed. Although “de-emphasis on the use of the GPI” was evident, at the time of writing, the DNR still maintained its own GPI web pages, annual updates continued and the DNR maintained partnerships with GPI users outside government [53,59].
4.2. Hopes and Motivations
Before considering the Maryland GPI’s impacts, we examine the wide-ranging hopes and motivations behind it.
4.2.1. Exploring the Possibilities of a More Complete Picture of Prosperity
For some key players, Maryland’s GPI began as something exploratory. There was no “master plan” for the GPI to “take over,” explained a former state official, who said, “it was really an internal exploration” of how the GPI could work as a policy analysis tool [44]. Another interviewee’s initial goals included determining if the data existed to produce the GPI at the state level in Maryland, seeing “how much traction does it actually get with people who make real-world decisions?” and seeing it “live on beyond this one effort” [60]. An NGO-sector interviewee explained that, at the outset, his organization “didn’t have any clear ideas” about how they would like the GPI used in policymaking but saw state recognition of the GPI as an “opportunity”—an initiative to follow to “see where it can get us” [61]. Meanwhile, Governor O’Malley said, “I knew that we were planting seeds more than cultivating the fruit” [47].
One thing clear from the outset in official statements was that Maryland’s GPI was “designed to complement but not replace, traditional economic measurements, such as the Gross State Product” e.g., [28,62,63]. The same statements also presented the GPI rather modestly as an “educational tool.” There was an emphasis at first on getting “some general understanding with as many Maryland citizens as possible as to why they needed to start to think in terms of a broader sense of prosperity and progress,” explained a senior state official [45] (see also [19]).
Rather than replacing GDP, individuals involved in developing the state GPI sought additional measurements “to more accurately depict overall conditions for Marylanders” McGuire, quoted in [64], provide a “more complete picture as we strive for a sustainable future and grow a stronger economy” and offer a “truer measure of our prosperity” Griffin and O’Malley, quoted in [28].
For some, GPI was key to “fully accounting for all the benefits and costs that economic activities create” [51], which promised a clearer view of social reality. “To make the shift to a restorative economy … invisible or disregarded economic impacts must be brought to light,” wrote McGuire et al. [19] (p. 51). An interviewee spoke of hope that the GPI would allow “a more nuanced conversation” about what economic growth really means, “rather than blindly trying to grow the economy” [60].
Ensuring that ecological and social concerns receive due consideration in decision-making was clearly a strong motivator for many involved. “Business as usual economics is wrecking the planet, wrecking people’s lives,” said one interviewee, who saw the need for “different headline metrics of economic welfare to start making more rational economic decisions” [51]. Meanwhile, Governor O’Malley stated, “Perhaps, there is no better description of the intent of GPI. Its purpose is to further the conditions that are conducive to life” [65]. A related hope was that the GPI would be “capable of inspiring more sustainable policy choices” [66]—or, as O’Malley put it, help “us to see why it was so important that we be ahead of the curve” in cutting greenhouse gases (GHGs), reducing pollution of waterbodies and investing in mass transit [47]. GPI supporters also saw its value in “illuminating” inequality’s costs [67] and showing “how well our policies and programs and investments in Maryland are actually enhancing the quality of life” [68]. More generally, by showing a growing gap between GDP and “genuine progress,” the GPI could lead to efforts “to identify and reverse those drivers that made the two diverge” Ruth, quoted in [49].
4.2.2. Better Policymaking and Data-Driven Governance
Hopes for the GPI included instrumental use as it held the promise of enabling “better decisions” [44] and “more informed, sustainable policy choices” [28] and helping policymakers “better balance the costs and benefits of decisions” [62].
The governor’s support for the GPI initiative was linked to his overriding interest in data-driven governance [44,47,60,69]. As a Baltimore councillor, he saw a contrast between his city’s growing violence and New York’s success in using technology, data and performance management to reduce crime. “I saw a new way of governing emerging, where things can be done not on the basis of ‘because I said so’ but ‘because I can show you it works’,” he said [47]. Later, as mayor, he established CitiStat to gather data, assess the city’s performance in providing municipal services and improve efficiency [70]. As governor, he similarly established StateStat along with 15 core goals, including recovering 100 percent of jobs lost during the recession, improving the health of Chesapeake Bay, reducing infant mortality and violent crime and cutting GHGs 25 percent by 2020 [47,65]. “All of these things were really about improving the health and wellbeing of our citizens,” he explained. “In the course of pursuing these actions and goals we were searching for a better and holistic way to measure the wellbeing of our citizens and whether or not we were improving that wellbeing” [47].
4.2.3. Overcoming Policy Silos
As in other jurisdictions with alternative prosperity indicators [31,32], some proponents of state-level GPI initiatives saw them as a way to “help agencies work together—as opposed to pulling in different directions” by providing a comprehensive measurement to guide overall efforts Jon Erickson, quoted in [71]. An interviewee similarly saw the GPI as a “mechanism for cross-boundary communication within a government” by getting “people from different agencies talking to each other with a common goal” [72]. Another stated that “the power of the GPI is that it lets you analyze seemingly disparate policies and recognize these two are strongly related.” He gave an example from Oregon, where GPI-related work showed that housing security was a key factor affecting third-grade reading proficiency [44].
4.2.4. Budgeting and Analysis of Policy Options
One potentially very significant use—indeed one of Governor O’Malley’s main hopes—was that the GPI “would be a way to inform the budget-making process” [47], see also [19,51]. Unlike Vermont, with its GPI Act of 2012, Maryland did not have legislation expressing an intent to use the GPI—once established and tested—in budgeting but state officials were interested in how to do so [47]. Also related to budgeting was O’Malley’s “hope that these indicators would aid us in building consensus around tough policy choices.” He spoke, for example, of the difficulty—during a recession when people were losing homes and wages stagnated—of asking citizens to pay more to clean up Chesapeake Bay, a political task that more comprehensive prosperity measures including environmental costs and benefits might facilitate see also [19]. Similarly, some GPI proponents saw it as a tool to show that “some public costs can be better understood as smart investments” [29].
A related idea that garnered considerable interest was to analyze the projected impacts on GPI of proposed policies in a “GPI note,” which would be more comprehensive than existing fiscal and policy notes that estimate impacts on government finances. Non-profit and advocacy organizations such as the Institute for Policy Studies [73] and Center for Sustainable Economy [74,75] were among the main supporters. The leaders of Maryland Non-profits and the Town Creek Foundation said, respectively, that the GPI note was the source of the “highest hopes” for the GPI’s use in policymaking [68] and the “clearest notion” of what campaigners could demand of the state in using the GPI [61].
4.2.5. Promoting the State’s Strengths & a High-Road Economic Strategy
For Governor O’Malley, the GPI “was a good way to talk about the strength of our state when it comes to keeping our own businesses and our own jobs and building up our economy.” Rather than promoting Maryland as a place to invest due to low taxes, he said, “We are a high-value state and that value is our quality of life” [47]. (Comparative analysis showed Maryland was both a high-GPI and high-GSP state [76] (pp. 28, 30)). For O’Malley, using the GPI to promote the state’s quality of life also had potential in attracting the globally-mobile “creative class” of highly-educated skilled workers—and appealing to voters. “While jobs and opportunity were the center of our messaging, improving our quality of life and achieving genuine progress were also part of that messaging,” said O’Malley. “Public safety, public schools, the health of our air and water, traffic congestion, median family income—better results on all of these indicators was the proof we offered voters” [47].
The governor put forward a “pro-growth vision” of “a Maryland that is smart, green and growing” [77], see also [28]. However, O’Malley was more explicit than some “green growth” proponents in saying that “not all growth is good” [65], reflecting the GPI’s emphasis on the need “to subtract the kind of growth that’s bad for people, while still measuring the kind that’s good” [78]. In an interview, without abandoning a pro-growth vision, he edged a little further away from the conventional growth paradigm, stating that: “… the old measure of whether we’re progressing which was based on the measurement of dollars and consumption for consumption’s sake, growth for growth’s sake doesn’t really serve these times as well as more holistic measures. In other words, there’s a new story emerging that’s not about growth for growth’s sake … [a] shift in thinking, from consumption for consumption’s sake to wellbeing and health as the new narrative … [47].”
4.2.6. Transformative Goals
Challenging the growth paradigm was a goal of some GPI supporters. The growth critique is “central to all the practitioners that work on the GPI,” said ecological economist John Talberth, referring to others like him who had developed and refined the indicator [51]. The GPI is “a subversive lever for change because it can be defended on sound neoclassical economic principles,” said another interviewee. “Yet, done correctly, the GPI leads to radical conclusions,” such as the idea that “we are in an era of uneconomic growth” [79]. The Town Creek Foundation also had a critical perspective on growth and discussed its support for alternative prosperity indicators in the same breath as efforts “to undermine mindless consumerism and promote the value of sufficiency” [80] (pp. 9, 13)—although it did not expect all its partners to “go all the way down that road with us” [61].
Town Creek’s financial support of GPI-related work was part of its quest for a sustainable and equitable economic transformation going well beyond incremental reform—in other words, a “new economy” [80] (pp. 12–13). A Foundation report cited systems theorist Donella Meadows, who “identified the goals of a system as a key point of intervention for generating change. This is the insight that informs work to develop and deploy alternative indicators of social progress” (p. 15).
The Foundation’s executive director, Stuart Clarke, told the second state GPI summit that conversations about alternative indicators could be a “platform” on which people concerned about environment, equity and health “come together and recognize that there is the possibility of a shared vision of sustainable prosperity that they can organize themselves around” [81]. He thus saw “some potential” for the GPI to “support a broader coalition” based on a “common interest among different advocacy communities who were all disadvantaged by the systemic tilting of the playing field toward business interests” [61]. By integrating social and economic considerations alongside economic values, the GPI could help level that playing field and serve as a transitional strategy that opens up “space in which more transformational possibilities can be cultivated” [80] (p. 9). In other words, the Foundation saw support for GPI as one of its investments that “seeks to undermine the power of existing political, economic and cultural arrangements that disadvantage sustainability” (p. 12).
Transformative goals were also expressed at the second state GPI summit in Maryland by Oregon First Lady Cylvia Hayes, who defined the political challenge not as a matter of “economic recovery” but “economic reinvention” [81]. Others linked the GPI to the goal of “fundamental, systemic change” [19] (p. 57) or stated simply that “GPI = System Change” [73] (p. 10).
4.3. Uses and Impacts
In light of the aforementioned hopes, we consider the Maryland GPI’s actual uses and impacts.
4.3.1. A Low-Profile Initiative
The GPI initiative was not the high-profile break with the GDP/GSP that some hoped for and some reports suggested. A search for articles in the Baltimore Sun, the state’s largest daily newspaper, found only one news report focused on the Maryland GPI after the public launch in 2010 until early 2017 [55], along with one op-ed by a GPI supporter [67] and four items on other topics that briefly mentioned Maryland’s GPI e.g., [82]. While media coverage of GDP figures is commonplace, we found no record of any Baltimore Sun reports on releases of state GPI data. (The Washington Post, whose local coverage includes Maryland news, had even more limited coverage, including a letter and op-ed promoting the GPI in general [6,83] but no reports specifically on Maryland’s initiative. Some other media outlets, including public broadcasters PBS [59] and NPR [79], did report on Maryland’s GPI).
Although Governor O’Malley mentioned the GPI in some speeches, the past president of Maryland Non-profits, an organization that supported the GPI, could nevertheless write that, “most lawmakers don’t know it exists” [82]. Meanwhile, an interviewee stated that, “there hasn’t really been a debate over the Maryland GPI because it never achieved enough visibility and/or significance to generate that debate” [61].
The low profile was, at least in part, intentional. The GPI’s launch came with relatively little fanfare. “This was not on the front page … We had a press release, a little bit of interest, nothing really big,” said McGuire [44]. “There was no ticker tape parade.” He added that attempting to require the GPI’s use through legislation might have increased the initiative’s profile but also would have risked generating pushback. “Why pick a fight? Why open yourself up to getting this shut down before it even begins?” he asked, emphasizing the value of working on early-stage applications “behind the scenes” [44]. An additional factor was that, although the administration had genuine interest in the GPI, there were other pressing priorities. “We were told we had three main objectives in Maryland government: jobs, jobs and jobs,” McGuire recounted [44].
4.3.2. Direct Policy Impacts (Instrumental Use)
Precise policy impacts from Maryland’s GPI are hard to pinpoint—a situation also evident with other beyond-GDP measurement initiatives [32]. “I don’t think anyone can step up to the plate and say, ‘we used the GPI in the policy arena and we were successful in changing policy A to policy B.’ I don’t think that’s happened yet,” said one interviewee [51]. Another stated, “I can’t honestly say because of the GPI this crime bill [for example] was changed. That never occurred” [44]. One interviewee offered Maryland’s climate policies as an example consistent with the GPI’s more comprehensive assessment of costs and benefits, although the policy choice did not flow directly from GPI analysis [45,46]. With regard to using the GPI to inform the budget process, Governor O’Malley explained that “we never really got all the way there on that” [47]. (While the GPI’s effect on budget decisions is not directly apparent, impacts in the opposite direction are likely as some budgetary decisions almost certainly boosted the GPI—such as “record investments in education, college affordability and Chesapeake Bay restoration,” in Governor O’Malley’s words and shifting transportation investment so that the majority went to mass transit and rail rather than roads [47]).
While major impacts on state policy are not evident, the GPI framework influenced at least one management decision within DNR: whether to consolidate many small DNR offices in western Maryland into a single large office. Consideration of GPI variables—such as the cost of longer commuting times for employees, air pollution, lost leisure time and increased risk of accidents with longer distances travelled—was one reason the proposal was rejected [44]. Despite that small example of a GPI lens affecting decision-making, “the GPI’s effectiveness in influencing policy is still an open question,” as one interviewee stated [51].
4.3.3. Policy Analysis
Some GPI-impact analysis of policy ideas did occur within the state bureaucracy. McGuire recalled that people from other departments would ask him to run an idea “through the GPI meat grinder” to “see what comes out” in terms of projected impacts [44]. For example, DNR worked with the Department of Transportation to analyze the governor’s already-announced goal of doubling public transit ridership by 2020, which showed improvements on many indicators underlying the GPI, such as reduced air pollution, increased leisure time due to less congestion and fewer accidents and fatalities [44,45]. (Note that in this example, GPI analysis supported but did not lead to, the policy choice). There was also exploratory work to assess the benefits of DNR projects in 25 GPI-related areas on a “value-added scorecard,” which had potential as a tool for project management, budgeting, assessment and prioritization [44,84].
While the state did not produce “GPI notes” on the impacts of policy proposals, for reasons discussed below, the non-governmental Center for Sustainable Economy (CSE) did create a prototype. It estimated that a legislated minimum-wage increase would generate $1.7 billion in net benefits as increased personal consumption expenditures for minimum-wage earners and reduced inequality, crime and underemployment outweighed the costs [75]. The analysis differed greatly from the Department of Legislative Services’ less comprehensive Fiscal and Policy Note, which highlighted net costs to state and local governments from paying for expanded enforcement and higher wages for their employees [85].
The CSE’s GPI-related analysis included examining a scenario in which Maryland returned to the greater equality it enjoyed in 1968, which would increase GPI more than $65 billion—equivalent to more than one-fifth of Maryland’s $300 billion GSP [86]. It also worked with the Baltimore Sustainability Commission to produce a Baltimore GPI [87], which it used to assess some sustainability policies. Analysis of the city’s Stormwater Management Plan showed potential annual economic benefits of over $25 million, assuming inclusion of GPI-enhancing features such as local hiring preferences and a greater emphasis on green infrastructure, amounting to nearly a 40 percent social return on investment [88]. Meanwhile, Baltimore’s climate action plan to build climate resilience and cut GHGs—and related commuting and pollution costs—could boost local GPI by $548 million to $720 million annually [89].
4.3.4. Political Use
Political use of the GPI was more evident than its instrumental use in directly affecting policy outcomes. Governor O’Malley recounted that one way he used the GPI was to support specific policies and initiatives, such as increasing the gas tax and investing more in mass transit and “when defending the investments we were making to reduce greenhouse gas emissions or to improve the health of the Chesapeake Bay” [47]. Another interviewee said that one main use he witnessed was “to build support for different policy priorities” by being able to say, for example, that “smart growth” land-use planning “would contribute to an increase in Maryland residents’ genuine progress and wellbeing” [72].
Non-profit sector officials and activists also used the GPI to support various policy stances, such as opposing a state speed-limit increase since it would lead to more accidents and lower GPI [82], or defending municipal stormwater fees by citing the CSE’s analysis showing that Baltimore’s fee was a “very good public investment” [51], see also [88]. GPI-impact analysis of the minimum-wage increase also provided a resource to counter the standard opposition which “rests on the costs to business and governments … while overlooking benefits” [90]. (This resource became available in June 2014, a month after the minimum-wage hike became law, providing validation of that decision and potential ammunition for future battles, while raising questions about whether GPI-impact analysis could occur quickly enough to keep pace with decision-making [68]). Meanwhile, a non-profit sector leader found the graph (Figure 1, above) showing a growing GDP-GPI gap “particularly useful” to raise the question: “How can we invest in our communities more strategically so that our quality of life improves when our economy improves?” She added that the GPI has been “helpful” in a more general way to policy analysts and advocates who need good data sources: “to have the government maintaining 26 indicators of wellbeing in the state is highly valuable” [68].
4.3.5. Conceptual Use
Although difficult to show precisely, indirect impacts may occur over time through “conceptual use” [37,39,41,42,43], as the GPI initiative introduced new ideas and thought models. One interviewee suggested that the GPI is perhaps “less of a tool to drive precise changes in policy and more of a lens for elected leaders … to tell a different story about how a state or country or city is doing overall.” He added that it “helps to raise large questions that pertain to policy”—e.g., whether growth is occurring in a way that is environmentally sustainable or equality-enhancing—“but without necessarily having in and of itself a precise role in the development of alternative policies” [91]. Another interviewee similarly downplayed the issue of whether GPI had direct uses for policymaking, stating that, like GDP, it is a “very high level aggregate of lots of micro decisions that come together.” As with GDP, one needs to step back from the indicator itself and ask what policies are needed if the goal is “genuine progress.” He added, “I see it more as a way of changing the thinking and then that thinking itself—rather than the number of the GPI—needs to drive the policy” [60].
One respondent saw GPI initiatives’ main strength in their “immense opportunity to shift conversations,” potentially leading to “more of the transformative kind of impact” discussed above [72]. Another similarly spoke of “changing the mindset” about what represents “real progress,” adding that “I think we’ve launched that conversation” [60].
Maryland’s GPI also helped spread new ideas among NGOs. “The GPI work has been most helpful in pushing the thinking of some advocates,” said one interviewee. He saw growing awareness among non-profit groups of the need to make the public-policy sphere, which privileges economic values, “more friendly to and more amenable to, the kinds of claims that their members would want to make” [61].
4.3.6. Related Initiatives
The GPI initiative contributed to related efforts in other states. Maryland’s pioneering example, including a model of GPI calculation that other states could follow [92,93] and its hosting of two national GPI summits contributed to GPI initiatives of various kinds in Vermont, Oregon, Washington and Hawaii, among other states. An informal, technical working group on GPI 2.0 has also emerged, including researchers in states with GPI initiatives [94].
The GPI also served as a springboard for other initiatives within Maryland. Among them were efforts building on previous state government work to put a value on ecosystem services [44,59]. A related application of the concepts behind the GPI, with potential for instrumental use in decision-making, was Net Present Value Plus (NPV+) analysis, which goes beyond conventional, “incomplete cost-benefit analyses” to “count the uncounted” social and environmental considerations [95] (pp. 4, 8) also [45,59,96]. “It’s not always immediately obvious how to take the information in the GPI and apply it to decision making,” said one interviewee. “This was a way to do that” [59].
Working with the Global Footprint Network, the state conducted pilot studies in 2014 of spending options in various agencies: fleet vehicles, land acquisition for conservation, facilities and a weatherization program [45,59,95]. NPV+ analysis of vehicle purchases looked not only at costs for vehicles, fuel, maintenance and insurance but also the social cost of carbon emissions. In that light, electric vehicles appeared to be of comparable cost to fossil-fueled vehicles despite having twice the sticker price [95,96]. Analysis of purchases of wetlands and forest—which considered ecological services such as water treatment and habitat provision—concluded that, even with no cash return, the lands were more valuable in the long term protected than developed for “sprawl with mini-marts” [44]. Although pilot NPV+ studies were completed, the analysis was not actually used to make any policy decisions as it occurred near the end of O’Malley’s second term, leaving no time for implementation before a new governor took office [45,46,59].
Maryland’s GPI was also a key factor behind the emergence of a Quality of Life Initiative, an ongoing effort that is “carrying on the mission of the GPI” [59] and “the clearest example of some GPI legacy within the state” [61]. Launched in March 2015, the initiative is led by Maryland Non-profits in partnership with business, government and academics [53,97]. Like the GPI, the initiative takes a “triple bottom line” approach in which economic, environmental and community well-being are interdependent—and growing inequality a key concern [23,68]. Its activities include development of a Quality of Life indicator dashboard, with the GPI and other indicators [68] and advocacy of policies that enhance a wider conception of quality of life [59].
4.3.7. Exceeding Some Expectations, On the Verge of Something Bigger?
While hopes of transformative impacts have yet to be fulfilled, the GPI met or exceeded some expectations simply by living on beyond the initial calculation effort [60]. “Although I thought it was a neat idea, I thought it was going to go nowhere,” said an interviewee. “I never thought we’d be having all these meetings with the governor and people from all over the country to discuss it” [46]. Another respondent said, “We made a reasonable amount of progress and we were on the verge of really starting to embed this in state government” [45].
4.4. Obstacles and Challenges
4.4.1. Change of Political Leadership/Running Out of Time
A major challenge—involving a sharp change in the political context—was the election of a Republican governor who was not as supportive of the GPI. An interviewee explained, “You don’t have a visible champion anymore and it loses its public visibility” [91]. Some less visible work behind the scenes also came to a halt. “We were starting to demonstrate how the Maryland GPI could be used in policy” but the administration change “put the kibosh on that,” said one interviewee [51], similar point in [44].
Use of NPV+ in policy analysis showed promise, but, as noted above, “We never got to implementation” [46]. Plans to take it to the “next stage” included training staff in the budget department and other agencies in its use, which would have allowed use of NPV+ in budget decisions [45]. One challenge was the common problem of bureaucratic resistance to working on new initiatives in an administration’s final year, leading an interviewee to conclude that “we would have made more progress in embedding this had this whole idea evolved earlier in [O’Malley’s] eight years as governor” [45]. Once O’Malley left office, the momentum regarding the NPV+ and GPI more generally was lost. In sum, “The clock ran out on us” [45].
4.4.2. Practical Challenges
Regardless of who was in the governor’s chair, several other obstacles to the GPI’s wider use existed, including some common challenges for any change effort. “Anything new will be questioned,” said one interviewee, who added that GDP is “so ingrained in everyone’s thinking as the measure of economic performance” [60]. Training in new ways was another issue. “Whole generations of economists” have been trained in the calculation and use of GDP, said one interviewee, “so there’s a whole establishment that has a stake in seeing this being perpetuated” [60]. Perhaps more immediately relevant was the need for training in new methods among potential GPI users within the state bureaucracy, which was one factor behind the bureaucratic inertia that hindered certain GPI applications [45,46].
Maryland’s GPI faced fewer data availability issues than some beyond-GDP alternatives [30,32,35] and benefitted from the data “getting better all the time,” such as improved estimates of ecosystem services’ economic value [51]. Nevertheless, some data challenges remained, such as indicators that are not updated in time, which necessitates use of estimated values until actual figures become available [59]. In addition, GPI data releases did not yet keep pace with updates to GDP figures. The 2013 GPI data, for example, were not released until January 2015 [98]. That said, the recently adopted GPI 2.0 methodology relies on data produced annually at all levels (national, state, local), which in principle provides a “much better framework” for annual and even quarterly, updates [51]. Meanwhile, as discussed in more detail below, the cost and time requirements of producing the data needed to apply the GPI to policy decisions were an obstacle.
4.4.3. Conservative Resistance Lying in Wait
When asked if they encountered opposition from political conservatives to the GPI, some interviewees, including Governor O’Malley, reported experiencing no concerted resistance. In one respondent’s experience, the only opposition to speak of was “friendly resistance” from people who, although supportive in principle, questioned how the GPI could be useful [61]. However, another interviewee reported encountering some “negative feedback from the right” [44].
Limited conservative resistance could conceivably reflect widespread acceptance of the GPI’s merits—which had some potential appeal to conservatives by, for example, including the costs of crime [31] (p. 10)—but a more likely explanation exists. An interviewee argued that Maryland’s GPI “never had sufficient visibility or seemed to have sufficient potential to matter to really draw out any significant opposition” [61]. However, if the GPI were to gain greater policymaking prominence, some interviewees expected greater political opposition [51,61].
In fact, right-wing media and websites did include criticism of Maryland’s GPI, even if it was not prominent enough to come to some interviewees’ attention. One critic compared the GPI to the “propaganda” that supported Lenin’s New Economic Policy and Mao’s Great Leap Forward and claimed that “it aims to substitute central planning by politicians and bureaucrats for economic freedom” [99]. Talk-radio host and Breitbart contributor Aaron Klein alleged that the GPI was promoted by “far left” groups and individuals with ties to Obama, terrorism and communism [100]. Meanwhile, former Republican Governor Robert Ehrlich called the GPI “liberal snake oil for what ails anti-business states” and “nothing other than a convenient instrument for progressives to use in obfuscating poor economic performance” [101].
More serious objections from conservatives included criticism of “subjective” choices behind indicator selection and difficulties in adequately measuring, say, the value of housework [99,101], prompting calls for continued reliance on supposedly “objective, value-neutral methodologies” such as GDP [101]. The Capital newspaper of Annapolis similarly rejected the idea that “certain arbitrarily chosen indicators can be state-certified as ‘genuine progress’,” an issue it argued was “best left to the collective judgement of 5.8 million Marylanders” [102]. (Although the indicators chosen were not arbitrary, a question arises of who decides which indicators matter. Unlike some other jurisdictions with beyond-GDP initiatives such as Britain [34], Maryland did not conduct a democratic consultation that would enhance new prosperity measures’ legitimacy).
One can dismiss the more extreme criticisms as little more than the polarized rhetoric typical of contemporary US political discourse. Meanwhile, the GDP’s own subjective choices were illustrated in 2014, when some countries included estimated values for prostitution and illegal drug sales, significantly increasing their GDP overnight [103]. Nevertheless, it is the case that different choices about what to include in the GPI can lead to quite different estimates of “genuine progress” [104] (pp. 1975–1976). In addition, these criticisms from conservative sources suggest that the choices behind the GPI will face considerable scrutiny and will require a robust defence, if in the future it appears to be gaining a greater role in policymaking.
4.4.4. Does the GPI Support the Narrative of Its Proponents?
Despite conservative criticism, one can ask if the GPI is actually “left wing” and “green” enough. Maryland’s GPI experience raises questions about whether the indicator adequately supports a transformative, post-growth/post-consumerist narrative that many of its proponents hope to promote—an issue also evident in other jurisdictions with beyond-GDP initiatives [32].
Although GPI is a more comprehensive measure than GDP, some GPI supporters acknowledge that the economy still “overpowers” social and environmental considerations within it [44]. Interviewees explained that GPI is dominated by personal consumption expenditures [59,72], see also [104] (p. 1976), which in turn are driven by a growth-based economy. As a result, “the GPI is not a perfect lens to look at limits to growth” [59] and it is “unrealistic that the GPI will change the goal away from growth completely” [72].
Recent Maryland GPI data illustrate the dominance of personal consumption expenditures. In some years, Maryland’s GPI showed improvements in social and environmental conditions (see, e.g., 2013 data in [98]); however, from 2014 to 2015, the state saw increases in income inequality, environmental costs—e.g., GHGs rose 3 percent—and costs of crime due to a jump in the murder rate. Nevertheless, the GPI rose nearly 4 percent, due mainly to increased household consumption expenditures (up $6.7 billion), as well as a higher value of unpaid labour (up $5 billion) [21].
A related problem, according to an interviewee, has been the “conservative estimates” of environmental costs, with the result that the GPI “is not yet an indicator of environmentally sustainable wellbeing.” These cost estimates have to be more precise, he argued, if the GPI is to be a “lever to change the economy” and unambiguously produce radical conclusions about “uneconomic growth” [79]. Another limitation from a green perspective is that, in allowing growth in the economic sphere to compensate for environmental decline, the indicator reflects a concept of “weak sustainability” [105]. The GPI will also appear artificially high in jurisdictions that benefit from the costs of economic growth being concentrated in external locations [104] (p. 1976). This appears to be one reason—in addition to GPI-enhancing policy choices—why Maryland, with high and rising personal consumption that boosts GPI but less extractive or polluting industry than many others, has shown no sign of surpassing the threshold into an era of “uneconomic growth,” unlike many other states and the US as a whole [93] (p. 5).
4.4.5. Other GPI Criticisms
Some interviewees mentioned additional indicator factors, i.e., limitations of GPI, that hindered more extensive use and impact. A key challenge was uncertainty about how the GPI, a macro-level aggregate figure, could be used in specific policy decisions [61,72,91,106,107]. An interviewee emphasized that the GPI “wasn’t designed to be an effective policy tool”; it was not developed in conjunction with policymakers or with them in mind [106]. Significant efforts did emerge to adopt it for policymaking, such as state exploration of NPV+ analysis and NGO work on the GPI note; however, an interviewee argued that the question of how to use it effectively was never adequately answered [61]. The GPI’s monetary valuation of environmental and social factors—a factor behind its selection by the state working group—encountered objections by others; one respondent expressed reservations about how the GPI’s reliance on monetization reinforces rather than challenges the strength of economic values [61]. Leaders of Maryland’s Quality of Life initiative concluded that GPI was insufficient on its own and a wider dashboard was needed; an interviewee explained that they wanted indicators that were less of an “economist’s tool” that non-profits could better “relate to” and which were “more practical for public information purposes” [68], see also [97].
The GPI is still evolving. Talberth and Weisdorf recently put forward an alternative GPI 2.0 methodology that partly addresses the problem, discussed above, of the dominance of consumption expenditures by reducing their overall weight, although they remain the largest single component, accounting for 48 percent of Maryland’s GPI [20]. Some GPI defenders argue that its theoretical and empirical basis was strengthened with revisions leading to GPI 2.0 [20,51,59]. On the other hand, an interviewee found it harder to understand what lies behind the 2.0 numbers and expressed concern over the inability with GPI 2.0 (which relies on new data sources) to show long-term trends prior to 2012, which had been one of the GPI’s most useful features for advocates [68]. Many GPI supporters acknowledge the need to further refine the indicator, while arguing that, even if imperfect, it is still a major improvement on GDP e.g., [8,93,104].
4.4.6. Uncertain Political Constituency
As with some other beyond-GDP initiatives [32,35], the political base of support for Maryland’s GPI was not fully developed. As Governor O’Malley explained, “There was no grassroots movement for this” [47]. The GPI came from an initiative within the DNR and it found a supportive governor interested in applying data to policymaking and sympathetic to calls for more holistic prosperity measures. As discussed above, the GPI was likely to face more significant resistance if its use and profile grew. In addition to ideologically driven resistance from some conservatives, one could expect pushback from individuals and corporations who profit from externalizing environmental and social costs onto the public—costs made more visible with GPI [108]. On the other hand, stakeholders with an interest in the GPI are more diffuse [60]. An interviewee explained that advocacy groups in different sectors wanted to know the impacts of policies and proposals on their sector or community—e.g., environment, health, communities of colour, etc.—but they “are not all united behind the GPI, or even know that it exists” [68]. In fact, the Town Creek Foundation’s support for GPI-related work included efforts to get various groups to see their interest in alternative prosperity measures that are more favourable to non-economic values and to build a constituency capable of defending the GPI if it did come under political attack [61].
The Foundation’s executive director pointed out a paradox: “the fact of the state adopting the GPI early on probably resulted in all of us spending too much time focusing on the state,” as it led advocacy groups to emphasize getting the state to do more with it, which, with hindsight, “really wasn’t the right strategy.” In ideal circumstances, he believes it would have been preferable to start with a GPI housed outside the state and, over time, build support for it, before pushing the state to incorporate it (preferably at the legislative rather than executive level). “The things that you would have to do to persuade the state to adopt it would actually be really useful things,” he said, such as building a constituency for it, improving the capacity to communicate about it and figuring out the best way for the state to employ it. “But we didn’t do enough of any of those things because you already had the state saying, ‘we’ll calculate this on a regular basis’ [61].”
4.4.7. Obstacles to the GPI Note
A number of the above-mentioned obstacles and others, were evident with an idea that had inspired considerable hope among supporters: “GPI notes” assessing GPI impacts of policy proposals. One obstacle was financial: the DLS concluded that it would be excessively costly to produce GPI notes on a regular basis [61]. A related concern was the timeliness of GPI-impact analysis, which, as noted above, faces challenges in keeping pace with the speed of decision-making. As a result, an interviewee believed the GPI note was an “unworkable solution” for many matters that “pop up” quickly in the Legislature, although it could still be practical for issues that are the subject of ongoing, long-term debate such as mandatory sick leave or minimum-wage increases [68]. Another respondent was not entirely convinced by the DLS’s conclusion that GPI notes were too costly but that conclusion “basically killed the idea,” in part due to another limitation: “there still wasn’t anything like the constituency for it that would be necessary to overcome opposition on that fiscal basis” [61]. An interviewee suspected that resistance from the DLS was also linked to the fact that they already have “a lot of work” producing fiscal notes on every bill “so they don’t necessarily welcome additional work” [45]. Another respondent said, “the biggest sticking point” for the GPI note was “not having staff up to speed on how to do it” but training to address this gap “never came to realization” [46]. He added that the next major obstacle was on a “more theoretical level.” The GPI was designed to be “very inclusive and broad” but with a specific piece of legislation, calculating GPI impacts can require “making all kinds of assumptions and … at some point, you cross the line where it sort of falls apart” [46].
5. Conclusions
Maryland’s GPI initiative reveals intriguing possibilities for more environmentally and socially minded policymaking, even if they are still some way from being fully realized. The GPI provides a lens through which to assess policy options and the state of society that makes social and environmental factors more visible, producing a more comprehensive picture of wellbeing and an improvement on using GDP as a proxy for wellbeing. The GPI can help to show net societal benefits of policies such as investing in public transit, increasing the minimum wage and reducing GHGs—giving policymakers and advocates additional ammunition for political battles over such issues. Indeed, there were numerous examples of such “political use” of Maryland’s GPI. Thinking in GPI terms could also encourage policymakers to add GPI-enhancing features to policies to improve ecological and social outcomes. NPV+, an offshoot of the GPI initiative, also revealed potential as a tool to make the case for more environmentally and socially sound state spending.
Although Maryland’s GPI-related work went further than some participants expected and helped spur GPI initiatives in other states, it has yet to produce significant direct impacts on policy (“instrumental use”)—let alone fulfill the more transformative hopes of those seeking to move beyond the growth paradigm. Beyond running out of time before a change of administration, other obstacles included the commonplace challenge of resistance to new ideas, including some bureaucratic resistance; the need for training to use the GPI and related policy tools; and concerns over cost and time involved in producing the data needed to apply the GPI to policy decisions. Although both the initiative itself and political opposition to it had a low profile, ideologically driven opposition could be found on the margins of public debate.
The Maryland case also raises questions about the GPI’s purposes and limitations as an indicator. As currently constructed, with personal consumption expenditures statistically dominant, the GPI is an imperfect measure to support a post-growth, post-consumerist narrative favoured by many supporters of beyond-GDP measurement. In addition, there has been debate about the desirability of a wellbeing measure based on monetary valuation of environmental and social factors and questions about how to make the GPI useful for policy decisions. Over time, enthusiasm for the GPI waned among some non-profit sector actors, who embraced a wider dashboard of quality-of-life indicators. Although Maryland selected the GPI over other options relatively quickly in the initiative’s early stages, there remain grounds for debate over whether the GPI deserves to be the main beyond-GDP alternative, how to further refine it and what other indicators are needed to supplement it—reflecting the broader challenge, evident in other jurisdictions, of the lack of full agreement on the best alternative indicators [32,35].
Other beyond-GDP initiatives have revealed a problem that one could call the “indicators fantasy” or naïve rational-positivist view—the idea that simply producing new indicators alone will result in policy impacts and, more optimistically, transformative change [32]. This problem was not particularly evident in Maryland, where steps were taken not only to produce a new indicator but also to explore ways to use it in policymaking, including examination of related policy tools, such as NPV+ and the GPI note. The fact that the state itself has taken on responsibility for calculating the GPI also puts Maryland a step ahead—at least in the short term—of other jurisdictions with beyond-GDP initiatives led by academics or NGOs e.g., [31] but some important political tasks are unfinished. These include providing a more complete answer to how the GPI can best be used in policymaking and more deeply embedding new prosperity indicators into the policymaking process to enhance their impact and reduce vulnerability to changes in political leadership. Future efforts to expand use of the GPI, or other beyond-GDP measurements, in ways that influence policy choices will likely, as some interviewees argued, bring out greater opposition. This possibility suggests a need to deepen support within the “natural” constituency of environmental and social advocacy groups, and/or broaden support across the political spectrum.
Maryland’s experience also raises questions about strategy and sequencing for advancing beyond-GDP measurement. Instead of focusing on a high-profile break with the GDP, some believe it is essential first to create space in which state bureaucrats and other practitioners can explore possible GPI policy applications behind the scenes. Others question whether early state adoption was advantageous in the long run, arguing there would be more significant and lasting impacts by first developing a beyond-GDP initiative outside the state government—and building a constituency and the capacity to defend it—before seeking incorporation by the state. As more such initiatives emerge around the world, it may become possible to analyze such questions through comparative research. There are possible parallels to cross-national work showing that early state incorporation of environmental movement demands was not advantageous for that movement’s long-run strength, although the conclusion might be different in the case of beyond-GDP measurement [109].
One lesson from Maryland and other beyond-GDP initiatives is that achieving significant impact is a longer-term process than some GPI supporters originally expected [51]. Indeed, the “biggest lesson,” according to a senior state official, is that “you can’t expect to do this quickly in a way that’s meaningful for systemic change and to really embed it in an entity like a state government. It will go through iterations of changes over time” [45]. In line with Governor O’Malley’s statement about “planting seeds”, more time will also be needed for the full impacts of actions to date to be felt, particularly those impacts related to “conceptual use”, i.e., changing mental models and encouraging new ways of thinking. Some interviewees were optimistic about the GPI’s introduction of new ideas and sparking of new conversations; indeed, some researchers argue that such conceptual use may be new indicators’ main source of influence over the long term, even if it is often subtle and inherently difficult to show conclusively [36,37,43]. Meanwhile, there may yet be impacts to come from the ongoing Quality of Life Initiative that has had connections with the GPI or from the increased awareness among NGOs of the need for efforts to make the policy sphere friendlier to non-economic values—not to mention from the state’s continued calculation of the GPI and, perhaps, a future revival of efforts to apply it to policymaking in innovative ways.
Acknowledgments
This research and open-access publication were made possible by a sabbatical-leave grant from Dalhousie University and an Insight Development Grant from Canada’s Social Sciences and Humanities Research Council (SSHRC).
Author Contributions
Hayden and Wilson collaboratively developed the idea for the article and interview questions. Hayden set up and conducted interviews with respondents involved in the Maryland GPI, while Wilson carried out interviews regarding other GPI-related initiatives. Hayden analyzed the interview data and wrote the article’s first draft, which he revised after a review by Wilson.
Conflicts of Interest
The authors declare no conflict of interest.
Appendix A. Calculating the GPI
Calculation of GPI 1.0 [19,53] begins with personal consumption expenditures, which are adjusted for income inequality (i.e., divided by an index of inequality based on the Gini coefficient, with a benchmark score of 1 in 1970, the year of lowest inequality in recent history). Monetary values are then added (or subtracted) for a range of economic, environmental and social indicators (Table A1).

Table A1.
Maryland GPI 1.0.
| Economic Indicators |
| Personal consumption expenditures adjusted for inequality + Services of consumer durables − Cost of consumer durables − Cost of underemployment + Net capital investment |
| Environmental Indicators |
| − Cost of water pollution − Cost of air pollution − Cost of noise pollution − Cost of net wetland change − Cost of net farmland change, − Cost of net forest cover change − Cost of climate change − Cost of ozone depletion − Cost of non-renewable energy resource depletion |
| Social Indicators |
| + Value of housework − Cost of family changes − Cost of crime − Cost of personal pollution abatement + Value of volunteer work − Cost of lost leisure time, + Value of higher education + Services of highways and streets − Cost of commuting − Cost of motor vehicle crashes |
GPI 2.0 is based on 12 main indicators (which include a number of sub-indicators) grouped into three categories [21,110] (Table A2).
Table A2.
Maryland GPI 2.0.
| Market-Based Wellbeing |
| Household budget expenditures − Household investments − Defensive expenditures (e.g., costs of medical care, insurance and household pollution abatement and security devices) − Costs of income inequality + Public provision of goods and services |
| Non-Market-Based Wellbeing |
| + Services from human capital (services from higher education, library services and value of public art, music and theatre) + Services from social capital (value of leisure time, household labour and internet services) + Services from built capital (services from transportation and water infrastructure and from household goods) + Services from natural capital (ecosystem services from forests, wetlands and Chesapeake Bay). |
| Environmental and Social Costs |
| − Costs of natural capital depletion (non-renewable energy and groundwater depletion, change in the value of productive lands); − Costs of pollution (air, water and noise pollution, GHG emissions, costs of solid waste) − Social costs of economic activity (homelessness, underemployment, crime, commuting, vehicle accidents) |
Full analysis of the distinction between GPI 1.0 and 2.0 is beyond the scope of this article but differences include removal of some variables deemed to be no longer relevant (e.g., costs of ozone depletion), addition of some new indicators (e.g., costs of homelessness), a shift toward measuring the benefit of ecosystem services rather than simply deducting the costs of ecological depletion and a new method of incorporating the costs of inequality [21,53,59]. Debate over further refinements to GPI calculations continues [20,92].
Appendix B. Interviewees
Interviewees involved in Maryland GPI Initiative:
| Elliott Campbell, Director, Center for Economic and Social Science, Maryland Department of Natural Resources, 23 February 2017 |
| Stuart Clarke, Executive Director, Town Creek Foundation, 12 April 2017 |
| Lew Daly, Director of Policy and Research, Demos, 28 February 2017 |
| John Griffin, former Secretary, Maryland Department of Natural Resources and chief of staff to Governor O’Malley, 1 May 2017 |
| Heather Iliff, President & CEO, Maryland NonProfits, 24 March 2017 |
| Martin O’Malley, former Governor of Maryland, 30 March 2017 |
| Sean McGuire, former Sustainability Policy Director, Maryland Department of Natural Resources, 20 February 2017 |
| Stephen Posner, Affiliate Fellow, Gund Institute for the Environment, University of Vermont 22 November 2016 and 3 May 2017 |
| Matthias Ruth, Northeastern University, former Director, Center for Integrative Environmental Research, University of Maryland, 21 April 2017 |
| John Talberth, President and Senior Economist, Center for Sustainable Economy, 22 February 2017 |
| Anonymous, 1 May 2017 |
Other interviewees:
| Mairi-Jane Venesky Fox, Regis University, 19 April 2017 |
| Jaime Rossman, Policy Advisor, Washington State Department of Commerce, 17 April 2017 |
| Eric Zencey, Fellow at Gund Institute for Ecological Economics and Coordinator of the Vermont GPI Project, 6 December 2016 |
References and Notes
- O’Malley, M. Genuine Progress. Letters to the People of Maryland. 19 January 2015. [Google Scholar]
- Gross National Income (GNI)—Equal to GDP plus net receipts from abroad of primary income (employee compensation and property income), as well as net taxes and subsidies received from abroad—Is another similar measure that has been used increasingly in recent years.
- Van den Bergh, J.C. The GDP paradox. J. Econ. Psychol. 2009, 30, 117–135. [Google Scholar] [CrossRef]
- Kubiszewski, I.; Costanza, R.; Franco, C.; Lawn, P.; Talberth, J.; Jackson, T.; Aylmer, C. Beyond GDP: Measuring and achieving global genuine progress. Ecol. Econ. 2013, 93, 57–68. [Google Scholar] [CrossRef]
- Costanza, R.; Kubiszewski, I.; Giovannini, E.; Lovins, H.; McGlade, J.; Pickett, K.; Vala Ragnarsdóttir, K.; Roberts, D.; De Vogli, R.; Wilkinson, R. Time to leave GDP behind. Nature 2014, 505, 283–285. [Google Scholar] [CrossRef] [PubMed] [Green Version]
- Daly, H.E. Growth That Costs More Than It’s Worth. The Washington Post, 30 May 2008; A12. [Google Scholar]
- Costanza, R. How the World’s Economic Growth Is Actually Un-Economic. The Conversation. 8 December 2014. Available online: http://theconversation.com/how-the-worlds-economic-growth-is-actually-un-economic-34362 (accessed on 20 May 2017).
- Lawn, P. The Genuine Progress Indicator: An indicator to guide the transition to a steady state economy. In A Future Beyond Growth: Towards a Steady State Economy; Washington, H., Twomey, P., Eds.; Routledge: London, UK, 2016. [Google Scholar]
- Donovan, N.; Halpern, D. Life Satisfaction: The State of Knowledge and Implications for Government; Cabinet Office Strategy Unit: London, UK, 2002. [Google Scholar]
- Easterlin, R.A.; McVey, L.A.; Switek, M.; Sawangfa, O.; Zweig, J.S. The happiness–income paradox revisited. Proc. Natl. Acad. Sci. USA 2010, 107, 22463–22468. [Google Scholar] [CrossRef] [PubMed]
- Layard, R. Happiness: Lessons from a New Science; The Penguin Press: New York, NY, USA, 2005. [Google Scholar]
- Max-Neef, M. Economic growth and quality of life: A threshold hypothesis. Ecol. Econ. 1995, 15, 115–118. [Google Scholar] [CrossRef]
- Fioramonti, L. The World after GDP; Polity: Malden, MA, USA, 2017. [Google Scholar]
- OECD. Istanbul Declaration. Paris: Organisation for Economic Cooperation and Development. 2017. Available online: https://www.oecd.org/newsroom/38883774.pdf (accessed on 7 May 2016).
- Stiglitz, J.E.; Sen, A.; Fitoussi, J.-P. Mismeasuring Our Lives: Why GDP Doesn’t Add Up; The New Press: New York, NY, USA, 2010. [Google Scholar]
- Bleys, B. Beyond GDP: Classifying Alternative Measures for Progress. Soc. Indic. Res. 2012, 109, 355–376. [Google Scholar] [CrossRef]
- Layard, R. Why Measure Subjective Well-Being? OECD Observer. 2012. Available online: http://oecdobserver.org/news/fullstory.php/aid/3767/Why_measure_subjective_well-being_.html (accessed on 3 February 2016).
- Talberth, J.; Cobb, C.; Slattery, N. The Genuine Progress Indicator 2006: A Tool for Sustainable Development; Redefining Progress: Oakland, CA, USA, 2006. [Google Scholar]
- McGuire, S.; Posner, S.; Haake, H. Measuring Prosperity: Maryland’s Genuine Progress Indicator. Solutions 2012, 3, 50–58. [Google Scholar]
- Talberth, J.; Weisdorf, M. Genuine Progress Indicator 2.0: Pilot Accounts for the US, Maryland, and City of Baltimore 2012–2014. Ecol. Econ. 2017, 142, 1–11. [Google Scholar] [CrossRef]
- Department of Natural Resources (DNR). Maryland Genuine Progress Indicator 2.0 Overview; Department of Natural Resources: Annapolis, MD, USA, 2017. Available online: http://dnr.maryland.gov/mdgpi/Pages/gpi2.aspx (accessed on 13 April 2017).
- Gantz, S. Income grows, but not evenly. The Baltimore Sun, 16 September 2016; 1. [Google Scholar]
- Iliff, H. State of Our State: Maryland’s Quality of Life. Address. 11 January 2016. Available online: http://marylandnonprofits.org/Portals/0/Files/Pages/Events/Legislative%20Preview/State%20of%20Our%20State%20Address.pdf (accessed on 20 March 2017).
- Top Earning Towns. Time. 19 September 2014. Available online: http://time.com/money/collection-post/3318911/top-earning-towns-best-places/ (accessed on 20 May 2017).
- Schrank, D.; Eisele, B.; Lomax, T.; Bak, J. Urban Mobility Scorecard; Texas A&M Transportation Institute: College Station, TX, USA, 2015. [Google Scholar]
- Demos. Governor O’Malley Hosts First Ever GPI Summit. New York: Demos. 2012. Available online: http://www.demos.org/news/governor-o%E2%80%99malley-hosts-first-ever-gpi-summit (accessed on 30 April 2017).
- Gast, S. Maryland Launches Genuine Progress Indicator. Yes! Magazine. 2 April 2010. Available online: http://www.yesmagazine.org/new-economy/maryland-launches-genuine-progress-indicator (accessed on 7 February 2018).
- Governor’s Office. Governor Martin O’Malley Launches Genuine Progress Indicator. News Release; 3 February; Office of the Governor: Annapolis, MD, USA, 2010. [Google Scholar]
- The headline error appears to belong to an overenthusiastic editor rather than the authors, whose original version had a more accurate title (see second item) McElwee, S.; Daly, L. States Are Ditching GDP. Huffington Post. 13 February 2014. Available online: http://www.huffingtonpost.com/sean-mcelwee/states-are-ditching-gdp_b_4734917.html (accessed on 30 April 2017).Daly, L.; McElwee, S. Forget the GDP. Some States Have Found a Better Way to Measure Our Progress. The New Republic. 3 February 2014. Available online: https://newrepublic.com/article/116461/gpi-better-gdp-measuring-united-states-progress (accessed on 7 February 2018).
- Bleys, B.; Whitby, A. Barriers and opportunities for alternative measures of economic welfare. Ecol. Econ. 2015, 117, 162–172. [Google Scholar] [CrossRef]
- Hayden, A.; Wilson, J. Is it what you measure that really matters? The struggle to move beyond GDP in Canada. Sustainability 2016, 8, 623. [Google Scholar]
- Hayden, A.; Wilson, J. “Beyond GDP” Indicators: Changing the Economic Narrative for a Post-Consumerist Society? In Social Change and the Coming of Post-Consumer Society: Theoretical Advances and Policy Implications; Cohen, M.J., Brown, H.S., Vergragt, P.J., Eds.; Routledge: New York, NY, USA, 2017. [Google Scholar]
- Porritt, J. Capitalism as If the World Matters; Earthscan: London, UK, 2007. [Google Scholar]
- Bache, I.; Reardon, L. The Politics and Policy of Wellbeing: Understanding the Rise and Significance of a New Agenda; Edward Elgar: Cheltenham, UK, 2016. [Google Scholar]
- Whitby, A.; Seaford, C.; Berry, C. BRAINPOoL Project Final Report: Beyond GDP—From Measurement to Politics and Policy; World Future Council: Hamburg, Germany, 2014. [Google Scholar]
- Bell, S.; Morse, S. An analysis of the factors influencing the use of indicators in the European Union. Local Environ. 2011, 16, 281–302. [Google Scholar] [CrossRef]
- Rinne, J.; Lyytimäki, J.; Kautto, P. From sustainability to well-being: Lessons learned from the use of sustainable development indicators at national and EU level. Ecol. Indic. 2013, 35, 35–42. [Google Scholar] [CrossRef]
- Rydin, Y.; Holman, N.; Wolff, E. Local Sustainability Indicators. Local Environ. 2003, 8, 581–589. [Google Scholar] [CrossRef]
- Sébastien, L.; Bauler, T.; Lehtonen, M. Can Indicators Bridge the Gap between Science and Policy? An Exploration into the (Non)Use and (Non)Influence of Indicators in EU and UK Policy Making. Nat. Cult. N. Y. 2014, 9, 316–343. [Google Scholar]
- Scott, K. Measuring Wellbeing: Towards Sustainability? Routledge: London, UK, 2012. [Google Scholar]
- Lehtonen, M.; Sébastien, L.; Bauler, T. The multiple roles of sustainability indicators in informational governance: between intended use and unanticipated influence. Curr. Opin. Environ. Sustain. 2016, 18, 1–9. [Google Scholar] [CrossRef]
- Hezri, A.A. Sustainability indicator system and policy processes in Malaysia: A framework for utilisation and learning. J. Environ. Manag. 2004, 73, 357–371. [Google Scholar] [CrossRef] [PubMed]
- Hezri, A.A.; Dovers, S.R. Sustainability indicators, policy and governance: Issues for ecological economics. Ecol. Econ. 2006, 60, 86–99. [Google Scholar] [CrossRef]
- McGuire, S. Former Sustainability Policy Director, Maryland Department of Natural Resources. Telephone Interview. 2017.
- Senior state official. Telephone Interview. 2017.
- Anonymous. Telephone Interview. 2017.
- O’Malley, M. Former Governor of Maryland. Telephone Interview. 2017.
- Abdallah, S.; Thompson, S.; Michaelson, J.; Marks, N.; Steuer, N. The Happy Planet Index 2.0; New Economics Foundation: London, UK, 2009. [Google Scholar]
- UMD MD Adopts Greener. More Accurate Measure of Prosperity. News Release. 3 February; University of Maryland: College Park, MD, USA, 2010. [Google Scholar]
- Daly, H.E.; Cobb, J.B. For The Common Good; Beacon Press: Boston, MA, USA, 1989. [Google Scholar]
- Talberth, J. President and Senior Economist, Center for Sustainable Economy. Telephone Interview. 2017. [Google Scholar]
- Costanza, R.; Erickson, J.; Fligger, K.; Adams, A.; Adams, C.; Altschuler, B.; Balter, S.; Fisher, B.; Hike, J.; Kerr, T. Estimates of the Genuine Progress Indicator (GPI) for Vermont, Chittenden County and Burlington, from 1950 to 2000. Ecol. Econ. 2004, 51, 139–155. [Google Scholar] [CrossRef]
- Department of Natural Resources (DNR). Maryland Genuine Progress Indicator; Department of Natural Resources: Annapolis, MD, USA, 2017. Available online: http://dnr.maryland.gov/mdgpi/Pages/default.aspx (accessed on 27 January 2018).
- Department of Natural Resources (DNR). Governor O’Malley Hosts GPI Summit; Department of Natural Resources: Annapolis, MD, USA, 2013. Available online: http://news.maryland.gov/dnr/2013/06/17/governor-omalley-hosts-gpi-summit/ (accessed on 12 May 2017).
- Smith Hopkins, J. Putting a dollar figure on progress. The Baltimore Sun. 11 September 2010. Available online: http://articles.baltimoresun.com/2010-09-11/business/bs-bz-progress-indicator-20100911_1_gdp-genuine-progress-indicator-national-income (accessed on 7 February 2018).
- Department of Natural Resources (DNR). GPI 1.0 Summary 1960–2013; Department of Natural Resources: Annapolis, MD, USA, 2015. Available online: http://dnr.maryland.gov/mdgpi/Documents/GPI1.0summary1960-2013.xlsx (accessed on 27 January 2018).
- Department of Natural Resources (DNR). Maryland Continues to Lead Nation in Genuine Progress Tracking. News Release; 19 September; Department of Natural Resources: Annapolis, MD, USA, 2011. [Google Scholar]
- PBS. Is GDP the Wrong Yardstick for Measuring Prosperity? PBS NewsHour. 28 April 2014. Available online: http://www.pbs.org/newshour/bb/finding-gdp-alternatives-quantify-unpriceable-prosperity/ (accessed on 16 May 2017).
- Campbell, E. Director, Center for Economic and Social Science, Maryland Department of Natural Resources. Interview. Annapolis, MD, USA, 2017. [Google Scholar]
- Ruth, M. Northeastern University, former Director, Center for Integrative Environmental Research, University of Maryland. Telephone Interview. 2017. [Google Scholar]
- Clarke, S. Executive Director, Town Creek Foundation. Telephone Interview. 2017. [Google Scholar]
- Department of Natural Resources (DNR). Maryland Continues to Measure Genuine Progress. News Release; 22 February; Department of Natural Resources: Annapolis, MD, USA, 2011. [Google Scholar]
- Department of Natural Resources (DNR). Maryland Continues to Lead the Nation in Genuine Progress Tracking. News Release; 12 November; Department of Natural Resources: Annapolis, MD, USA, 2013. [Google Scholar]
- Department of Natural Resources (DNR). Maryland GPI Grows More Than 2 Percent Last Year. News Release, 1 October; Department of Natural Resources: Annapolis, MD, USA, 2012. [Google Scholar]
- O’Malley, M. Speech to Genuine Progress Indicators Conference. 14 June; Baltimore, MD, USA, 2013. [Google Scholar]
- Talberth, J. Measuring What Matters: GDP, Ecosystems and the Environment; World Resources Institute: Washington, DC, USA, 2010; Available online: http://www.wri.org/blog/2010/04/measuring-what-matters-gdp-ecosystems-and-environment (accessed on 30 April 2017).
- Dolan, K. A better way of measuring progress in Maryland. The Baltimore Sun. 30 January 2012. Available online: http://www.baltimoresun.com/news/opinion/oped/bs-ed-measuring-progress-20120130-story.html (accessed on 16 May 2017).
- Iliff, H. President & CEO, Maryland NonProfits. Telephone Interview. 2017. [Google Scholar]
- Campbell, C. Meet the Big Data Candidate of the 2016 Presidential Race. Business Insider. 11 November 2014. Available online: http://www.businessinsider.com/martin-omalley-2016s-big-data-candidate-2014-11 (accessed on 12 May 2017).
- Perez, T.; Rushing, R. The CitiStat Model: How Data-Driven Government Can Increase Efficiency & Effectiveness; Center for American Progress: Washington, DC, USA, 2007. [Google Scholar]
- Ceroni, M. Beyond GDP: US states have adopted genuine progress indicators. The Guardian. 23 September 2014. Available online: http://www.theguardian.com/sustainable-business/2014/sep/23/genuine-progress-indicator-gdp-gpi-vermont-maryland (accessed on 16 January 2016).
- Posner, S. Affiliate Fellow, Gund Institute for the Environment, University of Vermont. Telephone Interviews. 2016 and 2017. [Google Scholar]
- Wysham, D. The Genuine Progress Indicator: Promoting a Sustainable and Equitable Maryland. Institute for Policy Studies. 22 May 2014. Available online: netransition.org/wp-content/uploads/2014/05/GPI-webinar-for-Boston-office-2.pptx (accessed on 10 May 2017).
- Center for Sustainable Economy (CSE). GPI Notes—Maryland; Center for Sustainable Economy: Washington, DC, USA, 2014; Available online: http://sustainable-economy.org/gpi-notes-maryland/ (accessed on 10 May 2017).
- Talberth, J. HB 295: Maryland Minimum Wage Act of 2014; Center for Sustainable Economy: Washington, DC, USA, 2014. [Google Scholar]
- Fox, M.-J.V. Designing for Economic Success: A 50-State Analysis of the Genuine Progress Indicator. Ph.D. Thesis, University of Vermont, Burlington, VT, USA, 2017. [Google Scholar]
- O’Malley, M. New Deal Inaugural Conference Speech; 18 November; Governor’s Office: Annapolis, MD, USA, 2011.
- Brancaccio, D. Maryland updates Genuine Progress Indicator. Marketplace. National Public Radio, 2011. Available online: https://www.marketplace.org/2011/09/19/business/economy-40/maryland-updates-genuine-progress-indicator (accessed on 18 May 2017).
- Anonymous. Telephone Interview. 2016.
- Clarke, S. Town Creek Foundation Stakeholder Meeting; 14 November; Town Creek Foundation: Easton, MD, USA, 2014. [Google Scholar]
- Governor O’Malley Hosts GPI Summit. Introduction and Moderator’s Remarks. 14 June 2013. Available online: https://soundcloud.com/accessdnr (accessed on 15 February 2017).
- Cantori, G. Speed kills, so why raise the limit? The Baltimore Sun. 25 February 2015. Available online: http://www.baltimoresun.com/news/opinion/readersrespond/bs-ed-speed-limit-letter-20150225-story.html (accessed on 18 May 2017).
- Daly, L.; McElwee, S. Why we should abolish the GDP. The Washington Post. 5 June 2014. Available online: https://www.washingtonpost.com/posteverything/wp/2014/06/05/why-we-should-abolish-the-gdp/ (accessed on 18 May 2017).
- Office for a Sustainable Future (OSF). MD-GPI & Value-Added Benefits Scorecard Report: Recommendations, Results, and Feasibility and Viability Analyses; Office for a Sustainable Future: Annapolis, MD, USA, 2012. [Google Scholar]
- Ruby, H. Fiscal and Policy Note (Revised) for House Bill 295; Department of Legislative Services: Annapolis, MD, USA, 2014.
- Talberth, J.; Wysham, D.; Dolan, K. Closing the Inequality Divide: A Strategy for Fostering Genuine Progress in Maryland; Center for Sustainable Economy & Institute for Policy Studies: Washington, DC, USA, 2013. [Google Scholar]
- Talberth, J.; Weisdorf, M.A. Economic Wellbeing in Baltimore: Results from the Genuine Progress Indicator, 2012–2013; Center for Sustainable Economy: Washington, DC, USA, 2014. [Google Scholar]
- Talberth, J. Economic Benefits of Baltimore’s Stormwater Management Plan; Center for Sustainable Economy: Washington, DC, USA, 2015. [Google Scholar]
- Talberth, J.; Wysham, D. Economic Benefits of Baltimore’s Climate Action Plan; Center for Sustainable Economy: Washington, DC, USA, 2014. [Google Scholar]
- Talberth, J.; Carter, C.; Wysham, D.; Iliff, H. Minimum Wage Act Reduces Inequality and Represents a $2 Billion a Year Bonus for Maryland’s Economy. News Release, 16 June; Center for Sustainable Economy: Washington, DC, USA, 2014. [Google Scholar]
- Daly, L. Director of Policy and Research, Demos. Interview. New York, 2017. [Google Scholar]
- Bagstad, K.J.; Berik, G.; Gaddis, E.J.B. Methodological developments in US state-level Genuine Progress Indicators: Toward GPI 2.0. Ecol. Indic. 2014, 45, 474–485. [Google Scholar] [CrossRef]
- Kubiszewski, I.; Costanza, R.; Gorko, N.E.; Weisdorf, M.A.; Carnes, A.W.; Collins, C.E.; Franco, C.; Gehres, L.R.; Knobloch, J.M.; Matson, G.E.; et al. Estimates of the Genuine Progress Indicator (GPI) for Oregon from 1960–2010 and recommendations for a comprehensive shareholder’s report. Ecol. Econ. 2015, 119, 1–7. [Google Scholar] [CrossRef]
- We thank an anonymous reviewer for highlighting this point.
- Global Footprint Network (GFN). Making the Economic Case for Sustainable Investments in Maryland; Global Footprint Network: Oakland, CA, USA, undated.
- Farmer, L. Calculating the Social Cost of Policymaking. In Governing; 13 February 2015. Available online: http://www.governing.com/topics/finance/gov-calculating-social-cost-policymaking.html (accessed on 7 February 2018).
- Maryland Nonprofits. Quality of Life. 2017. Available online: http://marylandnonprofits.org/advocacypolicy/qualityoflife.aspx (accessed on 20 May 2017).
- Governor’s Office. Governor O’Malley Releases Genuine Progress Indicator Results. News Release; 9 January; Office of the Governor: Annapolis, MD, USA, 2015. [Google Scholar]
- Pettit, J. Redefining American Progress. National Review. 25 October 2012. Available online: http://www.nationalreview.com/article/331558/redefining-american-progress-jim-pettit (accessed on 8 May 2017).
- Klein, A. How O’Malley whitewashed his state’s poor economy. WND. 7 May 2015. Available online: http://www.wnd.com/2015/05/how-omalley-whitewashed-his-states-poor-economy/ (accessed on 8 May 2017).
- Ehrlich, R. Kitzhaber and How the Left Cooks the Books. National Review. 17 February 2015. Available online: http://www.nationalreview.com/article/398731/kitzhaber-and-how-left-cooks-books-robert-ehrlich (accessed on 8 May 2017).
- The Capital State’s wise men now charting “genuine progress”. The Capital, 6 October 2012; 10.
- Hakim, D. Sex, Drugs and G.D.P. The New York Times. 16 June 2014. Available online: https://www.nytimes.com/2014/06/17/upshot/sex-drugs-and-gdp.html?_r=0 (accessed on 7 February 2018).
- Posner, S.M.; Costanza, R. A summary of ISEW and GPI studies at multiple scales and new estimates for Baltimore City, Baltimore County, and the State of Maryland. Ecol. Econ. 2011, 70, 1972–1980. [Google Scholar] [CrossRef]
- Neumayer, E. The ISEW—Not an Index of Sustainable Economic Welfare. Soc. Indic. Res. 1999, 48, 77–101. [Google Scholar] [CrossRef] [Green Version]
- Anonymous. Telephone Interview. 2017.
- Rosman, J. Policy Advisor, Washington State Department of Commerce. Telephone Interview. 2017.
- Zencey, E. Fellow at Gund Institute for Ecological Economics and Coordinator of the Vermont GPI Project. Telephone Interview. 2016. [Google Scholar]
- Dryzek, J.S.; Downes, D.; Hunold, C.; Schlosberg, D.; Hernes, H.-K. Green States and Social Movements: Environmentalism in the United States, United Kingdom, Germany, and Norway; Oxford University Press: Oxford, UK, 2003. [Google Scholar]
- Department of Natural Resources (DNR). Indicators GPI 2.0; Department of Natural Resources: Annapolis, MD, USA, 2017. Available online: http://dnr.maryland.gov/mdgpi/Pages/Indicators-GPI-2.aspx (accessed on 28 January 2018).
Figure 1.
Maryland Genuine Progress Indicator (GPI) 1.0 and Gross State Product (GSP), 1960–2013. Data source: DNR, 2015 [56].
Figure 1.
Maryland Genuine Progress Indicator (GPI) 1.0 and Gross State Product (GSP), 1960–2013. Data source: DNR, 2015 [56].

© 2018 by the authors. Licensee MDPI, Basel, Switzerland. This article is an open access article distributed under the terms and conditions of the Creative Commons Attribution (CC BY) license (http://creativecommons.org/licenses/by/4.0/).
Share and Cite
MDPI and ACS Style
Hayden, A.; Wilson, J. Taking the First Steps beyond GDP: Maryland’s Experience in Measuring “Genuine Progress”. Sustainability 2018, 10, 462. https://doi.org/10.3390/su10020462
AMA Style
Hayden A, Wilson J. Taking the First Steps beyond GDP: Maryland’s Experience in Measuring “Genuine Progress”. Sustainability. 2018; 10(2):462. https://doi.org/10.3390/su10020462
Chicago/Turabian StyleHayden, Anders, and Jeffrey Wilson. 2018. "Taking the First Steps beyond GDP: Maryland’s Experience in Measuring “Genuine Progress”" Sustainability 10, no. 2: 462. https://doi.org/10.3390/su10020462
Note that from the first issue of 2016, this journal uses article numbers instead of page numbers. See further details here.