Pricing Behavior for Sustainably Farmed Fish in International Trade: The Case of Norwegian Atlantic Salmon (Salmo salar)

Fisheries Policy Research Division, Korea Maritime Institute, 26 Haeyang-Ro 301Beon-Gil, Yeongdo-Gu, Busan 49111, Korea
Sustainability 2018, 10(12), 4814; https://doi.org/10.3390/su10124814
Submission received: 9 October 2018
/
Revised: 6 December 2018
/
Accepted: 13 December 2018
/
Published: 17 December 2018
(This article belongs to the Special Issue Agricultural Trade Modelling)
Abstract
:The purpose of this study is to examine how the competitive advantage on international markets based on sustainable production is reflected in the pricing behavior of farmed fish, using Norwegian Atlantic salmon (Salmo salar) as an example. The salmon is widely consumed and highly traded due to the rapid development of aquaculture. Norway, which has been successful in regulating and innovating for sustainable aquaculture, accounts for more than half of world production. A model dealing with pass-through of exchange rates and tariff rates based on the exporter’s profit maximization was applied to 28 major countries importing from Norway, using yearly panel data for 2000–2016. Significant evidence of price discrimination was observed in Asian countries where Norway has a high market share, such as China, South Korea, Thailand, and Vietnam. This implies that the market structure of imperfect competition played a major role, suggesting the need to diversify imports to transform the market structure in favor of consumers in Asian countries. Research on the pricing behavior of fisheries products, including cultured fish, is limited in international trade. This paper addresses the gap by applying the pass-through model with changes in tariff rate as well as exchange rate.
1. Introduction
Global fish production amounted to 171 million tons in 2016, of which 47% was from aquaculture production [1]. The value of aquaculture products in the total market was USD 232 billion out of a total fish production value of USD 362 billion, far exceeding the economic value from capture fisheries [2]. In contrast, capture fisheries production has remained relatively static since the late 1980s, and the share of fish stocks at biologically sustainable levels has declined from 90.0% in 1974 to 66.9% in 2015 [2]. With the increase in aquaculture production, the international trade of fish and fish products has also greatly increased due to a broader process of globalization, a large-scale transformation of the world economy through trade liberalization and technological progress. The most-traded fish are mainly aquaculture species particularly salmon, shrimp, and some bivalves. This is because aquaculture production can be controlled to a high degree, production quantities can be predicted, and vertical and horizontal integration can achieve economies of scale and logistics efficiency in the global market [2].
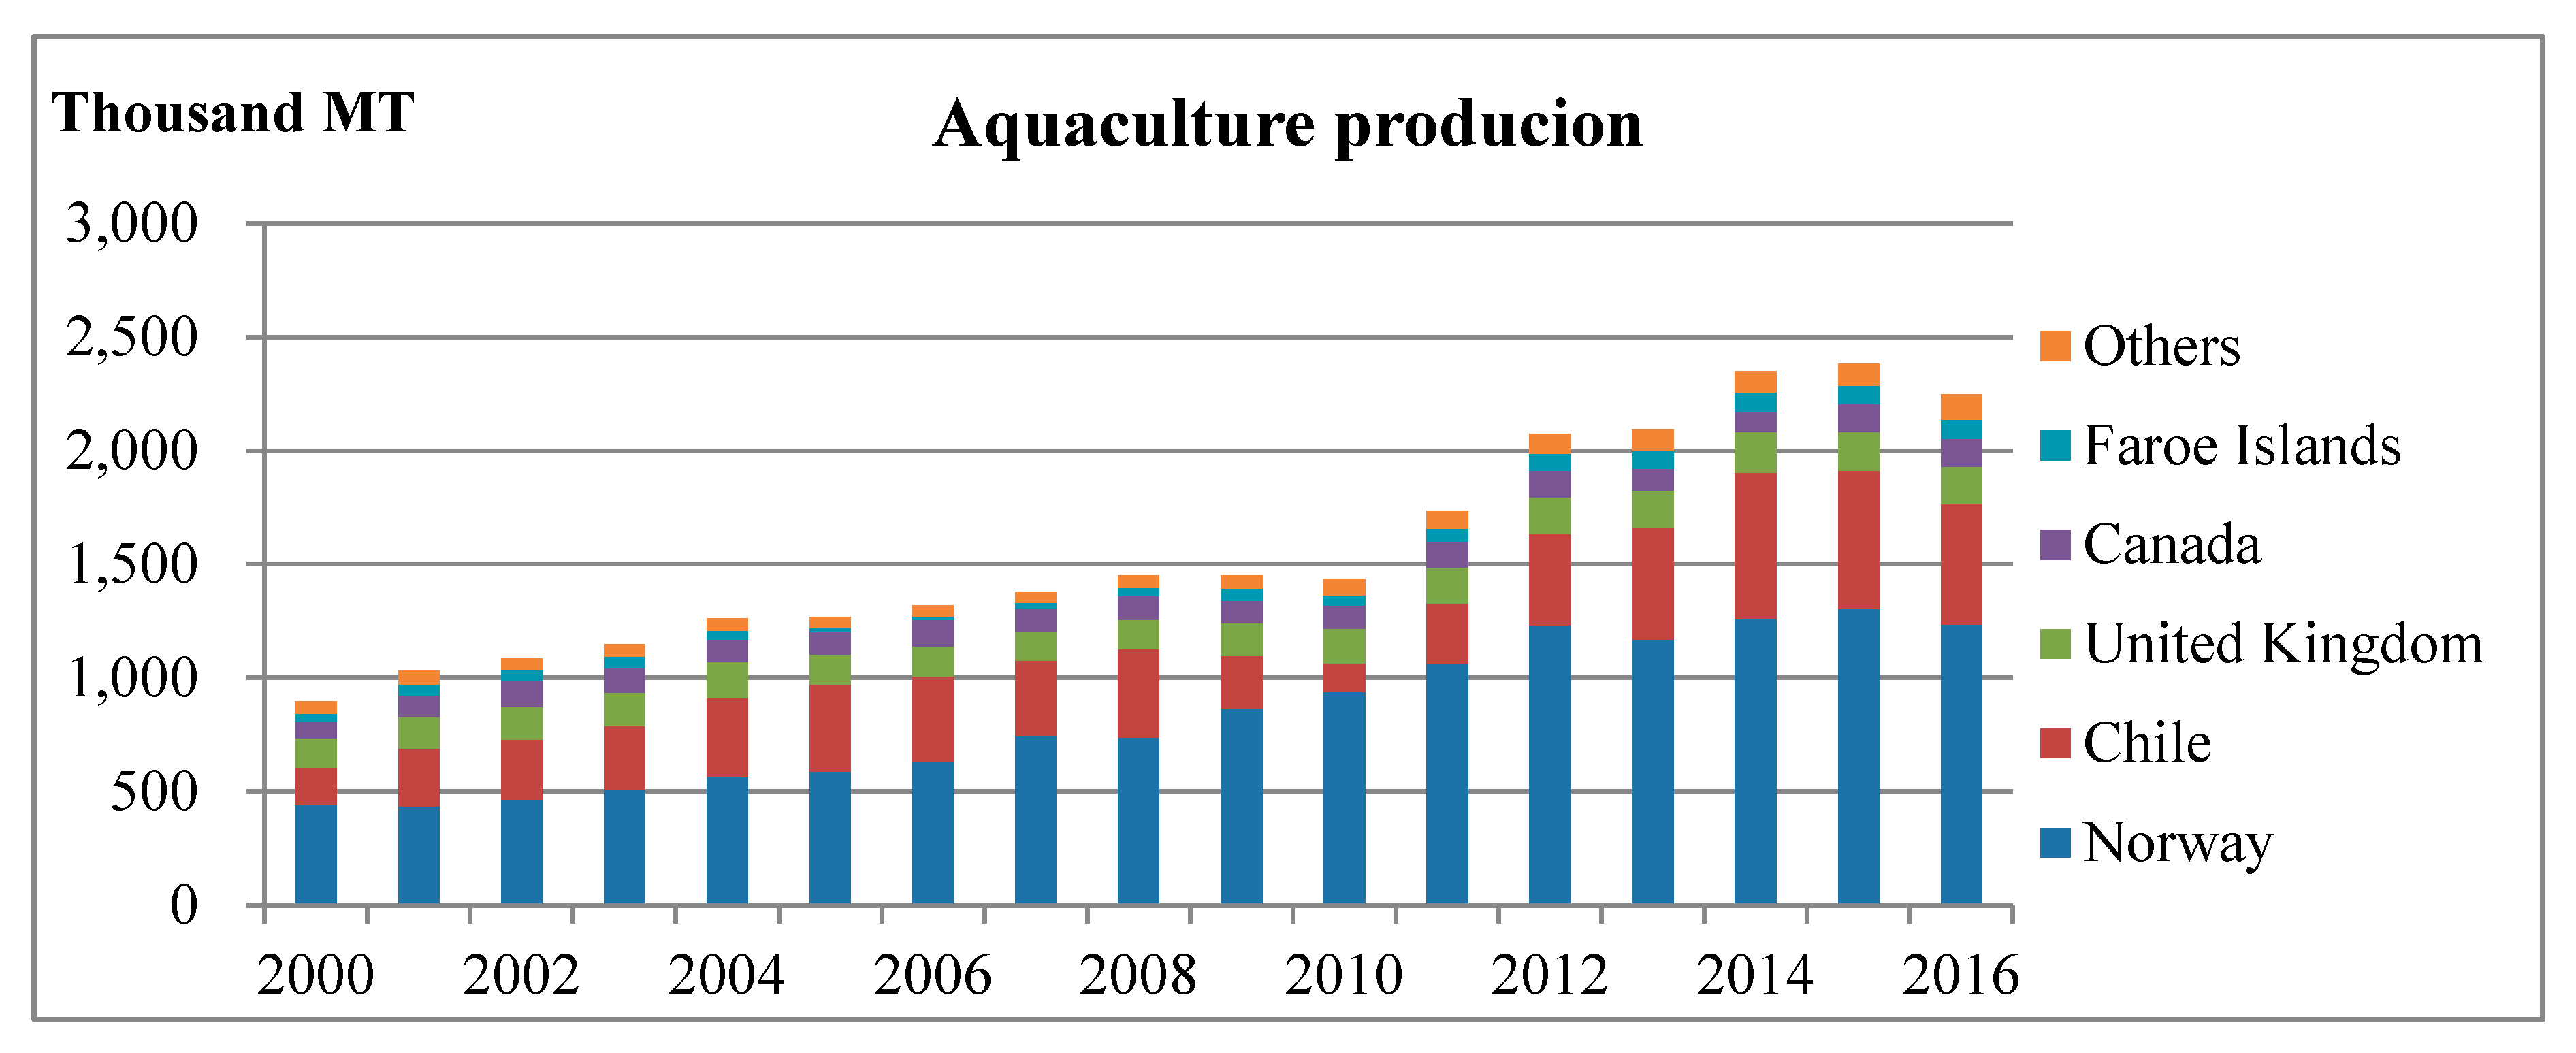
In particular, Atlantic salmon (Salmo salar) is the most heavily traded species in the world and is produced mostly through aquaculture. Its production increased from 0.9 million tons in 2000 to 2.25 million tons in 2016 (Figure 1). Norway accounts for 55% of the Atlantic salmon supply and Chile 24%, while the United Kingdom (UK), Canada, and the Faroe Islands account for 15% [1]. Over the past decade, however, frequent occurrences of sea lice and diseases have had a major impact on global Atlantic salmon production. The outbreak of Chile’s disease reduced production in Chile by half from 2009 to 2011. Chile’s production also fell 20 percent year-on-year in 2016, due to the outbreak of a natural toxic algae bloom [3].
The salmon industry has undertaken several technological innovations to address these risks. Vaccines were introduced to reduce antibiotic use, and the use of farm monitoring technologies has increased, in addition to specialists such as veterinarians and marine biologists [3]. The Norwegian government has regulated production and granted innovation incentives through a licensing system, to address environmental issues and ensure sustainability. This has led to the development of off-shore cage technology, enabling large-scale production with a reduced environmental burden and disease risk [4]. It also benefited from the fact that the ability to innovate has expanded as firms have increased in size through active mergers and acquisitions. As of 2016, there were 23 firms in Norway, producing 80% of the total supply, and 12 in Chile [5]. Notably, Marine Harvest, a multinational company operating not only in Norway but also in Chile and Canada, accounts for about 20% of world production.
Norwegian regulations have been the most successful, compared to other producers, with Norway’s production increasing by 96% between 2006 and 2016, far ahead of Chile’s 41%, the UK’s 24%, and Canada’s 5% [1]. As a result, the market share of Norwegian salmon has also increased in the world market. This supports Porter’s [6] contention that the government’s strict environmental regulation acts as a competitive advantage in international markets. Furthermore, salmon firms have recently gained stricter eco-friendly certification than government regulations, so as to actively pursue sustainability in line with increased environmental awareness of consumers. In this regard, Liem et al. [7] and Zheng et al. [8] show a high purchase intention for sustainably produced salmon, especially among highly educated consumer segments, not only in developed countries such as Australia but also in developing countries such as China.
As of November 2018, the number of salmon farming sites in Norway certified by the Aquaculture Stewardship Council (ASC), a typical aquaculture certification, is 129, which is overwhelmingly higher than the 28 in Chile and 27 in Canada [9]. The Norwegian Seafood Council, which promotes the export of Norwegian seafood, is also highlighting the sustainability of Norwegian salmon production as a competitive advantage in marketing [10]. Indeed, according to Roebuck and Wristen [11], most ASC-certified salmon farms successfully meet several key environmental indicators of the standards, including parasiticide use, antibiotic use, limits on escapes, fatal incidents involving marine mammals, viral disease mortality, and forage fish dependency ratios (the quantity of farmed fish produced relative to the quantity of wild fish used in feeds).
So, how does high competitiveness of Norwegian salmon based on sustainable production affect the pricing behavior in the market? Sustainable aquaculture is the best in the environmental dimension, but it may be different with social welfare. If sustainability leads to a non-competitive structure in certain markets, social welfare may not be maximized. The Norwegian market share is an indicator of the market structure, but it is difficult to know in detail the effect on market participants. Thus, this study analyzes the pricing behavior of Norwegian exporters by using a widely accepted economic model and deriving policy implications from the results.
Several studies have explored the salmon market structure. Steen and Salvanes [12] found that the salmon market was competitive in the long term and that Norway had market power only in the short term at country level. Jaffry et al. [13] suggested that the retail salmon market in the UK is competitive in the long term and the short term. However, these studies no longer reflect current market conditions. In a relatively recent study, Asche et al. [14] conducted a Herfindahl-Hirschman index (HHI) analysis of Norwegian and Chilean firms and found that salmon production was not concentrated enough to limit competition. On the other hand, Fischer et al. [15] found the level of concentration at country level was quite high, meaning that the policies of some governments can affect the global market. They also expected that firms’ market power would increase due to the upward trend of HHI at firm level.
To the best of the author’s knowledge, however, empirical analysis of the salmon market structure is limited. In this context, this study aims to analyze pricing behavior based on market structure for Norwegian fresh and chilled salmon. The analysis target was limited to fresh and chilled in order to remove noise from the result by maintaining the homogeneity of the product to the greatest extent possible. The target further reflects that fresh and chilled salmon accounts for more than 80% of Norwegian salmon exports and continues to grow in popularity worldwide in cuisine styles such as sushi and poke, particularly amongst the younger demographic [16].
Many empirical studies on the market structure of international trade have examined the pricing behavior of exporting firms or countries in exchange rate fluctuations [17,18,19,20,21,22,23,24,25,26,27]. This study also adopts this method. In a competitive market, changes in the exchange rate are completely passed through to the importer, and the changes have a full impact on the price after customs clearance. However, as market-dominant firms or countries adjust quantities to reduce the effect of price changes on total revenue, exchange rate changes are only partially transferred to price, resulting in price discrimination. In this case, the price received by importers will be less affected than in a competitive market.
Similarly, price discrimination may occur when the tariff rate changes, depending on the market structure. Changes in tariff rates do not apply to all countries, but since the 2000s, major importing countries of Norwegian salmon, such as China, Vietnam, Taiwan, and South Korea, have significantly reduced their tariff rates by joining the World Trade Organization (WTO) or signing regional trade agreements (RTAs). The effect of tariff rate changes is structurally the same as that of exchange rate changes, but the former is quite predictable, stable and unidirectional compared to the latter, which can lead to empirically different results. Taking this into consideration, this study also analyzed the pricing behavior when tariff rates changed. Meanwhile, differences in transaction costs of payment currencies may result in different degrees of exchange rate pass-through, which require further exploration, but this is outside the scope of this study.
2. Analytical Framework
In a competitive market, price is determined by total supply and total demand. The individual firm is a ‘price taker’ and does not influence the price at all. In contrast, in an imperfectly competitive market, a firm with market power can increase its profits by setting different prices for customers with different demand characteristics, that is, through price discrimination. For price discrimination to occur, the market should be separated temporally or spatially so that there is no possibility of resale, and firms should be able to distinguish consumers with different demand characteristics. Under these conditions, firms achieve price premium in some markets and maximize profits by restricting supplies so that marginal cost and marginal income are equal across separate markets. In this case, high prices are imposed in markets with inelastic demand and low prices in markets with elastic demand. The fresh and chilled salmon export market meets these conditions. As previously mentioned, salmon exports are concentrated in a relatively small number of firms in Norway and Chile. Due to the short shelf life of 10 to 14 days [28], resale is limited, and air transport networks must be used for long-distance destinations. Therefore, in a market with few suppliers, the elasticity of residual demand is low, which increases the possibility of setting a high price [29].
Price discrimination in export markets can be tested as the relationship between exchange rate change and export price change, namely the exchange rate pass-through (ERPT). This was also introduced as the concept of pricing to market (PTM) by Krugman [30] and has been widely applied to empirical analyses. In an integrated competitive market, the change in the exchange rate is fully reflected in local currency price, resulting in a so-called ‘complete pass-through’ that does not affect the price in the exporter’s currency. In contrast, in an imperfectly competitive market, a new optimal price is created that does not fully reflect the change in the exchange rate in the local currency price, taking into account the elasticity of demand in the export market. In this case, the exporter’s currency-based price does not match the marginal cost and includes a markup specific to the export market. By this conceptual framework, price discrimination by an exporting firm can be confirmed by testing whether price fully reflects exchange rate changes. Analysis of ERPT has covered export items from major exporting countries such as the United States, Germany, Japan, and South Korea [17,19,20,21,22] and some studies have focused on crops exporters such as the United States, Australia, Canada, Russia, and India [18,23,24,25,26,27].
Tariff rate change can also be a pathway for price discrimination through tariff rate pass-through (TRPT), which functions according to the same mechanism as ERPT. Although tariff rate change is not as common as exchange rate change, its volatility is often greater than that of exchange rate change, and its direction tends mainly to be downward as trade liberalization progresses through WTO entry or RTA signing. Research on TRPT with ERPT includes the analysis of Japanese automobile exports to the United States by Feenstra [31] and the study of India’s export industry by Mallick and Marques [32]. However, few studies are dealing with ERPT as well as TRPT for fish and fish products.
To analyze ERPT and TRPT in the pricing behavior of exporters, the profit function of exporters that deduct cost from revenue can be set as follows, based on Knetter [33].
where the demand () of the importing country is a function of the price () of the importing country in local currency, which is the product of the exchange rate () expressed as the local currency per unit of the exporting country’s currency, one plus tariff rate (), and the export price () in the exporting country’s currency, and is an index of input prices. The first order condition that maximizes profit for export price is derived as follows.
where is the absolute value of the price elasticity of demand. An exporting firm sets a price that imposes a markup specific to the importing country over common marginal costs. Changes in exchange rates or tariff rates affect export prices through marginal cost and demand elasticity. The former affects all importing countries equally, while the latter affects only specific countries. In order to distinguish this, the natural logarithm is taken on both sides and differentiated into the following.
where . is a function of both the level and the elasticity of . The empirical model based on this equation is the same as Knetter [17], with the exception of the tariff rate term. The coefficient of the tariff rate term is symmetrical to that of the exchange rate term, but may be empirically different. Although the exchange rate is volatile and difficult to predict, the tariff rate is predictable by examining the policies of the importing countries, allowing exporters to make different decisions for each market. Therefore, the empirical analysis separately estimates for exchange rate effects and for tariff rate effects. In addition, measures country effects, and measures time effects.
The hypothesis to be tested through empirical analysis is that the Norwegian salmon export markets are unified, and there is no price discrimination. If this is correct, all , , and are zero, resulting in both complete ERPT and complete TRPT, and Norwegian salmon prices are the same in all export markets. However, this does not necessarily imply perfect competition where the export price is equal to the marginal cost. It is also consistent with imperfect competition that imposes a common markup over marginal cost on all markets. If , , or differ statistically significantly from zero, then price discrimination and imperfect competition may be considered. If is nonzero and or is zero, the elasticity of the demand is constant and a fixed markup is imposed on specific markets. If or is not zero, the optimum markup will also change accordingly because the elasticity of demand varies with exchange rate or tariff rate. If the sign of or is negative, the markup will be adjusted in the direction of price stabilization of the partner country, and vice versa. However, if export products are not homogeneous by country, they may reflect quality differences, and therefore do not necessarily imply an imperfect competitive market. Therefore, the product should be as similarly defined as possible. If the homogeneity of a product cannot be assured, a finding that any of these coefficients is non-zero is only a necessary condition for price discrimination [23].
3. Data
The data used to analyze the pricing behavior of Norwegian salmon exports are annual data from 2000 to 2016. Export unit values based on free on board (FOB) data from the Global Trade Atlas [34] are used as the export price. In order to ensure the homogeneity of products, fresh and chilled Atlantic salmon with the head (HS code: 03021201) was used. This item accounts for more than 80% of Norwegian salmon exports and is also the most globally demanded salmon product. The export destinations for analysis comprise 28 countries. The major export destinations of Latvia and Lithuania were excluded from the analysis destinations considering the inconsistency in exchange rates data caused by their adoption of the euro in the 2000s. Nominal exchange rates and Consumer Price Index (CPI) data for calculating real exchange rates were obtained from the International Monetary Fund’s International Financial Statistics (IFS) database [35]. The tariff rates of importing countries were obtained from the World Bank’s Trade Analysis Information System (TRAINS) database [36]. However, a few countries have some missing values, so these are not balanced panel data. Russia, for example, has no data from 2015 to 2016 due to the trade embargo on the West following the Ukrainian crisis in 2014 [37], and the UAE does not provide CPI data before 2006.
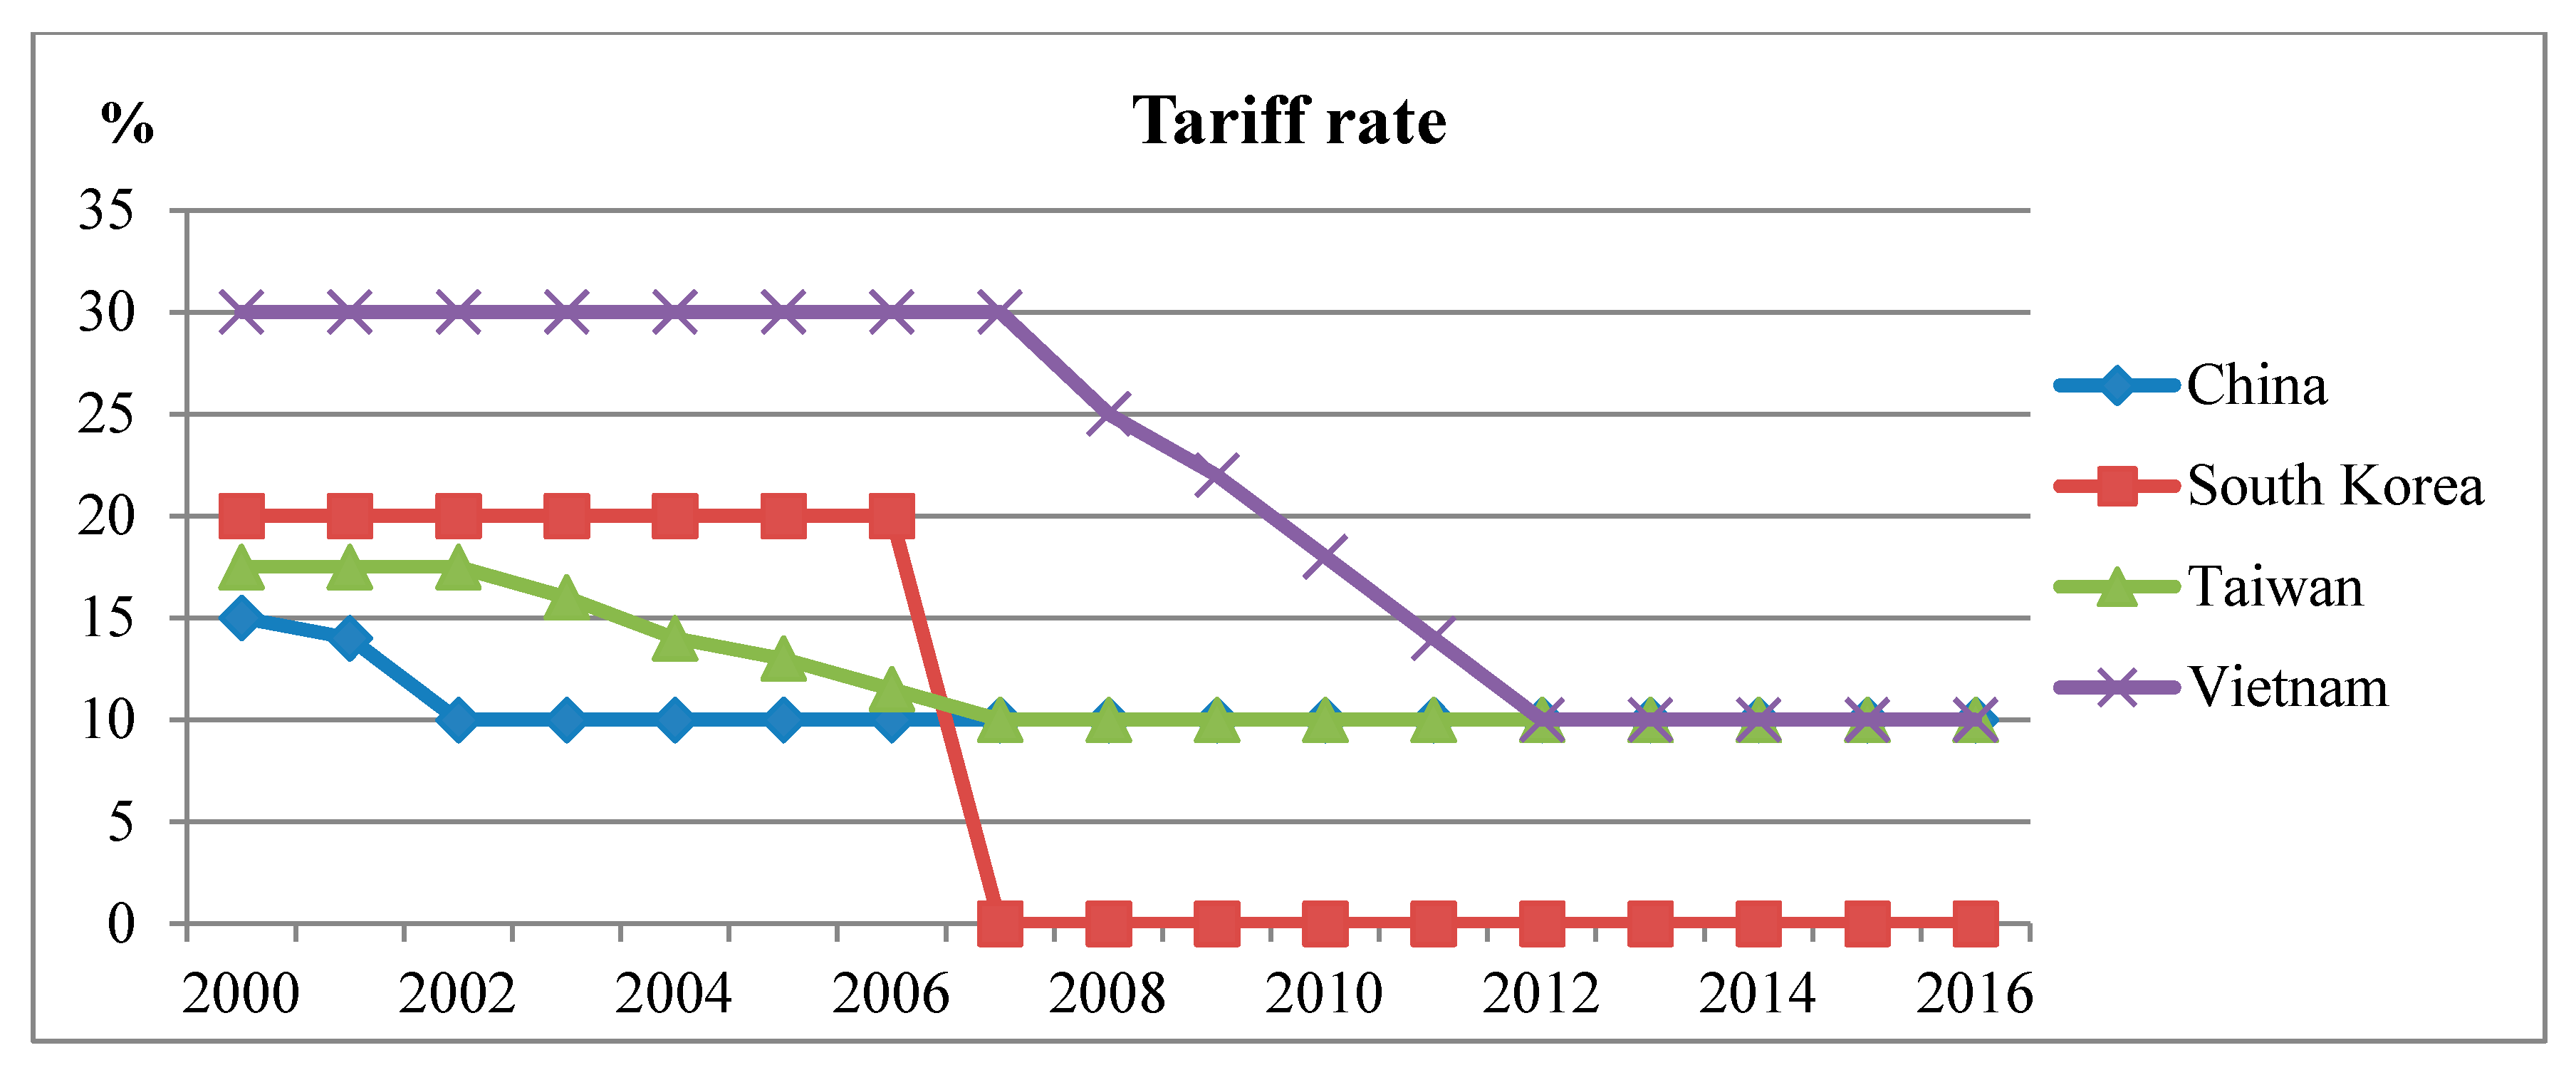
The average export prices in Norwegian krone from 2000–2016 vary by country (Table 1). Generally, they are lower in the European market, including Russia, which is the traditional market of Norway, but higher in the Asian market, such as China, Japan, South Korea, and Vietnam, which is an emerging market [16]. Price volatility expressed in coefficient of variation is also higher in Asian countries. Nominal exchange rate is the unit of the importing country’s currency in Norwegian krone and real exchange rate is calculated by multiplying the nominal one by the CPI of Norway and dividing by the CPI of the importing country. The volatilities of each rate are generally lower in western European countries, including the eurozone, and higher in Asia and Eastern Europe. In particular, nominal exchange rate volatility is high in Belarus, Russia, Turkey, Ukraine, and Vietnam. Real exchange rate volatility is high in China, the Czech Republic, Hong Kong, Russia, Singapore, Turkey, and Vietnam. The tariff rates changed only in some Asian countries during the analysis period (Figure 2). As China, Taiwan, and Vietnam joined the World Trade Organization (WTO) in the 2000s, the tariff rate was cut by 5 percentage points over two years in China, 7.5 percentage points over five years in Taiwan, and 20 percentage points over five years in Vietnam. In South Korea, 20% tariffs were immediately abolished due to the Korea-European Free Trade Association Free Trade Agreement (Korea-EFTA FTA) in 2006, resulting in the sharpest change.
Table 2 shows the Norwegian market share and export value (FOB) for fresh and chilled Atlantic salmon by country for three consecutive five-year periods. In Israel, Turkey, Russia, Belarus, Ukraine, and Asian countries except for China, the market share was 80–90% or more. Since 2011, market share in China has declined sharply, due to import restrictions triggered by the Nobel Prize award for a dissident in 2010 [38]. On the other hand, market share is lower in Europe than in Asia, except for some countries where raw materials demand for processing leads to higher market share. This is because the processed and re-exported volume through Denmark, Germany, Netherlands, Poland, and Sweden can be easily distributed, as is the case with the production volume of the UK and the Faroe Islands, resulting in more diversified sources in Europe than in Asia. In the U.S. market, Norway’s share is lower than in other regions because of the large supply from neighboring Canada.
Norway’s export values show a substantial increase in European countries but a high growth rate and market share in Asian countries. This seems to have been partly due to the growing importance of Asia as a substitute market in the context of the Russian embargo. In order to export fresh and chilled salmon to the Asian market, an air transportation network should be established. In this regard, Norway is taking advantage of its relative proximity to the market and is ahead of its competitors, Chile and Canada. In particular, Marine Harvest, the largest Norwegian firm in the world, is operating fresh and chilled salmon processing facilities in Asian bases such as China, Japan, South Korea, Taiwan, and Vietnam [39]. On the contrary, Chile and Canada are disadvantageous in terms of air transportation costs. Besides, their firms are reluctant to enter the Asian market because Norway has steadily built an eco-friendly premium image through continuous marketing. The market is not sufficiently large compared with neighboring markets such as in the United States and Brazil. As a result, Chile has been focusing on frozen salmon with low shipping costs in the Asian market [16].
4. Results and Discussion
Two models were estimated, each applying nominal and real exchange rates. Both models adopted the panel-corrected standard errors (PCSE) linear regression method proposed by Beck and Katz [41]. The method takes into account the first-order panel autocorrelation, panel-level heteroskedastic errors, and errors contemporaneously correlated across panels. In this regard, the null hypothesis that there is no first-order autocorrelation was rejected in the Wooldridge test for panel data [42]. A Fisher-type panel unit root test that can be applied to unbalanced panels was performed, and the results rejected the null hypothesis that all panels contain a unit root for all variables (Table 3).
Since the estimation results of the two models are not significantly different, we focused on the results of the nominal exchange rate model. Time effects are not presented, but almost all are significant, reflecting the shocks common to all countries at some point in time such as Chile’s production cuts in around 2010. The three null hypotheses that all countries have the same effect, all the exchange rate effects are zero, and all the tariff rate effects are zero were all rejected at the 10% significance level (Table 4). Therefore, it can be said that country-specific markups were apparent in some importing countries.
Estimates show that , , and (only for countries with changes in tariff rate) were zero in 21 out of 28 countries (Table 5). For these countries, price changes can be commonly explained by changes in marginal cost over time (time effects), rather than by a markup specific to each country. In other words, they could be either perfectly competitive markets or imperfectly competitive markets that impose a common markup on all markets.
The markets with significant country effects were Turkey, the UK, and Vietnam. Among these countries, only the UK did not have a significant effect on the exchange rate and was a negative sign. Since the UK is a high-quality salmon producer, it can be inferred that Norwegian exporters impose a lower markup than in other markets, in order to compete with domestic producers. In the case of Vietnam, . was a positive large value, which means that a larger markup is imposed than in other countries. This is an interesting result that cannot be interpreted as a product difference, considering the relatively low purchasing power of Vietnam. Exports to Vietnam increased rapidly during 2012–2016 as China’s politically motivated restriction of imports of Norwegian salmon increased smuggling into that country via the Vietnam border. In other words, demand in Vietnam is actually demand in China, and it is inferred that the markup has increased because smuggling avoids costs such as border delays, regulatory measures, and Chinese taxes [38].
Except for Turkey, significant exchange rate effects were found mainly in Asian countries with emerging markets, namely China, Thailand, and Vietnam. Similarly, the tariff rate effect was significant only in South Korea. These markets have different markups because demand elasticity changes with changes in exchange rates or tariff rates, and the effects are all negative, which means that even if the exchange rate or the tariff rate changes, the markup can be adjusted to stabilize the price in the local currency. The absolute values of the exchange rate coefficient are lower in China and Japan but higher in Thailand, Turkey, and Vietnam. Except for Thailand, they also tend to be proportionate to exchange rate volatility. Countries whose exchange rate effects were not significant, especially those in the eurozone, showed significantly lower exchange rate volatility. Unlike the exchange rate, since the tariff rate changes only in a decreasing direction during the period, the negative sign implies an increase in the export price in the currency of the exporting country. As for the value of the coefficient, it is estimated that the export price to South Korea increased by about 7% due to the abolition of the 20% tariff in the context of the FTA. The effect of tariff elimination is considered to be primarily absorbed by the margins of exporters.
In the real exchange rate model, 19 out of 28 countries showed no price discrimination (Table 6). As a result of the difference from the nominal exchange rate model, the country effect was still significant and the sign was the same in the UK and Vietnam, but not in Turkey. Countries with significant exchange rate effects include the Czech Republic, Singapore, and Ukraine instead of Japan while China, Thailand, Turkey, and Vietnam are significant, as in the former model. The tariff rate effect was also significant in Vietnam, where the tariff decline was as great as in South Korea. Unlike the nominal exchange rate model, where the signs of all significant values are negative, the exchange rate effect in the Czech Republic, Turkey, and Ukraine and the tariff rate effect in Vietnam show positive values, which are interpreted as the adjustment of prices to amplify the exchange rate or tariff rate changes.
Although there are slight differences in the estimation results of the two models, both showed that price discrimination could occur mainly in certain Asian countries where demand has multiplied in recent years, and Norway’s market share has been very high. These countries are geographically distant from major salmon exporting countries and require air transportation networks for fresh and chilled products, making it difficult for competitors to enter the markets. For this reason, it is likely that the Norwegian exporters have gained distinctive markups. These results are not consistent with research that has found the Norwegian salmon market is competitive [14] but are consistent with the prediction that competition may be limited due to intensified market concentration [15].
5. Conclusions
This study analyzed the pricing behavior of Atlantic salmon from Norway, which has been successful in regulating and innovating for sustainable aquaculture, with competitive advantages in international trade. Specifically, it has employed a model dealing with pass-through of exchange rate changes and tariff rate changes in international trade to find the evidence of the ability to price discriminate in the export of Norwegian fresh and chilled salmon. The results showed little price discrimination in the traditional market of Europe. This is because the European region has some other producing countries such as the UK and the Faroe Islands, and there are various distribution channels that import and re-export at close range. Norway’s market share in Europe is not as high as that in Asia. Moreover, in the UK, a competing producer, it was estimated that a Norwegian exporter would charge a lower markup than in other markets. On the other hand, in Asian countries such as China, South Korea, Thailand, and Vietnam, the export price can be adjusted to the change of the exchange rate or the tariff rate, and it can be inferred that Norway is exercising market power based on high market share. In particular, fixed markups were also significantly higher in Vietnam, due to the demand created by smuggling to China. In South Korea, it is estimated that the export price increased in accordance with the elimination of tariffs and a large part of the FTA effect is absorbed by the margins of Norwegian exporters.
This study has significant implications from a policy-making perspective. It can be inferred that the result, which shows that price discrimination can be common in Asian countries, is largely due to the exporter’s market power, which is due in turn to market structure. In importing countries, discriminatory pricing reduces social welfare by absorbing the consumer’s surplus as the profit of the exporting country. Therefore, in order to improve the social welfare associated with salmon imports, Asian countries need to build market structures which are more competitive. For example, China is currently increasing salmon imports via airfreight from Chile and the UK, which could change the structure of the market. In South Korea, it would be possible to expand the benefits of the FTA and create a competitive market by strategically expanding imports from Chile, the UK, and Canada, which has also entered into a free trade agreement with South Korea. However, demand for salmon in Asia is likely to increase steadily, while supply is concentrated in specific firms and countries, making the diversification of imports difficult. Therefore, in the long term, it is also worth pursuing a policy to establish a sustainable and competitive production base for salmon as a substitute for Atlantic salmon in Asian countries [43].
This study is meaningful in that it addresses the gap in research on fisheries products with a competitive advantage based on sustainability, and on salmon as the most traded fisheries product in particular, by applying widely accepted methodology in the study of international trade to confirm the ability of price discrimination in export markets. It is also one of the few studies dealing with tariff rate changes as well as exchange rate changes. Thus, this study widens the research spectrum of the existing literature on pricing behavior in international trade. Although this study finds some evidence that price discrimination could exist in the international market for sustainably farmed fish, there are limitations to what can be inferred from this finding. Apart from price discrimination, price differentials may occur due to other reasons such as discounts for large orders, long-term contracts, and quality variation. In this study, to avoid the effects of quality differences, the target of analysis was limited to whole fresh and chilled salmon, but there may be some effects depending on minute differences in products preferred by the market. As Kasa [44] points out, from a dynamic point of view, price behavior may change depending on the duration of exchange rate fluctuations that the exporter perceives. In other words, if exporters believe that the exchange rate changes temporarily, they will respond smoothly to its changes due to the adjustment cost rather than the price discrimination. The price differentials occur depending on the sales contract type as well. According to Larsen and Asche [45], the more long-term and stable the contractual relationship, the less likely it is that a complete exchange rate pass-through occurs. To corroborate the price discrimination for Norwegian salmon, such issues, which are not covered in this study, need to be supplemented in the future.
Future research will be helpful at firm level, thereby dealing with micro-behavior rather than at country level. Norway’s market share is high and active mergers and acquisitions have increased the country’s market power, but the situation may be different at firm level. If the data are segmented at firm level, a more detailed analysis can take into account the effects of individual firms. For example, price discrimination can also occur because of the difference between stable long-term contractual relationships in the traditional market, and volatile short-term relationships in the emerging market. It is not easy to obtain data on firms’ behavior, but the difference in price depending on contract type needs to be explored in the future.
In addition, this study deals only with the export market level; it does not examine the domestic market structure and subsequent price behavior after import. To thoroughly examine market efficiency and consumer welfare effects, it is necessary to complement the study of price transition according to the post-import market structure. Some studies on agricultural products have shown that perishability induces asymmetric price transmission [46,47]. For salmon, there are some studies on price transmission for advanced markets, such as France and the United States [48,49,50], but research on Asian markets is hard to find. Therefore, significant implications can be drawn for sustainable fish products and consumer welfare if the price transmission on sustainable salmon is explored in the Asian market.
Funding
The APC was funded by FTA Implementation Support Center of Korea Maritime Institute.
Conflicts of Interest
The author declares no conflict of interest.
References
- Food and Agriculture Organization. FishStatJ—Software for Fishery Statistical Time Series. Available online: http://www.fao.org/fishery/statistics/software/fishstatj (accessed on 20 June 2018).
- Food and Agriculture Organization. The State of World Fisheries and Aquaculture 2018; Food and Agriculture Organization of the United Nations: Rome, Italy, 2018. [Google Scholar]
- Mjaugeto, P.O.W.; Sandarker, K.; Steinshamn, K.B. Predicting the Distribution of the Atlantic Salmon Spot Price Using Quantile Regression; Norwegian University of Science and Technology: Trondheim, Norway, 2017. [Google Scholar]
- Edwards, P. Aquaculture environment interactions: Past, present and likely future trends. Aquaculture 2015, 447, 2–14. [Google Scholar] [CrossRef]
- Marine Harvest. Salmon Farming Industry Handbook 2017; Marine Harvest ASA: Bergen, Norway, 2017. [Google Scholar]
- Porter, M.E. The Competitive Advantage of Nations; MacMillan Press Ltd.: London, UK, 1990. [Google Scholar]
- Liem, D.G.; Turchini, G.M.; Wanich, U.; Keast, R. Sustainability descriptive labels on farmed salmon: Do young educated consumers like it more? Sustainability 2018, 10, 2397. [Google Scholar] [CrossRef]
- Zheng, Q.; Wang, H.H.; Lu, Y. Consumer purchase intentions for sustainable wild salmon in the Chinese market and implications for agribusiness decisions. Sustainability 2018, 10, 1377. [Google Scholar] [CrossRef]
- Aquaculture Stewardship Council. Available online: http://asc.force.com/Certificates/ (accessed on 11 November 2018).
- Norwegian Seafood Council. Available online: https://en.seafood.no/ (accessed on 11 November 2018).
- Roebuck, K.; Wristen, K. Global Review of the Aquaculture Stewardship Council’s Salmon Standard: Summary Report; SeaChoice: Vancouver, BC, Canada, 2018. [Google Scholar]
- Steen, F.; Salvanes, K.G. Testing for market power using a dynamic oligopoly model. Int. J. Ind. Organ. 1999, 17, 147–177. [Google Scholar] [CrossRef]
- Jaffry, S.; Fofana, A.; Murray, A.D. Testing for market power in the UK salmon retail sector. Aquacult. Econ. Manag. 2003, 7, 293–308. [Google Scholar] [CrossRef]
- Asche, F.; Roll, K.H.; Sandvold, H.N.; Sørvig, A.; Zhang, D. Salmon aquaculture: Larger companies and increased production. Aquacult. Econ. Manag. 2013, 17, 322–339. [Google Scholar] [CrossRef]
- Fischer, C.; Guttormsen, A.G.; Smith, M.D. Disease risk and market structure in salmon aquaculture. Water Econ. Policy 2017, 3, 1–29. [Google Scholar] [CrossRef]
- Food and Agriculture Organization. Globefish Highlights: A Quarterly Update on World Seafood Markets; April 2018 Issue; Food and Agriculture Organization of the United Nations: Rome, Italy, 2018. [Google Scholar]
- Knetter, M.M. Price discrimination by U.S. and German exporters. Am. Econ. Rev. 1989, 79, 198–210. [Google Scholar]
- Pick, D.H.; Park, T.A. The competitive structure of U.S. agricultural exports. Am. J. Agric. Econ. 1991, 73, 133–141. [Google Scholar] [CrossRef]
- Knetter, M.M. International comparisons of pricing-to-market behavior. Am. Econ. Rev. 1993, 83, 473–486. [Google Scholar]
- Athukorala, P.; Menon, J. Pricing-to-market behaviour and exchange rate pass-through in Japanese exports. Econ. J. 1994, 104, 271–281. [Google Scholar] [CrossRef]
- Lee, J. The response of exchange rate pass-through to market concentration in a small economy: The evidence from Korea. Rev. Econ. Stat. 1997, 79, 142–145. [Google Scholar] [CrossRef]
- Falk, M.; Falk, R. Pricing to market of German exporters: Evidence from panel data. Empirica 2000, 27, 21–46. [Google Scholar] [CrossRef]
- Griffith, G.; Mullen, J. Pricing-to-market in NSW rice export markets. Aust. J. Agric. Resour. Econ. 2001, 45, 323–334. [Google Scholar] [CrossRef] [Green Version]
- Carew, R.; Florkowski, W.J. Pricing to market behaviour by Canadian and U.S. agri-food exporters: Evidence from wheat, pulse and apples. Can. J. Agric. Econ. 2003, 51, 139–159. [Google Scholar] [CrossRef]
- Jin, H.J.; Miljkovic, D. Competitive structure of U.S. grain exporters in the world market: A dynamic panel approach. East Asian Econ. Rev. 2008, 12, 33–63. [Google Scholar] [CrossRef]
- Pall, Z.; Perekhozhuk, O.; Teuber, R.; Glauben, T. Are Russian wheat exporters able to price discriminate? Empirical evidence from the last decade. J. Agric. Econ. 2013, 64, 177–196. [Google Scholar] [CrossRef]
- Varma, P.; Issar, A. Pricing to market behaviour of India’s high value agri-food exporters: An empirical analysis of major destination markets. Agric. Econ. 2016, 47, 129–137. [Google Scholar] [CrossRef]
- United States International Trade Commission. Fresh and Chilled Atlantic Salmon from Norway; United States International Trade Commission: Washington, DC, USA, 2012.
- Varian, H.R. Microeconomic Analysis, 3rd ed.; W.W. Norton and Company: New York, NY, USA, 1992; pp. 241–253. [Google Scholar]
- Krugman, P. Pricing to market when exchange rate changes. In Real-Financial Linkages among Open Economies; Arndt, S.W., Richardson, J.D., Eds.; MIT Press: Cambridge, MA, USA, 1987; pp. 49–70. [Google Scholar]
- Feenstra, R.C. Symmetric pass-through of tariffs and exchange rates under imperfect competition: An empirical test. J. Int. Econ. 1989, 27, 25–45. [Google Scholar] [CrossRef]
- Mallick, S.; Marques, H. Pricing-to-market with trade liberalization: The role of market heterogeneity and product differentiation in India’s exports. J. Int. Money. Financ. 2012, 31, 310–336. [Google Scholar] [CrossRef]
- Knetter, M.M. Exchange Rates and Corporate Pricing Strategies; Working Paper No. 4151; National Bureau of Economic Research: Cambridge, MA, USA, 1992. [Google Scholar]
- Global Trade Atlas. Available online: https://www.gtis.com/gta/ (accessed on 21 March 2018).
- International Monetary Fund’s International Financial Statistics (IFS). Available online: http://data.imf.org/?sk=4C514D48-B6BA-49ED-8AB9-52B0C1A0179B (accessed on 2 April 2018).
- World Bank’s Trade Analysis Information System (TRAINS). Available online: http://databank.worldbank.org/data/reports.aspx?source=UNCTAD-~-Trade-Analysis-Information-System-(TRAINS) (accessed on 2 April 2018).
- Bjørkman, K.J. The Impact from the Russian Import-ban (2014-) on the Norwegian Seafood Industry: When an Export-dependent Industry Face Spill-over Effects from Geopolitical Conflicts. Master’s Thesis, University of Oslo, Oslo, Norway, 2016. [Google Scholar]
- Chen, X.; Garcia, R.J. Economic sanctions and trade diplomacy: Sanction-busting strategies, market distortion and efficacy of China’s restrictions on Norwegian salmon imports. China Inform. 2016, 30, 29–57. [Google Scholar] [CrossRef] [Green Version]
- Marine Harvest. Available online: http://marineharvestireland.com/globalassets/investors/presentations-and-webcasts/north-atlantic-seafood-forum-2018.pdf (accessed on 6 August 2008).
- Trade Map. Available online: https://www.trademap.org/ (accessed on 4 December 2018).
- Beck, N.L.; Katz, J.N. What to do (and not to do) with time-series cross-section data. Am. Polit. Sci. Rev. 1995, 89, 634–647. [Google Scholar] [CrossRef]
- Wooldridge, J.M. Econometric Analysis of Cross Section and Panel Data; MIT Press: Cambridge, MA, USA, 2002. [Google Scholar]
- SeafoodSource. Available online: https://www.seafoodsource.com/news /aquaculture/as-demand-grows-salmon-farms-spring-up-in-china-and-korea (accessed on 4 August 2018).
- Kasa, K. Adjustment costs and pricing-to-market theory and evidence. J. Int. Econ. 1992, 32, 1–30. [Google Scholar] [CrossRef]
- Larsen, T.A.; Asche, F. Contracts in the salmon aquaculture industry: An analysis of Norwegian salmon exports. Mar. Resour. Econ. 2011, 26, 141–150. [Google Scholar] [CrossRef]
- Ahn, B.; Lee, H. Vertical Price Transmission of Perishable Products: The Case of Fresh Fruits in the Western United States. J. Agric. Resour. Econ. 2015, 40, 405–424. [Google Scholar]
- Meyer, J.; von Cramon-Taubadel, S. Asymmetric price transmission: A survey. J. Agric. Econ. 2004, 55, 581–611. [Google Scholar] [CrossRef]
- Asche, F.; Jaffryb, S.; Hartmannb, J. Price transmission and market integration: Vertical and horizontal price linkages for salmon. Appl. Econ. 2007, 39, 2535–2545. [Google Scholar] [CrossRef]
- Asche, F.; Dahl, R.E.; Valderrama, D.; Zhang, D. Price transmission in new supply chains—The case of salmon in France. Aquacult. Econ. Manag. 2014, 18, 205–219. [Google Scholar] [CrossRef]
- Singh, K. Price transmission among different Atlantic salmon products in the U.S. import market. Aquacult. Econ. Manag. 2016, 20, 253–271. [Google Scholar] [CrossRef]
Figure 1.
Aquaculture production of Atlantic salmon (Salmo salar) [1].
Figure 1.
Aquaculture production of Atlantic salmon (Salmo salar) [1].

Figure 2.
Tariff rate of Norwegian fresh and chilled Atlantic salmon by country [36].
Figure 2.
Tariff rate of Norwegian fresh and chilled Atlantic salmon by country [36].


| Country | Export Price | Nominal Exchange Rate b | Real Exchange Rate b | |||
|---|---|---|---|---|---|---|
| Mean (NOK/kg) a | CV (%) c | Mean | CV (%) | Mean | CV (%) | |
| Belarus | 35.2 | 27.5 | 0.10 | 75.9 | 0.05 | 11.0 |
| Belgium | 32.8 | 30.4 | 0.12 | 5.6 | 0.12 | 5.1 |
| China | 35.1 | 35.0 | 1.08 | 14.8 | 1.08 | 16.7 |
| Czech Republic | 32.7 | 29.6 | 3.50 | 13.1 | 3.56 | 15.2 |
| Denmark | 31.0 | 31.4 | 0.92 | 5.6 | 0.91 | 4.5 |
| Finland | 30.8 | 31.7 | 0.12 | 5.6 | 0.12 | 4.5 |
| France | 32.3 | 28.0 | 0.12 | 5.6 | 0.12 | 4.5 |
| Germany | 32.5 | 28.6 | 0.12 | 5.6 | 0.12 | 4.4 |
| Hong Kong | 34.8 | 33.7 | 1.16 | 15.3 | 1.11 | 18.5 |
| Israel | 35.4 | 31.0 | 0.60 | 14.0 | 0.61 | 13.6 |
| Italy | 32.9 | 32.1 | 0.12 | 5.6 | 0.12 | 4.8 |
| Japan | 35.1 | 30.6 | 15.66 | 13.3 | 14.81 | 14.8 |
| Netherlands | 32.1 | 28.6 | 0.12 | 5.6 | 0.12 | 4.8 |
| Poland | 30.9 | 31.0 | 0.50 | 7.2 | 0.51 | 7.0 |
| Portugal | 34.3 | 30.5 | 0.12 | 5.6 | 0.12 | 5.3 |
| Russia | 29.3 | 23.5 | 4.57 | 17.4 | 6.02 | 21.5 |
| Singapore | 34.0 | 34.0 | 0.22 | 13.0 | 0.22 | 15.1 |
| South Korea | 36.0 | 36.8 | 167.43 | 14.1 | 171.10 | 11.8 |
| Spain | 32.1 | 30.2 | 0.12 | 5.6 | 0.12 | 6.0 |
| Sweden | 32.8 | 31.0 | 1.13 | 5.2 | 1.11 | 4.6 |
| Taiwan | 34.6 | 33.5 | 4.78 | 13.5 | 4.67 | 14.0 |
| Thailand | 34.8 | 33.1 | 5.35 | 11.2 | 5.42 | 12.6 |
| Turkey | 33.4 | 29.0 | 0.26 | 25.3 | 0.29 | 15.1 |
| UAE | 34.6 | 31.2 | 0.55 | 15.4 | 0.59 | 13.6 |
| Ukraine | 31.6 | 35.0 | 1.28 | 55.8 | 1.41 | 11.7 |
| United Kingdom | 31.8 | 25.9 | 0.09 | 13.1 | 0.09 | 11.3 |
| United States | 35.6 | 32.3 | 0.15 | 15.4 | 0.15 | 13.3 |
| Vietnam | 37.9 | 31.4 | 2678.53 | 23.8 | 3028.09 | 18.2 |
Notes: a Export price expressed in Norwegian krone. As an average of 2000–2016, USD 1.0 equaled approximately NOK 6.84. b Exchange rate is presented as foreign currency per unit NOK. c CV is the coefficient of variation expressed in percentage.
Table 2.
Market share and export value of Norwegian fresh and chilled Atlantic salmon by country [40].
Table 2.
Market share and export value of Norwegian fresh and chilled Atlantic salmon by country [40].
| Country | Market Share (%) | Export from Norway (Million NOK) | ||||
|---|---|---|---|---|---|---|
| 2002–2006 | 2007–2011 | 2012–2016 | 2002–2006 | 2007–2011 | 2012–2016 | |
| Belarus | 97.5 | 99.5 | 97.1 | 11 | 223 | 1288 |
| Belgium | 33.2 | 37.9 | 46.2 | 595 | 783 | 1149 |
| China | 75.2 | 68.8 | 25 | 421 | 1084 | 1643 |
| Czech Republic | 53.5 | 47.5 | 47.7 | 71 | 293 | 1822 |
| Denmark | 77.6 | 81.9 | 83.3 | 7345 | 9267 | 14,111 |
| Finland | 84.2 | 84.8 | 83.7 | 1500 | 3307 | 5500 |
| France | 42.6 | 49.7 | 45.6 | 7898 | 15,118 | 20,833 |
| Germany | 46 | 49.4 | 48.7 | 2690 | 3458 | 7366 |
| Hong Kong | 93 | 91.9 | 94 | 910 | 2125 | 3673 |
| Israel | 93.4 | 99.3 | 99.6 | 68 | 378 | 1522 |
| Italy | 46.4 | 53.4 | 50 | 1707 | 3010 | 8143 |
| Japan | 65.2 | 75.3 | 86 | 2676 | 3140 | 4613 |
| Netherlands | 59.2 | 70.3 | 65.9 | 2154 | 3977 | 9370 |
| Poland | 53.9 | 52.8 | 51.1 | 3104 | 10,983 | 24,902 |
| Portugal | 52.6 | 53.6 | 52.5 | 388 | 979 | 2681 |
| Russia | 92.2 | 97.7 | 99.8 | 1741 | 9363 | 9562 |
| Singapore | 92.9 | 85.6 | 92.7 | 238 | 496 | 1434 |
| South Korea | 62.4 | 98.7 | 99.1 | 155 | 433 | 1995 |
| Spain | 47.2 | 52.8 | 51 | 3017 | 5336 | 10,905 |
| Sweden | 90.7 | 92.5 | 97.4 | 1711 | 3154 | 4943 |
| Taiwan | 47.8 | 79.2 | 79.6 | 269 | 845 | 2279 |
| Thailand | 68.6 | 68.3 | 96.5 | 35 | 82 | 968 |
| Turkey | 99.9 | 99.9 | 99.9 | 83 | 454 | 1101 |
| UAE | 81.5 | 70.5 | 77.1 | 54 | 173 | 906 |
| Ukraine | 94.5 | 94.8 | 99.3 | 118 | 1080 | 2256 |
| United Kingdom | 52.5 | 52.8 | 53.9 | 2641 | 4935 | 11,497 |
| United States | 1.2 | 0.8 | 8.5 | 153 | 137 | 2357 |
| Vietnam | 79.1 | 88.7 | 94.3 | 27 | 315 | 3212 |
Notes: Market share is based on export value to the country.
Table 3.
Results of Fishery-type panel unit test.
| Variable | Statistic (Inverse Normal) | Note |
|---|---|---|
| Export price | −6.986 *** | 1 lag demeaned with trend |
| Nominal exchange rate | −8.814 *** | 1 lag demeaned with drift |
| Real exchange rate | −5.921 *** | 1 lag demeaned with drift |
| Tariff rate | −7.160 *** | 1 lag demeaned with drift |
Notes: *** denotes statistical significance at the 1% level.
Table 4.
Results of joint significance test.
| Null Hypothesis | Nominal Exchange Model | Real Exchange Model |
|---|---|---|
| 371.54 *** | 505.81 *** | |
| 340.34 *** | 451.55 *** | |
| 7.99 * | 13.97 *** |
Notes: *** and * denote statistical significance at the 1% and 10% levels, respectively.
Table 5.
Results with nominal exchange rates.
| Country | Country Effect () | Exchange Rate Effect () | Tariff Rate Effect () | ||||||
|---|---|---|---|---|---|---|---|---|---|
| Belarus | −0.638 | (0.541) | −0.034 | (0.024) | |||||
| Belgium | −0.762 | (0.622) | −0.095 | (0.164) | |||||
| China | −0.466 | (0.563) | −0.192 | ** | (0.076) | −0.265 | (0.861) | ||
| Czech Republic | −0.744 | (0.548) | 0.146 | (0.099) | |||||
| Denmark | −0.634 | (0.543) | −0.125 | (0.151) | |||||
| Finland | −0.756 | (0.676) | −0.060 | (0.187) | |||||
| France | −0.344 | (0.649) | 0.109 | (0.182) | |||||
| Germany | −0.332 | (0.617) | 0.113 | (0.164) | |||||
| Hong Kong | −0.517 | (0.535) | 0.023 | (0.094) | |||||
| Israel | −0.451 | (0.543) | 0.073 | (0.061) | |||||
| Italy | −0.847 | (0.644) | −0.136 | (0.129) | |||||
| Japan | −0.078 | (0.561) | −0.153 | * | (0.088) | ||||
| Netherlands | −0.453 | (0.620) | 0.061 | (0.170) | |||||
| Poland | −0.466 | (0.532) | 0.228 | (0.140) | |||||
| Portugal | −0.616 | (0.664) | −0.046 | (0.126) | |||||
| Russia | −0.676 | (0.548) | 0.052 | (0.075) | |||||
| Singapore | −0.701 | (0.558) | −0.108 | (0.075) | |||||
| South Korea | − | − | −0.089 | (0.105) | −0.428 | *** | (0.166) | ||
| Spain | −0.615 | (0.630) | −0.015 | (0.166) | |||||
| Sweden | −0.559 | (0.542) | −0.034 | (0.109) | |||||
| Taiwan | −0.181 | (0.459) | −0.144 | (0.145) | −1.001 | (0.765) | |||
| Thailand | −0.054 | (0.583) | −0.273 | *** | (0.084) | ||||
| Turkey | −1.091 | ** | (0.542) | −0.397 | *** | (0.083) | |||
| UAE | −0.495 | (0.538) | 0.028 | (0.067) | |||||
| Ukraine | −0.638 | (0.545) | 0.097 | (0.068) | |||||
| United Kingdom | −0.942 | * | (0.564) | −0.147 | (0.104) | ||||
| United States | −0.603 | (0.638) | −0.060 | (0.106) | |||||
| Vietnam | 2.082 | ** | (1.012) | −0.305 | ** | (0.121) | −0.535 | (0.402) | |
| Constant | 4.035 | *** | (0.539) | ||||||
| Observation | 468 | ||||||||
| R2 | 0.966 | ||||||||
| Wooldridge test | 33.461 *** | ||||||||
Notes: Values in parentheses are standard errors. ***, **, and * denote statistical significance at the 1%, 5%, and 10% levels, respectively. South Korea is treated as the intercept.
Table 6.
Results with real exchange rates.
| Country | Country Effect () | Exchange Rate Effect () | Tariff Rate Effect () | ||||||
|---|---|---|---|---|---|---|---|---|---|
| Belarus | −0.494 | (0.670) | 0.065 | (0.100) | |||||
| Belgium | −0.856 | (0.723) | −0.075 | (0.186) | |||||
| China | −0.627 | (0.661) | −0.183 | *** | (0.065) | −0.034 | (0.822) | ||
| Czech Republic | −0.903 | (0.649) | 0.162 | ** | (0.079) | ||||
| Denmark | −0.770 | (0.643) | −0.121 | (0.205) | |||||
| Finland | −0.814 | (0.832) | −0.023 | (0.249) | |||||
| France | −0.739 | (0.813) | −0.014 | (0.245) | |||||
| Germany | −0.628 | (0.760) | 0.036 | (0.221) | |||||
| Hong Kong | −0.649 | (0.639) | −0.016 | (0.077) | |||||
| Israel | −0.581 | (0.645) | 0.086 | (0.059) | |||||
| Italy | −0.723 | (0.767) | −0.012 | (0.175) | |||||
| Japan | −0.343 | (0.649) | −0.108 | (0.071) | |||||
| Netherlands | −0.723 | (0.766) | −0.002 | (0.224) | |||||
| Poland | −0.660 | (0.640) | 0.150 | (0.134) | |||||
| Portugal | −0.521 | (0.758) | 0.064 | (0.160) | |||||
| Russia | −0.828 | (0.670) | 0.053 | (0.081) | |||||
| Singapore | −0.861 | (0.647) | −0.123 | *** | (0.047) | ||||
| South Korea | − | − | −0.115 | (0.125) | −0.380 | ** | (0.161) | ||
| Spain | −0.625 | (0.721) | 0.045 | (0.163) | |||||
| Sweden | −0.689 | (0.642) | −0.097 | (0.107) | |||||
| Taiwan | −0.308 | (0.528) | −0.146 | (0.131) | −1.084 | (0.694) | |||
| Thailand | −0.235 | (0.678) | −0.244 | *** | (0.082) | ||||
| Turkey | 0.276 | (0.650) | 0.758 | *** | (0.094) | ||||
| UAE | −0.608 | (0.630) | 0.060 | (0.087) | |||||
| Ukraine | −0.889 | (0.658) | 0.379 | ** | (0.184) | ||||
| United Kingdom | −1.213 | * | (0.681) | −0.203 | (0.131) | ||||
| United States | −0.852 | (0.776) | −0.119 | (0.138) | |||||
| Vietnam | 2.053 | * | (1.115) | −0.348 | ** | (0.145) | 0.880 | ** | (0.384) |
| Constant | 4.165 | *** | (0.639) | ||||||
| Observation | 461 | ||||||||
| R2 | 0.965 | ||||||||
| Wooldridge test | 15.310 *** | ||||||||
Notes: Values in parentheses are standard errors. ***, **, and * denote statistical significance at the 1%, 5%, and 10% levels, respectively. South Korea is treated as the intercept.
© 2018 by the author. Licensee MDPI, Basel, Switzerland. This article is an open access article distributed under the terms and conditions of the Creative Commons Attribution (CC BY) license (http://creativecommons.org/licenses/by/4.0/).
Share and Cite
MDPI and ACS Style
Kim, B.-T. Pricing Behavior for Sustainably Farmed Fish in International Trade: The Case of Norwegian Atlantic Salmon (Salmo salar). Sustainability 2018, 10, 4814. https://doi.org/10.3390/su10124814
AMA Style
Kim B-T. Pricing Behavior for Sustainably Farmed Fish in International Trade: The Case of Norwegian Atlantic Salmon (Salmo salar). Sustainability. 2018; 10(12):4814. https://doi.org/10.3390/su10124814
Chicago/Turabian StyleKim, Bong-Tae. 2018. "Pricing Behavior for Sustainably Farmed Fish in International Trade: The Case of Norwegian Atlantic Salmon (Salmo salar)" Sustainability 10, no. 12: 4814. https://doi.org/10.3390/su10124814
Note that from the first issue of 2016, this journal uses article numbers instead of page numbers. See further details here.