Updating Carbon Storage Capacity of Spanish Cements


1
International Center of Numerical Methods in Engineering, CIMNE, Paseo General Martínez Campos, 41, 9°, 28010 Madrid, Spain
2
Spanish Institute of Cement and its Applications (IECA), C/José Abascal, 53, 28003 Madrid, Spain
*
Author to whom correspondence should be addressed.
Sustainability 2018, 10(12), 4806; https://doi.org/10.3390/su10124806
Submission received: 9 November 2018
/
Revised: 3 December 2018
/
Accepted: 4 December 2018
/
Published: 17 December 2018
(This article belongs to the Special Issue Sustainable Cementitious Materials for the Construction Industry)
Abstract
:The fabrication of cement clinker releases CO2 due to the calcination of the limestone used as raw material, which contributes to the greenhouse effect. The industry is involved in a process of reducing this amount liberated to the atmosphere by mainly lowering the amount of clinker in the cements. The cement-based materials, such as concrete and mortars, combine part of this CO2 by a process called “carbonation”. Carbonation has been studied lately mainly due to the fact that it induces the corrosion of steel reinforcement when bringing the CO2 front to the surface of the reinforcing bars. Thus, the “rate of carbonation” of the concrete cover is characterized by and linked to the length of service life of concrete structures. The studies on how much CO2 is fixed by the hydrated phases are scarce and even less has been studied the influence of the type of cement. In present work, 15 cements were used to fabricate paste and concrete specimens withwater/cement (w/c) ratios of 0.6 and 0.45 which reproduce typical concretes for buildings and infrastructures. The amount of carbon dioxide uptake was measured through thermal gravimetry. The degree of carbonation, (DoC) is defined as the CO2 fixed with respect to the total theoretical maximum and the carbon storage capacity (CSC) as the carbonation uptake by a concrete element, a family or the whole inventory of a region or country. The results in the pastes where analyzed with respect to the uptake by concretes and indicated that: (a) the humidity of the pores is a critical parameter that favours the carbonation reaction as higher is the humidity (within the normal atmospheric values), (b) all types of cement uptake CO2 in function of the CaO of the clinker except the binders having slags, which can uptake additional CO2 giving aDoC near or above 100%. The CSC of Spain has been updated with respect to a previous publication resulting in proportions of 10.8–11.2% of the calcination emissions, through considering a ratio of “surface exposed/volume of the element” of 3 as an average of the whole Spanish asset of building and infrastructures.
1. Introduction
Climatic change is a threat for the wellbeing of humanity. Greenhouse effects seem to be increasing the average atmospheric temperature with all the undesirable side consequences of extreme climatic events. One of the pollutants that produces the increase in temperature is known to be carbon dioxide evolved from combustion engines and industrial activity. Cement manufacture is one of the contributors to the increase of carbon dioxide in the atmosphere due to in its fabrication releases around 825 kg of CO2 by ton of clinker produced of which only around 525 kg of CO2 per ton of clinker is due to the calcination of limestone and clays. Then, 300 kg of CO2 per ton of clinker is produced from the combustion of fuel. These concerns helped to promote the formation of the Intergovernmental Panel for Climatic Change (IPCC) [1], created in 1988 by the World Meteorological Organization (WMO) and the United Nations Environment Program (UNEP), to produce reports by experts and scientists on the of climate change, as well as its impacts and future risks.
However, the alkaline nature of the cement-based materials makes part of this carbon dioxide to be again fixed in a process named “carbonation” [2]. This carbonation consists in that the atmospheric CO2 penetrates through the pores of the concrete and/or mortar reacting with the CaO of the cement phases, mainly with the calcium hydroxide (which is around 25% in mass of the pure Portland fraction—that from the clinker—of the cements) but also with the other cement hydrates (calcium silicates—named CSH gel—and aluminum and iron oxides). The carbonation lowers the pH of the pore solution, typically from above 13 to less than 8 [3]. The pH drop produces depassivates, the steel reinforcement promoting its corrosion if the pores contain enough humidity. This pH drop also induces the carbonation of the hydrated cement phases with a decrease or increase of porosity that however it is not of engineering significance. Carbonation advances if the pores are dry as the CO2 gas is not very soluble in water and stops if the concrete is wet. Environmentswith wet–dry cycles are the most risky because they enable the carbonation to progress during dry periods and the corrosion evolves advances during the wet periods. Reinforcement corrosion induces the cracking of the steel concrete cover and affects the steel/concrete bond, which has led in to substantial economic losses due to the need of repairing.
These consequences for the safety and economy of concrete structures made concrete carbonation extensively studied. The rate of advance of the carbonation front (measured through a pH indicator-phenolphthalein-) has been tested in the laboratory and on site and rates of carbonation have been characterized. For the carbonation to advance the transport of the CO2 gas is however not the only process, because as said the carbon dioxide reacts with the cement hydrated phases and then, cement captures back part of the CO2 released during its fabrication.
Opposite to the carbonation rate, the “degree of carbonation” (DoC), that is the amount of CO2 fixed with respect to the maximum which could be fixed by CaO of the cement phases, has scarcely been studied [4,5,6,7]. In general, the DoC has been assumed but not experimentally tested. Thus, in studies made at national level in different countries on the amount of CO2 that is uptake by the concrete structures produced annually, the DoC has been always assumed. The CO2 recombination would be 100% efficient if all the CO2 released during clinker fabrication reacts during the whole concrete life cycle of the concrete structures. This was the proposal from Steinour [8] and Pade & Guimaraes [9] Tuutti [10] and Bakker [11]: Their formulas were the following (MCO2 and MCaO are the molecular weights of each compound, portlandite [CH], aluminates [AFt and AFm phases]):
where: Cx = CO2 concentration at discontinuity (kmol/m3)
Pade & Guimaraes → CO2-uptake = 0.75 · C · CaO · (MCO2/MCaO)
Cs = CO2 concentration in surroundings (kmol/m3)
D = Diffusion coefficient of the CO2 (m2/s)
t = Time (s)
A and B are functions that define carbonation and drying rate.
However, to assume 100% of efficiency seems not feasible due several reasons as that the cement does not hydrates 100% or the geometry and sizes of the pores do not enable the gas to reach all cement particles.Then, studies in other countries [12,13,14,15,16,17,18,19] have assumed less amount than 100% of CaO carbonation, although they do not justify the value adopted.
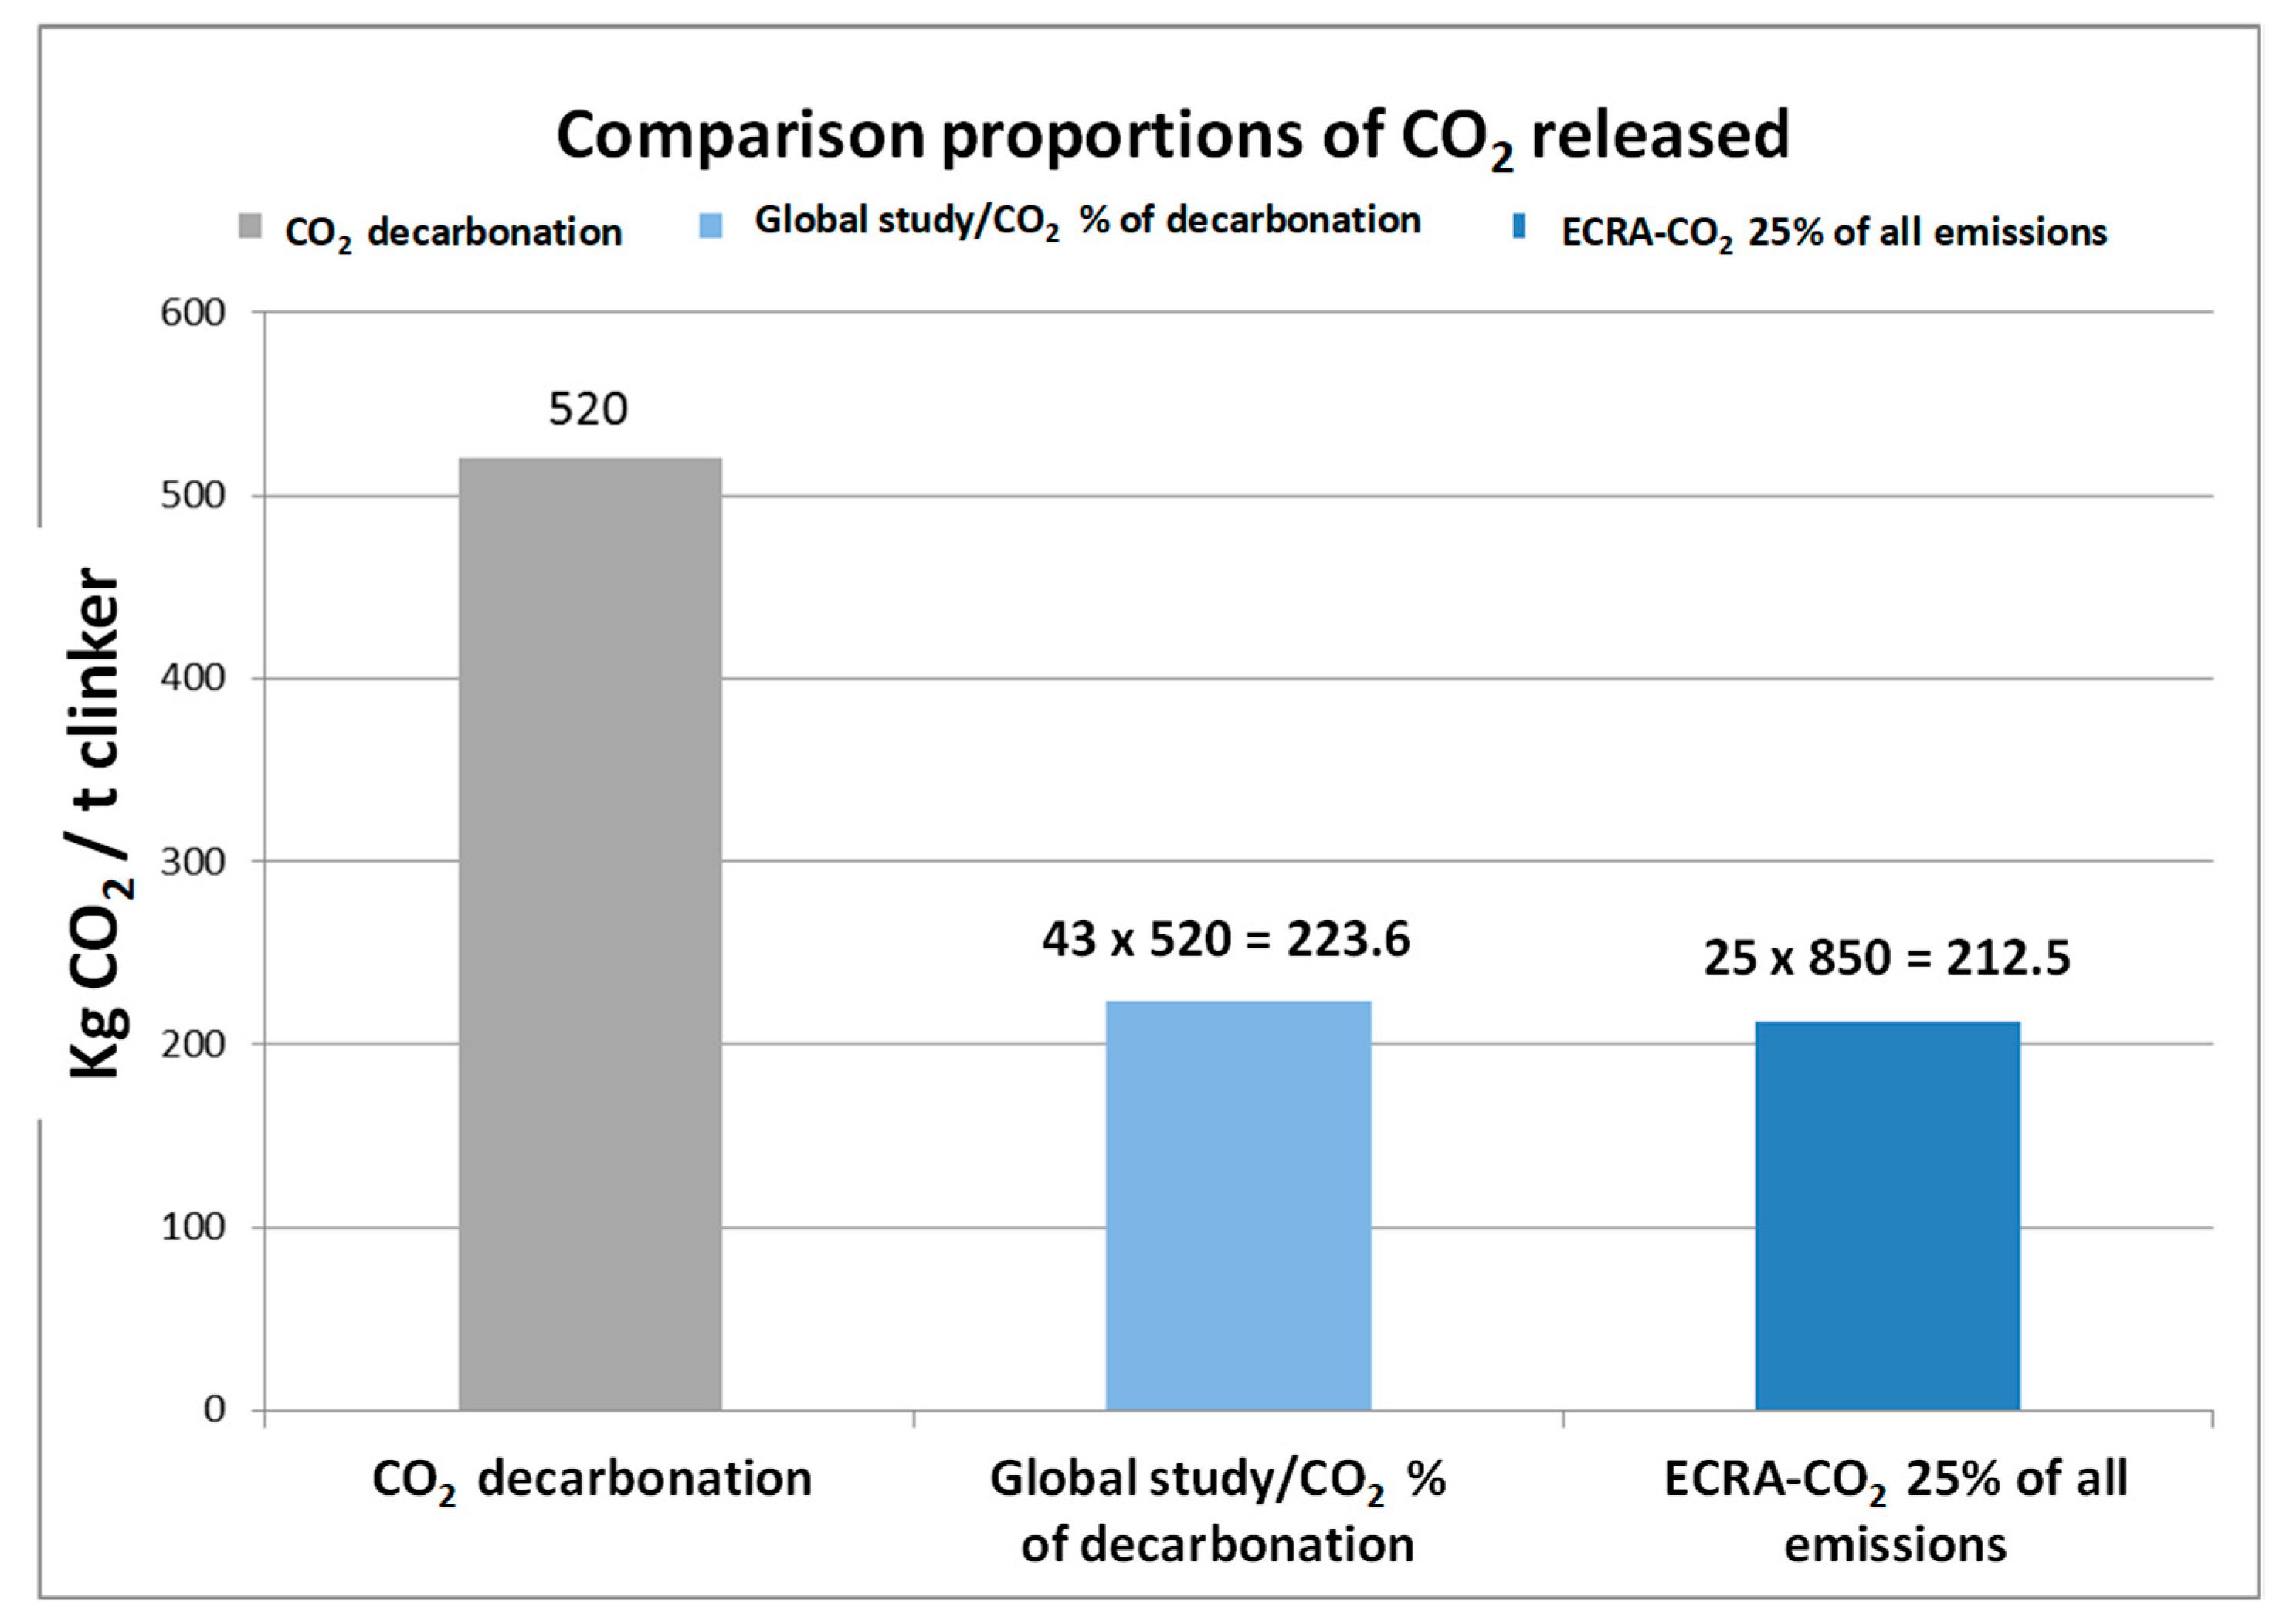
A study on CO2 uptake by concrete has been published by several authors who were involved in previous national studies [20]. The worldwide amplitude of this “global study” [20] is remarkable. The study makes a calculation of the CO2 recombined from 1913 by concrete structures. The study assumes a degree of carbonation of about 80% in the carbonated zone and involves not only the life step of concrete service but also its demolition and recycling as aggregate, as well as the use of cement in mortars and accounting for the clinker dust.Following this work, “a cumulative amount of 4.5 GtC has been sequestered in carbonating cement materials from 1930 to 2013, offsetting 43% of the CO2 emissions from production of cement over the same period, not including emissions associated with fossil use during cement production.”The result of 43% is not of the DoC but of the “carbon storage capacity” that is standardized by the surface/volume ratio of the structures produced and exposed to the atmospheric action. Although the amount of 43% may seem high, Figure 1 shows its comparison with the result obtained in a European study [18]. If the amount of CO2 released due to decarbonation in the kiln is of 52% of the total as indicated in [1] (including kiln dust otherwise is 51%), the recombination of 43% represents 223.6 kg/ton while the 25% of [18] is referred to the total emissions including the fuel represents, 212.5 kg/ton.
Due to the lack of realistic experimental data on the CO2 amount that can be fixed during carbonation, a study was undertaken in Spain [21,22] with two types of concrete and paste specimens (with mix proportions typical for buildings and for public works), fabricated with 15 different cements most used in the country and exposed to three different environments. In present work, we report updated results of the DoC of the pastes with respect to the results presented in (22) and its comparison with the DoC of the concretes. Additionally, we discuss an example of calculation of the “carbon storage capacity” of Spain, made for a particular year, using the experimental values of the DoC found and the procedure of calculation of the European standard for the sustainability of construction works, as will be described further.
2. Experimental
Two types of specimens were fabricated: Concrete cylinders and small prismatic of paste.
- The concretes cylinders were of 75 × 150 mm in size. The mix proportions for the concretes are in Table 1.
- Prismatic (10 × 10 × 60 mm) Portland cement pastes made of eight different types of cement and with two cement/water ratios of 0.45 and 0.60 were manufactured. Table 2 shows the standard designation according to EN 197-1:2011 [24] and the chemical composition of the Portland cements determined according to the EN 196-2 [25]. All the specimens were cured at 95% RH for only 48 h in order to reproduce a normal site curing. Later, all of them were removed from the molds and were kept to laboratory room temperature and humidity for additional 26 days. (22 °C and 38% RH average conditions). After this period of time, a third of the set of specimens remained in the lab (indoors condition), whereas the other two-thirds were moved to the outdoor (sheltered and unsheltered from rain). The average environmental values during the four years of exposure were of 16 °C and 57% RH. A view of the exposure site unsheltered from rain is shown in Figure 2.
At predetermined times, carbonation progress was measured through phenolphthalein (Figure 2) and samples were removed from the carbonated zones of both concretes and pastes in order to determine the CO2 fixed. For the sake of calculation of this recombined CO2, thermogravimetric analyses (TGA) were performed at different ages (zero, 28 and 90 days and 1 and 4 years) with a STA 449F3 Netzsch thermogravimetric analyzer. Fifty milligrams of hydrated and carbonated cement powder, with a grain size lower than 100 µm were heated from lab temperature to 950–1000 °C at 4 °C/min with an inert atmosphere of nitrogen. Weight losses were recorded as a function of the temperature. This experimental technique allows determining the amount of carbon dioxide, portlandite and combined water contained in the CSH gel. The water contained in the CSH gel is the water loss registered from 110 °C to the beginning of the portlandite decomposition (around 400 °C). In order to standardize the thermogravimetric results, all of them were expressed as cement grams after calcination at 950–1000 °C, i.e., ignited mass, without water and calcium carbonate.
Calculations
The carbonation rate, VCO2 is the factor linking the depth of carbonation (x) and the square root of the time (t0.5) following:
The corrosion specialists name often the depth of carbonation as a “degree of carbonation” as it gives the proportion in volume that is carbonated of the concrete element.
In present paper, however the degree of carbonation (DoC) is reserved for the proportion of CO2 combined or fixed by the hydrated cement phases with respect to the amount of CO2 released duringclinker production due to limestone calcination.
The CO2 fixed in the carbonated zone can be calculated through the following expression (K is the clinker content, here taken as 0.955 of the cement assuming a 4.5% of CaSO42H2O added to it, %CO2 is the amount found in the TG analysis)
While the CO2 released during clinkerization is calculated by means of (being the relation in mass MCO2/MCaO= 0.785):
3. Results
Figure 3 shows the CO2 fixed by the pastes tested in the work of Galán [21] and the proportion fixed by other authors. In the study describedin [21], the reaction rate was measured and proved that after 2–3 years there wasnegligible new CO2 reaction in the carbonated zone.At this age, the amount of CO2 uptake has already reached a maximum and, as indicated in the figure, it may exist less hydrated pastes that may reach a high proportion of carbonation.
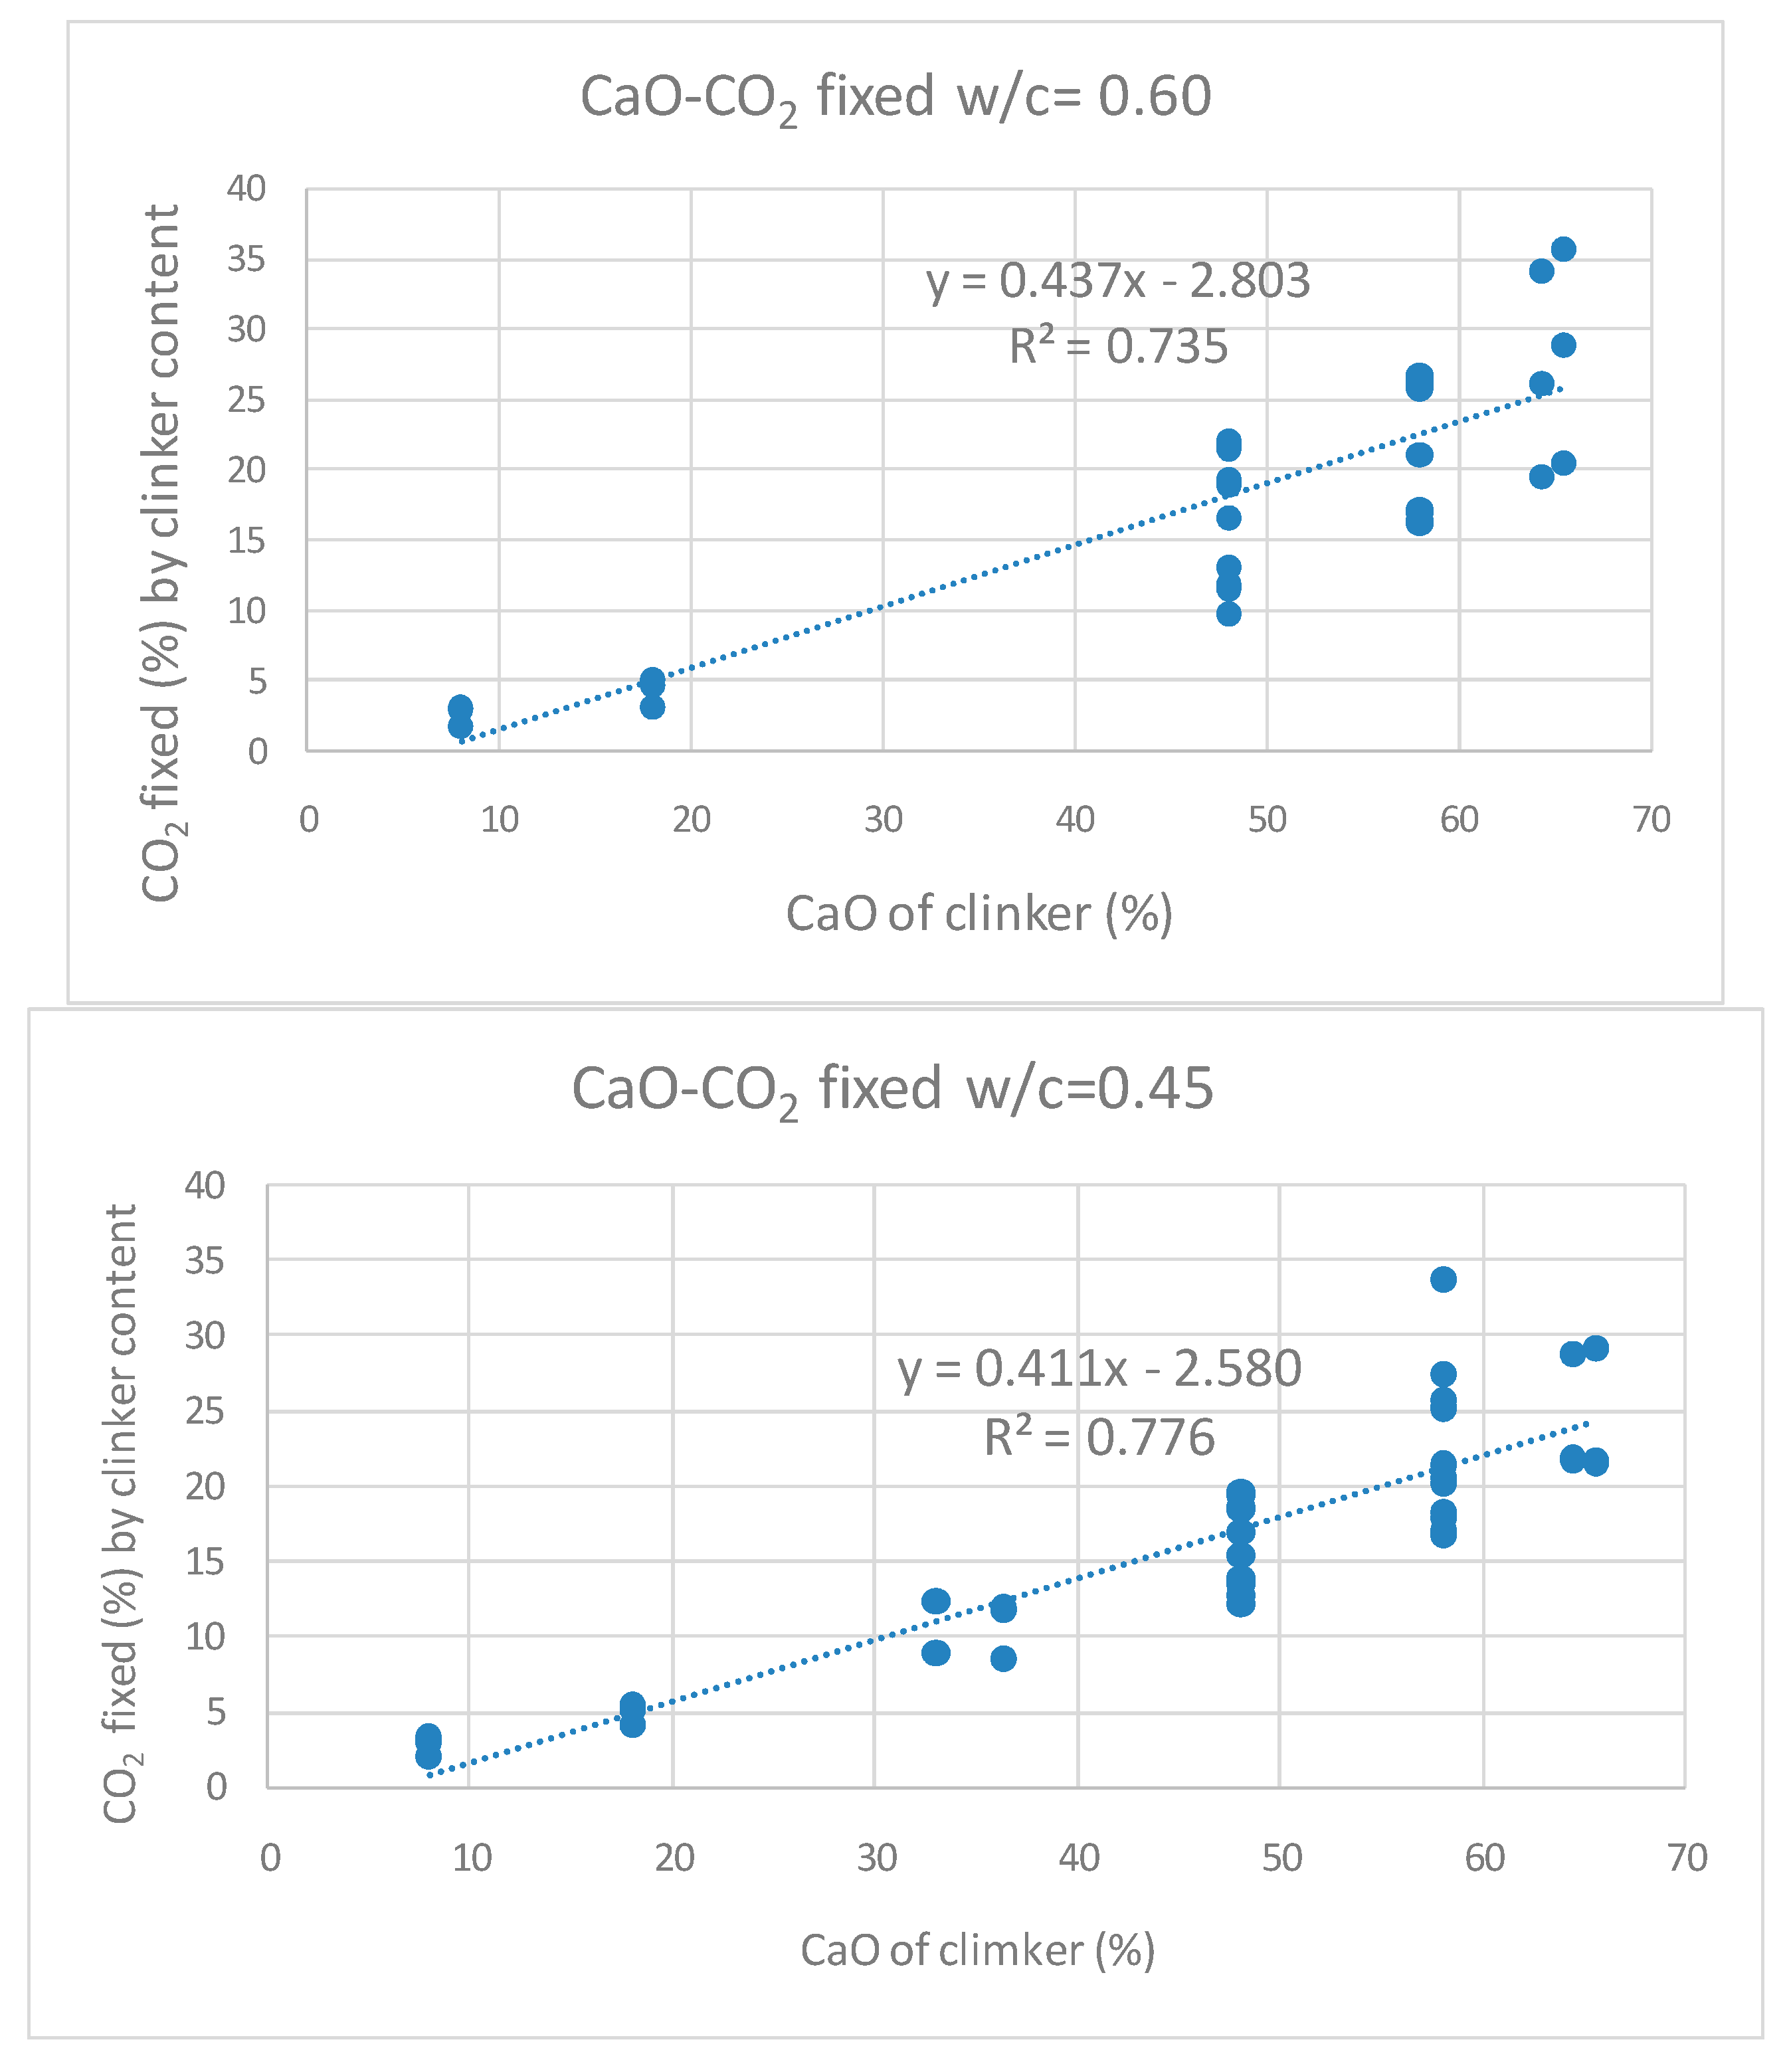
For the pastes tested, Figure 4 shows the relation between the CaO content of the cements and the CO2 fixed during the fouryears, referred to the proportion of clinker in the binder. The proportion was taken to be 0.975 of total because the CaSO42H2O content was assumed to be 2.5% in each cement. The figure shows that the amount of CO2 uptake is proportional to the CaO content providing in each cement family the values of CO2 fixed vary due to the different humidity in each exposure site. The pastes exposed to the higher humidity (unsheltered from rain) are those fixing higher amount of CO2.
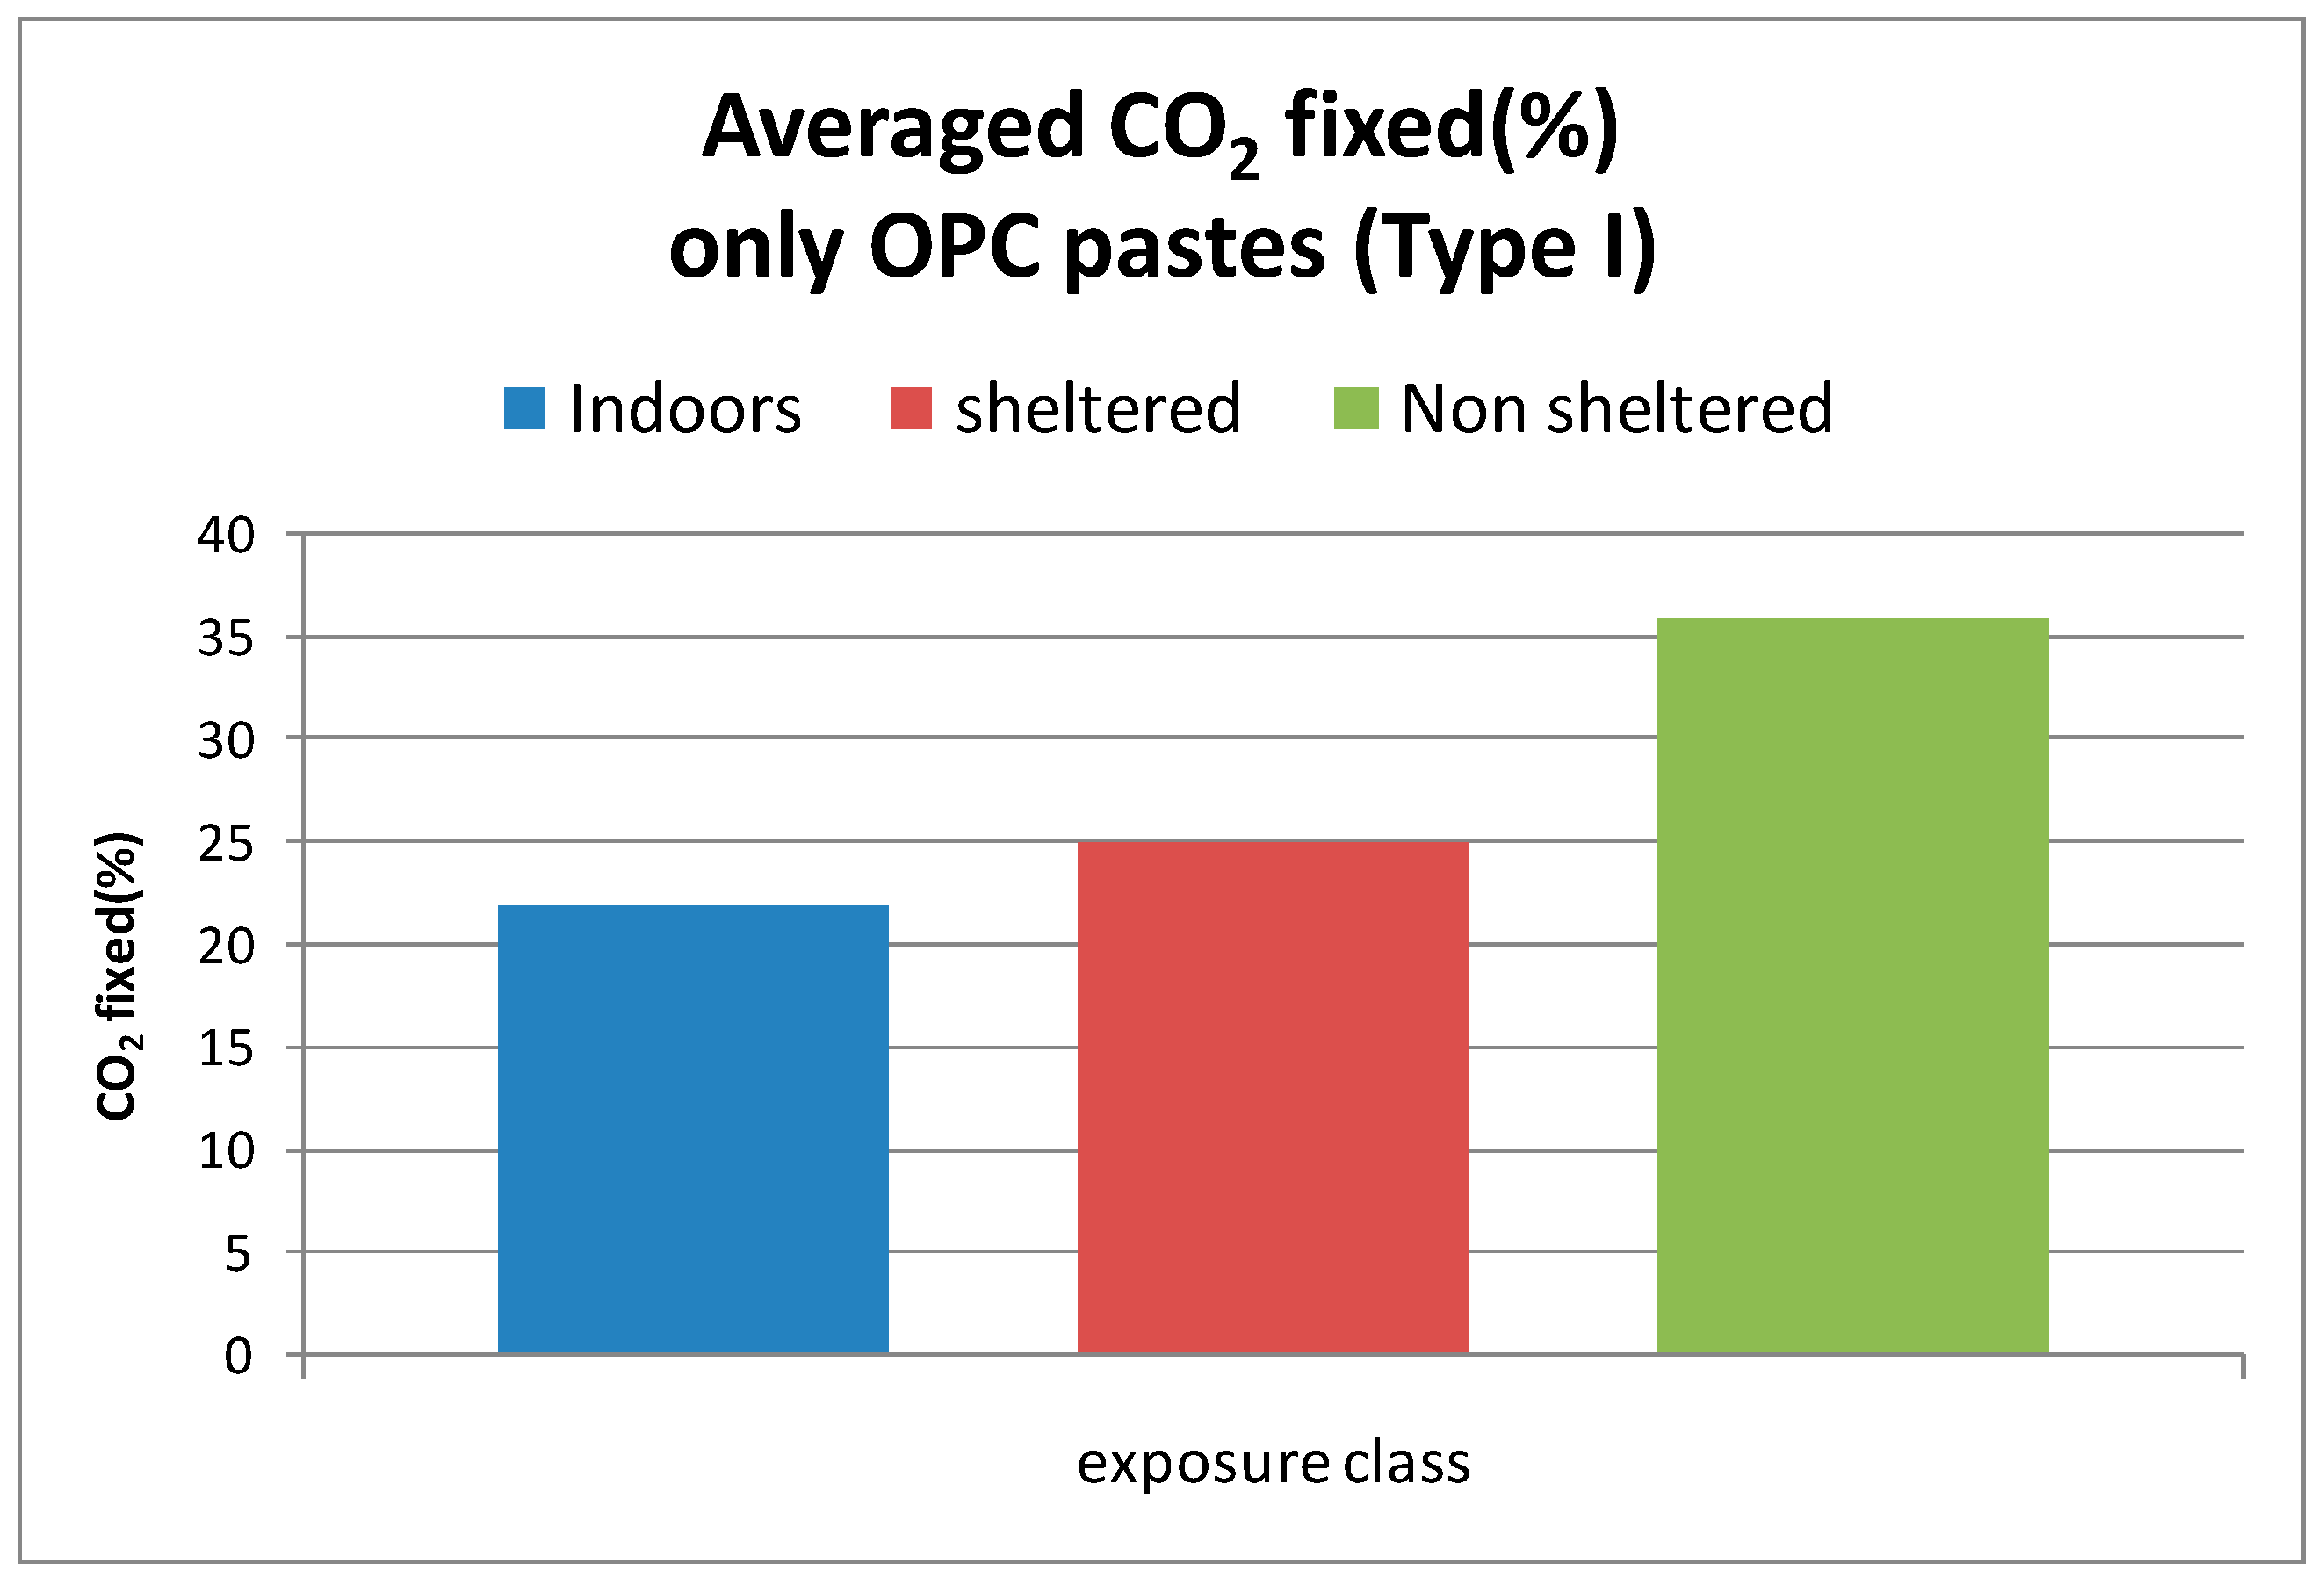
In Figure 5 is illustrated the effect of the humidity taking the pure Portland (type I cements [24]) as example. The uptake of CO2 is smaller in indoor conditions and increases as the average annual humidity content is higher. Thus, the highest CO2 uptake is found for the outdoor exposure unsheltered from rain. This ranking is systematically found for all pastes and concretes.
Regarding whether the CO2 uptake wasdifferent in pastes and concretes; Figure 6 shows the comparison. The relation wasbetter in the case of the w/c = 0.60, perhaps because the degree of hydration and the porosity is higher with the higher w/c ratio. With respect to the cement type, the higher values wereexhibited by type I pure Portland cements, while the minimum wascombined by the cements having slags in the smaller proportion. This was likely due to their clinker proportion in the binder was found to be very low (those cement types having a higher slag proportion are in the same range).
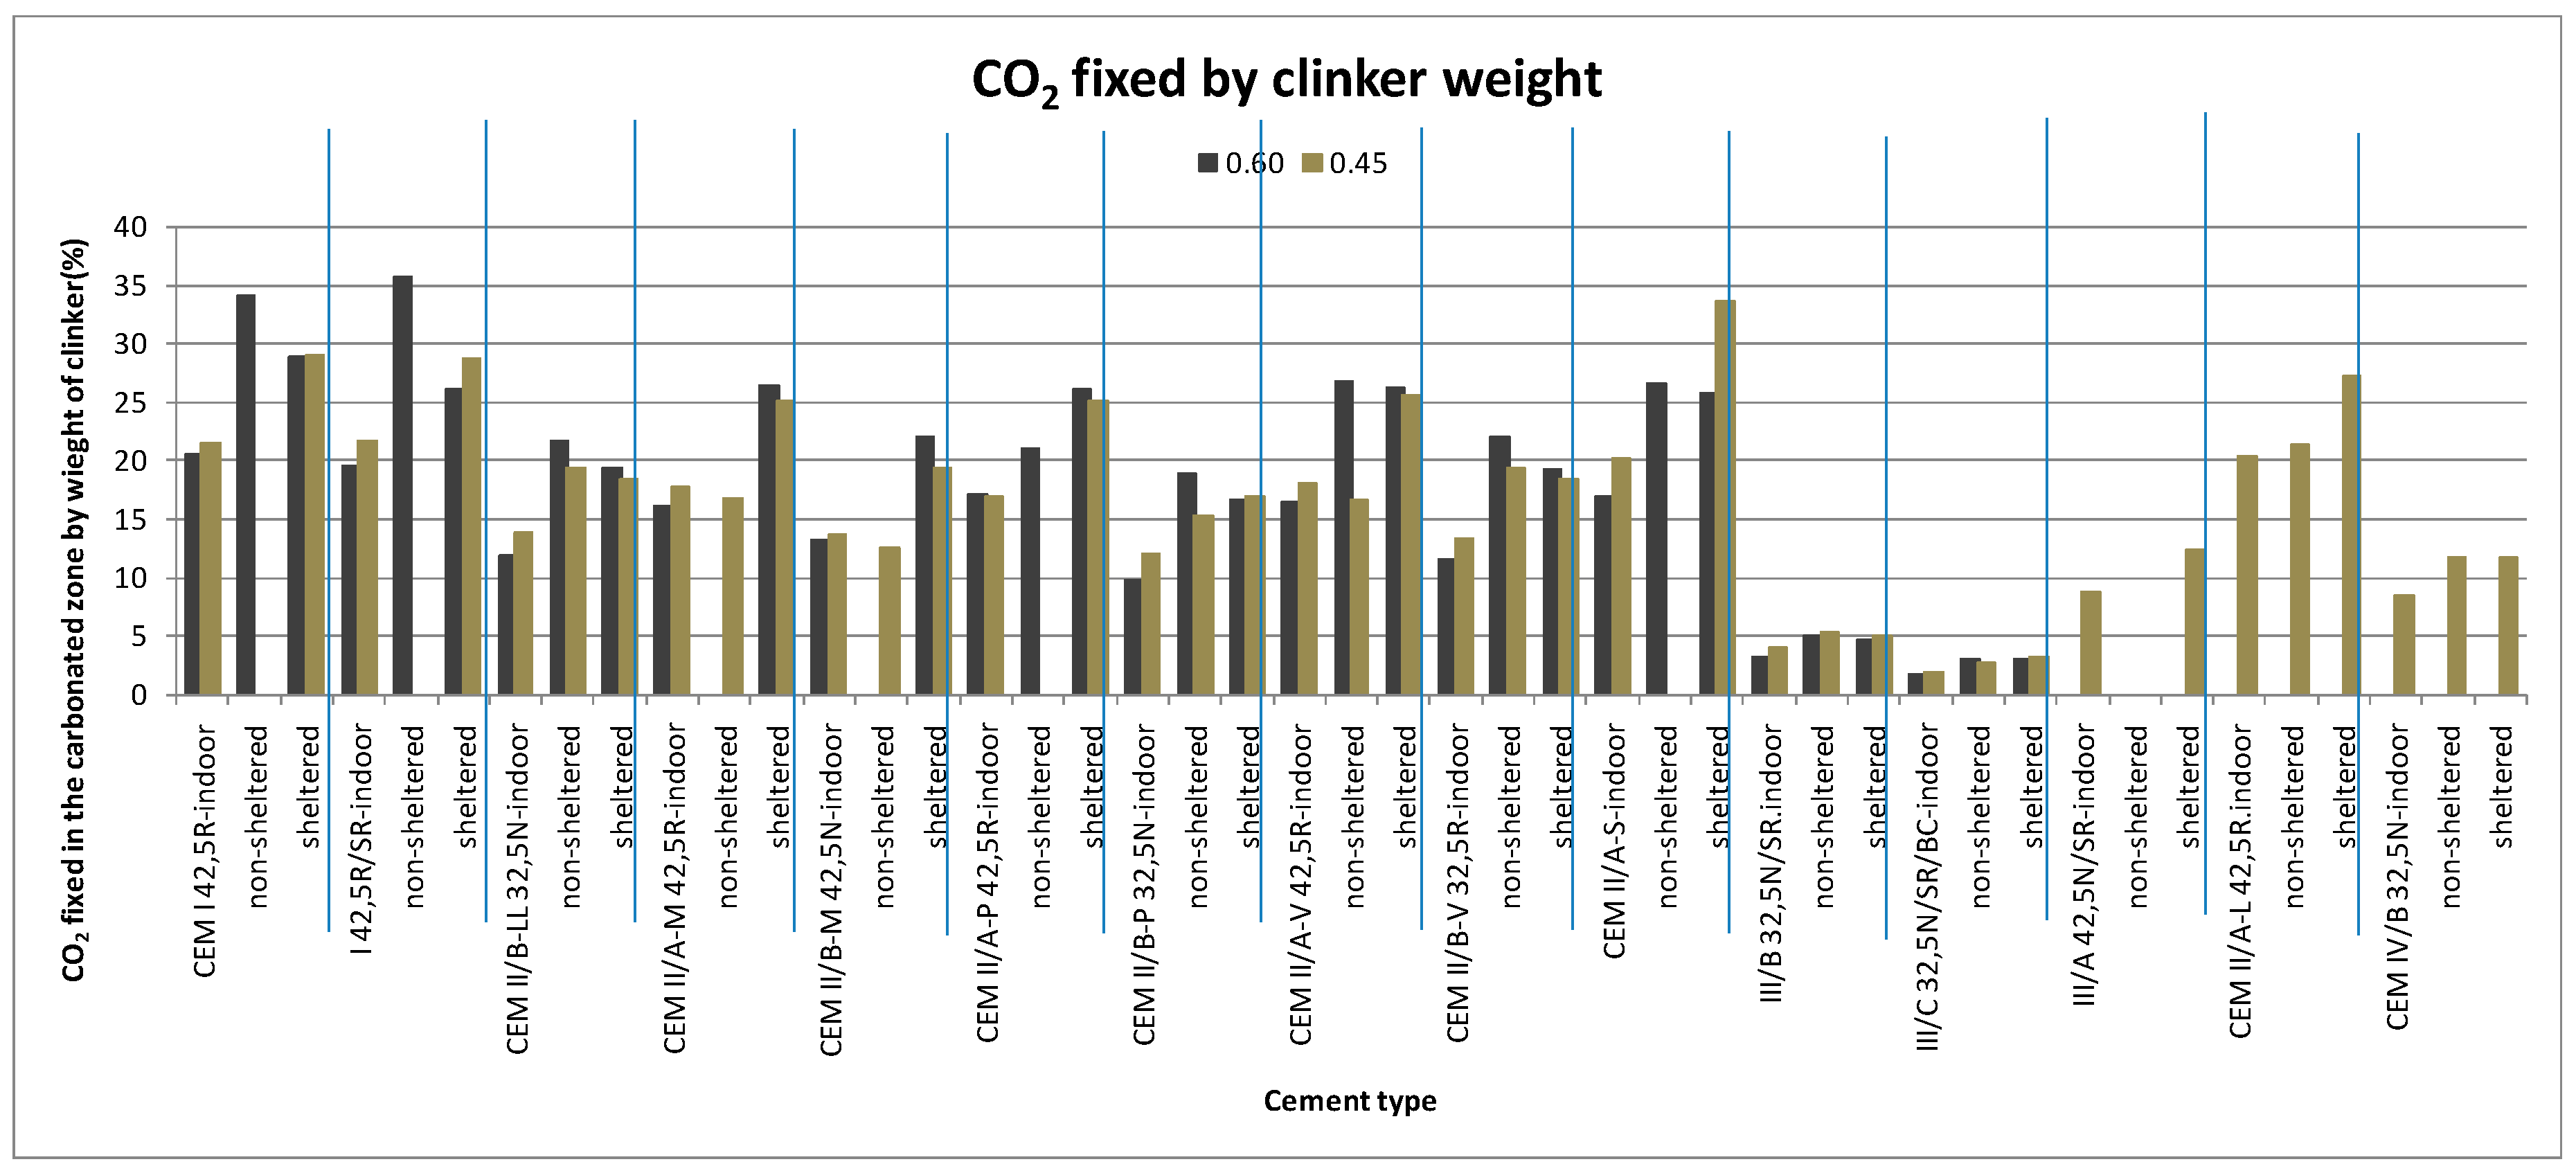
The DoC of all the pastes after fouryears of exposure are given in Figure 7. The DoC is higher than 100% in the case of cements CEM III/B and CEM III/Cbecause in these slag cements, the amount of clinker is only of 27% and 12%, respectively. The high values indicate that the added slag is also uptaking CO2. This result is in agreement with the higher carbonation depth found in slag cement-based materials [26]. The rest of cements present degrees of carbonation that are smaller than 100% including cements CEM III/A and CEM II/A-S that also have slag as mineral addition but in smaller proportions than CEM III/B and CEM III/C.
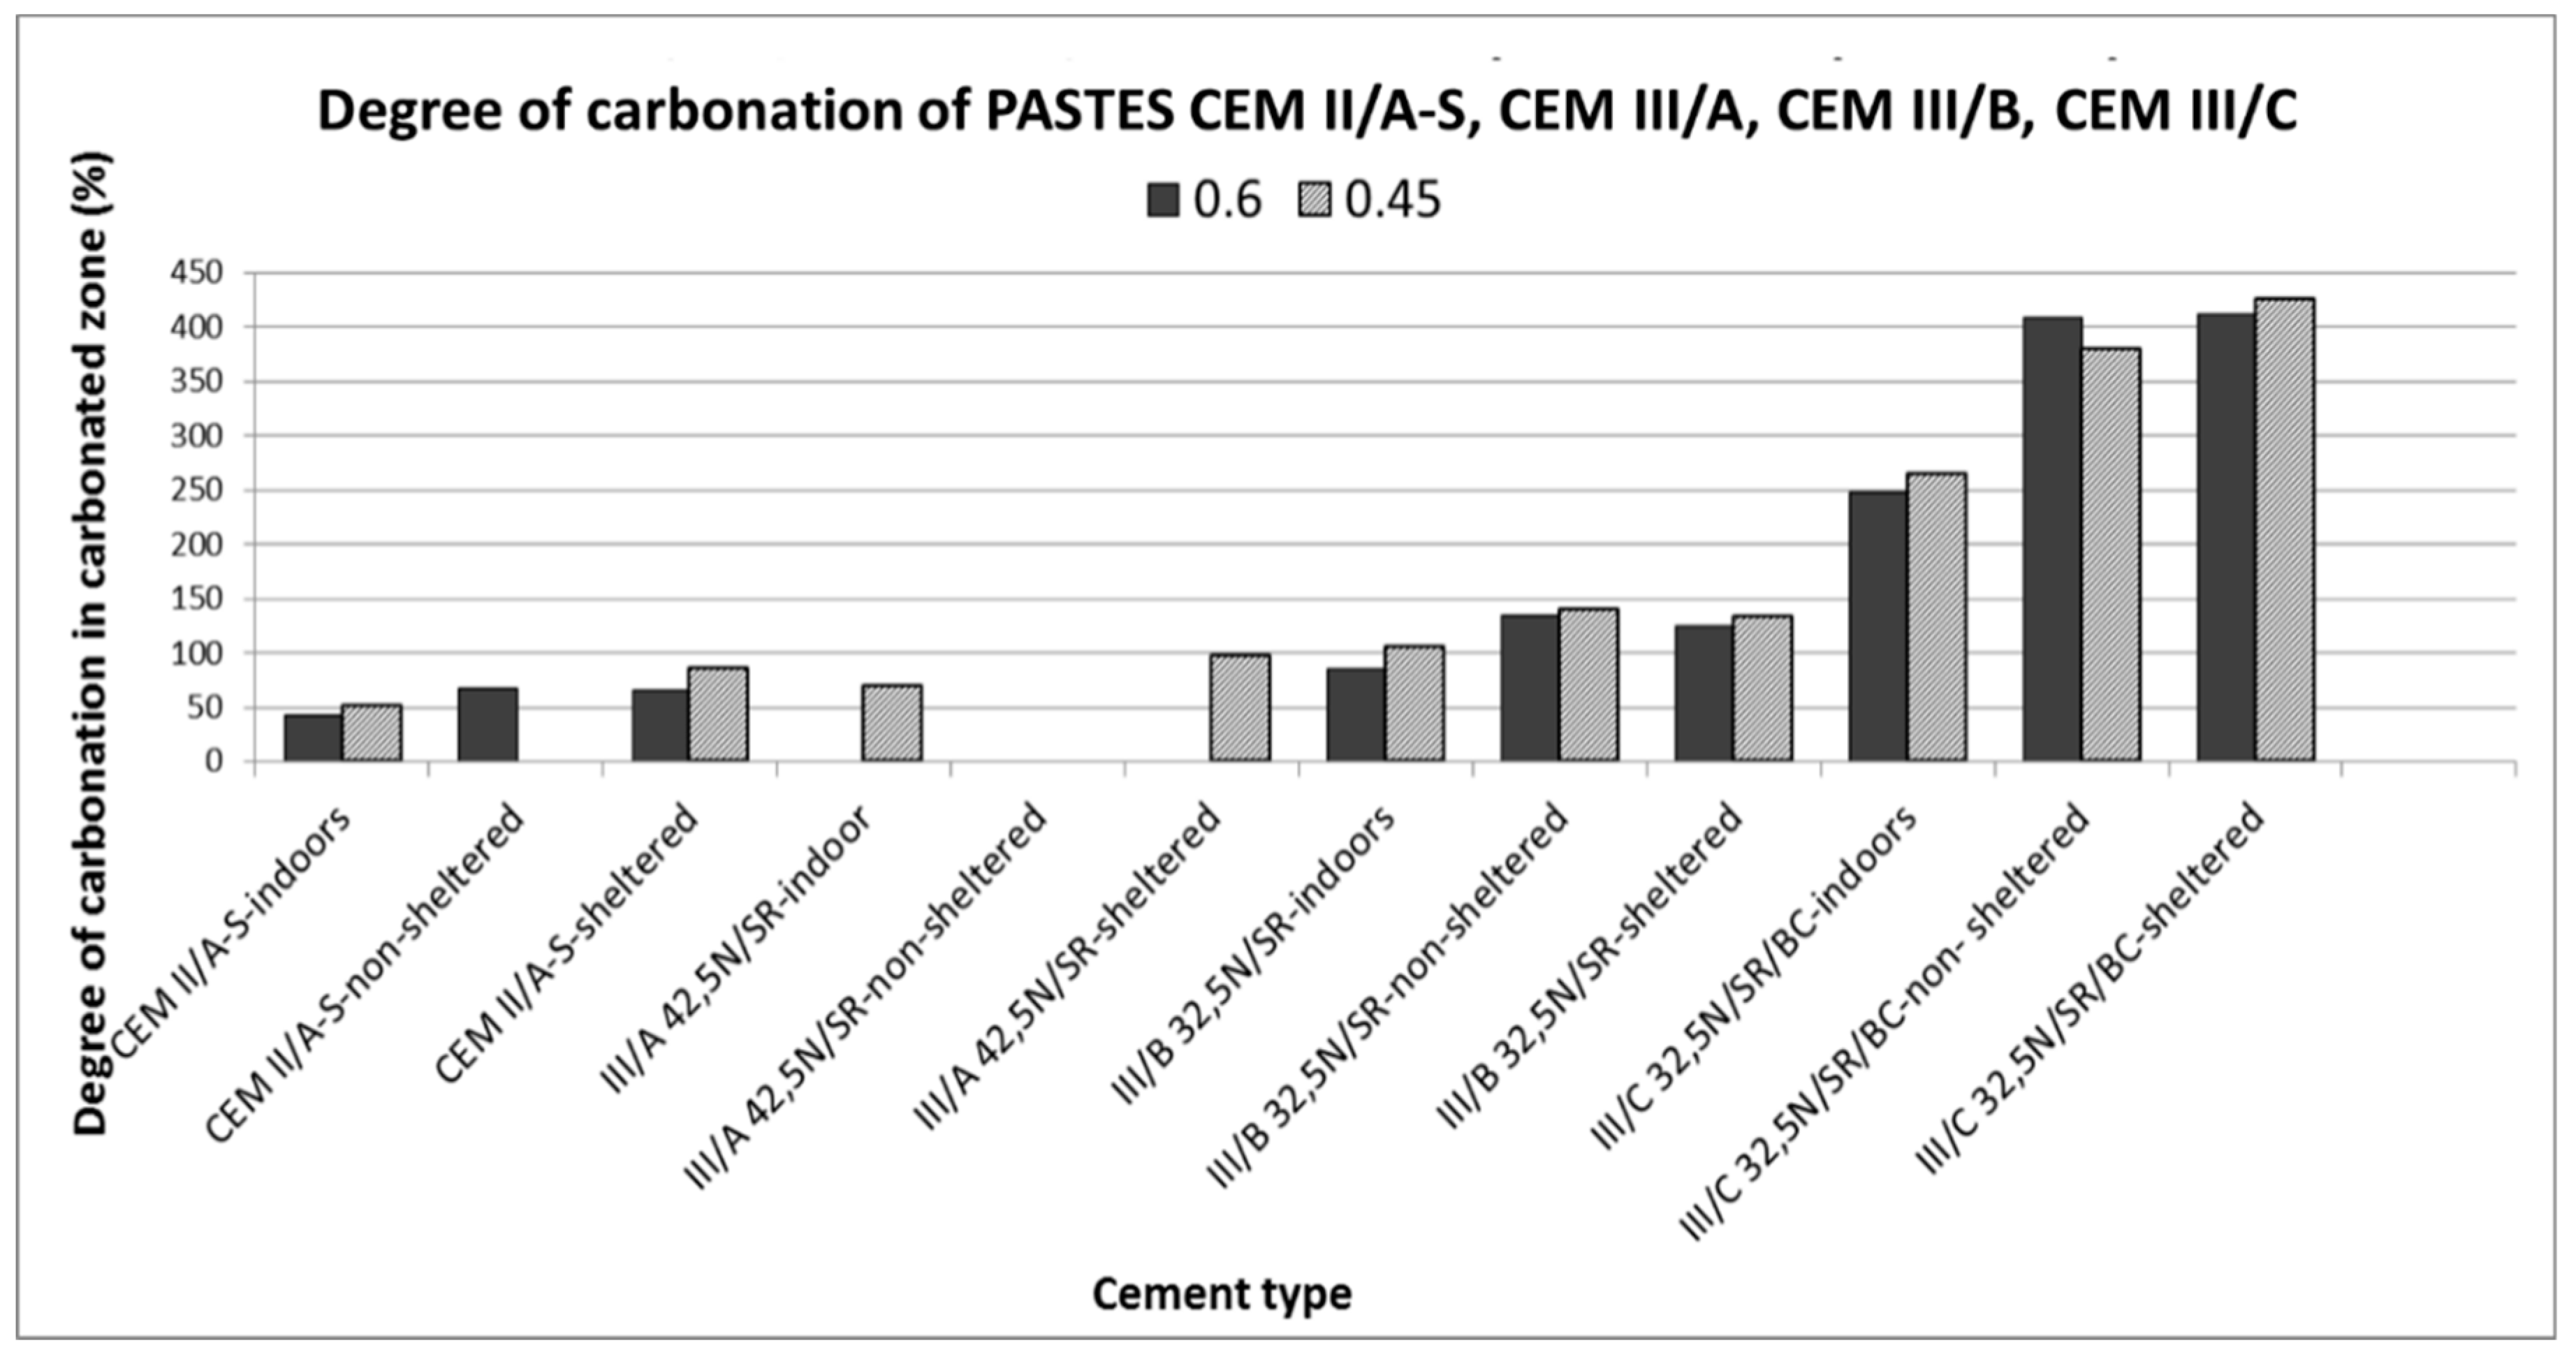
For the sake of a better appraisal, in Figure 8 are given the values of the DoC of Figure 6 but without the CEM III/A and CEM III/B cements. The DoC of these cements together with the CEN III/A and CEM II/A-S are given in Figure 9.
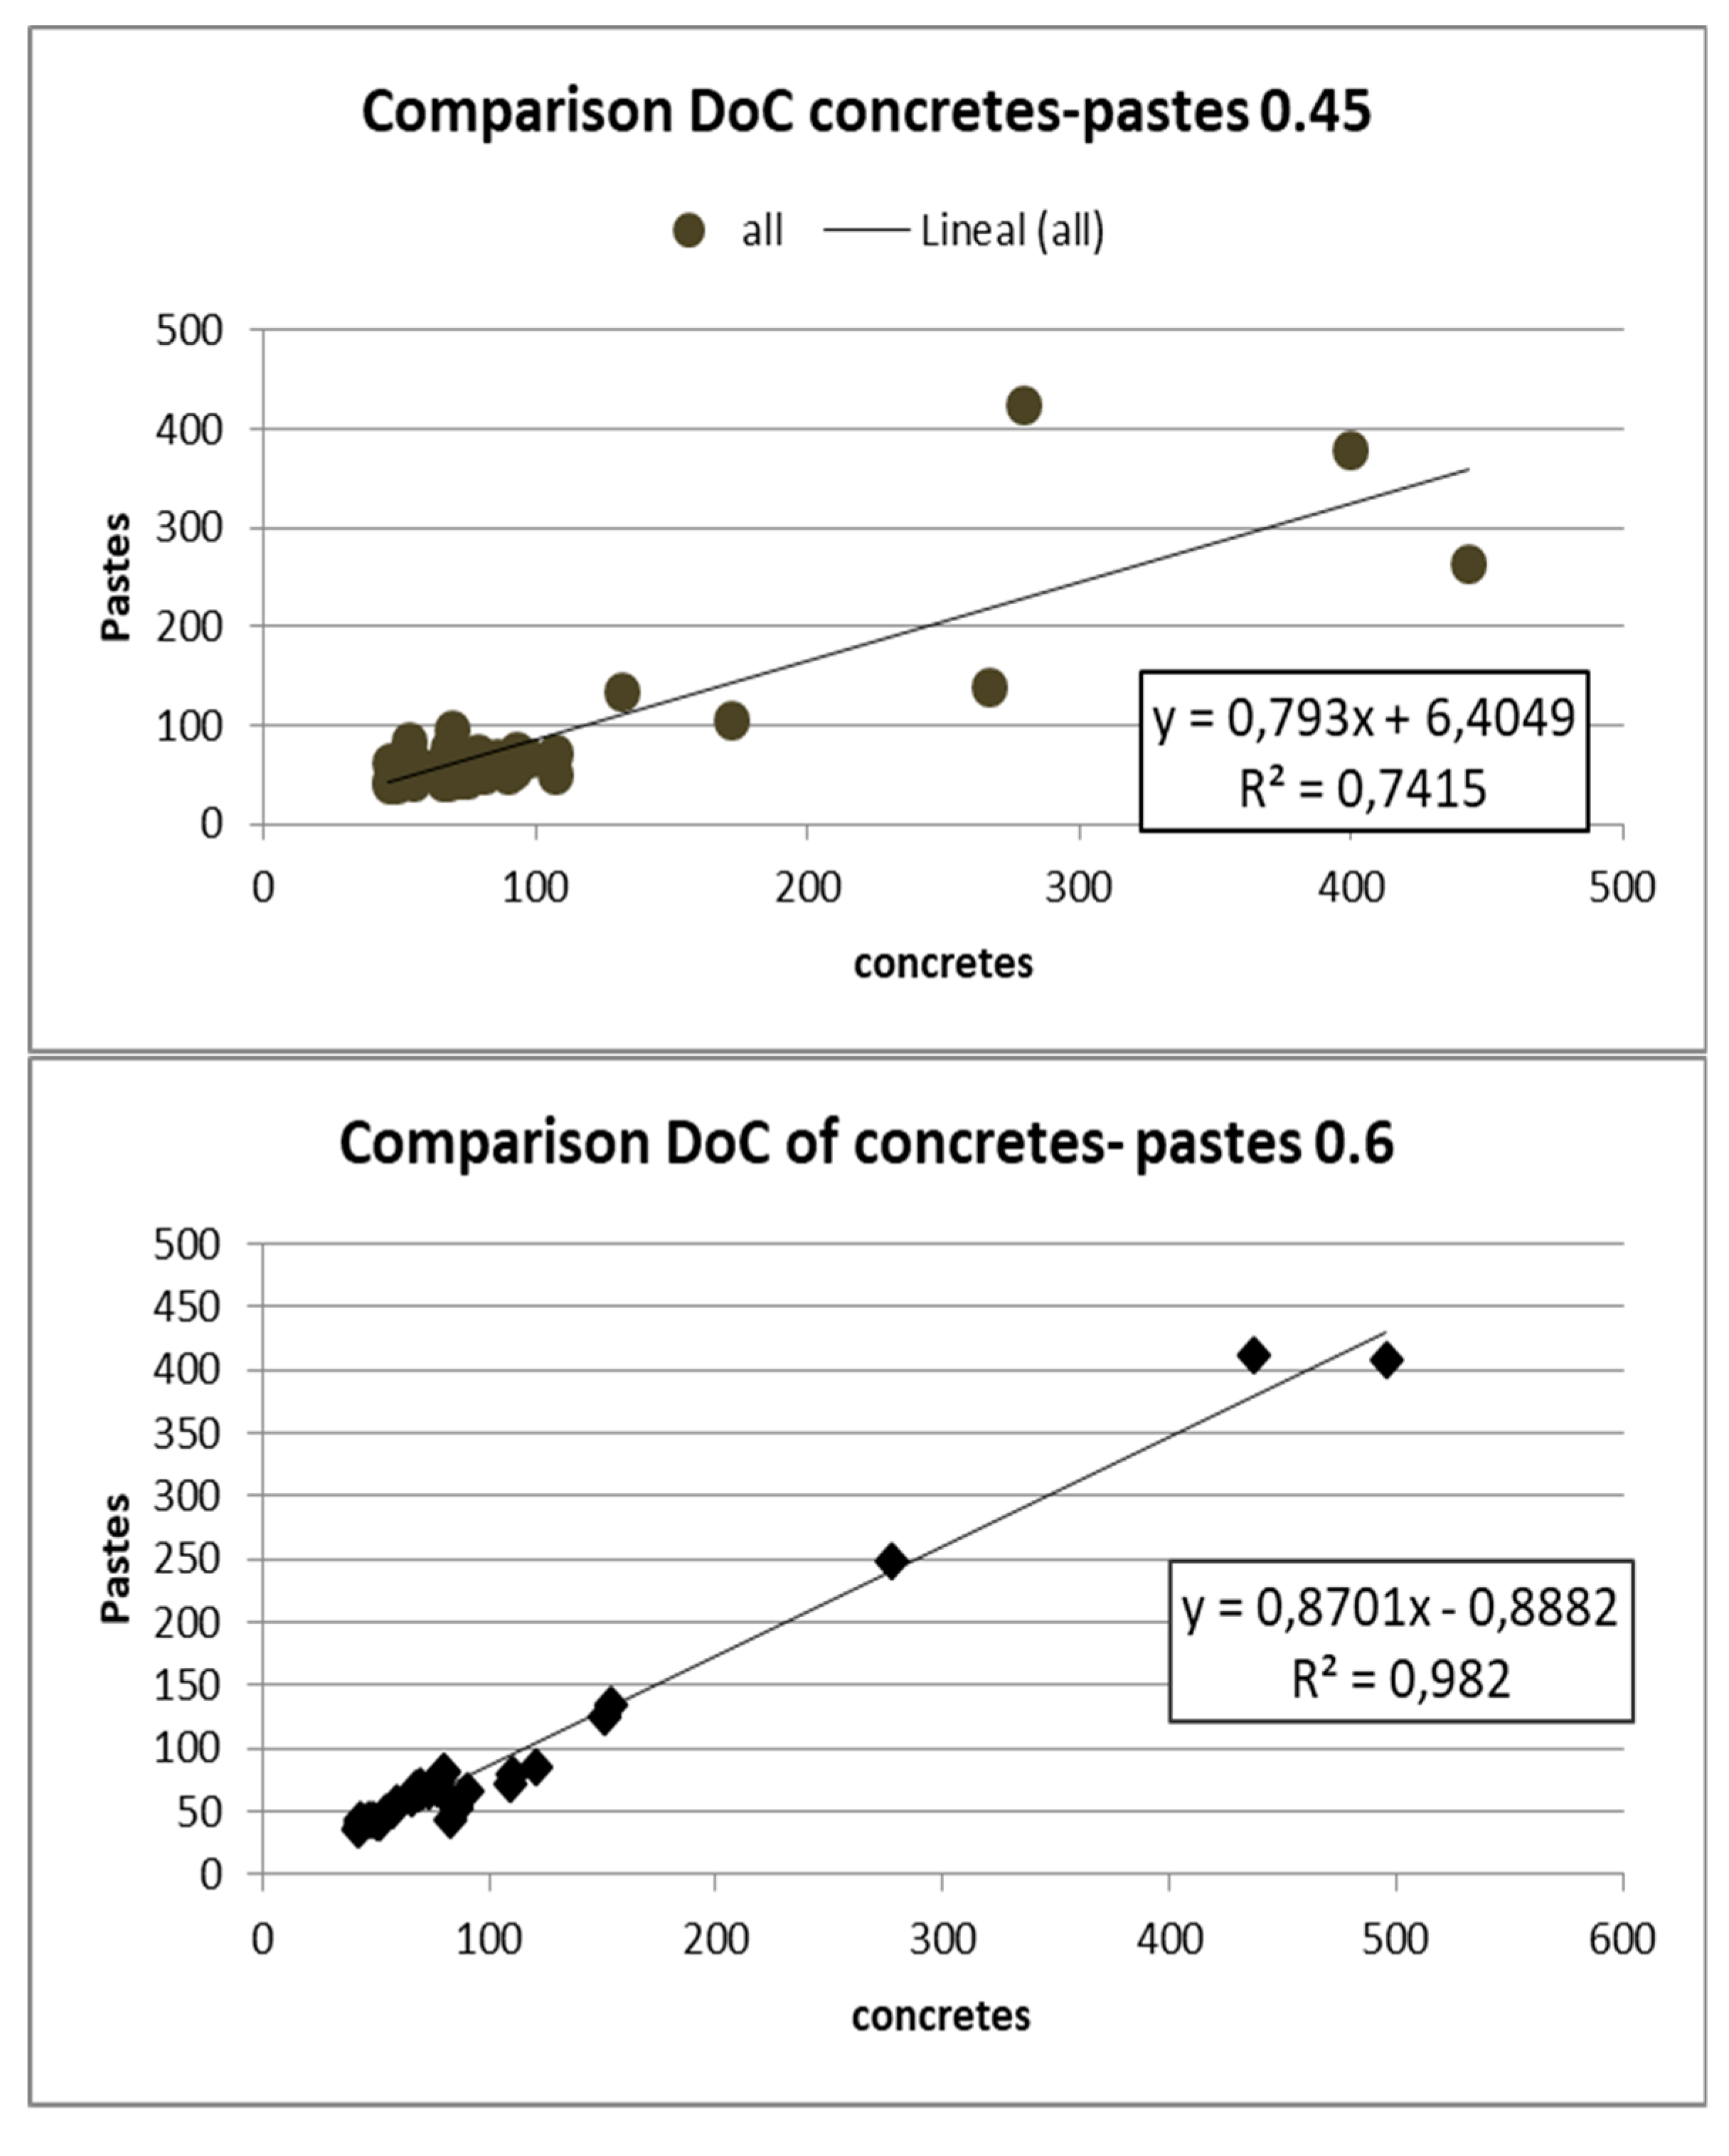
The values of DoC represented in Figure 7 are compared in Figure 10 with those obtained in concretes made with the same cements. Those on the left represent the pastes of w/c = 0.45 and on the right shows those with w/c = 0.60. The regression coefficient is above 0.7 for the pastes of w/c ratio of 0.45 which is high while for 0.60 pastes the regression coefficient is almost the unity. Both regressions improve if the values of CEM II/B-LL are removed (not represented). This cement contains limestone in higher quantity than the other cements and it has a DoC apparently higher than the corresponding by theCaO content of its clinker.
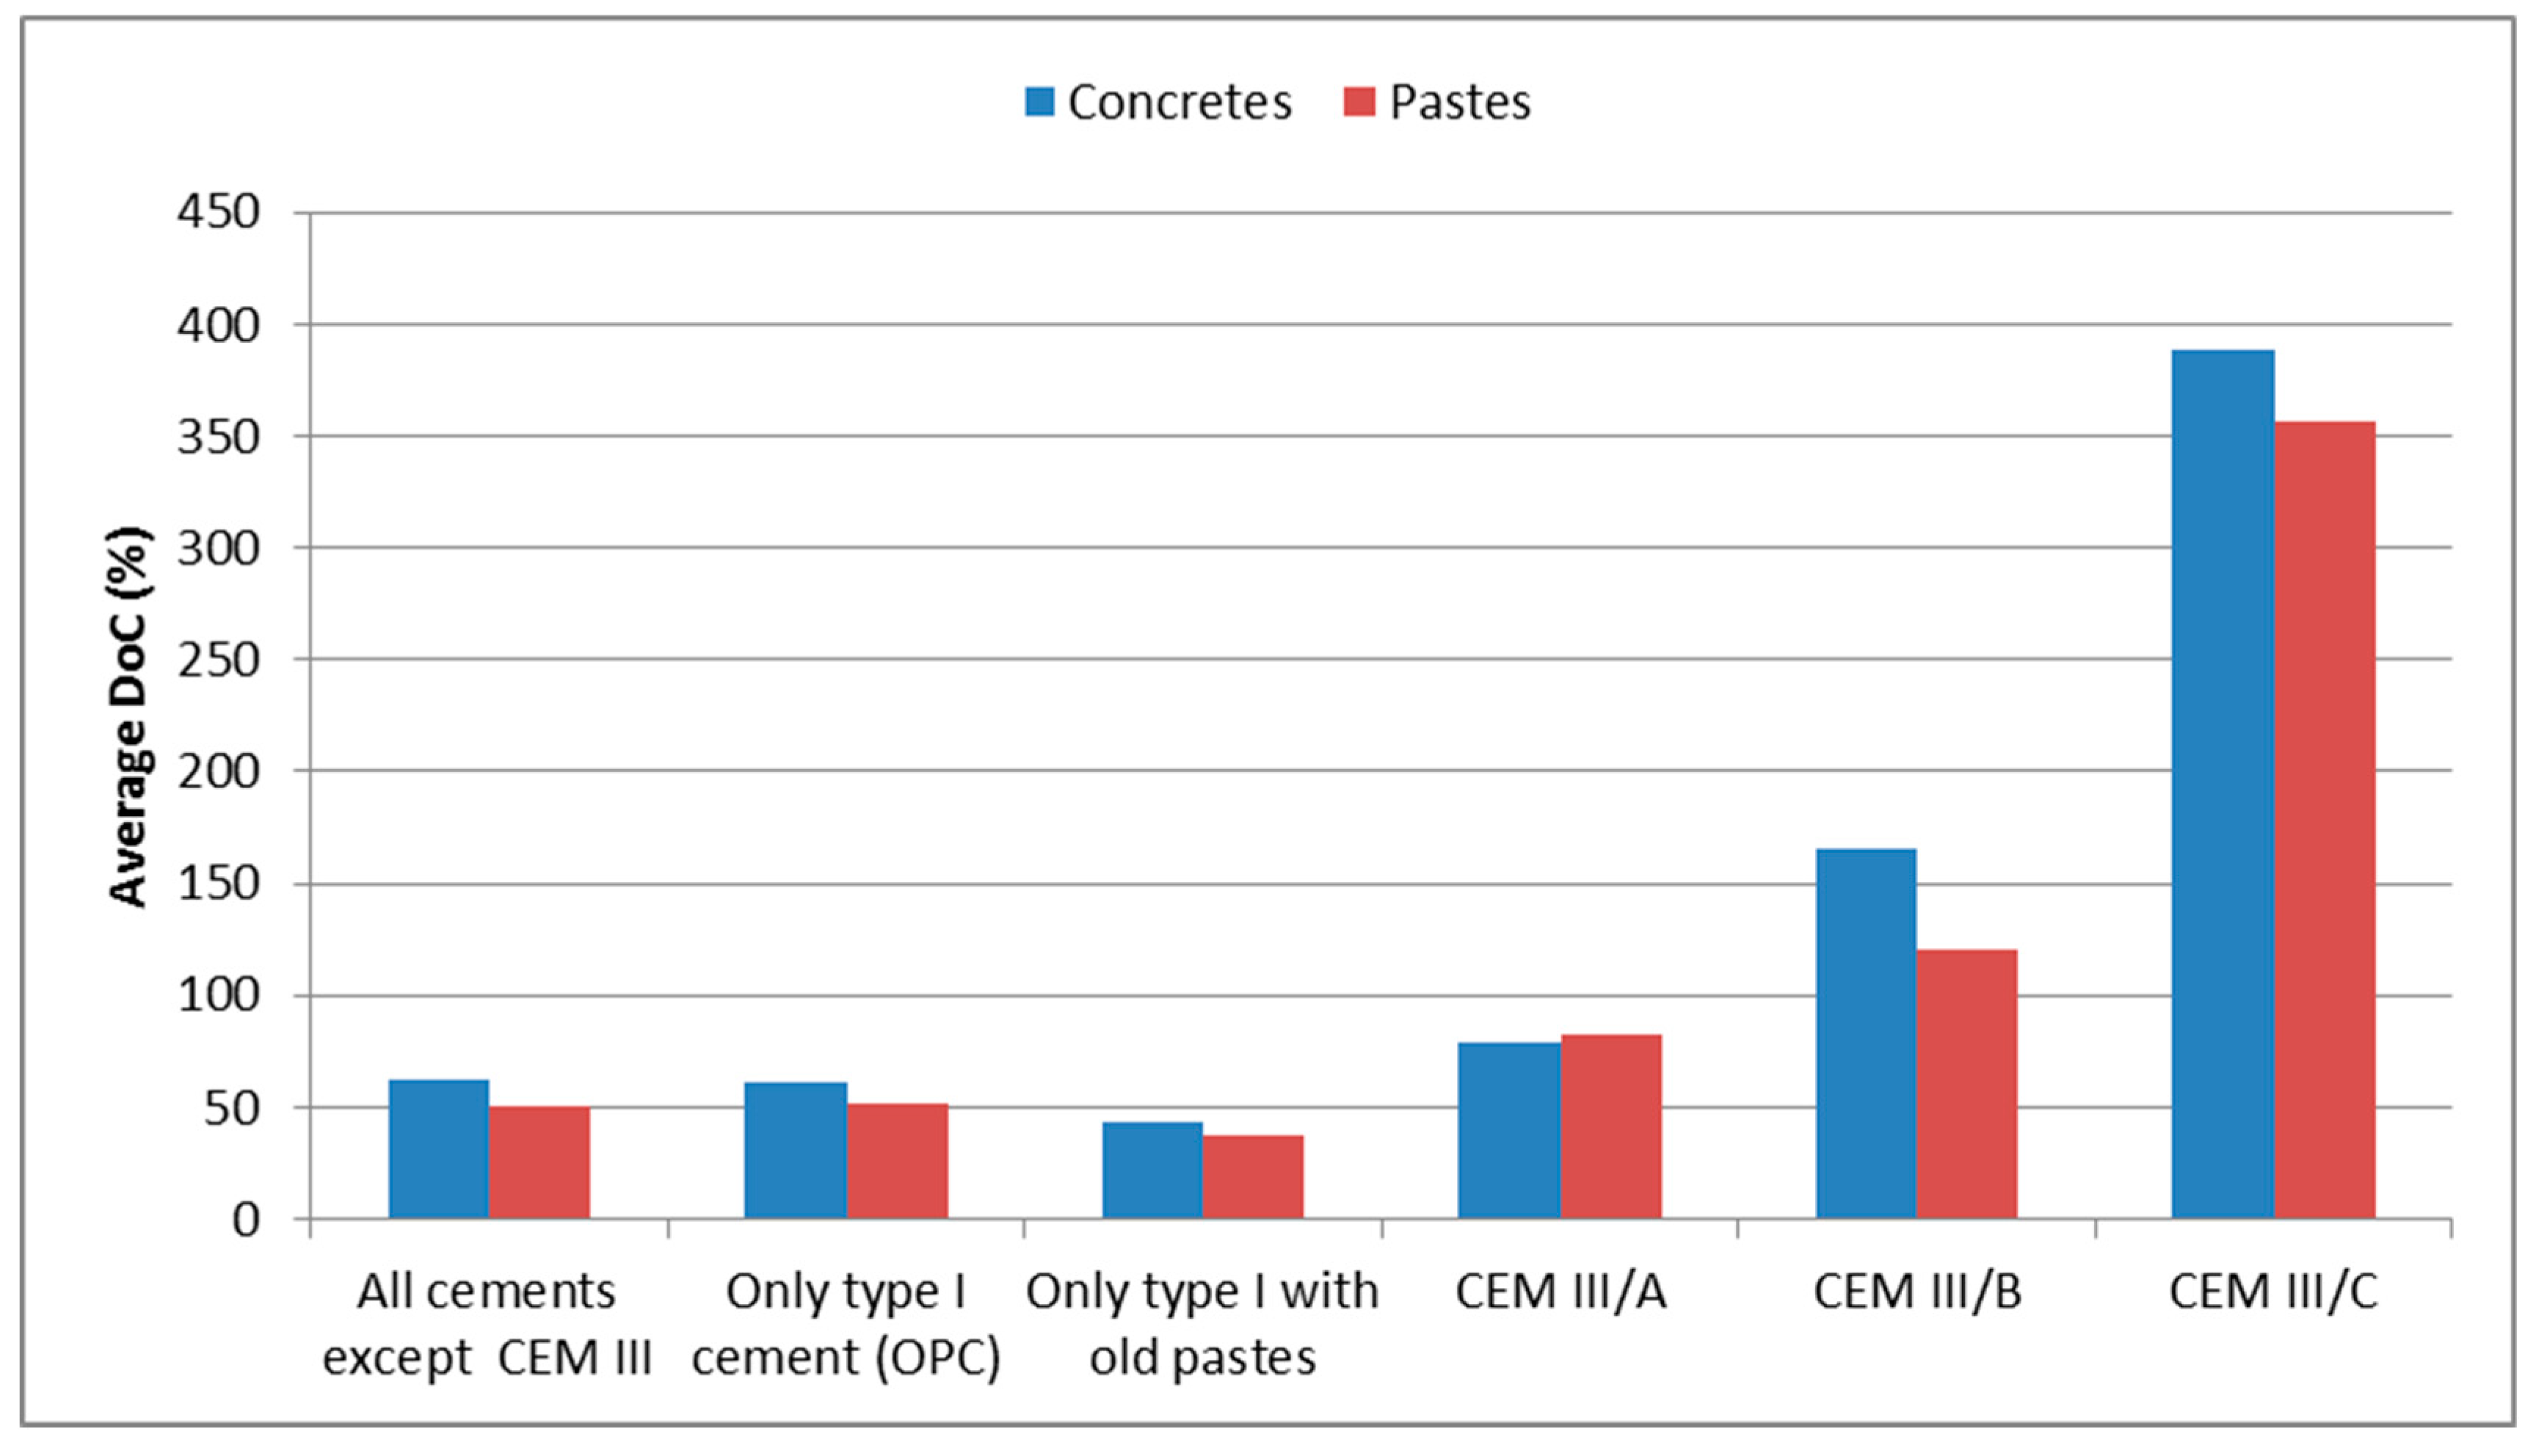
For the sake of having a representative general value of the DoC which could be applied as an average value, some values obtained from a statistical treatment are given in Table 3. For all cements except those containing slags (which, opposite other mineral additions can themselves bind CO2). Figure 11 shows theses values compared to those found for concretes. The average value of DoC of the pastes is 50.73%, a bit smaller than that found for the concretes which was of 62.5%. This discrepancy may be due to the large scatter found in general due to the different exposure sites and the different binders tested. This is reflected in the high coefficient of variation found which in the pastes was of 42.36% and in the concretes was of 38.25%.
4. Discussion
In this chapter, the previously found experimental values of the DoC will be used for an example of a calculation of the release of CO2 by a country (Spain) as afunction of its concrete yearly production. This example updates previous Spanish studies [22].
The wider study on the amount of CO2 that can be fixed by the cement-based materials during their service life is the so-named “global study” [20], because it involved not only a country or region, but because researchers of all continents were exchanging data and was made a calculation from 1913. As mentioned previously, this study can be improved by adding new data in several aspects, including having experimental values of the DoC, which were only assumed in the “global study”. In reference [20], the assumed value was that the DoC is 80%, which is reached by certain cement types, but not in all types.
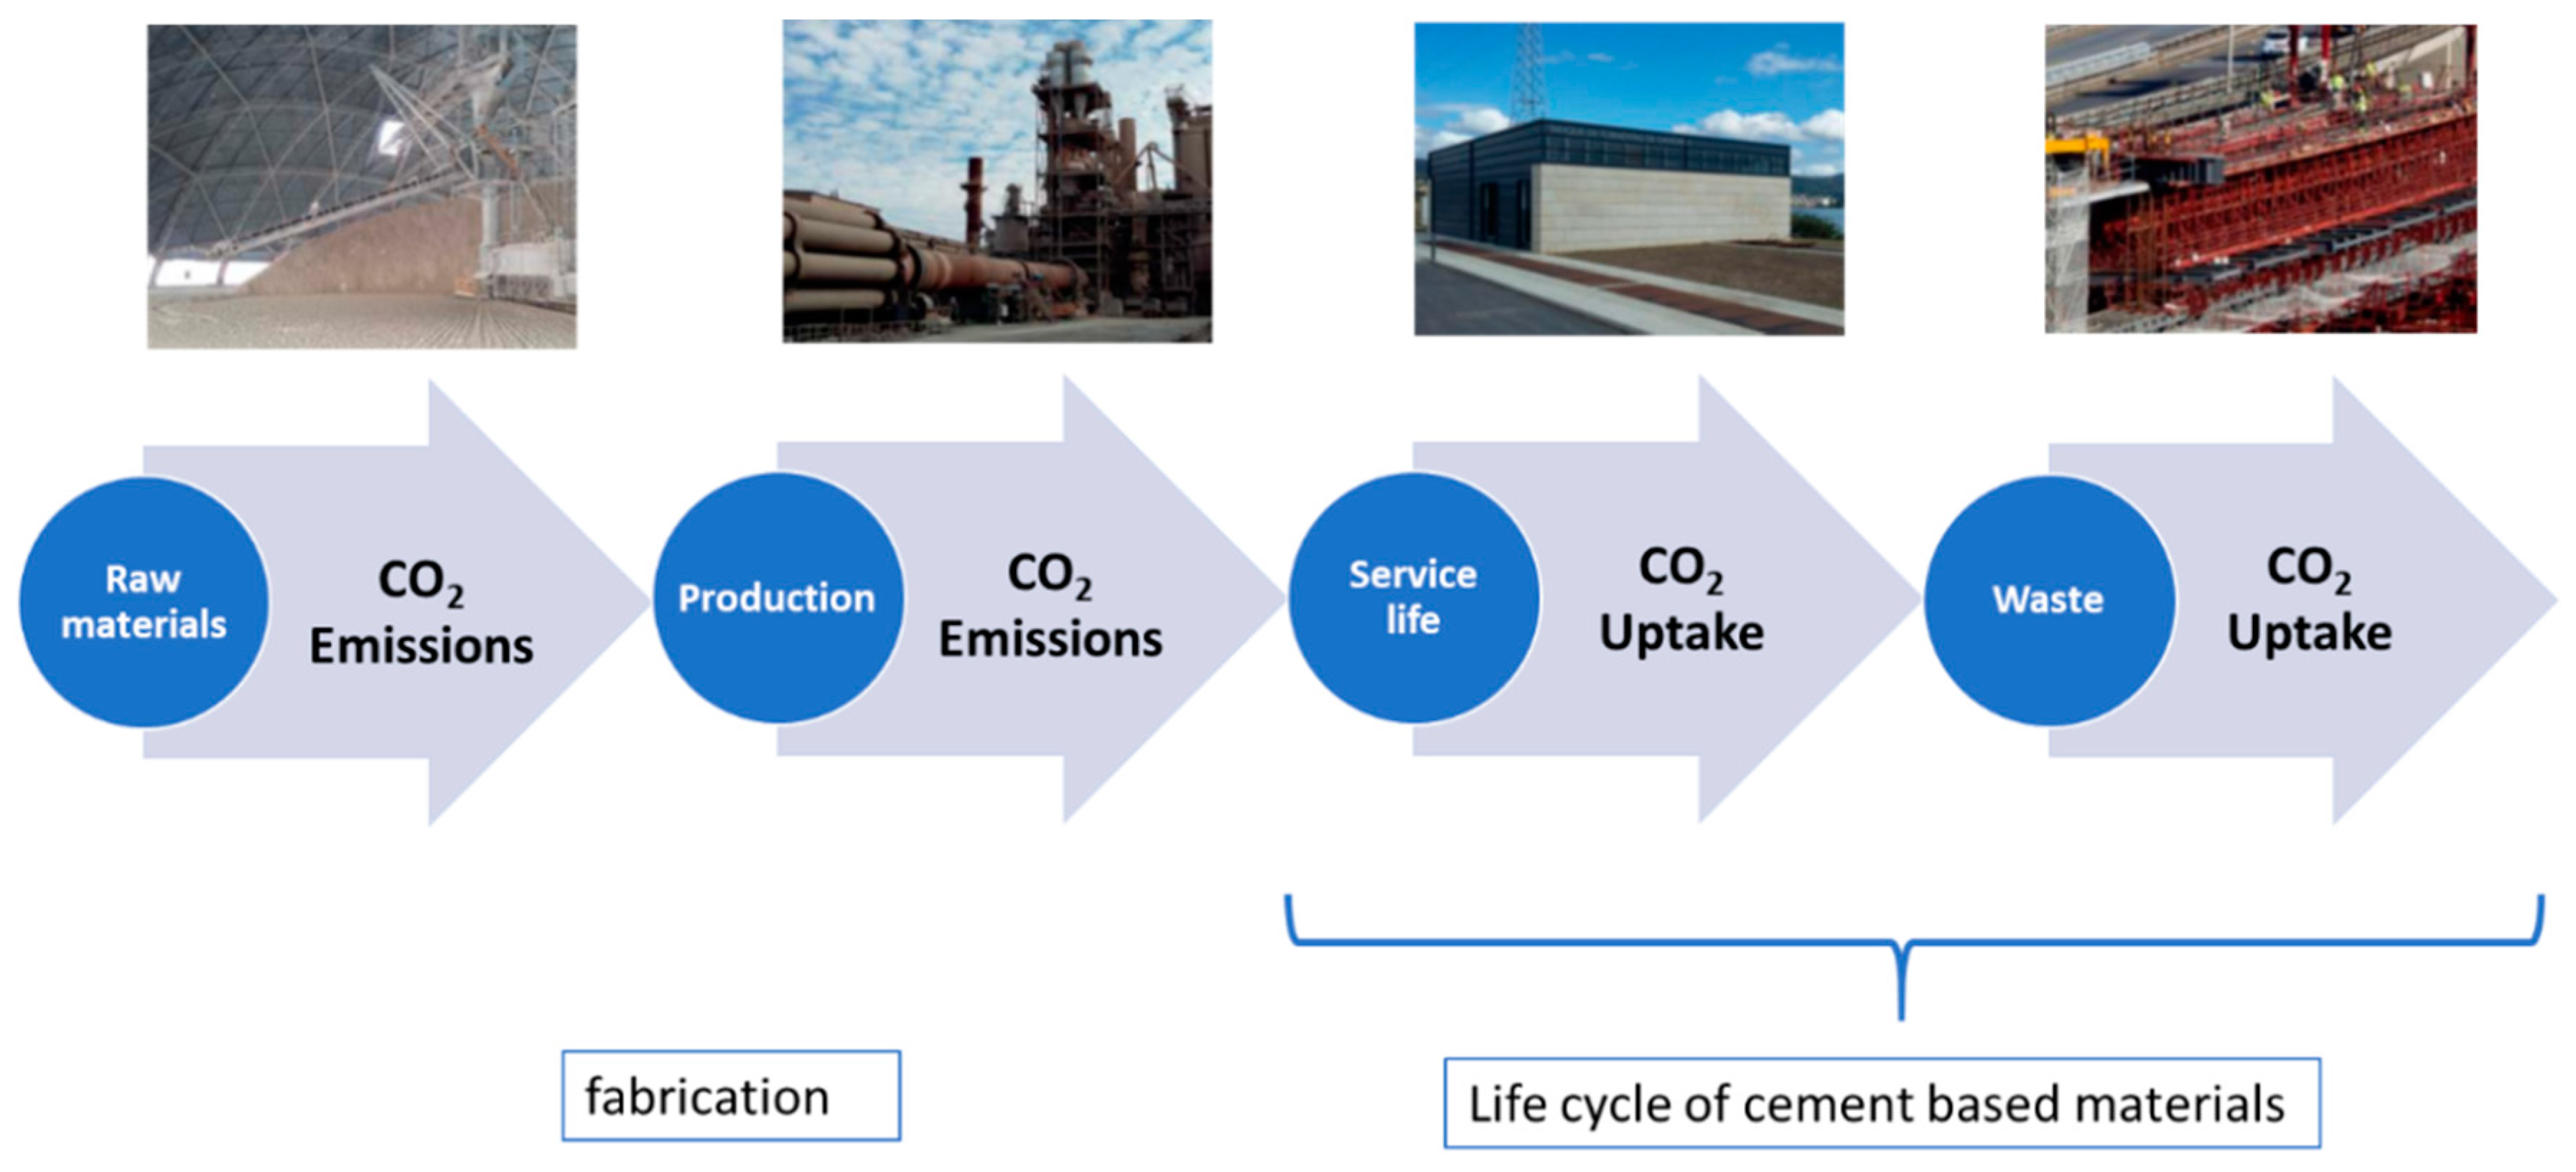
In the perspective of the greenhouse effect, the IPCC has accounted only for the emissions (see Figure 12) without considering the possibility of uptake of the released CO2. However, as known, a percentage of that emitted CO2 can be fixed again. That is, it seems logical to consider the whole life cycle of the material. In this respect, and focused to the environmental labelling of cement products, the European Standardization organization (CEN) has issued a standard [27] where each product and for a family of them provides a methodology of accounting for the CO2 uptake. In this methodology the key aspect is the relation between surface/volume of the element in consideration. As larger the surface is with respect to its volume, more CO2 would uptake the element.
For the sake of showing an example and based on the data presented next, we are going to recalculate the CO2 storage capacity (CSC) in Spain because the previous publication [22] was made using data of only one year of carbonation with DoC’s between 15 and 20%, These values are smaller than those resulting after the almost fouryears of exposure. For this recalculation we will use the methodology of the mentioned CEN standard [27] although adapted to the case of the whole inventory/asset of elements of a country and not of a particular element of family.
The steps for the calculation of the CO2 storage capacity in a country are:
- Calculation or assumption of an average value of the DoC of the types of cements produced in the country,
- Calculation of the CO2 combined by weight of cement (proportion of clinker in the cement) of each cement type in its proportion used in the further products,
- For the concretes, multiplication of the CO2 combined by weight of cement by the amount of cement/m3 concrete,
- Calculation or assumption of the rate of carbonation in the different exposures (calculation of the proportion of structures exposed indoor or outdoor),
- From the average rate of carbonation, calculation of the “equivalentcarbonatedlayer” that will be carbonated in the concrete elements and mortars, and calculate the amount of recycled aggregates:
- In contrast to studies in other countries, due to the lack of accurate values of recycled concrete percentage, this period is not going to be considered in present calculations.
- If the country has these statistics of recycled concrete and other uses, their life phase for further depth of carbonation should be added.
- Regarding the calculation of the carbonation of the current year, an addition has to be made on the proportion of CO2 that is combined from structures made the previous years (building asset, Casset),
- Calculate in the same manner that made for normal building or public structures, the secondary uses of cement, that is, inventory of cement for mortars () and the proportion used as recycled concrete () and other uses () at present and historically back:
In order to apply Equation (9) in a reliable manner, it is convenient to know the real or experimental degree of carbonation (DoC), because, depending on the cement type and environmental conditions, such DoC will vary as was shown in Figure 7 and Figure 8.
A calculation example of this methodology is presented next, taking the production of concrete in Spain of 2016 of 16.4 million of m3 of concrete. Assuming 325 kg cement/m3 of concrete, a DoC = 0.625 (found in the concretes), a ratio “surface/volume” of 3, a carbonation rate of 3 mm/√year, 100 years of service life and 0.95% of clinker/binder, from Equation (9) it would result:
The emissions produced by those m3 of concrete was:
Then, the CO2 storage capacity of Spain would have been, at least (considering that all the cement produced was CEM I), of:
However, the updating of the values published in [22] give a higher value than this 5.92% taken as example of 2016 production, because the consideration of a larger production of several years andthe life cycle of 50 years for buildings and 100 years for public infrastructures. Thus, the values of DoC considered initially in Spain in the mentioned studies [22] were of 15% and 20%, and the relation of surface to volume in concrete elements of around 3. This resulted in values of the CSC of 2.3–3.6% for concrete for buildings and of 1.8–3.2% for concrete for public works. Now, considering the averaged DoC value found in the concretes of 62.5% (around threetimes higher than that at 1 year) for being more realistic than in the pastes. Multiplying it by the surface/volume ratio of 3 (3.6 × 3) for the concrete for buildings and by 3.5 times (3.2 × 3.5) for concrete for civil works, the new values of the Spanish uptake of CO2 (carbon storage capacity) then comprise 10.8–11.2% of the calcination emissions. Some other studies [28], consider different surface/volume (S/V) ratios than 3, therefore, higher percentages could be expected.
5. Conclusions
The conclusions that can be deduced from present results are:
- The cements bind CO2 in direct proportion to their CaO content, being the humidity in the pores a controlling factor of the amount of uptake.
- The highest CO2 uptake happens in the unsheltered from rain condition while the smallest in indoor conditions.
- The CO2 uptake seems complete at 2–3 years of exposure.
- Small paste specimens uptake a slightly less amount of CO2 than the concrete cylinders of 75 × 150 mm. The w/c ratio of 0.6 has a very high regression coefficient between pastes and concretes while the w/c ratio of 0.45 with more dense concrete, exhibits a higher scatter in the relation.
- The carbon storage capacity of Spain with the inventory of structures published in (22) and an averaged surface/volume ratio of 3 is updated to 10.8–11.2% of the calcination emissions. Higher surface/volume ratios as considered by other countries (which consider until a value of 8) will increase this proportion accordingly.
Author Contributions
Conceptualization, C.A. and M.Á.S.; Methodology, C.A.; Software, C.A. and M.Á.S.; Validation, C.A. and M.Á.S.; Formal Analysis, C.A.; Investigation, C.A.; Resources, C.A.; Data Curation, C.A.; Writing-Original Draft Preparation, C.A. Writing-Review & Editing, C.A. and M.Á.S.; Visualization, C.A. and M.Á.S.; Supervision, C.A.; Project Administration, C.A.; Funding Acquisition, C.A.
Funding
This research was funded by the Ministry of Science of Spain and by Oficemen.
Acknowledgments
The authors acknowledge the funds provided by the Ministry of Science of Spain and by Oficemen. They also are grateful to the Institute of Construction Sciences of the CSIC-Spain where the research was developed and, particularly, to Isabel Galán and the people involved in carrying out the experimental tests.
Conflicts of Interest
The authors declare no conflicts of interest.
References
- IPCC; Eggleston, S.; Buendia, L.; Miwa, K.; Ngara, T.; Tanabe, K. IPCC Guidelines for National Greenhouse Gas Inventories; Institute for Global Environmental Strategies: Kanagawa, Japan, 2006. [Google Scholar]
- Verbeck, G.J. Carbonation of Hydrated Portland Cement; ASTM STP 205; ASTM International: West Conshohocken, PA, USA, 1958; pp. 17–36. [Google Scholar]
- González, J.A.; Andrade, C. Effect of carbonation, Chlorides and Relative Ambient Humidity on the Corrosion of Galvanized Rebars Embedded in Concrete. Br. Corros. J. 1982, 17, 21–28. [Google Scholar] [CrossRef]
- Houst, Y.F.; Wittmann, F.H. Influence of Porosity and Water Content on the Diffusivity of CO2 and O2 through Hydrated Cement Paste. Cem. Concr. Res. 1994, 24, 1165–1176. [Google Scholar] [CrossRef]
- Parrott, L.J. Carbonation, moisture and empty pores. Adv. Cem. Res. 1991, 4, 111–118. [Google Scholar] [CrossRef]
- Goñi, S.; Gaztañaga, M.; Guerrero, A. Role of cement type on carbonation attack. J. Mater. Res. 2002, 17, 1834–1842. [Google Scholar] [CrossRef]
- Morandeau, A.; Thiery, M.; Dangla, P. Investigation of the carbonation mechanism of CH and CSH in terms of kinetics, microstructure changes and moisture properties. Cem. Concr. Res. 2014, 56, 153–170. [Google Scholar] [CrossRef]
- Steinour, H.H. Some effects of carbon dioxide on mortars and concrete discussion. J. Am. Concr. Inst. 1959, 30, 905–907. [Google Scholar]
- Pade, C.; Guimaraes, M. The CO2 uptake of concrete in a 100 year perspective. Cem. Concr. Res. 2007, 37, 1348–1356. [Google Scholar] [CrossRef]
- Tuutti, K. Corrosion of Steel in Concrete; Swedish Cement and Concrete Institute (CBI): Stockholm, Sweden, 1982. [Google Scholar]
- Bakker, R. Prediction of Service Life Reinforcement in Concrete under Different Climatic Conditions at Given Cover. In Proceedings of the Corrosion and Corrosion Protection of Steel in Concrete International Conference, Sheffield, UK, 24–28 July 1994; Available online: https://www.tib.eu/en/search/id/TIBKAT%3A186101058/Corrosion-and-corrosion-protection-of-steel-in/#documentinfo (accessed on 10 December 2018).
- Papadakis, V.G.; Vayenas, C.G.; Fardis, M.N. Fundamental Modeling and Experimental Investigation of Concrete Carbonation. ACI Mater. J. 1991, 88, 363–373. [Google Scholar]
- Andersson, R.; Fridh, K.; Stripple, H.; Häglund, M. Calculating CO2 Uptake for Existing Concrete Structures during and after Service Life. Environ. Sci. Technol. 2013, 47, 11625–11633. [Google Scholar] [CrossRef] [PubMed]
- Lagerblad, B. Carbon Dioxide Uptake during Concrete Life Cycle: State of the Art, 1st ed.; Swedish Cement and Concrete Research Institute: Stockholm, Sweden, 2005. [Google Scholar]
- Talukdar, S.; Banthia, N.; Grace, J.; Cohen, S. Carbonation in concrete infrastructure in the context of global climate change: Part 2—Canadian urban simulations. Cem. Concr. Compos. 2012, 34, 931–935. [Google Scholar] [CrossRef]
- Gajda, J.; Miller, F.M. Concrete as a Sink for Atmospheric Carbon Dioxide: A Literature Review and Estimation of CO2 Absorption by Portland Cement Concrete, 1st ed.; PCA: Chicago, IL, USA, 2000. [Google Scholar]
- Clear, C.A.; De Saulles, T. Recarbonation Scoping Study, 1st ed.; British Cement Association (BCA): Camberly, UK, 2007. [Google Scholar]
- Vermeulen, E. BalansTussenEmissieenOpname CO2, Hoe Zit Het nu Werkelijk Met de CO2-Emissie en—OpnameDoor Beton; Betoniek: ’s-Hertogenbosch, The Netherlands, 2017. [Google Scholar]
- Nygaard, P.V.; Leemann, A. Carbon Dioxide Uptake of Reinforced Concrete Structures Due to Carbonation; EMPA Cemsuisse Project 201106; EMPA: Dübendorf, Switzerland, 2011. [Google Scholar]
- Xi, F.; Davis, S.J.; Ciais, P.; Crawford-Brown, D.; Guan, D.; Pade, C.; Shi, T.; Syddall, M.; Lv, J.; Ji, L.; et al. Substantial global carbon uptake by cement carbonation. Nat. Geosci. 2016, 9, 880. [Google Scholar] [CrossRef]
- Galán, I. Concrete Carbonation: Combination of CO2 with the Hydrated Phases of Cement and Depth of Carbonation, 1st ed.; Autonomous University of Madrid: Madrid, Spain, 2011. [Google Scholar]
- Galán, I.; Andrade, C.; Mora, P.; Sanjuán, M.A. Sequestration of CO2 by Concrete Carbonation. Environ. Sci. Technol. 2010, 44, 3181–3186. [Google Scholar] [CrossRef] [PubMed]
- Baetzner, S.; Pierkes, R. Release and Uptake of Carbon Dioxide in the Life Cycle of Cement, 1st ed.; Technical Report TR-ECRA 0004/2008; European Cement Research Academy: Düsseldorf, Germany, 2008; pp. 1–24. [Google Scholar]
- Sanjuán, M.A.; Argiz, C. The new European standard on common cements specifications EN 197-1:2011. Mater. Constr. 2012, 62, 425–430. [Google Scholar] [CrossRef]
- EN 196-2—Methods of Testing Cement—Part 2: Chemical Analysis of Cement; CEN: Brussels, Belgium, 2013.
- Sanjuán, M.A.; Estévez, E.; Argiz, C.; del Barrio, D. Effect of curing time on granulated blast-furnace slag cement mortars carbonation. Cem. Concr. Compos. 2018, 90, 257–265. [Google Scholar] [CrossRef]
- EN 16757 Sustainability of Construction Works. Environmental Product: Environmental Product Declaration—Product Category Rules for Concrete and Concrete Elements; BSI: London, UK, 2017.
- Stripple, H.; Ljungkrantz, C.; Gustafsson, T. CO2 Uptake in Cement-Containing Products; Background and Calculation Models for IPCC Implementation; IVL Swedish Environmental Research Institute Ltd.: Stockholm, Sweden, 2018; pp. 1–65. [Google Scholar]
Figure 1.
Values of kg of CO2 released during clinkerization referred to the limestone calcination. The 43% of the Global study (in the middle) is similar to the 25% of the total emission proposed in Report TR-ECRA 0004/2008 [23].
Figure 1.
Values of kg of CO2 released during clinkerization referred to the limestone calcination. The 43% of the Global study (in the middle) is similar to the 25% of the total emission proposed in Report TR-ECRA 0004/2008 [23].

Figure 2.
(a) Paste and concrete specimens exposed to the atmosphere unsheltered from rain; (b) determination of the carbonation front through the pH indicator.
Figure 2.
(a) Paste and concrete specimens exposed to the atmosphere unsheltered from rain; (b) determination of the carbonation front through the pH indicator.
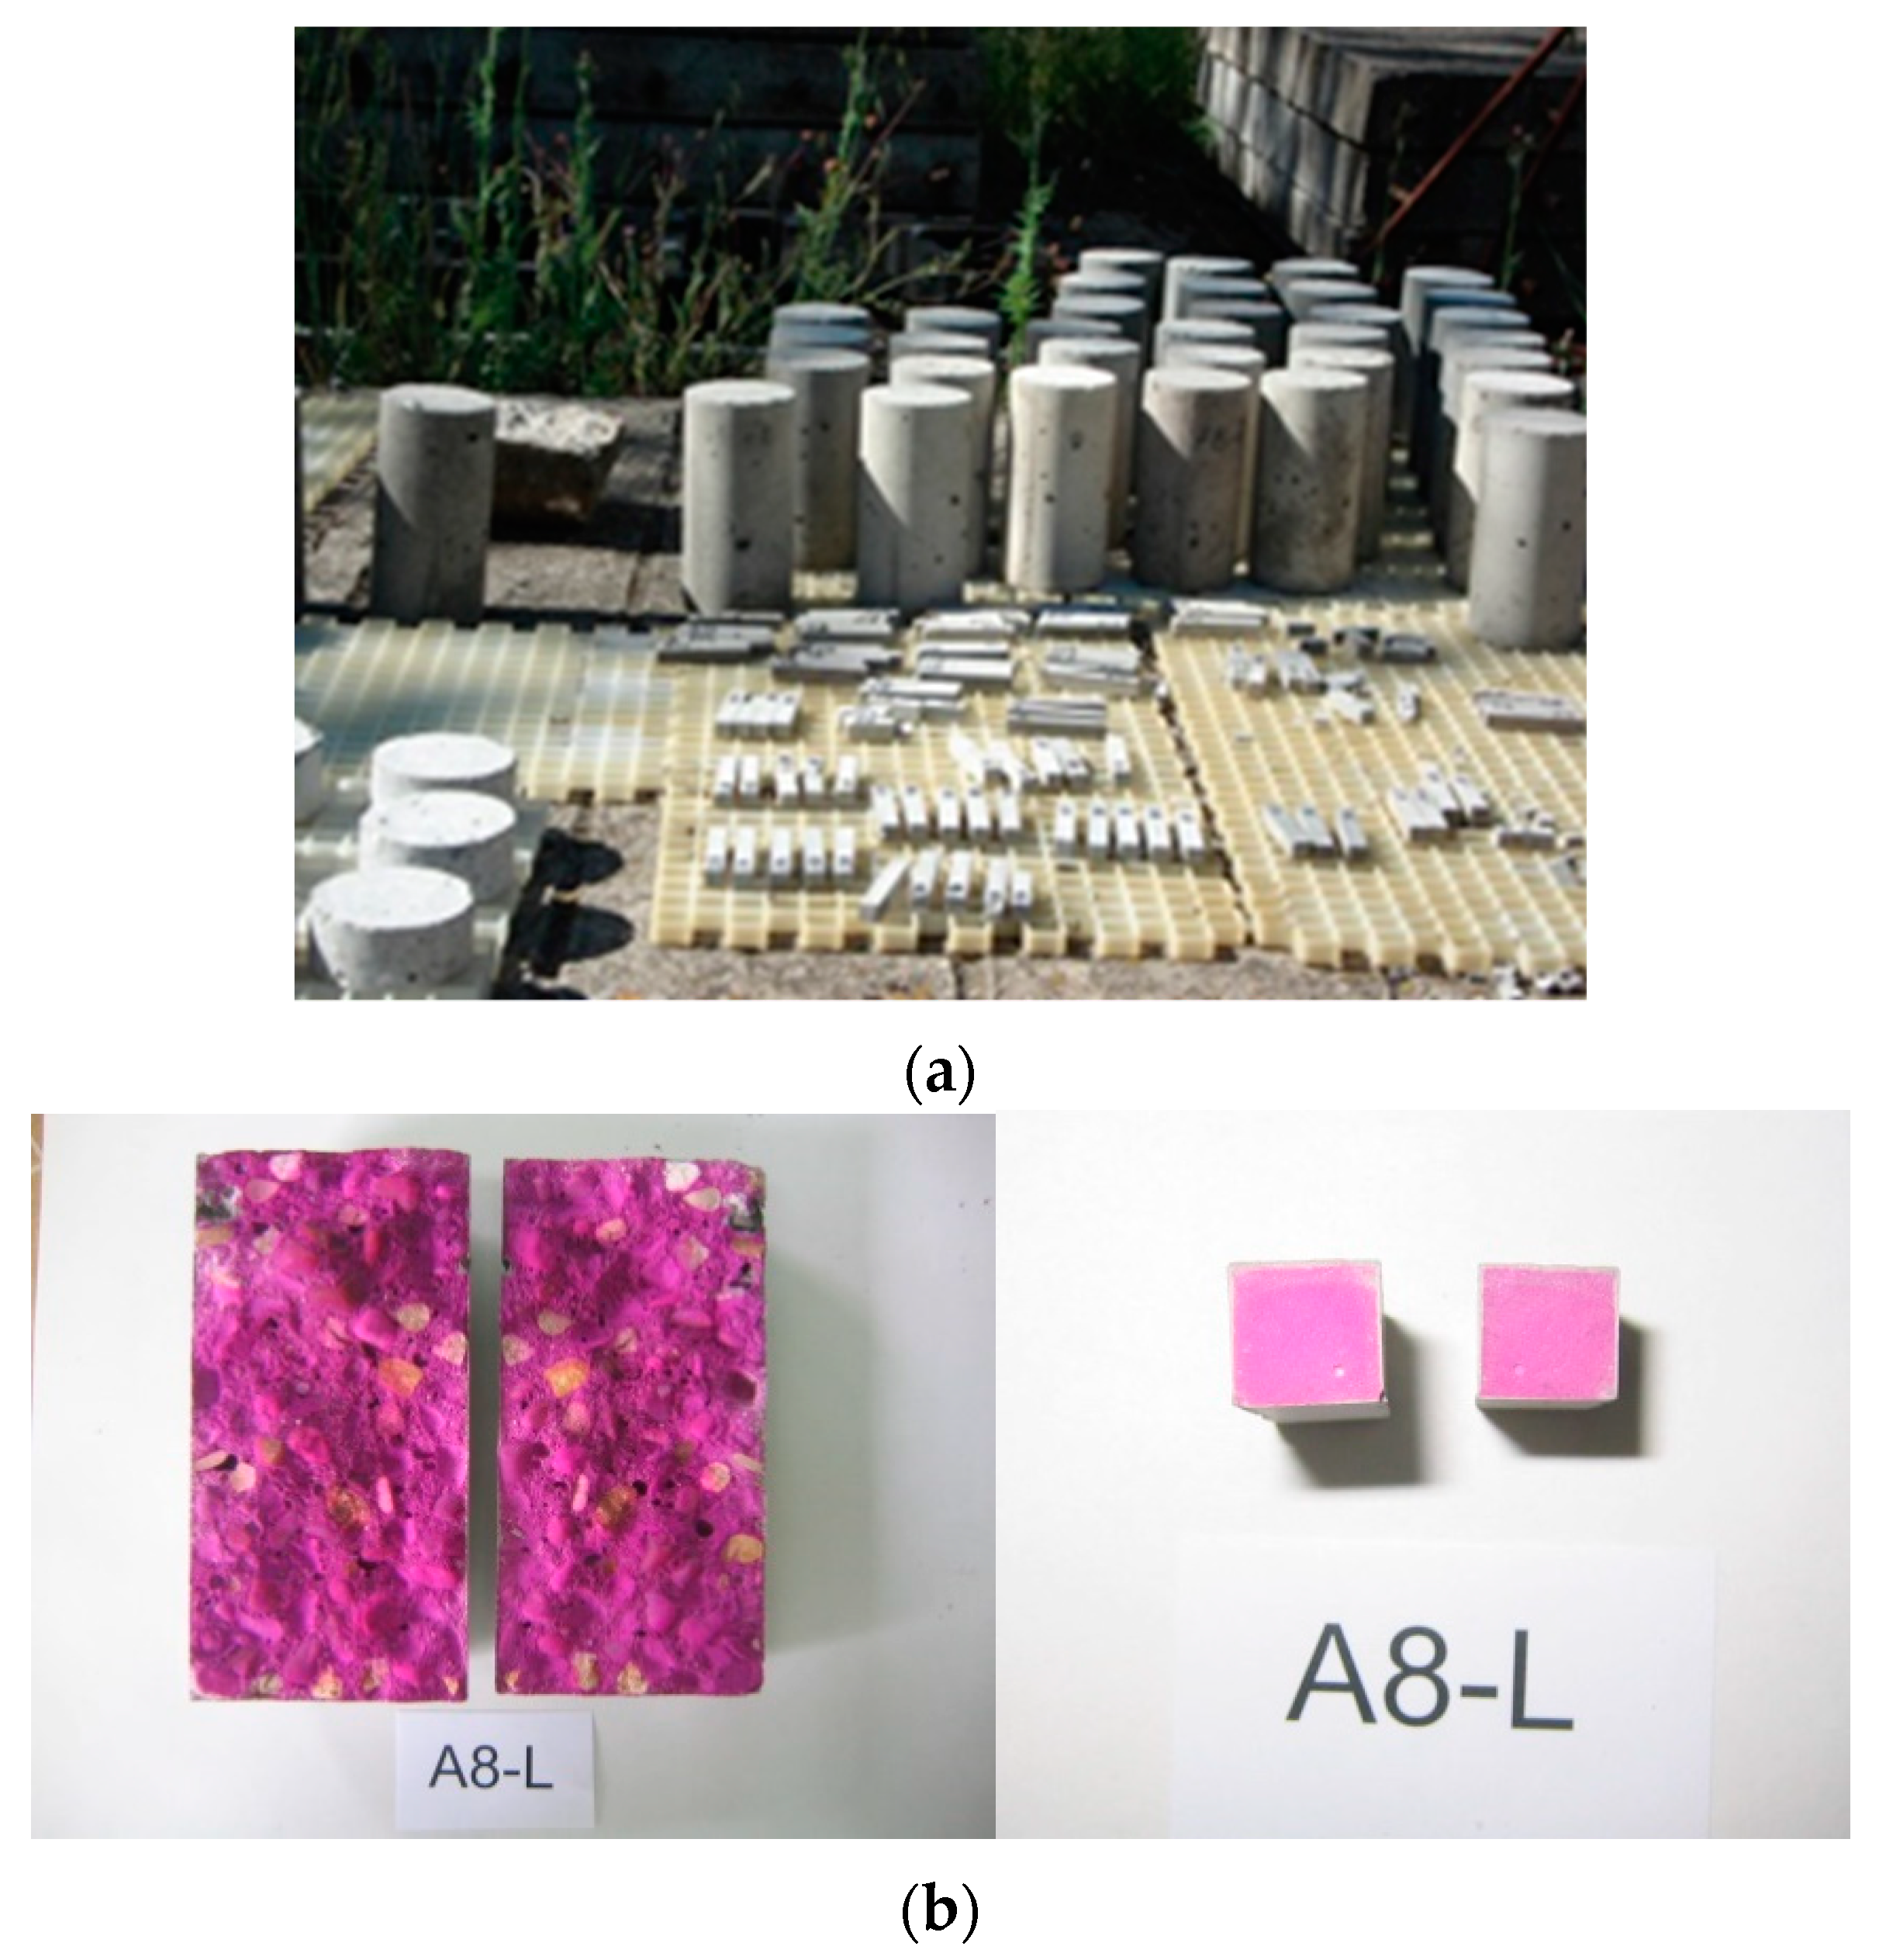
Figure 3.
Relation between degree of carbonation and age of the sample.
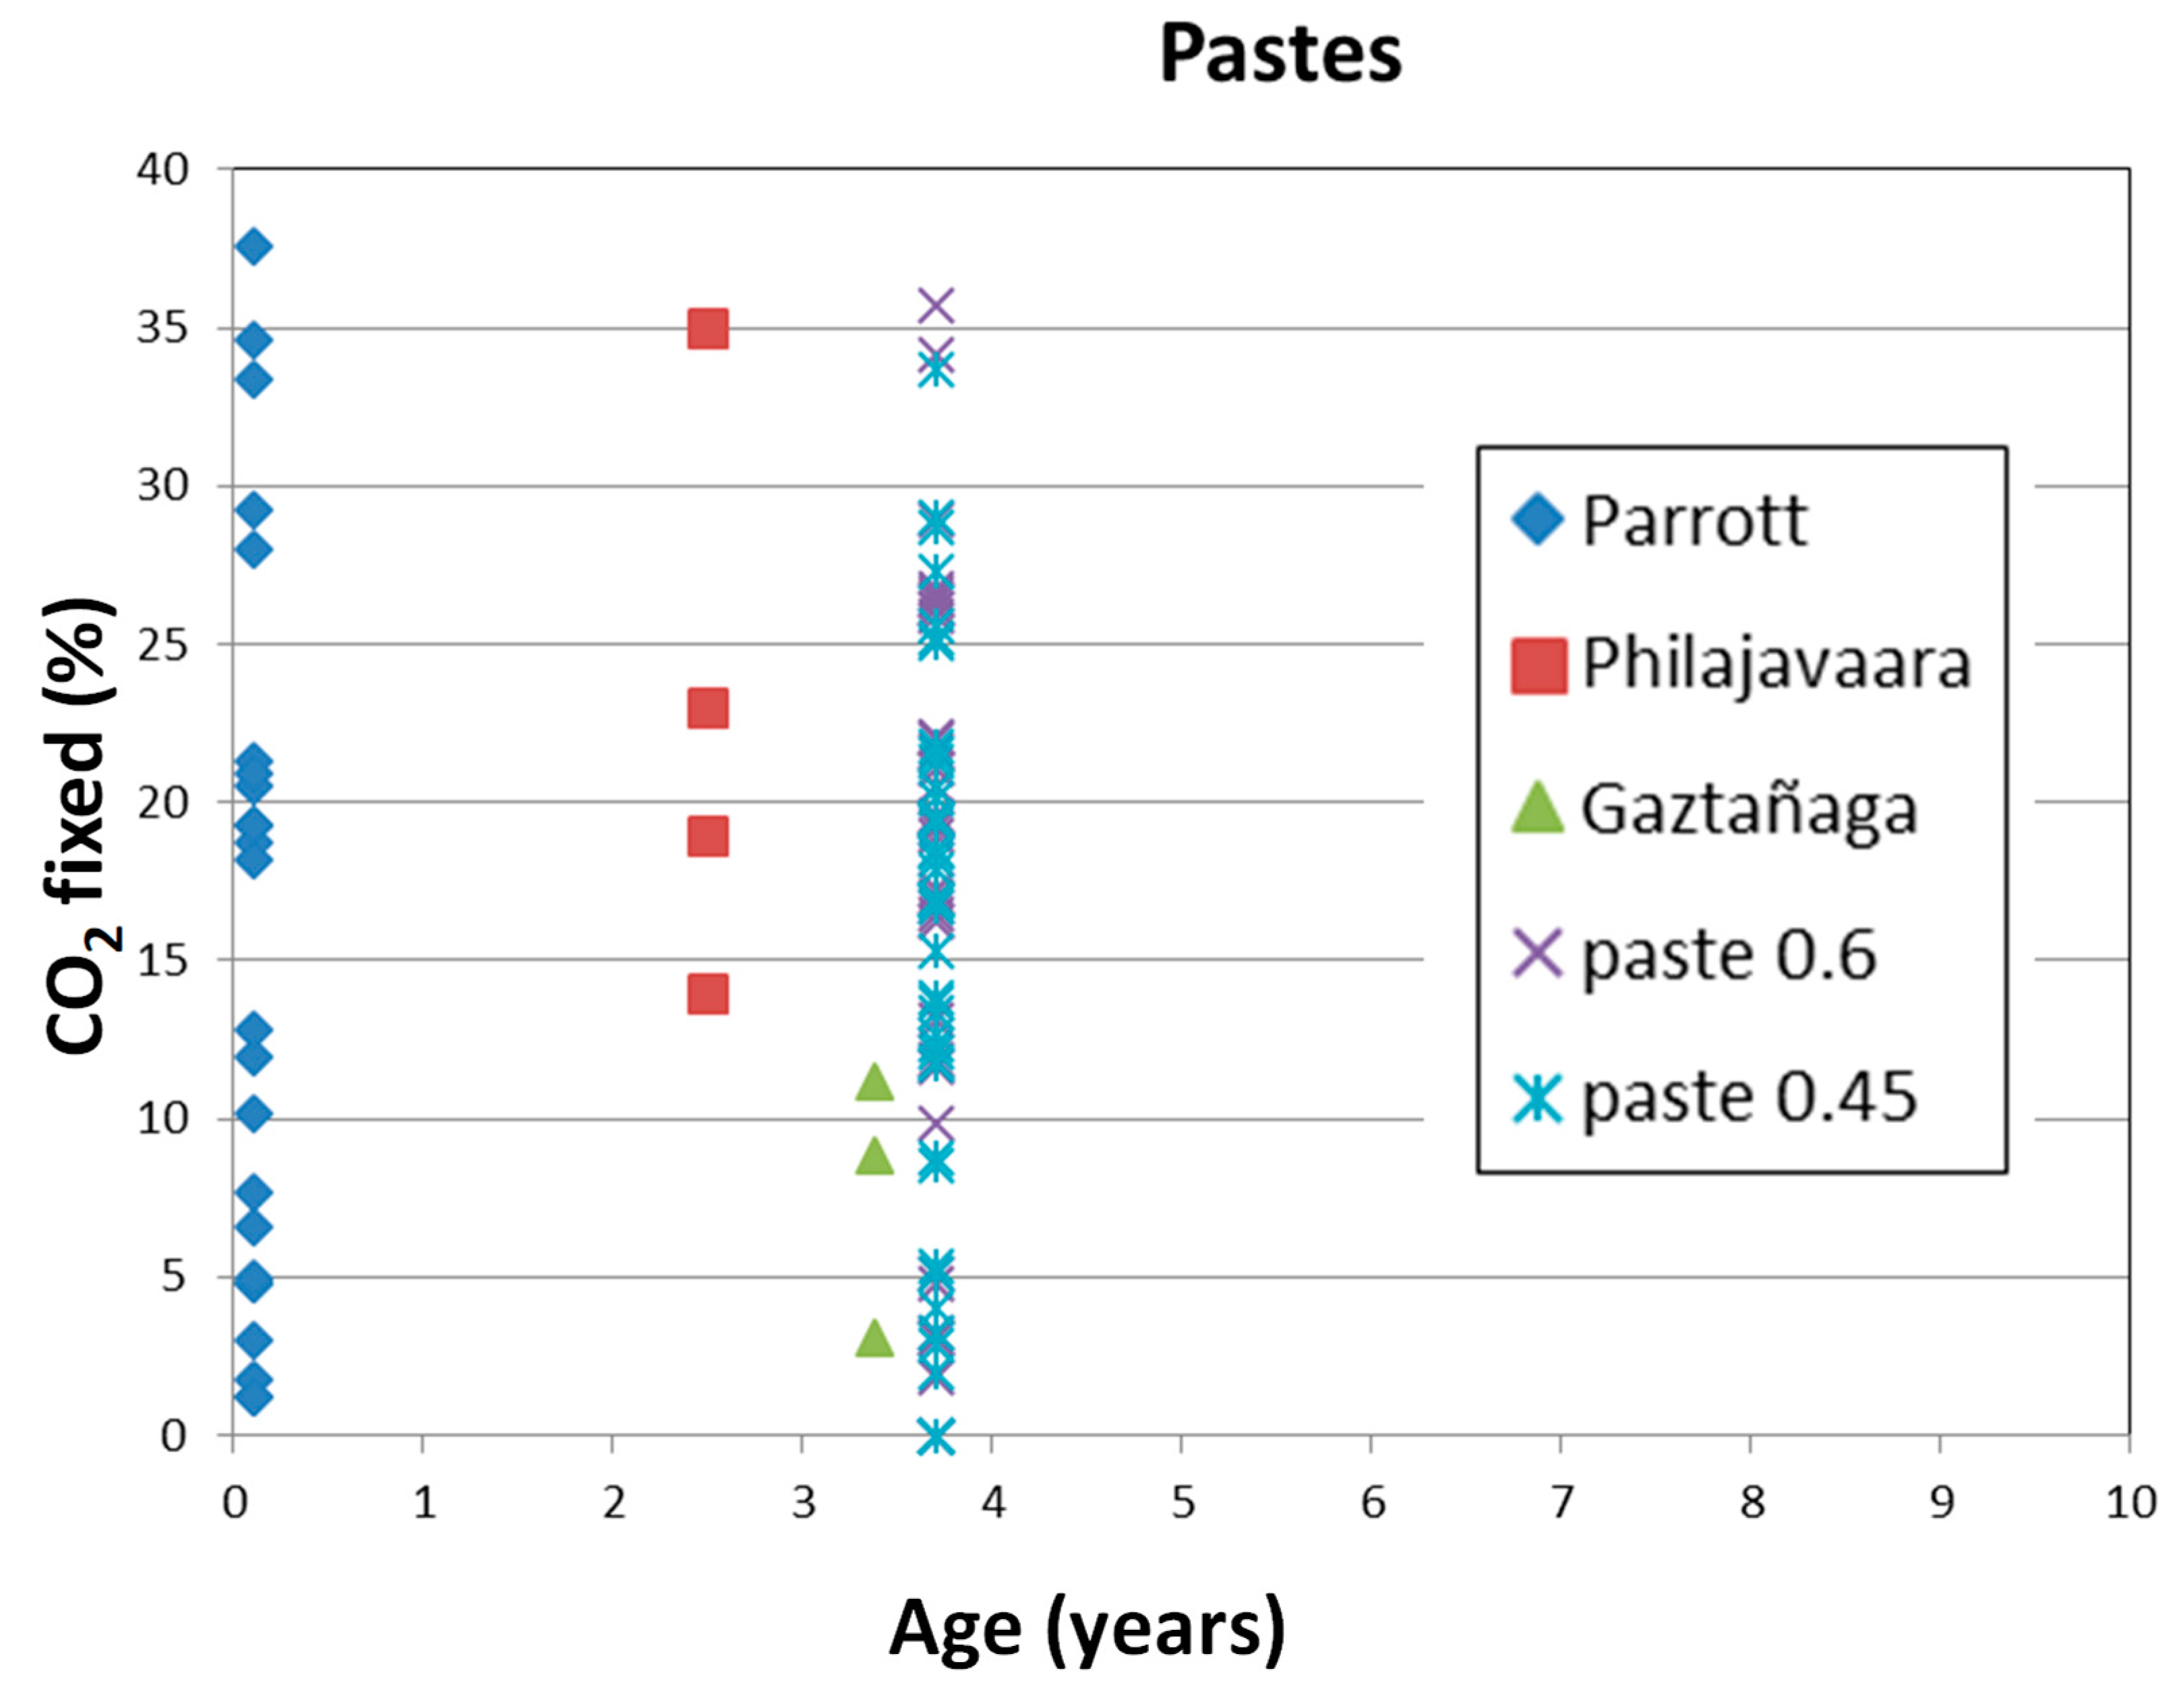
Figure 4.
Relation between CaO content in the clinker and CO2 fixed by the pastes. The values in vertical appear due to the pastes were held each type in three different exposure sites.
Figure 4.
Relation between CaO content in the clinker and CO2 fixed by the pastes. The values in vertical appear due to the pastes were held each type in three different exposure sites.

Figure 5.
Effect of the exposure class in the proportion of CO2 fixed by carbonation.

Figure 6.
Comparison of the CO2 fixed by the pastes with respect to the concretes. The proportion is a bit higher in the concretes and the relation is more scattered in the case of w/c ratios of 0.45.
Figure 6.
Comparison of the CO2 fixed by the pastes with respect to the concretes. The proportion is a bit higher in the concretes and the relation is more scattered in the case of w/c ratios of 0.45.
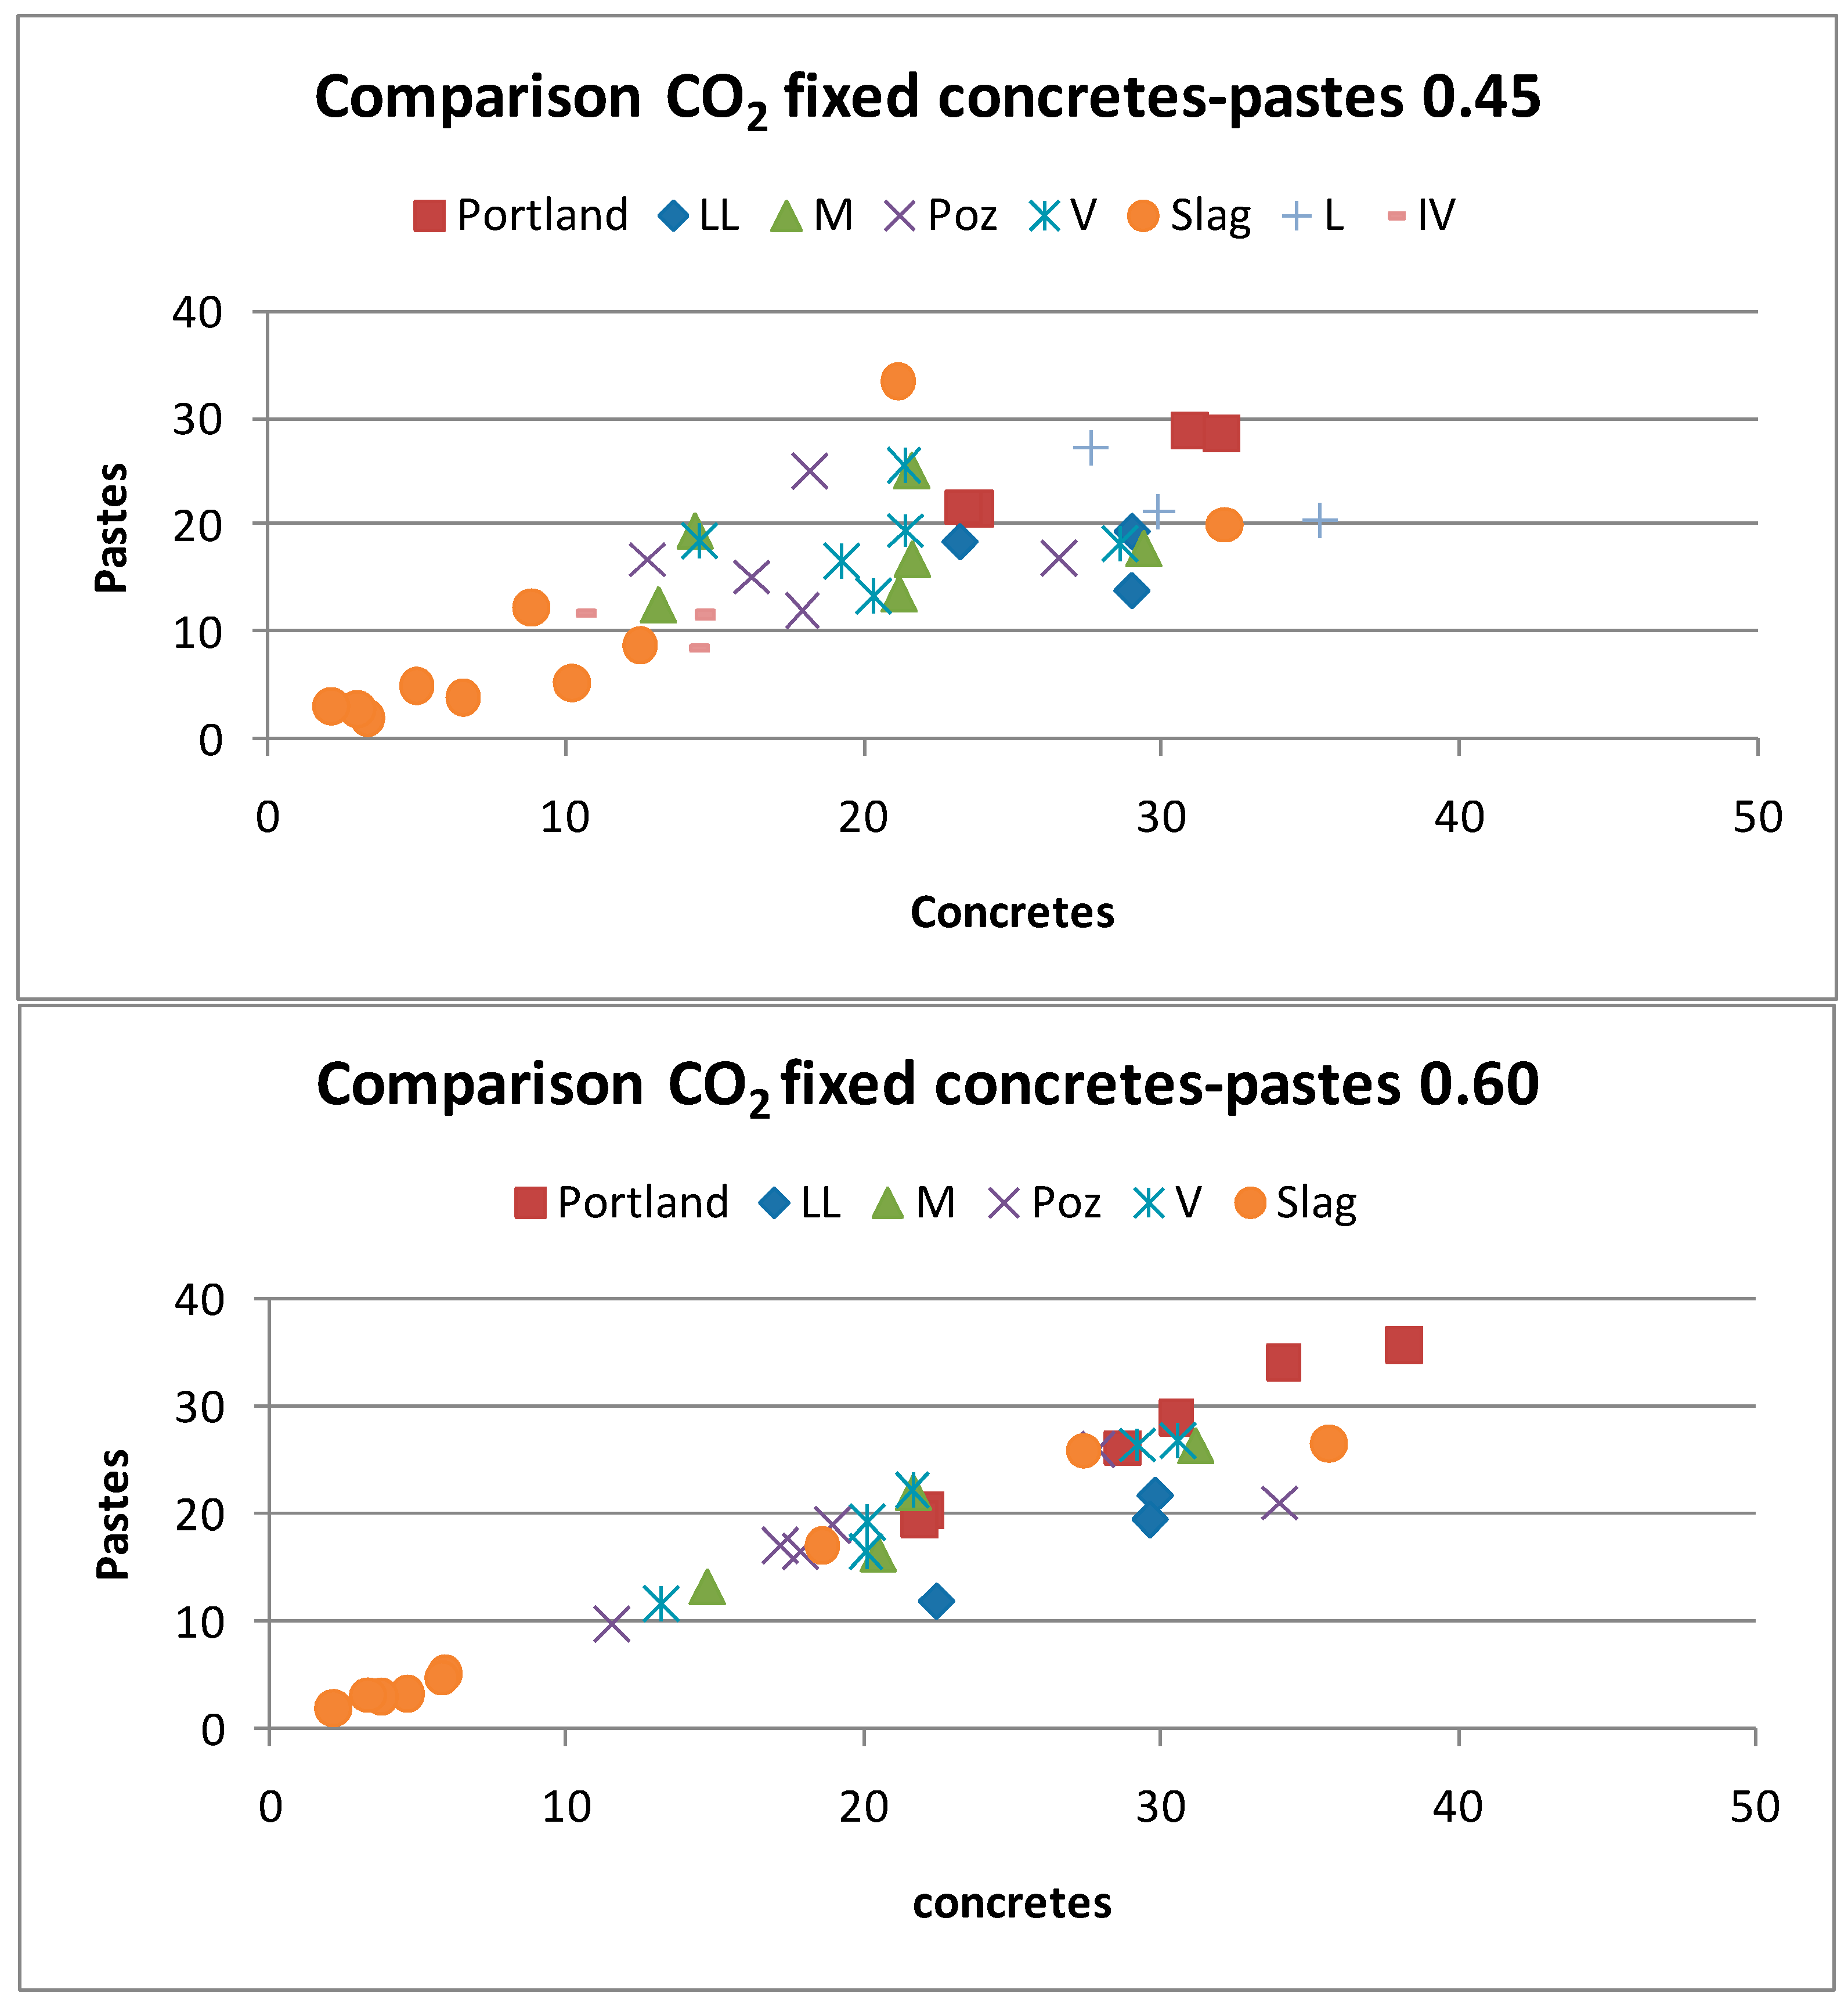
Figure 7.
Degree of carbonation of all the pastes tested during 4 years in three different exposure conditions.
Figure 7.
Degree of carbonation of all the pastes tested during 4 years in three different exposure conditions.
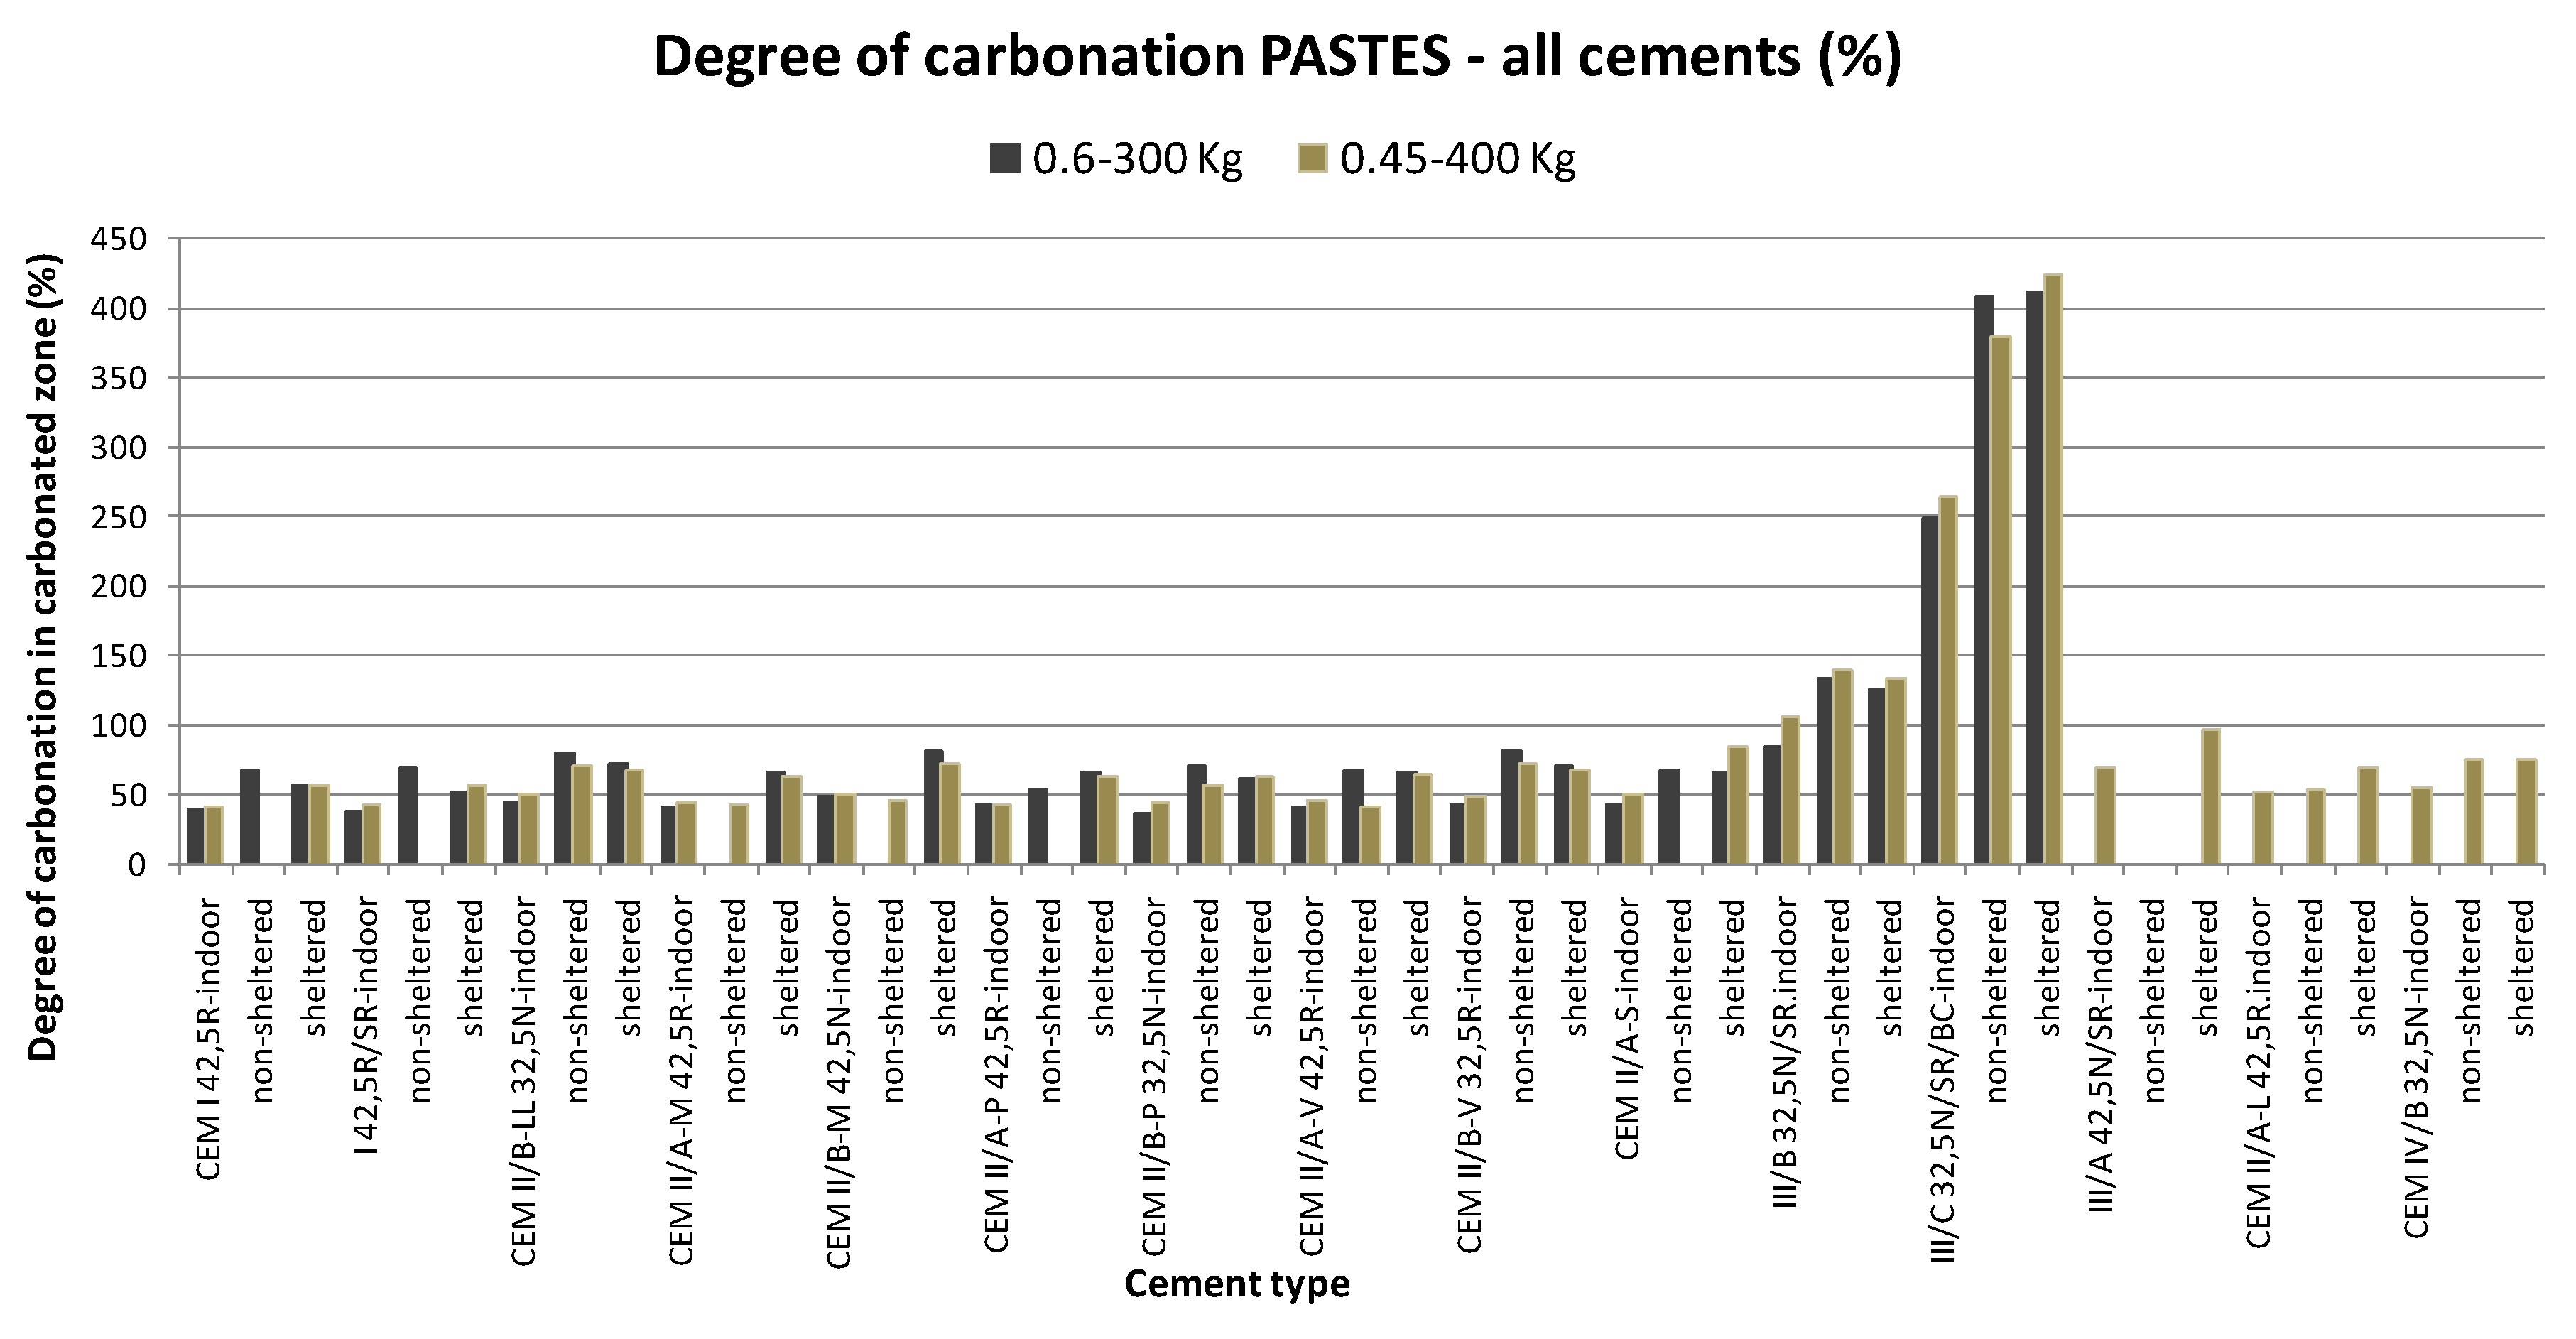
Figure 8.
Degree of carbonation of the same pastes than in Figure 3 without cements with blast-furnace slag named CEM III/B and CEM III/C.
Figure 8.
Degree of carbonation of the same pastes than in Figure 3 without cements with blast-furnace slag named CEM III/B and CEM III/C.

Figure 9.
Degree of carbonation of cements with slags: CEM III/A, CEM III/B, CEM III/C and CEM II/A-S.
Figure 9.
Degree of carbonation of cements with slags: CEM III/A, CEM III/B, CEM III/C and CEM II/A-S.

Figure 10.
Comparison of the DoC of pastes and concretes made with the same cement types and w/c ratios.
Figure 10.
Comparison of the DoC of pastes and concretes made with the same cement types and w/c ratios.

Figure 11.
Comparison of the values of the degree of carbonation (DoC) found in the pastes and the concretes tested.
Figure 11.
Comparison of the values of the degree of carbonation (DoC) found in the pastes and the concretes tested.

Figure 12.
Fabrication with release of CO2 and life cycle of cement (fabrication, building, demolition and recycling) based materials during which they uptake part of the CO2.
Figure 12.
Fabrication with release of CO2 and life cycle of cement (fabrication, building, demolition and recycling) based materials during which they uptake part of the CO2.

Table 1.
Concrete mixes.
| Mix A: Building Works | Mix B: Civil Works | ||
|---|---|---|---|
| Cement | 300 kg | Cement | 400 kg |
| Gravel 6–12 mm | 1144 kg | Gravel 6–16 mm | 949 kg |
| Sand 0–2 mm | 820 kg | Sand 0–2.5 mm | 297 kg |
| Water | 180 kg | Sand 0–5 mm | 614 kg |
| w/c | 0.6 | Water | 180 kg |
| w/c | 0.45 | ||
Table 2.
Cement chemical composition (%).
| CEMENT | SiO2 | Al2O3 | Fe2O3 | CaO | SO3 | MgO | Na2O | K2O | Cl− |
|---|---|---|---|---|---|---|---|---|---|
| CEM I 42.5 R | 20.18 | 4.49 | 2.64 | 63.83 | 3.45 | 2.28 | - | 0.95 | 0.010 |
| I 42,5R/SR | 20.45 | 3.45 | 3.59 | 62.77 | 3.20 | 1.39 | 0.09 | 0.61 | 0.003 |
| CEM II/A-L 42,5R | 18.33 | 4.81 | 3.22 | 62.01 | 3.15 | 0.83 | 0.18 | 0.69 | 0.010 |
| CEM II/A-S | 21.72 | 7.53 | 2.81 | 60.11 | 3.01 | 2.00 | 0.43 | 0.83 | 0.002 |
| CEM II/A-M (V-L) 42.5 R | 22.02 | 10.04 | 2.39 | 57.15 | 3.16 | 2.56 | 0.47 | 1.16 | 0.001 |
| CEM II/A-V 42.5 R | 21.63 | 5.81 | 3.97 | 56.31 | 3.48 | 1.94 | 0.71 | 0.96 | 0.030 |
| CEM II/A-P 42.5 R | 31.45 | 6.26 | 3.36 | 52.64 | 2.60 | 0.20 | - | - | 0.030 |
| CEM II/B-LL 32.5 N | 16.83 | 4.30 | 2.20 | 55.96 | 3.06 | 2.40 | 0.24 | 0.86 | 0.035 |
| CEM II/B-M (S-V) 42.5 N | 25.00 | 8.70 | 2.50 | 54.20 | 2.76 | 2.72 | 0.45 | 0.52 | 0.050 |
| CEM II/B-V 32.5 R | 29.19 | 10.25 | 2.53 | 48.58 | 2.92 | 2.82 | 0.20 | 1.10 | 0.001 |
| CEM II/B-P 32.5 N | 26.24 | 8.58 | 6.62 | 49.23 | 3.40 | 6.21 | 1.36 | 1.07 | 0.006 |
| III/A 42,5N/SR | 26.60 | 8.50 | 2.50 | 55.60 | 2.10 | 4.80 | - | 0.70 | - |
| III/B 32,5N/SR | 26.40 | 10.60 | 2.47 | 45.95 | 2.72 | 3.12 | 0.27 | 0.70 | 0.011 |
| III/C 32,5N/SR/BC | 30.04 | 10.12 | 1.16 | 46.82 | 3.80 | 5.80 | 0.06 | 0.37 | 0.075 |
| CEM IV/B 32,5N | 32.23 | 12.32 | 4.20 | 41.05 | 2.64 | 2.14 | 0.41 | 1.59 | 0.003 |
Table 3.
Degree of carbonation of the cement pastes.
| Degree of Carbonation in Cement Pastes | Average Value | Standard Deviation, s | Coefficient of Variation (%) | Lower Limit: Aver.—1.645s (5% Reliability) |
|---|---|---|---|---|
| All cements except CEM III Including old concretes | 50.73 | 21.49 | 42.36 | 15.38 |
| Only type I cement (OPC) | 52.19 | 11.10 | 21.28 | 33.93 |
| Only type I with old pastes | 37.17 | 22.03 | 59.27 | 15.38 |
| CEM III/A | 82.35 | 19.60 | 23.80 | 50.11 |
| CEM III/B | 120.49 | 21.17 | 17.57 | 85.67 |
| CEM III/C | 356.03 | 78.77 | 22.13 | 226.45 |
© 2018 by the authors. Licensee MDPI, Basel, Switzerland. This article is an open access article distributed under the terms and conditions of the Creative Commons Attribution (CC BY) license (http://creativecommons.org/licenses/by/4.0/).
Share and Cite
MDPI and ACS Style
Andrade, C.; Sanjuán, M.Á. Updating Carbon Storage Capacity of Spanish Cements. Sustainability 2018, 10, 4806. https://doi.org/10.3390/su10124806
AMA Style
Andrade C, Sanjuán MÁ. Updating Carbon Storage Capacity of Spanish Cements. Sustainability. 2018; 10(12):4806. https://doi.org/10.3390/su10124806
Chicago/Turabian StyleAndrade, Carmen, and Miguel Ángel Sanjuán. 2018. "Updating Carbon Storage Capacity of Spanish Cements" Sustainability 10, no. 12: 4806. https://doi.org/10.3390/su10124806
Note that from the first issue of 2016, this journal uses article numbers instead of page numbers. See further details here.