A Fuzzy Based Model for Standardized Sustainability Assessment of Photovoltaic Cells


1
Sustainable Energy Systems Engineering Program, Texas A&M University-Kingsville, Kingsville, TX 78363, USA
2
Department of Mechanical & Industrial Engineering, Texas A&M University-Kingsville, Kingsville, TX 78363, USA
3
Department of Mechanical Engineering, University of Texas at Tyler, Tyler, TX 75799, USA
*
Author to whom correspondence should be addressed.
Sustainability 2018, 10(12), 4787; https://doi.org/10.3390/su10124787
Submission received: 7 November 2018
/
Revised: 28 November 2018
/
Accepted: 11 December 2018
/
Published: 15 December 2018
(This article belongs to the Special Issue Sustainability Assessment of Environmental Technologies)
Abstract
:In this paper, a new environmental sustainability indicator (ESI) is proposed to evaluate photovoltaic (PV) cells utilizing Life Cycle Analysis (LCA) principles. The proposed indicator is based on a model that employs a fuzzy logic algorithm to combine multiple factors, usually used in multiple LCAs, and produce results allowing a comprehensive interpretation of LCA phase sub-results leading to standardized comparisons of various PV cells. Such comparisons would be essential for policymakers and PV cell manufacturers and users, as they allow for fair assessment of the environmental sustainability of a particular type of PV with multiple factors. The output of the proposed model was tested and verified against published information on LCAs related to PV cells. A distinct feature of this fuzzy logic model is its expandability, allowing more factors to be included in the future, as desired by the users, or dictated by a new discovery. It also provides a platform that can be used to evaluate other families of products. Moreover, standardizing the comparison process helps in improving the sustainability of PV cells through targeting individual relevant factors for changes while tracking the combined final impact of these changes on the overall environmental sustainability of the PV cell.
1. Introduction
Photovoltaic (PV) cells have been widely used all over the world as a source of clean and inexpensive energy, and they reached an estimated total capacity of more than 402 GW by 2017 [1]. However, considering their entire life cycle, PV cells are not completely environment-friendly, due to noticeable amounts of CO2 emissions at various stages of their life cycle, such as during manufacturing, maintenance, and cleaning [2]. Moreover, with the increasing in use of PV cells, there will be high demand on the use of resources, including non-renewable ones like coal, to build PV cells. In addition, increased levels of waste at the end of PV cells’ life will come into play [3,4,5]. As a result, researchers started to examine the relation between PV cells and the environment using combinations of Life Cycle Assessment (LCA) methods, with a major goal of minimizing CO2 emissions during the entire life of PV cells [6,7,8]. This effort has been underway to find a unified measuring standard of PV cells’ environmental friendliness, or sustainability, that combines more than one factor in the LCA [9]. Greenhouse gas (GHG), energy payback time (EPBT), PV cell efficiency, and cumulative energy demand (CED), are the most common environmental indicators that can be used to evaluate the environmental impact of a certain PV cell. Some LCA studies used the EPBT to evaluate the overall environmental impact for PV cells [10,11,12,13]. Other studies used a combination of EPBT and GHG in the evaluation of the most environmentally-friendly PVs [14,15,16]. A third set of LCA studies identified the most environmentally-friendly PV cell by normalizing the GHG values with respect to one type of PV cell, which is the mono-Si PV cell [17]. Meanwhile, other factors were hardly considered in any study because of the lack of data for most types of PV cells [18], such as: human toxicity potential, freshwater eutrophication, freshwater eco-toxicity, abiotic depletion potential, photochemical ozone creation potential, and PV cell economics [19,20,21]. As a result, determining the sustainability of a particular PV cell continues to be a challenge because none of the existing studies uses the same metrics or measurement method to evaluate the environmental sustainability of PV cells with as many factors included as possible.
In order to find the environmental impact, or sustainability, for a certain PV cell type, the combined effect of as many factors as possible, should be considered. Moreover, a standard measuring method and a common scale should be used to produce a reliable measurement result or label for each type of PV cell being assessed that shows where it stands amongst competition in terms of sustainability.
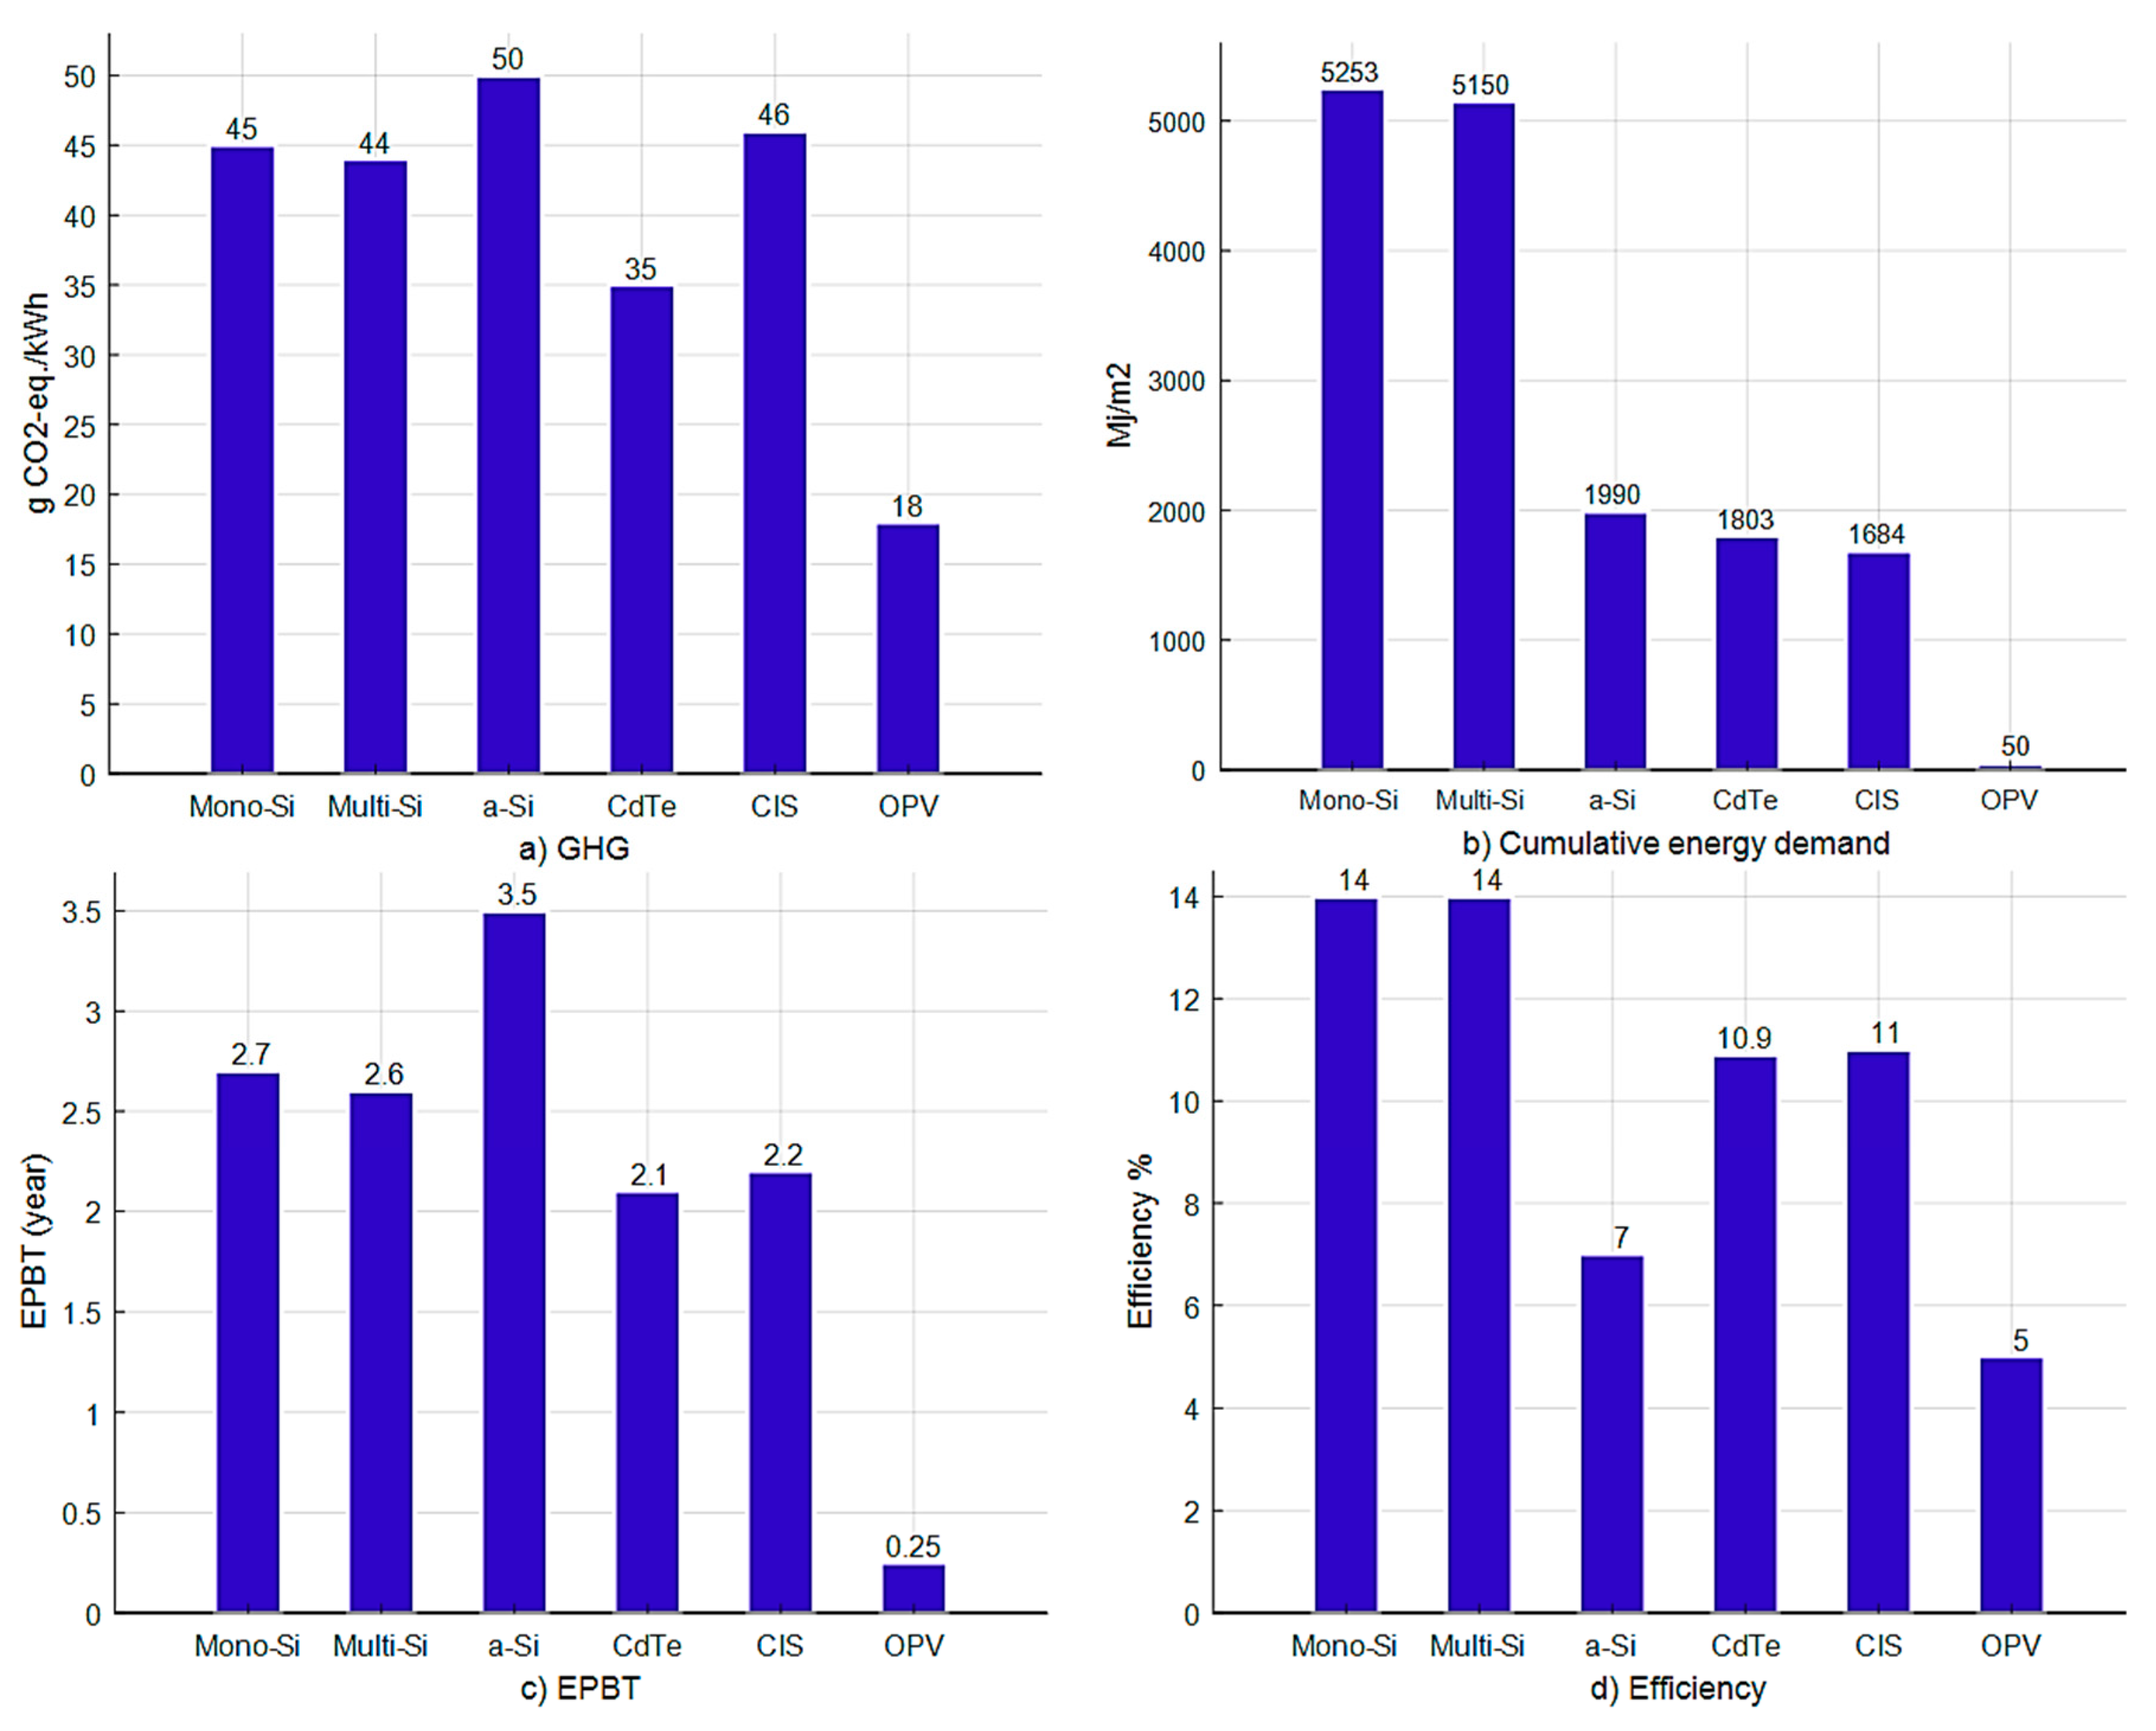
Most published LCA results provide multiple comparisons between PV cells depending on one factor at a time, which is prone to producing contradicting results. Figure 1 shows results of different LCA studies where a-Si PV cell has higher GHG and EPBT while simultaneously it has a relatively low manufacturing energy [22,23,24]. Also, LCA results show that CdTe has less GHG and EPBT if compared to CIS, but CdTe has a lower efficiency and requires more energy in manufacturing when compared to CIS. These are examples of the complexity and difficulty associated with judging which PV cell has the least or most environmental impact based on one parameter at a time, based on multiple separate parameters at the same time.
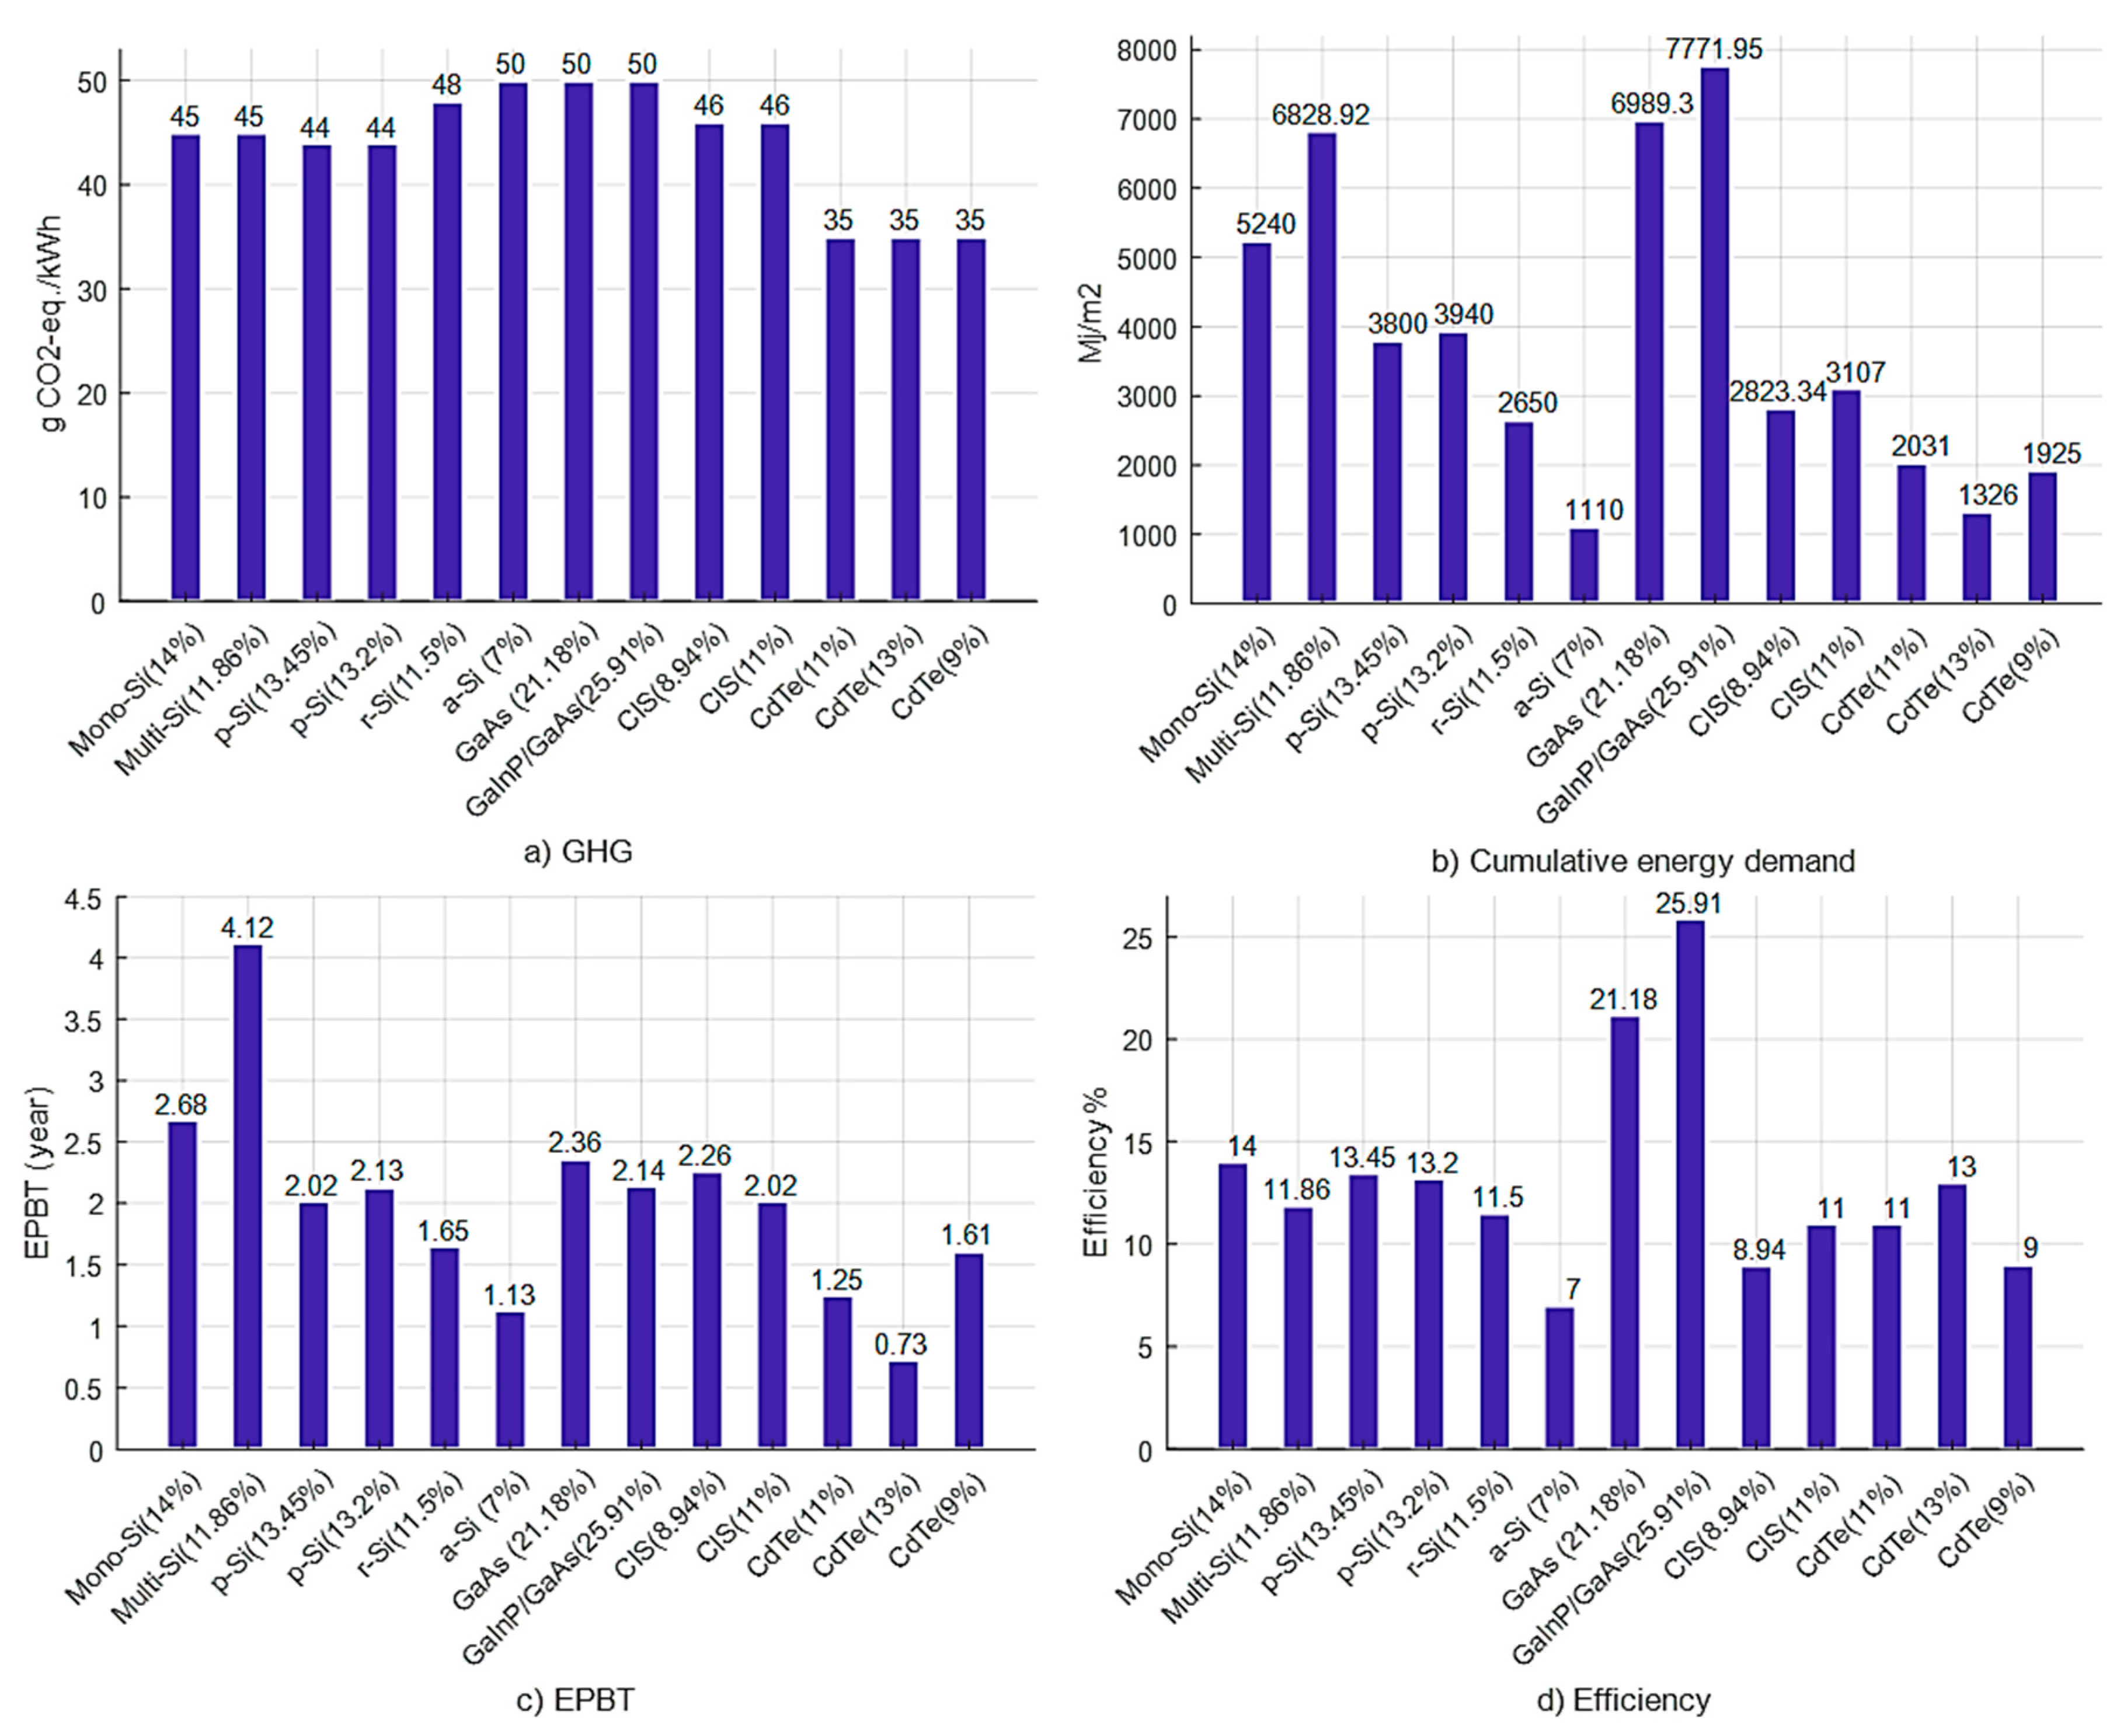
The comparison will be difficult when multiple PV cell types are included, as shown in Figure 2 [25].
Some literature reports attempt to resolve the aforementioned issue of comparing different PV cells using a single metric. For instance, ecological indicators such as Eco-indicator 99 has been used in published studies to find the environmental impact of different human activities, especially in the PV industry [26,27,28,29,30]. Eco-indicator 99 is embedded inside LCA packages like GaBi [31] and Simapro [32]. However, the output of this system is binary, with pre-set thresholds which are not flexible or easy to customize. As a result, other flexible methods, such as fuzzy logic, have been proposed in the literature as an alternative to the packaged systems [33,34,35,36]. In general, fuzzy logic modeling allows the development of a mathematical relationship between complex and nonlinear inputs like GHG, EPBT, and CED, as inputs, leading to an output that combines their effect rationally resulting in finding their collective environmental impact. This paper aims to propose a new design of a fuzzy-based environmental sustainability indicator (ESI) that can be used to measure and rank PV cells based on LCA sub-results, as shown in the next section. ESI provides comparable results for different PV cells based on a combination of multiple one-factor-based LCA values for each cell, such as EPBT, and GHG. Moreover, ESI can be easily adjusted to meet the policymaker’s requirements in different countries.
PV cell users need to know how much clean energy will be produced and used every month by using their respective PV cells. At the same time, they also have the right to know how many tons of CO2 were released during the manufacturing and processing of these PV cells. Additionally, they should consider the CO2 emissions associated with the running process of their PV cells, and the disposal process of the PV cell at its end-of-life. While there are many types of PV cells in the market with claims of being environmentally sustainable, combined with the aforementioned concerns and factors to consider, judging which is the most environmentally sustainable of these PV cells and what area to improve within their life cycle becomes a significant challenge, even when utilizing traditional LCAs. Therefore, this study is intended to help evaluate the environmental impact and sustainability of PV cells using a comprehensive model that includes the bigger context of their entire life, while allowing a higher level analysis of the complex relation between the different factors contributing to this impact. The results of this model would be a standard indicator that will help in identifying areas of future improvements in PV design, materials, manufacturing, operation, and recycling, while keeping the combined final effect in check. This is all while maintaining the bigger goal of always minimizing PV cells’ harmful and irreversible impact on humans and the environment, including the CO2 emissions related to PV cells’ industry and operation [37,38].
Aside from the set of quantifiable factors mentioned above (i.e., EPBT and GHG), another set of concerns, related to the wider context of societal impact of this technology, have also surfaced recently such as child labor and low-income labor in mining and production of materials like silicon. As a specific example, social and health related concerns have surfaced as a result of continuous inhalation of crystalline silicon, which is known to cause different lung diseases like the silicosis, which is one of the most common industry-related diseases worldwide [39,40]. Including such concerns in the evaluation method of PV cells’ environmental sustainability would be very advantageous, particularly if the evaluation is based on a standard measuring scale [41,42,43]. To the best of the authors’ knowledge, there are no data that can be used to evaluate the social and health impacts of different PV cell types. Unfortunately, most of the available information is in anecdotal forms.
In the following parts of this paper, a general description of a typical LCA will be provided. This will be followed by a detailed description of the factors which have major contribution to the environmental sustainability of PV cells, as well as other factors to be considered in this holistic approach, leading to a discussion of potential improvement areas in the life cycle of a typical PV cell. A description of the proposed method to evaluate sustainability of a PV cell type, and the related fuzzy logic base of the model, allowing the combination of multiple factors in typical LCAs, will follow. Finally, a standardized indicator will be presented as an outcome of this model, followed by verification results and conclusions.
2. LCA Framework
In general, life cycle analysis aims to find the impact on the environment caused by a certain product through the different stages of its life. A typical LCA consist of four main stages [9,10,11,12]. Figure 3 shows the four stages with some details of the analysis stage.
- Goal and scope: this stage defines the LCA objective and boundaries.
- Inventory analysis: this stage includes the examination of the amount of pollutants and materials involved during the entire life of PV cells.
- Impact assessment: in this stage the amount of required energy, produced pollutants, and involved problems, that will exist during the whole life of PV cell, are emulated.
- Interpretation: this is the stage of the final conclusion regarding the impact of a certain PV cell on the environment, which is required to explore any opportunities to reduce that impact.
Such a LCA involves one of the many factors that can be used to assess the impact of PV cells on the environment, but without combining multiple factors. The most important and common factors which are usually considered in any LCA include: Energy payback time (EPBT), Greenhouse gas (GHG), Cumulative energy demand (CED), Efficiency, and a Risk factor. Such LCA studies allow a comparison of different products in terms of environmental friendliness based on one of these factors at a time. In addition to the previously listed factors, the literature includes other factors that could affect the environment such as [23]:
- Human toxicity potential.
- Freshwater eutrophication and the addition of unwanted components in drinking water.
- Freshwater ecotoxicity.
- Abiotic depletion potential (the high use of natural sources).
- Child labor.
Unfortunately, only sporadic literature and incomplete information exist in relation to these factors, which does not provide reliable grounds or sufficient quantifiable data to include them as critical elements in this study [44]. These factors formulate a topic which presents an active area for future research and development to quantify, and improve, the societal and health impact of PV cells.
3. Critical Factors Influencing PV Cells’ Environmental Sustainability
3.1. Energy Payback Time (EPBT)
EPBT is considered the most important factor in the context of environmental impact of PV cells as an energy source. EPBT is defined as the time required for PV cells to produce the same amount of energy that will be consumed during their manufacturing, operation, and landfilling, as calculated by Equation (1) [45,46,47]
where represent the total amount of energy consumed starting from PV raw material production to the end of life in energy units, while EPV,annual represents the total amount of energy produced by that PV cell. For Ein to be most inclusive, it should contain any other energy used for cabling, transportation, installation, maintenance and recycling [48].
3.2. Greenhouse Gas (GHG)
The second factor is Greenhouse gas (GHG) emissions, which can be expressed in terms of CO2 equivalent. GHG has been used as a measure for the environmental impact of all power generation systems, where lower is better. In general, the GHG rate is measured in units of gram carbon monoxide equivalent per kilowatt-hour (g CO2eq/kWh) which can be calculated as the ratio of total emissions during the entire life of a PV cell to the total electricity generated during the same period as, shown by Equation (2).
where: represent the total amount of GHG emissions starting from PV raw material production to the end of life in energy units, while EPV,entire life represents the total amount of energy produced by that PV cell.
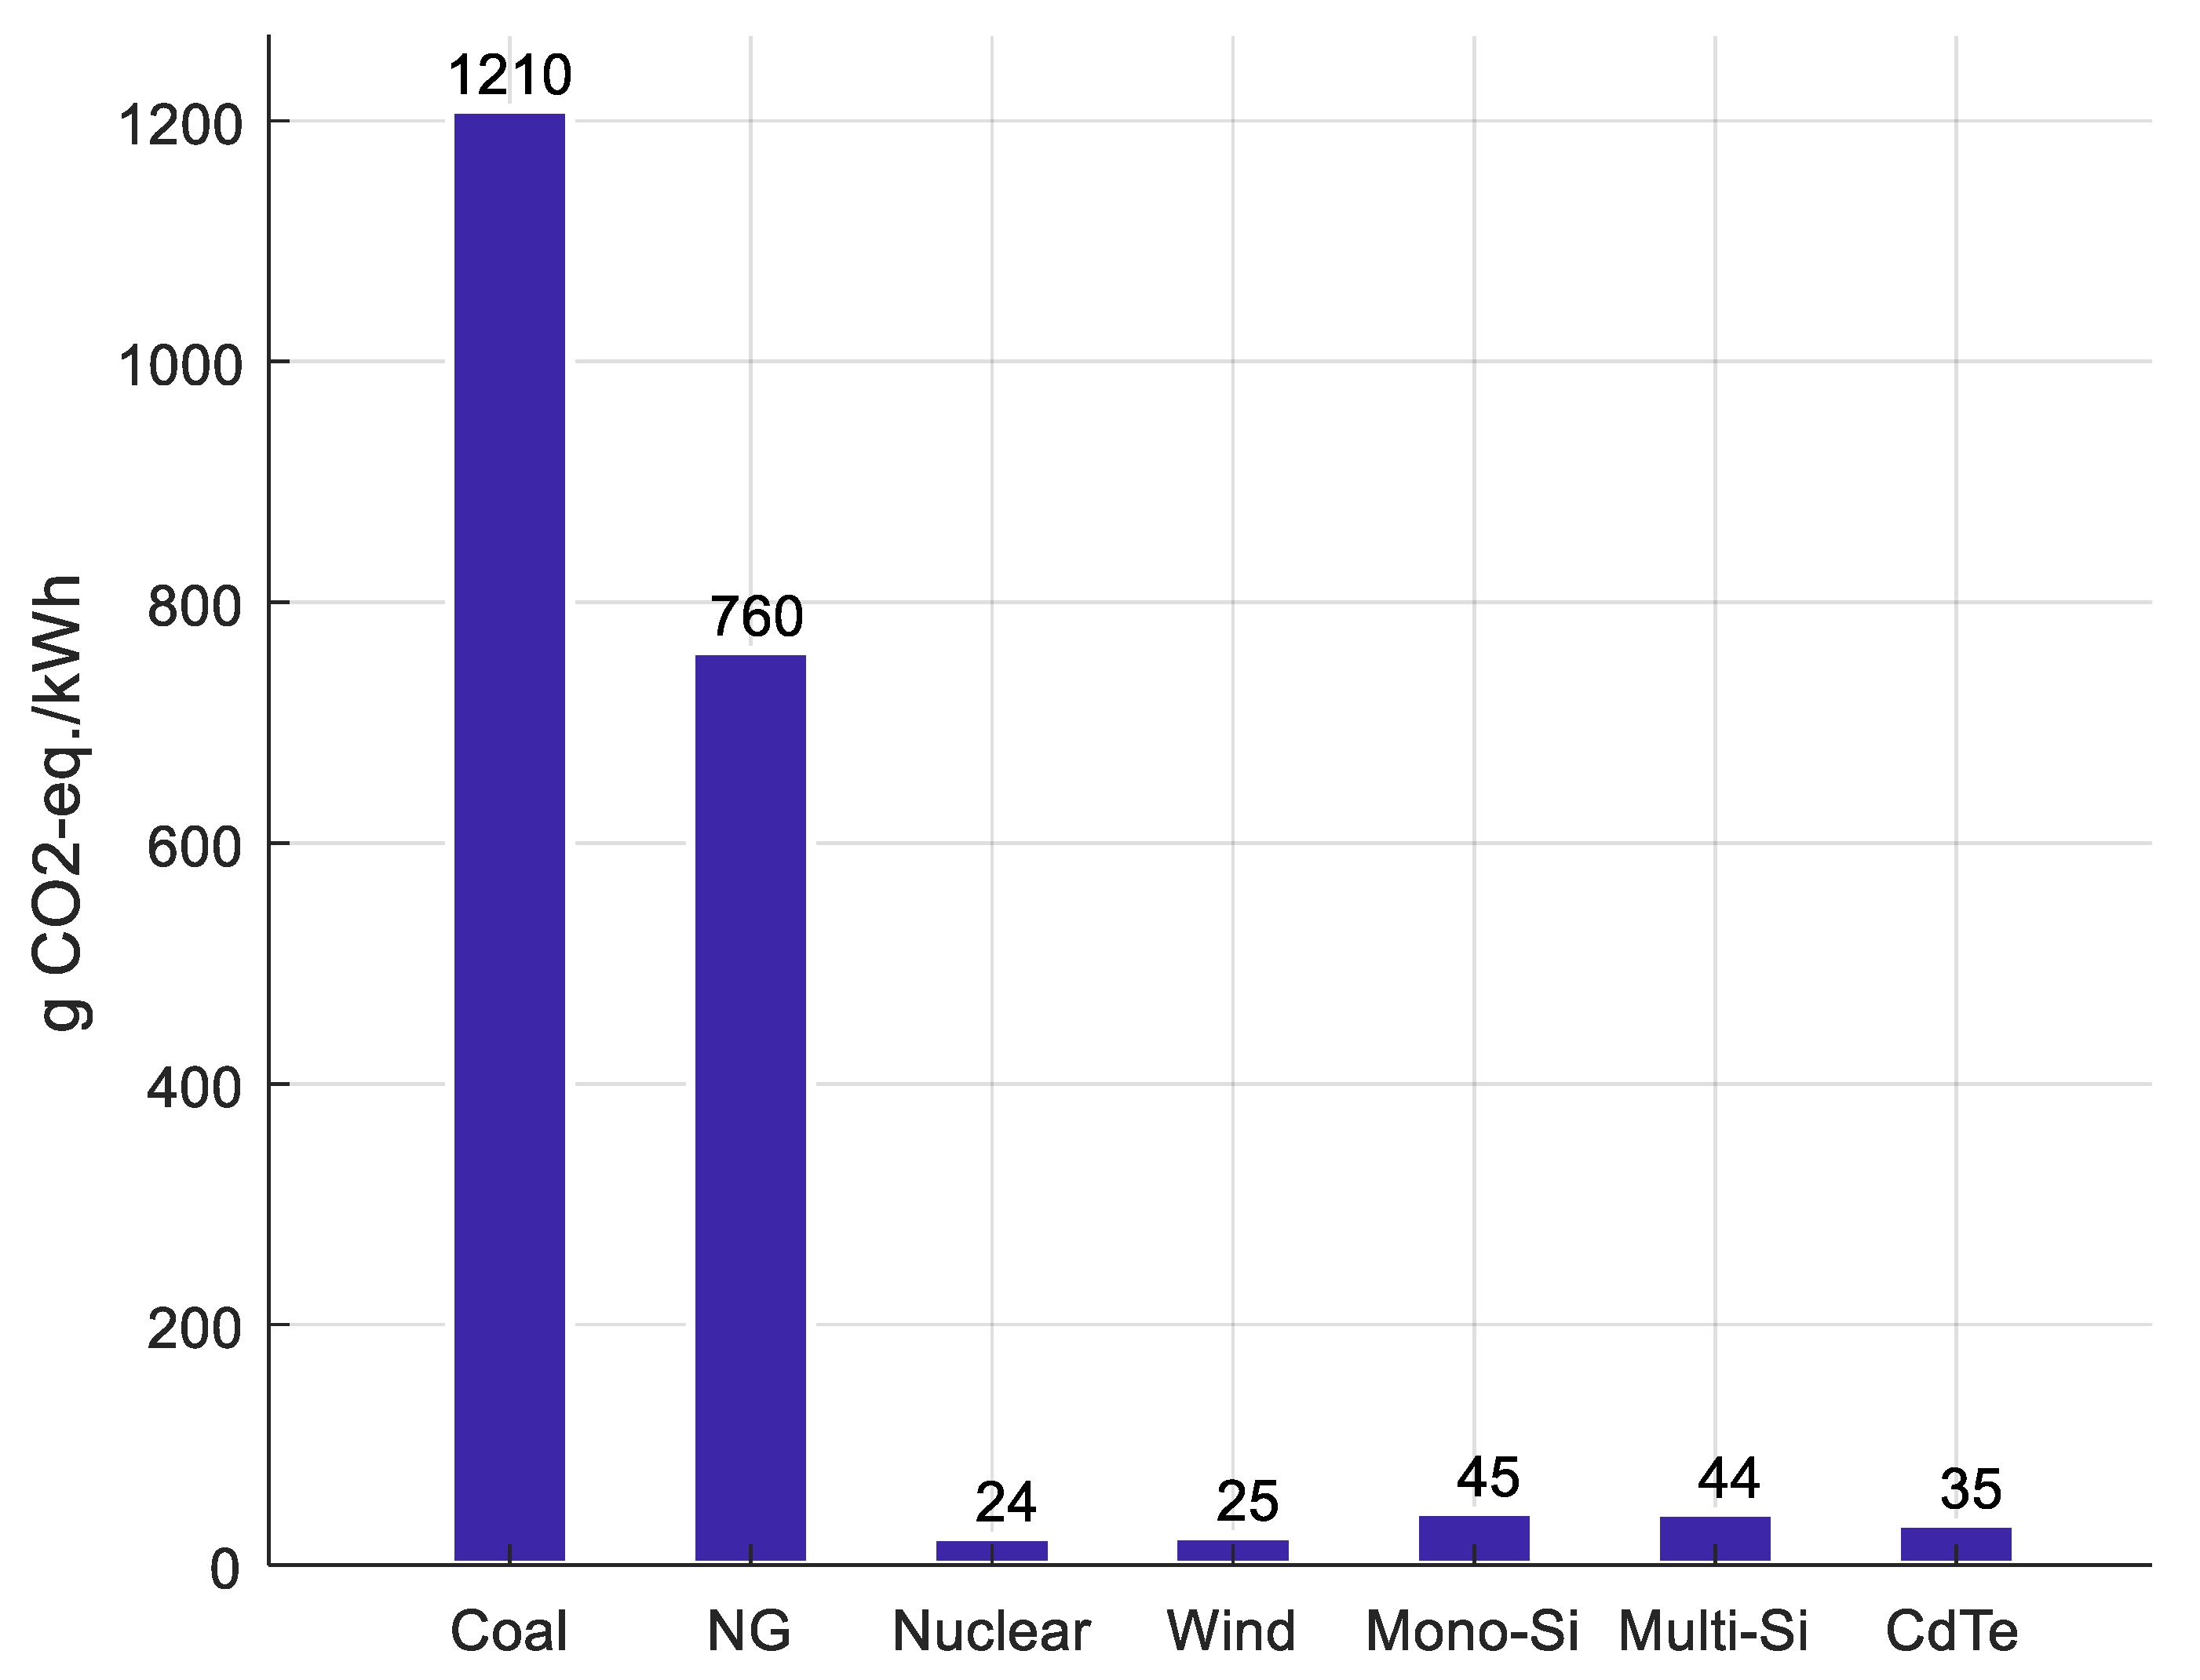
LCA studies show that electricity generated from PV cells has very low GHG emissions compared to electricity generated from fossil fuel sources, as shown in Figure 4. Meanwhile, the figure also shows that other sources of energy, such as nuclear, have comparable GHG emissions with PV cell systems.
3.3. Cumulative Energy Demand (CED)
This is defined as the cumulative energy demand, measured in units of (MJ) of primary energy, that is required to build one meter square of a PV cell panel. Historical CED data of PV cells show a reduction in energy demand by time, due to advances in manufacturing technology as shown in Figure 5.
3.4. Risk Factor
Risk potential of PV cells is mainly due to chemicals’ processing, production, and recycling for PV cells. Records show few injuries and economic losses throughout a PV cell’s life. Unlike other energy sectors, the PV sector has never had any major accidents similar to those associated with nuclear reactors.
In all energy sectors, risk can be classified under four main categories, based on the severity of the accident and its frequency of occurrence, as follows [49,52,53]:
- Normal operation risk that has acceptable consequences during normal operation like GHG emissions or chemical waste.
- Routine accidents risk that occur frequently with low impact like small leakage of chemicals and transportation accidents.
- Severe accidents risk that has less occurrence and high impact like nuclear core meltdown or explosion.
- Difficult to evaluate risk like geopolitical and energy security uncertainty.
A considerable amount of toxic and flammable materials are used during PV cells’ processing and manufacturing. The risk during PV cells’ installation and recycling can be neglected because there are no chemicals required [54]. PV cells are much safer and have a low rate of injury compared to other sources of electricity generation. Unless a significant change happens in future PV cells’ production technologies, the same can be assumed when it comes to the risk factors.
4. Fuzzy Based Environmental Sustainability Indicator
The proposed environmental sustainability indicator (ESI) is based on a fuzzy model which is usually processed using a software such as MATLAB [55]. The process of producing the final indicator value based on multiple inputs through the proposed model is demonstrated graphically in Figure 6. The process goes through three main units: Fuzzification unit, Decision-making unit, and Defuzzification unit, with a crisp output from 0 to 10, as a value of the indicator where the lowest represent better environmental impact and better sustainability. As a starting point, the ESI was derived based on four inputs, which are: GHG, EBPT, CED, and PV cell efficiency.
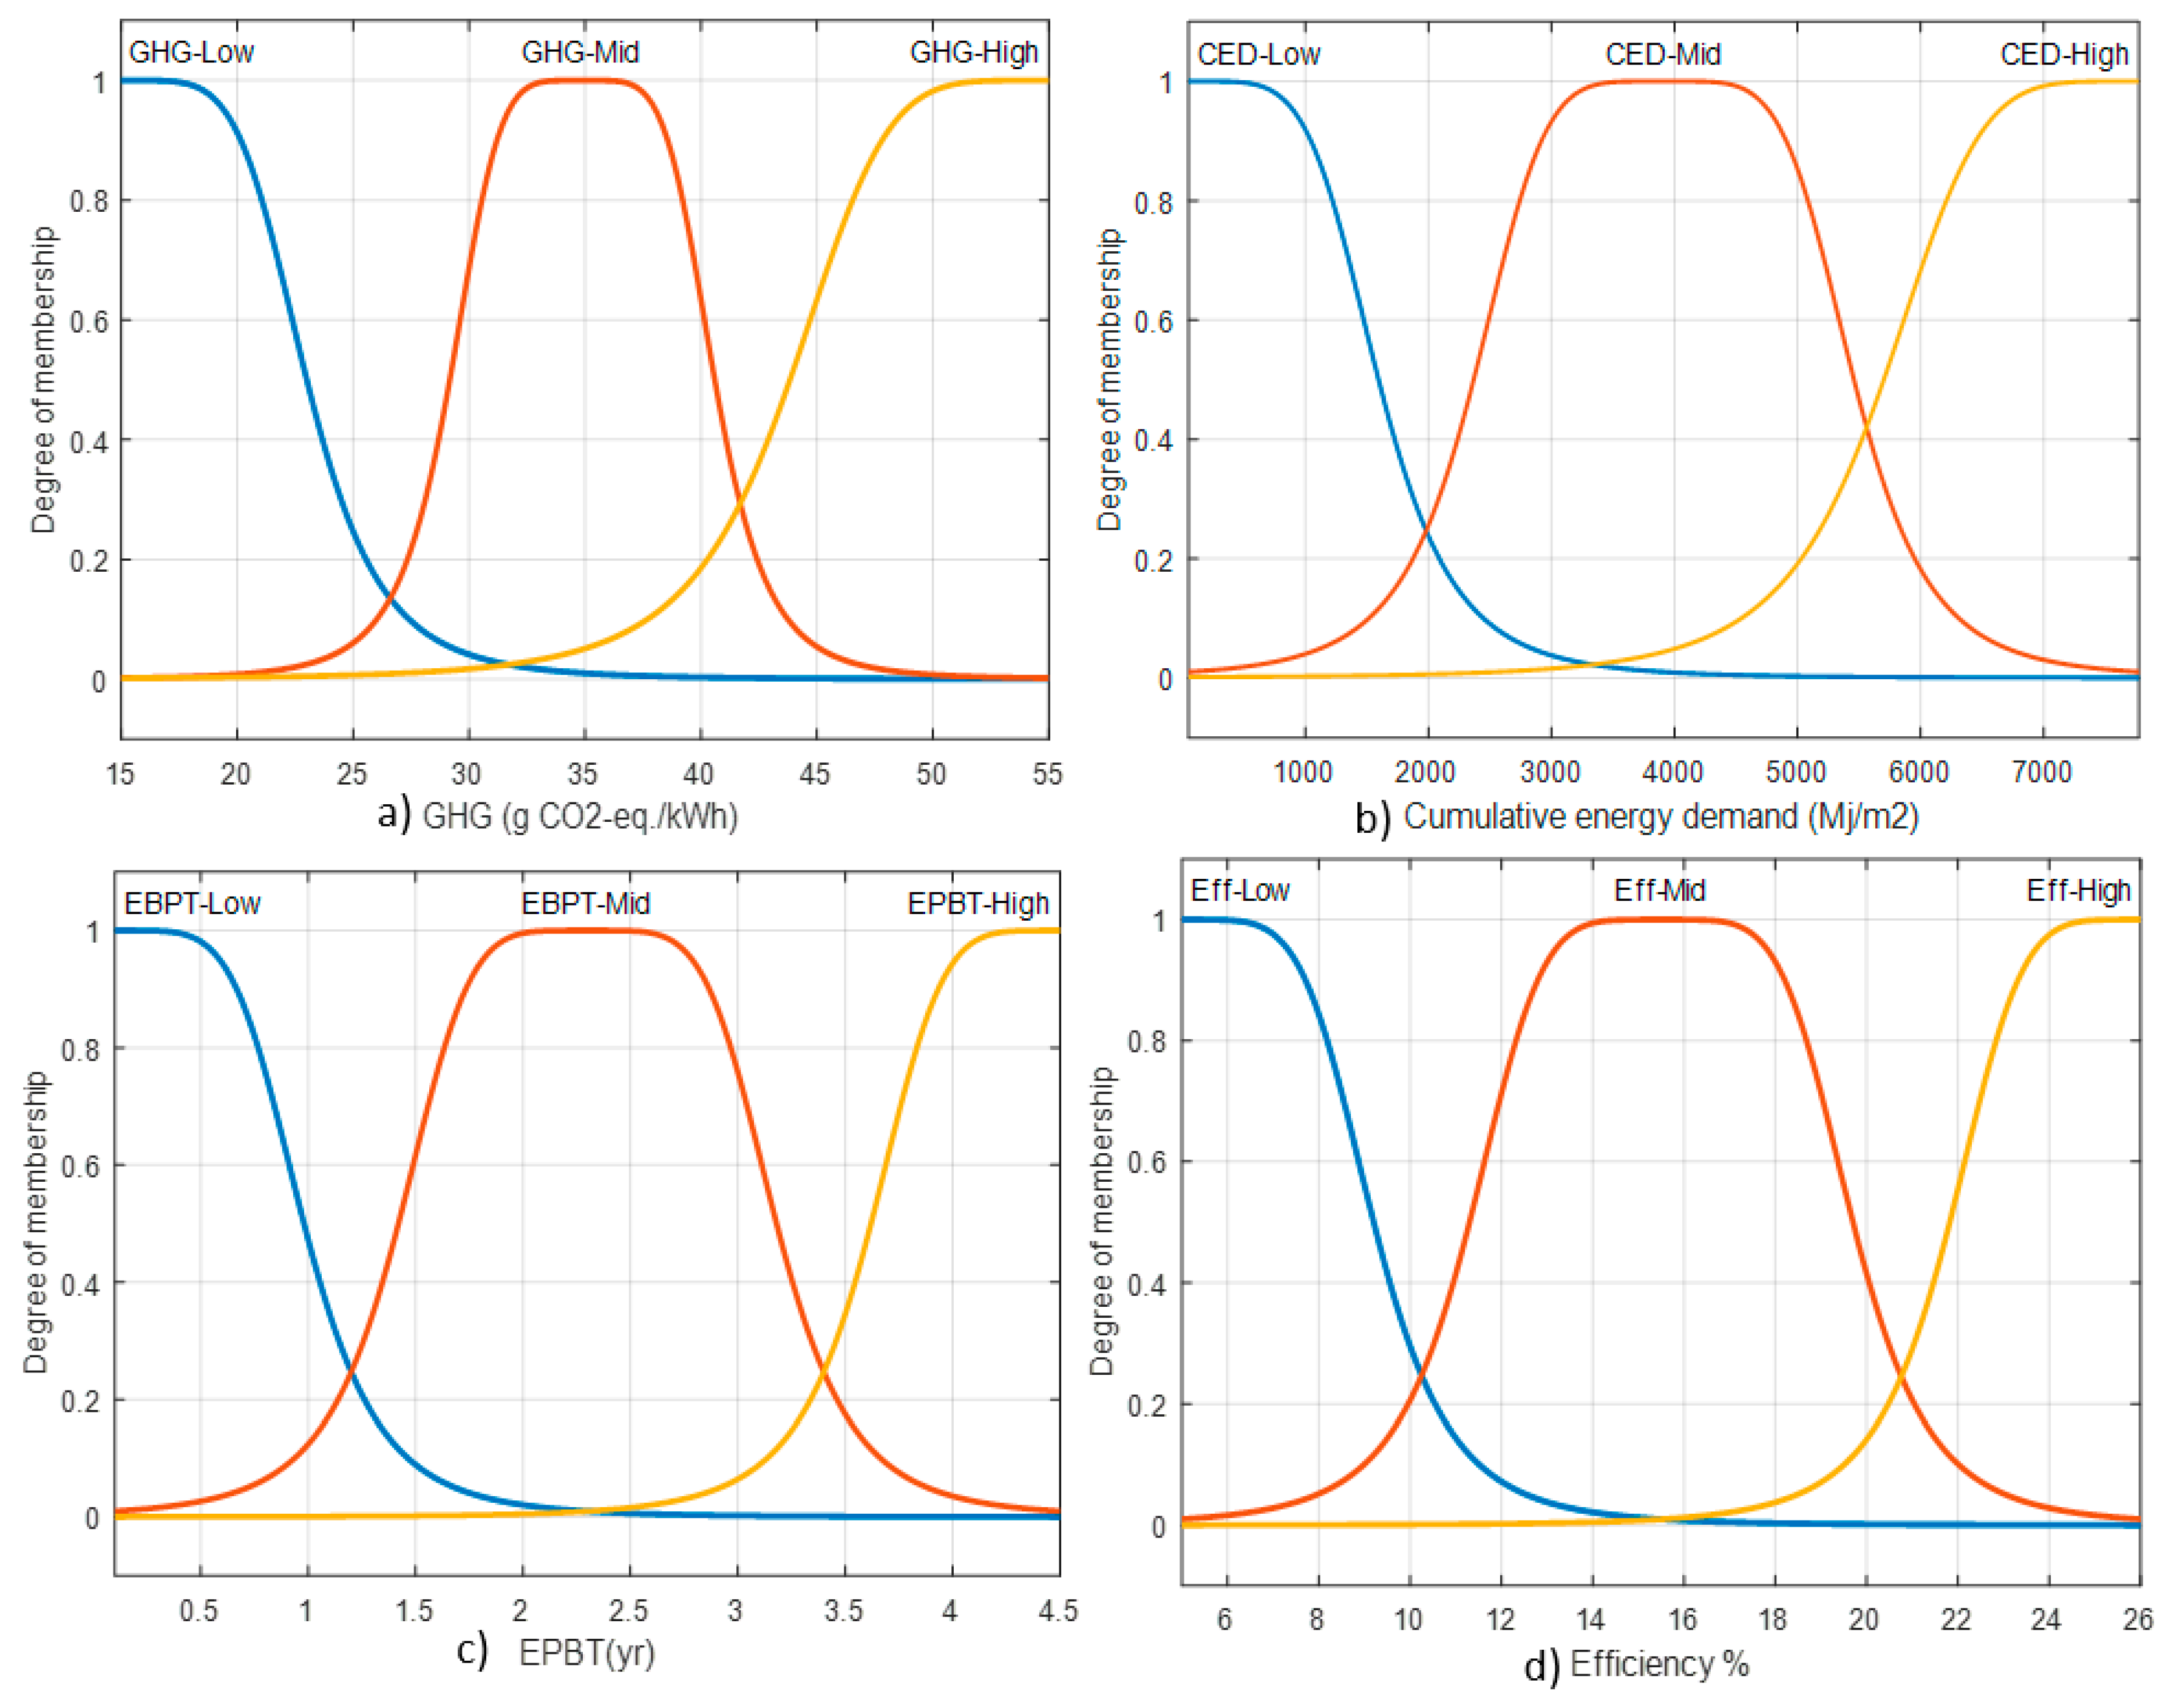
The Fuzzification unit reads the GHG, EPBT, Energy, and efficiency as crisp values and converts these values to fuzzy quantities or linguistic labels like Low, Mid, or High. The conversion process can be done with the help of a Generalized bell-shaped membership function for each input, as shown in Figure 7. Membership functions cover the entire range of possible values for any input. The conversion process from crisp numbers to linguistic labels is similar to the process of converting grades from a percentage value to a letter grade, in a typical college course. A detailed example showing all calculations is provided in Appendix A.
In the decision making unit, the model will read the linguistic values for all inputs and, based on previously stored knowledge and rules, this unit will find the Environmental indicator as a linguistic value from the following: Low, Mid, or High, as shown in Figure 8. The rules of this Fuzzy model were derived based on known and real effects for each input in the LCA. Having four inputs and three membership functions for each results in a total number of combination rules equivalent to different rules (or case) as shown in Figure 9. For example, if GHG value is high, CED is mid, EPBT is mid, and Efficiency is mid then the ESI is high.
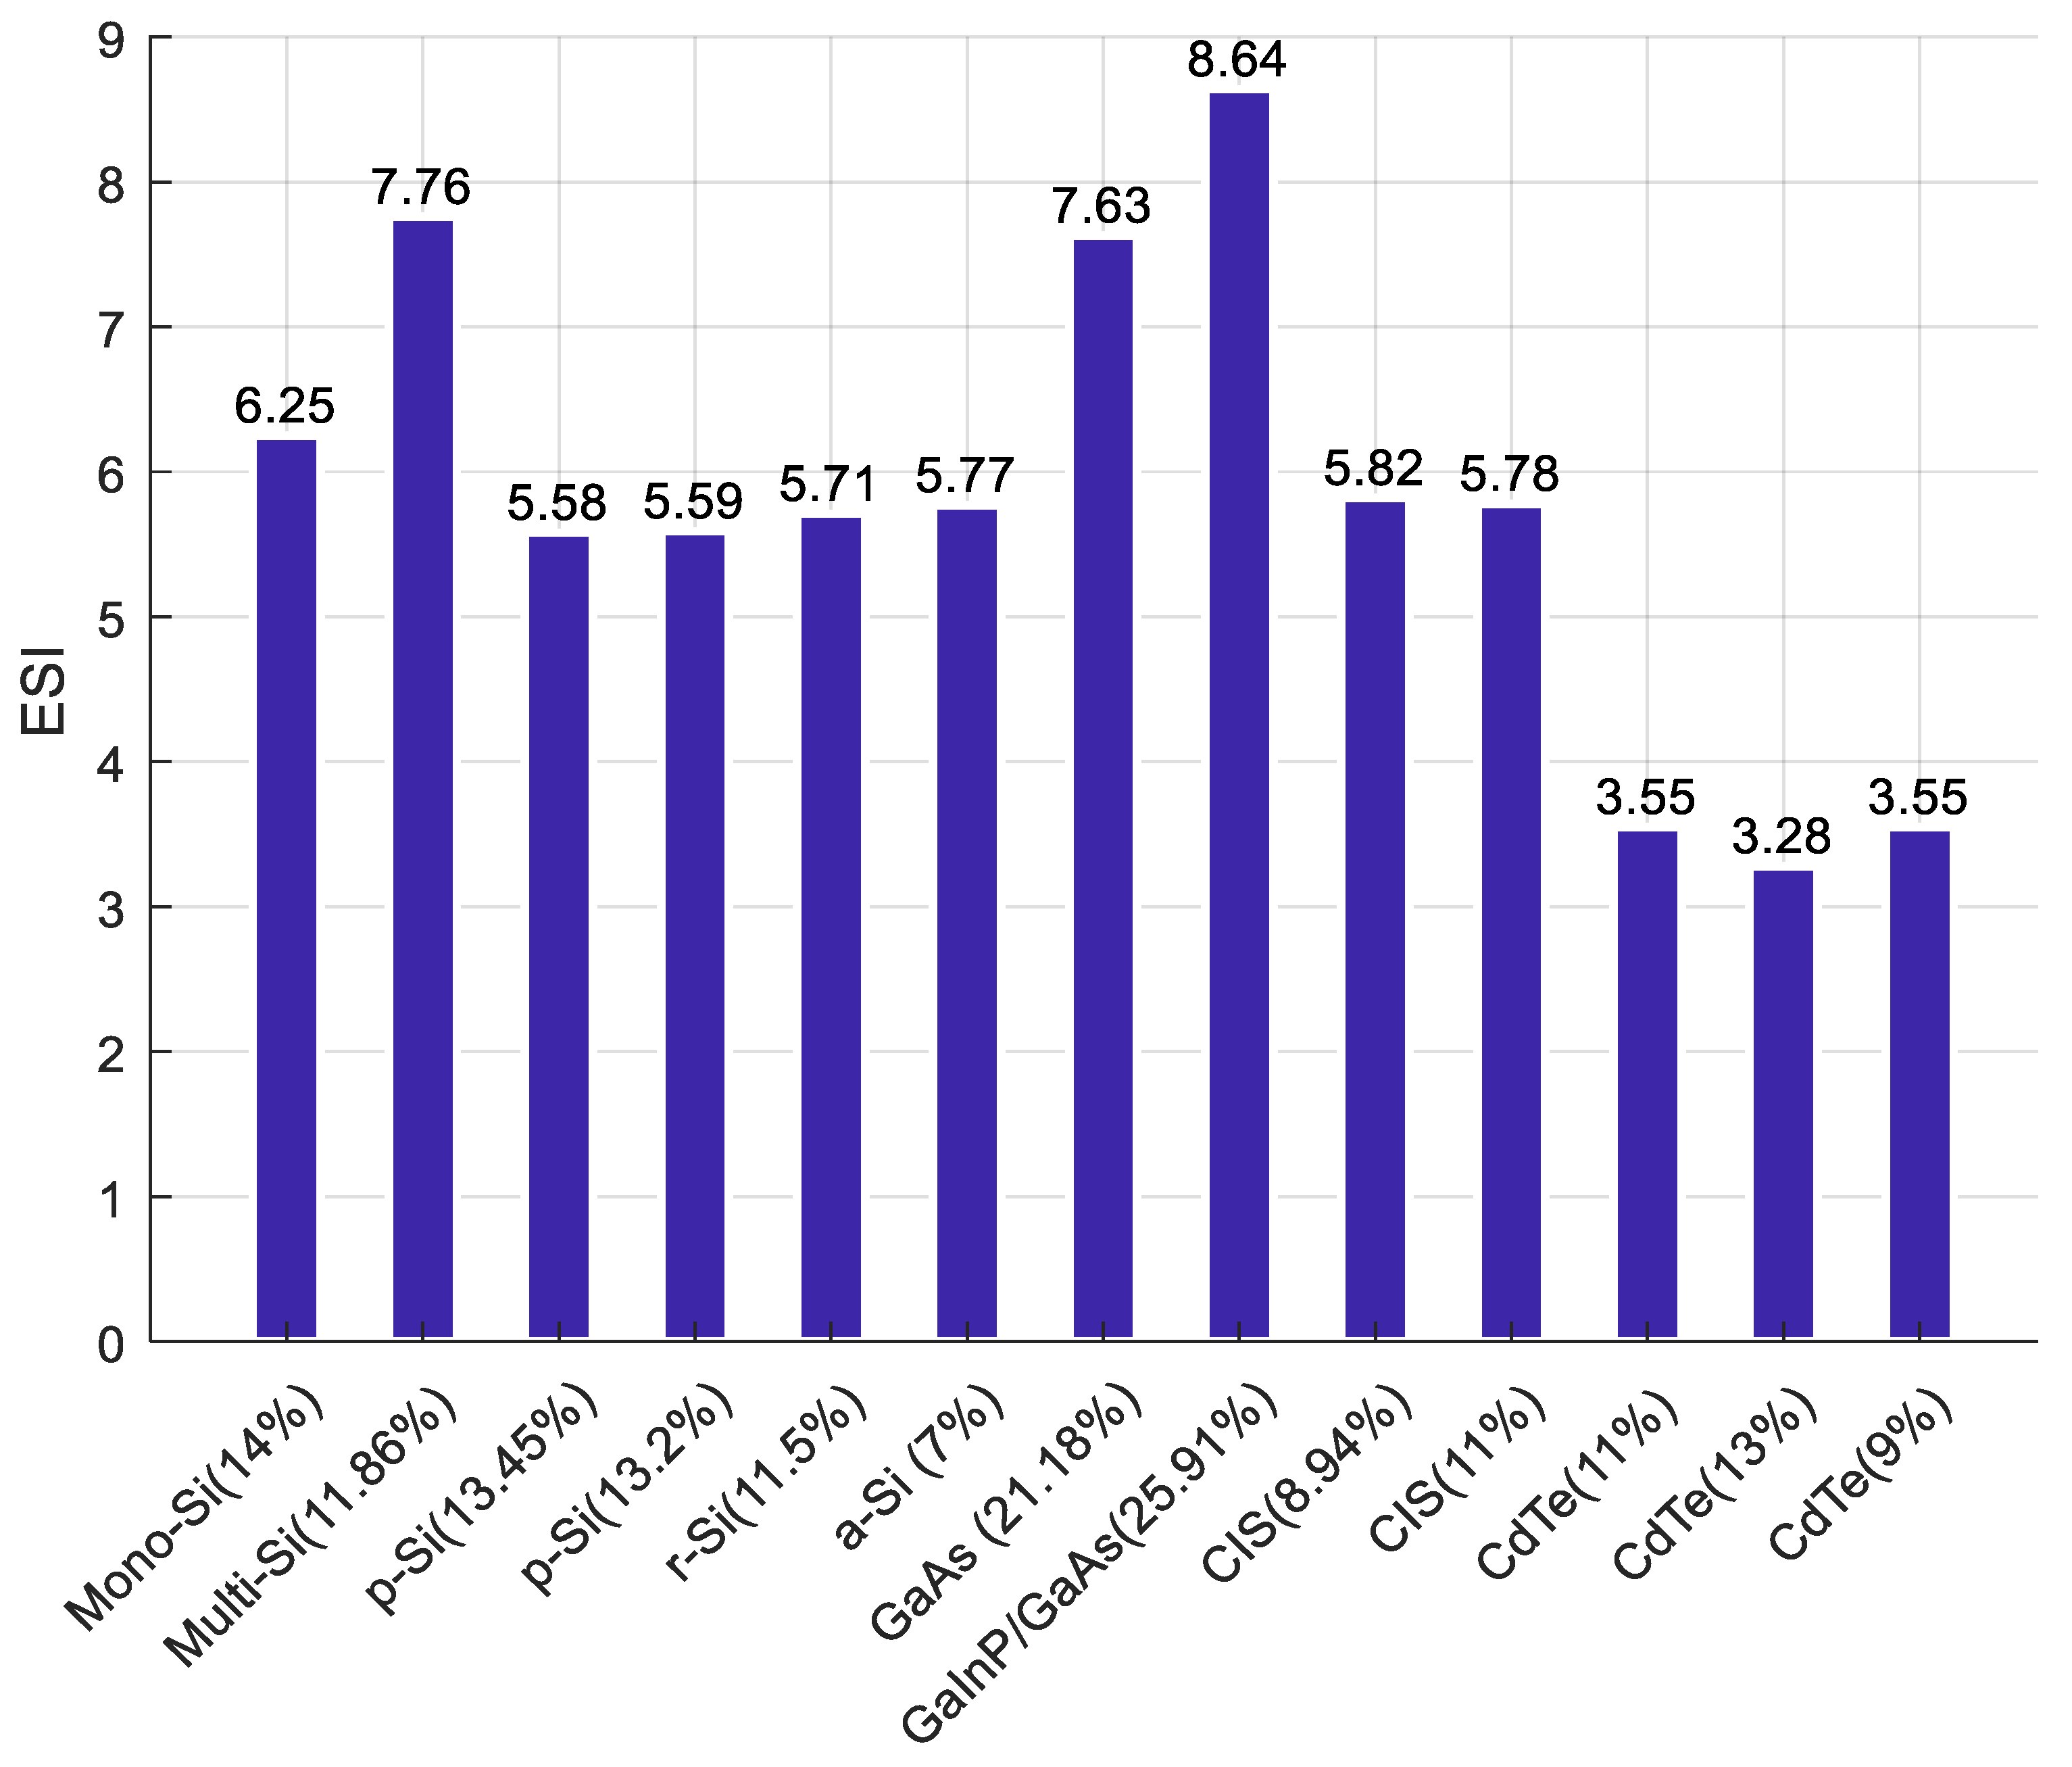
The LCA result in Figure 1 was used as an input to this model to find the ESI. Final model results for ESI show that a-Si PV type cells have the highest value, while Organic Solar Cells (OPV) type PV cells have the lowest result, making them the most environmentally-friendly, or sustainable, product in the group tested, as shown in Figure 10.
5. Conclusions
Use of PV cells has increased significantly due to their efficiency and environmental friendliness, or sustainability. However, when comprehensively considering any LCA of a PV cell, as well as other broader effects, such as societal and health impacts, results indicate less than optimal sustainability and environmental-friendliness. In addition, many PV cells’ producers claim that their product is superior to the competition, without presenting any type of standardized scale for measurement and evaluation of the environmental-friendliness of these products. The best comparisons that can be found in the literature rely on LCAs based on one factor or another, but neither on any combination of factors, nor on any comprehensive evaluation approach.
While LCAs are the correct way to go for measuring and evaluating the sustainability of different PV cells, an enhancement of the entire process can be achieved if a combination of factors can be included in the analysis, leading to a standard scale that can be expanded to include as many factors as needed, and as many products as needed. For example, Figure 2 shows that the p-Si (13.2%) cell has lower GHG emissions compared to the r-Si (11.5%) cell. However, the EPBT comparison shows a different thing because the p-Si (13.2%) has more EPBT than r-Si (11.5%). Consequently, simple numerical comparison to find the most environmentally-friendly PV cell can never provide reliable answers because of these inherent variations in the individual factors (i.e., GHG, EPBT, CED, and efficiency).
The proposed ESI model, explained in this paper, can deal with all these variations and related complexity associated with all factors. Moreover, it provides a standard comparison scale for the sustainability of PV cells. As a starting point, the paper included the major known factors, such as: EPBT, GHG, CED, and efficiency. However, the model is flexible and able to include any other factors as needed, or as they become available.
The model presented in this paper is a fuzzy logic-based model that allows such combination of complex non-linear factors to occur, as desired by the user, producing results in a standard scale that can provide comparisons between many products simultaneously. These results are critical to users, policymakers, and manufacturers, in decisions answering questions like: which PV cell type is the most suitable for the intended application with consideration to sustainability, and where improvements can be applied to achieve superior performance and comprehensive sustainability compared to existing PV cells in the market, to name a few.
Author Contributions
Conceptualization, M.B.S., D.D., N.B.. Methodology, D.D. and N.B.; Software, M.B.S.; Validation, N.B.; Formal analysis, M.B.S. and N.B.; Investigation, D.D.; Resources, D.D.; Data curation, M.B.S.; Writing—original draft, M.B.S.; Writing—review & editing, D.D. and N.B.; Visualization, D.D., N.B.; Supervision, D.D. and N.B.; Project Administration, N.B.; Funding: no external funding.
Funding
This research received no external funding.
Conflicts of Interest
The authors declare no conflict of interest.
Nomenclature
| LCA | Life cycle analysis |
| PV | Photovoltaic |
| LPG | Liquefied petroleum gas |
| GHG | Greenhouse gas |
| EPBT | Energy payback time |
| CED | Cumulative energy demand |
| OECD | The Organization for Economic Co-operation and Development |
| BNL | Brookhaven National Laboratory |
| NG | Natural gas |
| PSI | Paul Scherrer Institute |
| CdTe | Cadmium Telluride |
| CIS | Copper indium diselenide |
| GaAs | Gallium arsenide |
| GWP | Global warming potential |
| PED | Primary energy demand |
| NOx | Nitrogen oxide |
| SOx | Sulfur oxide |
| mc-Si | Multi-crystalline silicon |
| a-Si | Amorphous silicon |
| c-Si | Crystalline silicon |
| HF | Hydrogen fluoride |
| SiHCl3 | Trichlorosilane |
| HCl | Hydrogen chloride |
| EIF | Environmental Impact Factor |
| FIE | Fuzzy inference engine |
| Wp | Watt peak capacity |
| ISO | International Organization for Standardization |
Appendix A. ESI Calculation Example
This example demonstrates how the ESI is calculated based on the proposed model. Consider the case of Mono Silicon as shown in Figure 1, which has GHG = 45 g Co2 eq/kWh, CED = 5253 MJ/m2, EPBT = 2.7 year, and Efficiency = 14%. The first step includes Fuzzification of all inputs using Figure 7 to find the corresponding membership value for each one of the four inputs and at every membership function: Low, Mid, and High. Results are shown in Table A1.

Table A1.
Membership values for the Mono Silicon case from Figure 7.
Table A1.
Membership values for the Mono Silicon case from Figure 7.
| GHG = 45 | CED = 5253 | EPBT = 2.7 | Efficiency = 14 | |
|---|---|---|---|---|
| Low | 0 | 0 | 0 | 0.021 |
| Mid | 0.054 | 0.7 | 0.983 | 0.994 |
| High | 0.634 | 0.271 | 0.0265 | 0.005 |
The second step includes using all of the 81 rules shown in Figure 9 to find the ESI number. For the example at hand, and using Table A1, GHG is High, CED is Mid, EPBT is Mid, and the Efficiency is Mid, which correspond as shown in Figure 9 and Table A2. The following steps are applied to this case:
- Substitute the input membership values inside the rule as shown in Table A2.
- Take the minimum of these values, which is 0.634 for this case.
- Based on this rule, the ESI is high.
The next step includes investigating the ESI-high function in Figure 8 (Output membership functions). This is followed by calculating the area under y = 0.634 in the ESI-High function as shown in Figure A1.
Table A2.
Membership values for the Mono Silicon case from Figure 7.
Table A2.
Membership values for the Mono Silicon case from Figure 7.
| Rule | GHG-High | CED-Mid | EPBT-Mid | Eff-Mid | Min | EIF-High |
|---|---|---|---|---|---|---|
| Value | 0.634 | 0.7 | 0.983 | 0.994 | 0.634 | EIF-High |
Figure A1.
Area under the ESI-High membership functions.

Finally, during the de-Fuzzification step, steps A, B, C, and the area under the curve calculation are repeated for the 81 rules, resulting in an output which is a certain area under one of the membership functions, per each attempt. The sum of all of these areas together as shown in Figure A2 provides a total area where the centroid of this area will be the output of the fuzzy model, or it is the ESI for the Mono Silicon which is 6.26.
Figure A2.
ESI number extraction during defuzzification.

References
- International Energy Agency. Available online: https://www.iea.org/ (accessed on 11 May 2018).
- Nugent, D.; Sovacool, B.K. Assessing the lifecycle greenhouse gas emissions from solar PV and wind energy: A critical meta-survey. Energy Policy 2014, 65, 229–244. [Google Scholar] [CrossRef]
- Vellini, M.; Gambini, M.; Prattella, V. Environmental impacts of PV technology throughout the life cycle: Importance of the end-of-life management for Si-panels and CdTe-panels. Energy 2017, 138, 1099–1111. [Google Scholar] [CrossRef]
- Xu, L.; Zhang, S.; Yang, M.; Li, W.; Xu, J. Environmental effects of China’s solar photovoltaic industry during 2011–2016: A life cycle assessment approach. J. Clean. Prod. 2018, 170, 310–329. [Google Scholar] [CrossRef]
- Gerbinet, S.; Belboom, S.; Léonard, A. Life Cycle Analysis (LCA) of photovoltaic panels: A review. Renew. Sustain. Energy Rev. 2014, 38, 747–753. [Google Scholar] [CrossRef]
- Berger, W.; Simon, F.-G.; Weimann, K.; Alsema, E.A. A novel approach for the recycling of thin film photovoltaic modules. Resour. Conserv. Recycl. 2010, 54, 711–718. [Google Scholar] [CrossRef]
- Meijer, A.; Huijbregts, M.A.J.; Schermer, J.J.; Reijnders, L. Life-cycle assessment of photovoltaic modules: Comparison of mc-Si, InGaP and InGaP/mc-Si solar modules. Prog. Photovolt. Res. Appl. 2003, 11, 275–287. [Google Scholar] [CrossRef] [Green Version]
- Drouiche, N.; Cuellar, P.; Kerkar, F.; Medjahed, S.; Boutouchent-Guerfi, N.; Hamou, M.O. Recovery of solar grade silicon from kerf loss slurry waste. Renew. Sustain. Energy Rev. 2014, 32, 936–943. [Google Scholar] [CrossRef]
- Contreras-Lisperguer, R.; Muñoz-Cerón, E.; Aguilera, J.; de la Casa, J. Cradle-to-cradle approach in the life cycle of silicon solar photovoltaic panels. J. Clean. Prod. 2017, 168, 51–59. [Google Scholar] [CrossRef]
- Sumper, A.; Robledo-García, M.; Villafáfila-Robles, R.; Bergas-Jané, J.; Andrés-Peiró, J. Life-cycle assessment of a photovoltaic system in Catalonia (Spain). Renew. Sustain. Energy Rev. 2011, 15, 3888–3896. [Google Scholar] [CrossRef]
- Perez, M.J.R.; Fthenakis, V.; Kim, H.-C.; Pereira, A.O. Façade–integrated photovoltaics: A life cycle and performance assessment case study. Prog. Photovolt. Res. Appl. 2012, 20, 975–990. [Google Scholar] [CrossRef]
- Perpiñan, O.; Lorenzo, E.; Castro, M.A.; Eyras, R. Energy payback time of grid connected PV systems: Comparison between tracking and fixed systems. Prog. Photovolt. Res. Appl. 2009, 17, 137–147. [Google Scholar] [CrossRef] [Green Version]
- Goe, M.; Gaustad, G. Strengthening the case for recycling photovoltaics: An energy payback analysis. Applied Energy 2014, 120, 41–48. [Google Scholar] [CrossRef]
- Pacca, S.; Sivaraman, D.; Keoleian, G.A. Parameters affecting the life cycle performance of PV technologies and systems. Energy Policy 2007, 35, 3316–3326. [Google Scholar] [CrossRef]
- Stoppato, A. Life cycle assessment of photovoltaic electricity generation. Energy 2008, 33, 224–232. [Google Scholar] [CrossRef]
- Zhang, J.; Gao, X.; Deng, Y.; Zha, Y.; Yuan, C. Comparison of life cycle environmental impacts of different perovskite solar cell systems. Sol. Energy Mater. Solar Cells 2017, 166, 9–17. [Google Scholar] [CrossRef]
- Çelik, I.; Song, Z.; Cimaroli, A.J.; Yan, Y.; Heben, M.; Apul, D. Life Cycle Assessment (LCA) of perovskite PV cells projected from lab to fab. Sol. Energy Mater. Solar Cells 2016, 156, 157–169. [Google Scholar] [CrossRef]
- Emmott, C.J.M.; Ekins-Daukes, N.J.; Nelson, J. Dynamic carbon mitigation analysis: The role of thin-film photovoltaics. Energy Environ. Sci. 2014, 7, 1810–1818. [Google Scholar] [CrossRef]
- Raugei, M.; Frankl, P. Life cycle impacts and costs of photovoltaic systems: Current state of the art and future outlooks. Energy 2009, 34, 392–399. [Google Scholar] [CrossRef]
- Emmott, C.J.M.; Urbina, A.; Nelson, J. Environmental and economic assessment of ITO-free electrodes for organic solar cells. Sol. Energy Mater. Sol. Cells 2012, 97, 14–21. [Google Scholar] [CrossRef]
- Asdrubali, F.; Baldinelli, G.; D’Alessandro, F.; Scrucca, F. Life cycle assessment of electricity production from renewable energies: Review and results harmonization. Renew. Sustain. Energy Rev. 2015, 42, 1113–1122. [Google Scholar] [CrossRef]
- Peng, J.; Lu, L.; Yang, H. Review on life cycle assessment of energy payback and greenhouse gas emission of solar photovoltaic systems. Renew. Sustain. Energy Rev. 2013, 19, 255–274. [Google Scholar] [CrossRef]
- Lunardi, M.M.; Moore, S.; Alvarez-Gaitan, J.P.; Yan, C.; Hao, X.; Corkish, R. A comparative life cycle assessment of chalcogenide/Si tandem solar modules. Energy 2018, 145, 700–709. [Google Scholar] [CrossRef]
- Lizin, S.; van Passel, S.; de Schepper, E.; Maes, W.; Lutsen, L.; Manca, J.; Vanderzande, D. Life cycle analyses of organic photovoltaics: A review. Energy Environ. Sci. 2013, 6, 3136–3149. [Google Scholar] [CrossRef]
- García-Valverde, R.; Cherni, J.A.; Urbina, A. Life cycle analysis of organic photovoltaic technologies. Prog. Photovolt. Res. Appl. 2010, 18, 535–558. [Google Scholar] [CrossRef] [Green Version]
- Jungbluth, N.; Bauer, C.; Dones, R.; Frischknecht, R. Life Cycle Assessment for Emerging Technologies: Case Studies for Photovoltaic and Wind Power. Int. J. Life Cycle Assess. 2005, 10, 24–34. [Google Scholar] [CrossRef]
- Desideri, U.; Proietti, S.; Zepparelli, F.; Sdringola, P.; Bini, S. Life Cycle Assessment of a ground-mounted 1778 kWp photovoltaic plant and comparison with traditional energy production systems. Appl. Energy 2012, 97, 930–943. [Google Scholar] [CrossRef]
- Bayod-Rújula, Á.A.; Lorente-Lafuente, A.M.; Cirez-Oto, F. Environmental assessment of grid connected photovoltaic plants with 2-axis tracking versus fixed modules systems. Energy 2011, 36, 3148–3158. [Google Scholar] [CrossRef]
- Menoufi, K.; Chemisana, D.; Rosell, J.I. Life Cycle Assessment of a Building Integrated Concentrated Photovoltaic scheme. Appl. Energy 2013, 111, 505–514. [Google Scholar] [CrossRef]
- Eco-Indicator 99 Manual for Designers. Available online: https://www.pre-sustainability.com/download/EI99_Manual.pdf (accessed on 1 May 2018).
- Eco-Indicator 99: GaBi Software. Available online: http://www.gabi-software.com/support/gabi/gabi-5-lcia-documentation/life-cycle-impact-assessment-lcia-methods/eco-indicator-99/ (accessed on 22 May 2018).
- SimaPro for Business—For Fact-Based Sustainability in Business. SimaPro. Available online: https://simapro.com/business/ (accessed on 22 May 2018).
- Liu, G.; Baniyounes, A.; Rasul, M.G.; Amanullah, M.T.O.; Khan, M.M.K. Fuzzy Logic based Environmental Indicator for Sustainability Assessment of Renewable Energy System using Life Cycle Assessment. Procedia Eng. 2012, 49, 35–41. [Google Scholar] [CrossRef]
- Bitter, J.; Printz, S.; Lahl, K.; Vossen, R.; Jeschke, S. Approach to Sustainability Assessment of Renewable Energy Technologies combining Fuzzy Logic with the Integrative Sustainability Triangle. Int. J. Sustain. Energy Dev. 2016, 5, 252–262. [Google Scholar] [CrossRef]
- Sabaghi, M.; Mascle, C.; Baptiste, P.; Rostamzadeh, R. Sustainability assessment using fuzzy-inference technique (SAFT): A methodology toward green products. Expert Syst. Appl. 2016, 56, 69–79. [Google Scholar] [CrossRef]
- Piluso, C.; Huang, J.; Liu, Z.; Huang, Y. Sustainability Assessment of Industrial Systems under Uncertainty: A Fuzzy Logic Based Approach to Short-Term to Midterm Predictions. Ind. Eng. Chem. Res. 2010, 49, 8633–8643. [Google Scholar] [CrossRef]
- Goe, M.; Gaustad, G. Estimating direct climate impacts of end-of-life solar photovoltaic recovery. Solar Energy Mater. Solar Cells 2016, 156, 27–36. [Google Scholar] [CrossRef]
- Bogacka, M.; Pikoń, K.; Landrat, M. Environmental impact of PV cell waste scenario. Waste Manag. 2017, 70, 198–203. [Google Scholar] [CrossRef] [PubMed]
- Weidema, B.P. The Integration of Economic and Social Aspects in Life Cycle Impact Assessment. Int. J. Life Cycle Assess. 2006, 11, 89–96. [Google Scholar] [CrossRef]
- Leung, C.; Yu, I.; Chen, W. Silicosis, The Lancet. Available online: https://www.sciencedirect.com/science/article/pii/S0140673612602359 (accessed on 14 December 2018).
- Chau, C.K.; Leung, T.M.; Ng, W.Y. A review on Life Cycle Assessment, Life Cycle Energy Assessment and Life Cycle Carbon Emissions Assessment on buildings. Appl. Energy 2015, 143, 395–413. [Google Scholar] [CrossRef]
- Astrup, T.F.; Tonini, D.; Turconi, R.; Boldrin, A. Life cycle assessment of thermal Waste-to-Energy technologies: Review and recommendations. Waste Manag. 2015, 37, 104–115. [Google Scholar] [CrossRef] [Green Version]
- Liang, Y.; Su, J.; Xi, B.; Yu, Y.; Ji, D.; Cui, Y.S.C.; Zhu, J. Life cycle assessment of lithium-ion batteries for greenhouse gas emissions. Resour. Conserv. Recycl. 2017, 117, 285–293. [Google Scholar] [CrossRef]
- Bustamante, M.L.; Hubler, B.; Gaustad, G.; Babbitt, C.W. Life cycle assessment of jointly produced solar energy materials: Challenges and best practices. Sol. Energy Mater. Sol. Cells 2016, 156, 11–26. [Google Scholar] [CrossRef]
- Xie, M.; Ruan, J.; Bai, W.; Qiao, Q.; Bai, L.; Zhang, J.; Li, H.; Lv, F.; Fu, H. Pollutant payback time and environmental impact of Chinese multi-crystalline photovoltaic production based on life cycle assessment. J. Clean. Prod. 2018, 184, 648–659. [Google Scholar] [CrossRef]
- Wu, P.; Ma, X.; Ji, J.; Ma, Y. Review on Life Cycle Assessment of Energy Payback of Solar Photovoltaic Systems and a Case Study. Energy Procedia 2017, 105, 68–74. [Google Scholar] [CrossRef]
- Tripathy, M.; Joshi, H.; Panda, S.K. Energy payback time and life-cycle cost analysis of building integrated photovoltaic thermal system influenced by adverse effect of shadow. Appl. Energy 2017, 208, 376–389. [Google Scholar] [CrossRef]
- Anctil, A.; Babbitt, C.; Landi, B.; Raffaelle, R.P. Life-cycle assessment of organic solar cell technologies. In Proceedings of the 2010 35th IEEE Photovoltaic Specialists Conference, Honolulu, HI, USA, 20–25 June 2010; pp. 000742–000747. [Google Scholar]
- Fthenakis, V.M.; Kim, H.C. Photovoltaics: Life-cycle analyses. Solar Energy 2011, 85, 1609–1628. [Google Scholar] [CrossRef]
- Evans, A.; Strezov, V.; Evans, T.J. Assessment of sustainability indicators for renewable energy technologies. Renew. Sustain. Energy Rev. 2009, 13, 1082–1088. [Google Scholar] [CrossRef]
- Kreiger, M.; Pearce, J.M. Environmental Life Cycle Analysis of Distributed Three-Dimensional Printing and Conventional Manufacturing of Polymer Products. ACS Sustain. Chem. Eng. 2013, 1, 1511–1519. [Google Scholar] [CrossRef]
- Spada, M.; Paraschiv, F.; Burgherr, P. A comparison of risk measures for accidents in the energy sector and their implications on decision-making strategies. Energy 2018, 154, 277–288. [Google Scholar] [CrossRef] [Green Version]
- Burgherr, P.; Hirschberg, S. Comparative risk assessment of severe accidents in the energy sector. Energy Policy 2014, 74, S45–S56. [Google Scholar] [CrossRef]
- Fthenakis, V.M.; Kim, H.C.; Colli, A.; Kirchsteiger, C. Evaluation of Risks in the Life Cycle of Photovoltaics in a Comparative Context. Available online: http://www.clca.columbia.edu/papers/8CO.1.2_Dresden_Risk_06.pdf (accessed on 5 April 2018).
- MATLAB—MathWorks. Available online: https://www.mathworks.com/products/matlab.html (accessed on 22 May 2018).

Figure 2.
LCA results for 13 PV cells [25].
Figure 2.
LCA results for 13 PV cells [25].

Figure 3.
Framework of life cycle assessment.


Figure 6.
Fuzzy Environmental Indicator Evaluation Process.
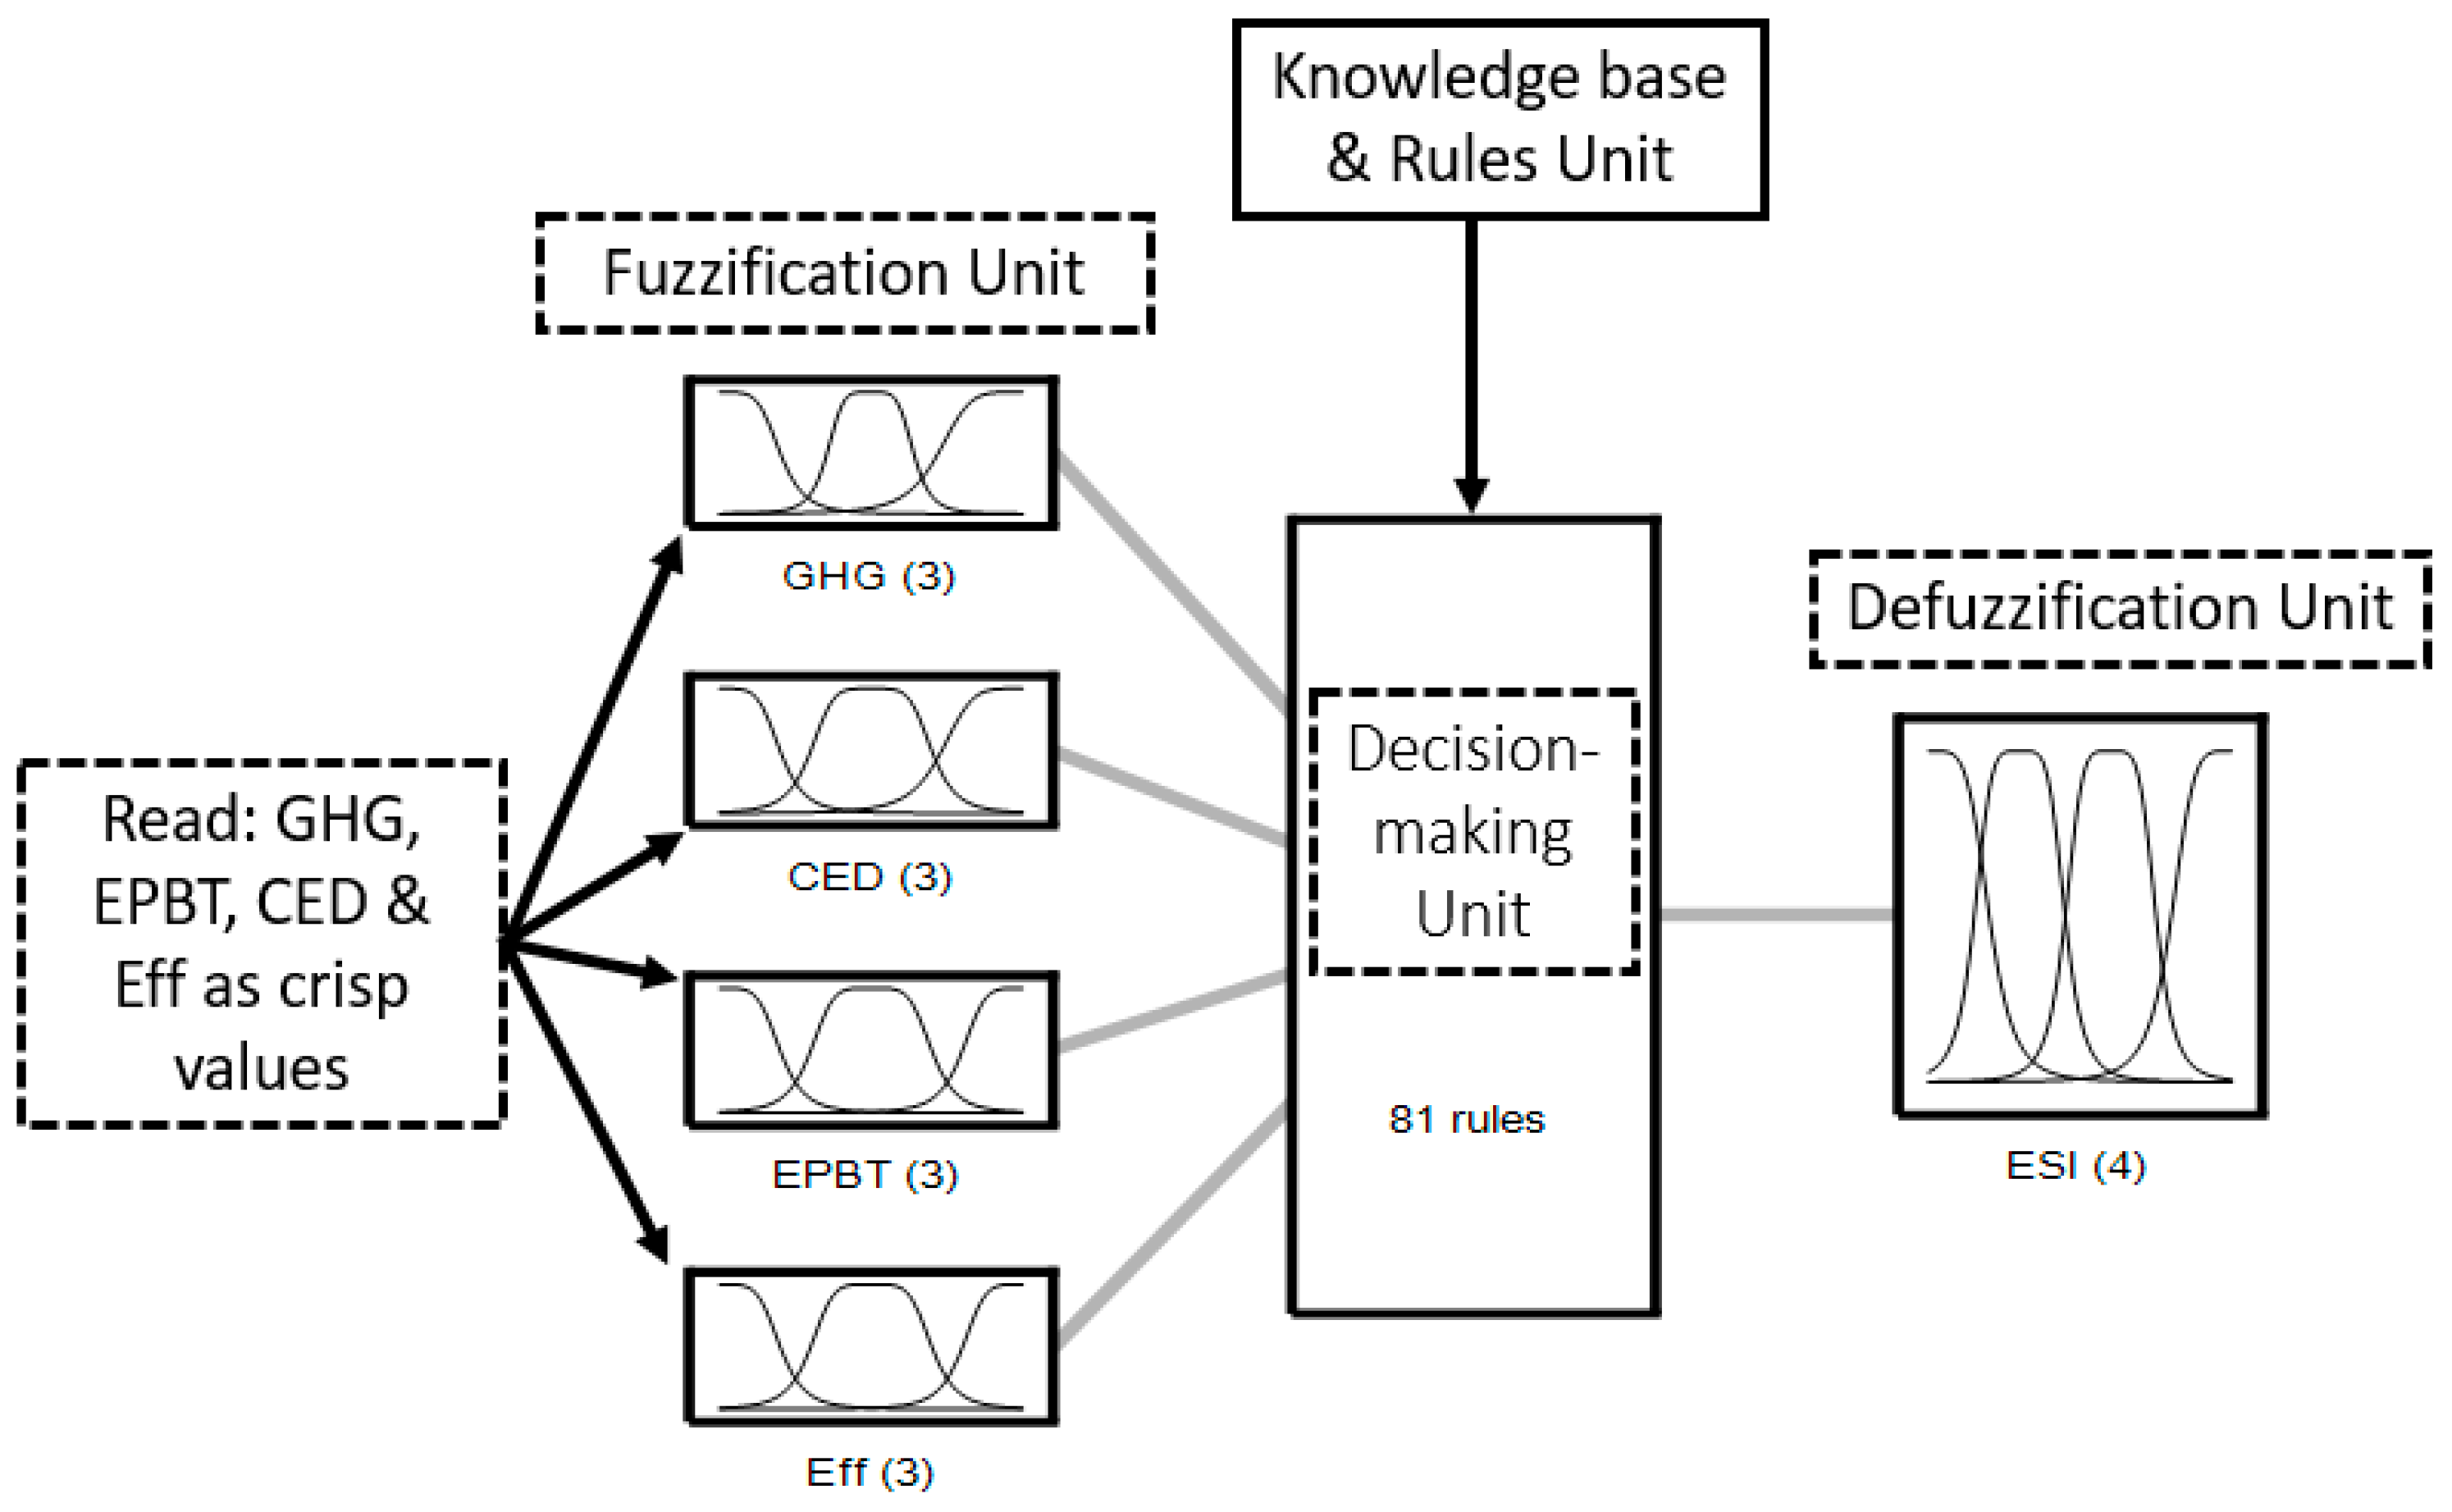
Figure 7.
Inputs membership functions.

Figure 8.
Output membership functions.

Figure 9.
Environmental sustainability indicator (ESI) Model Rules.
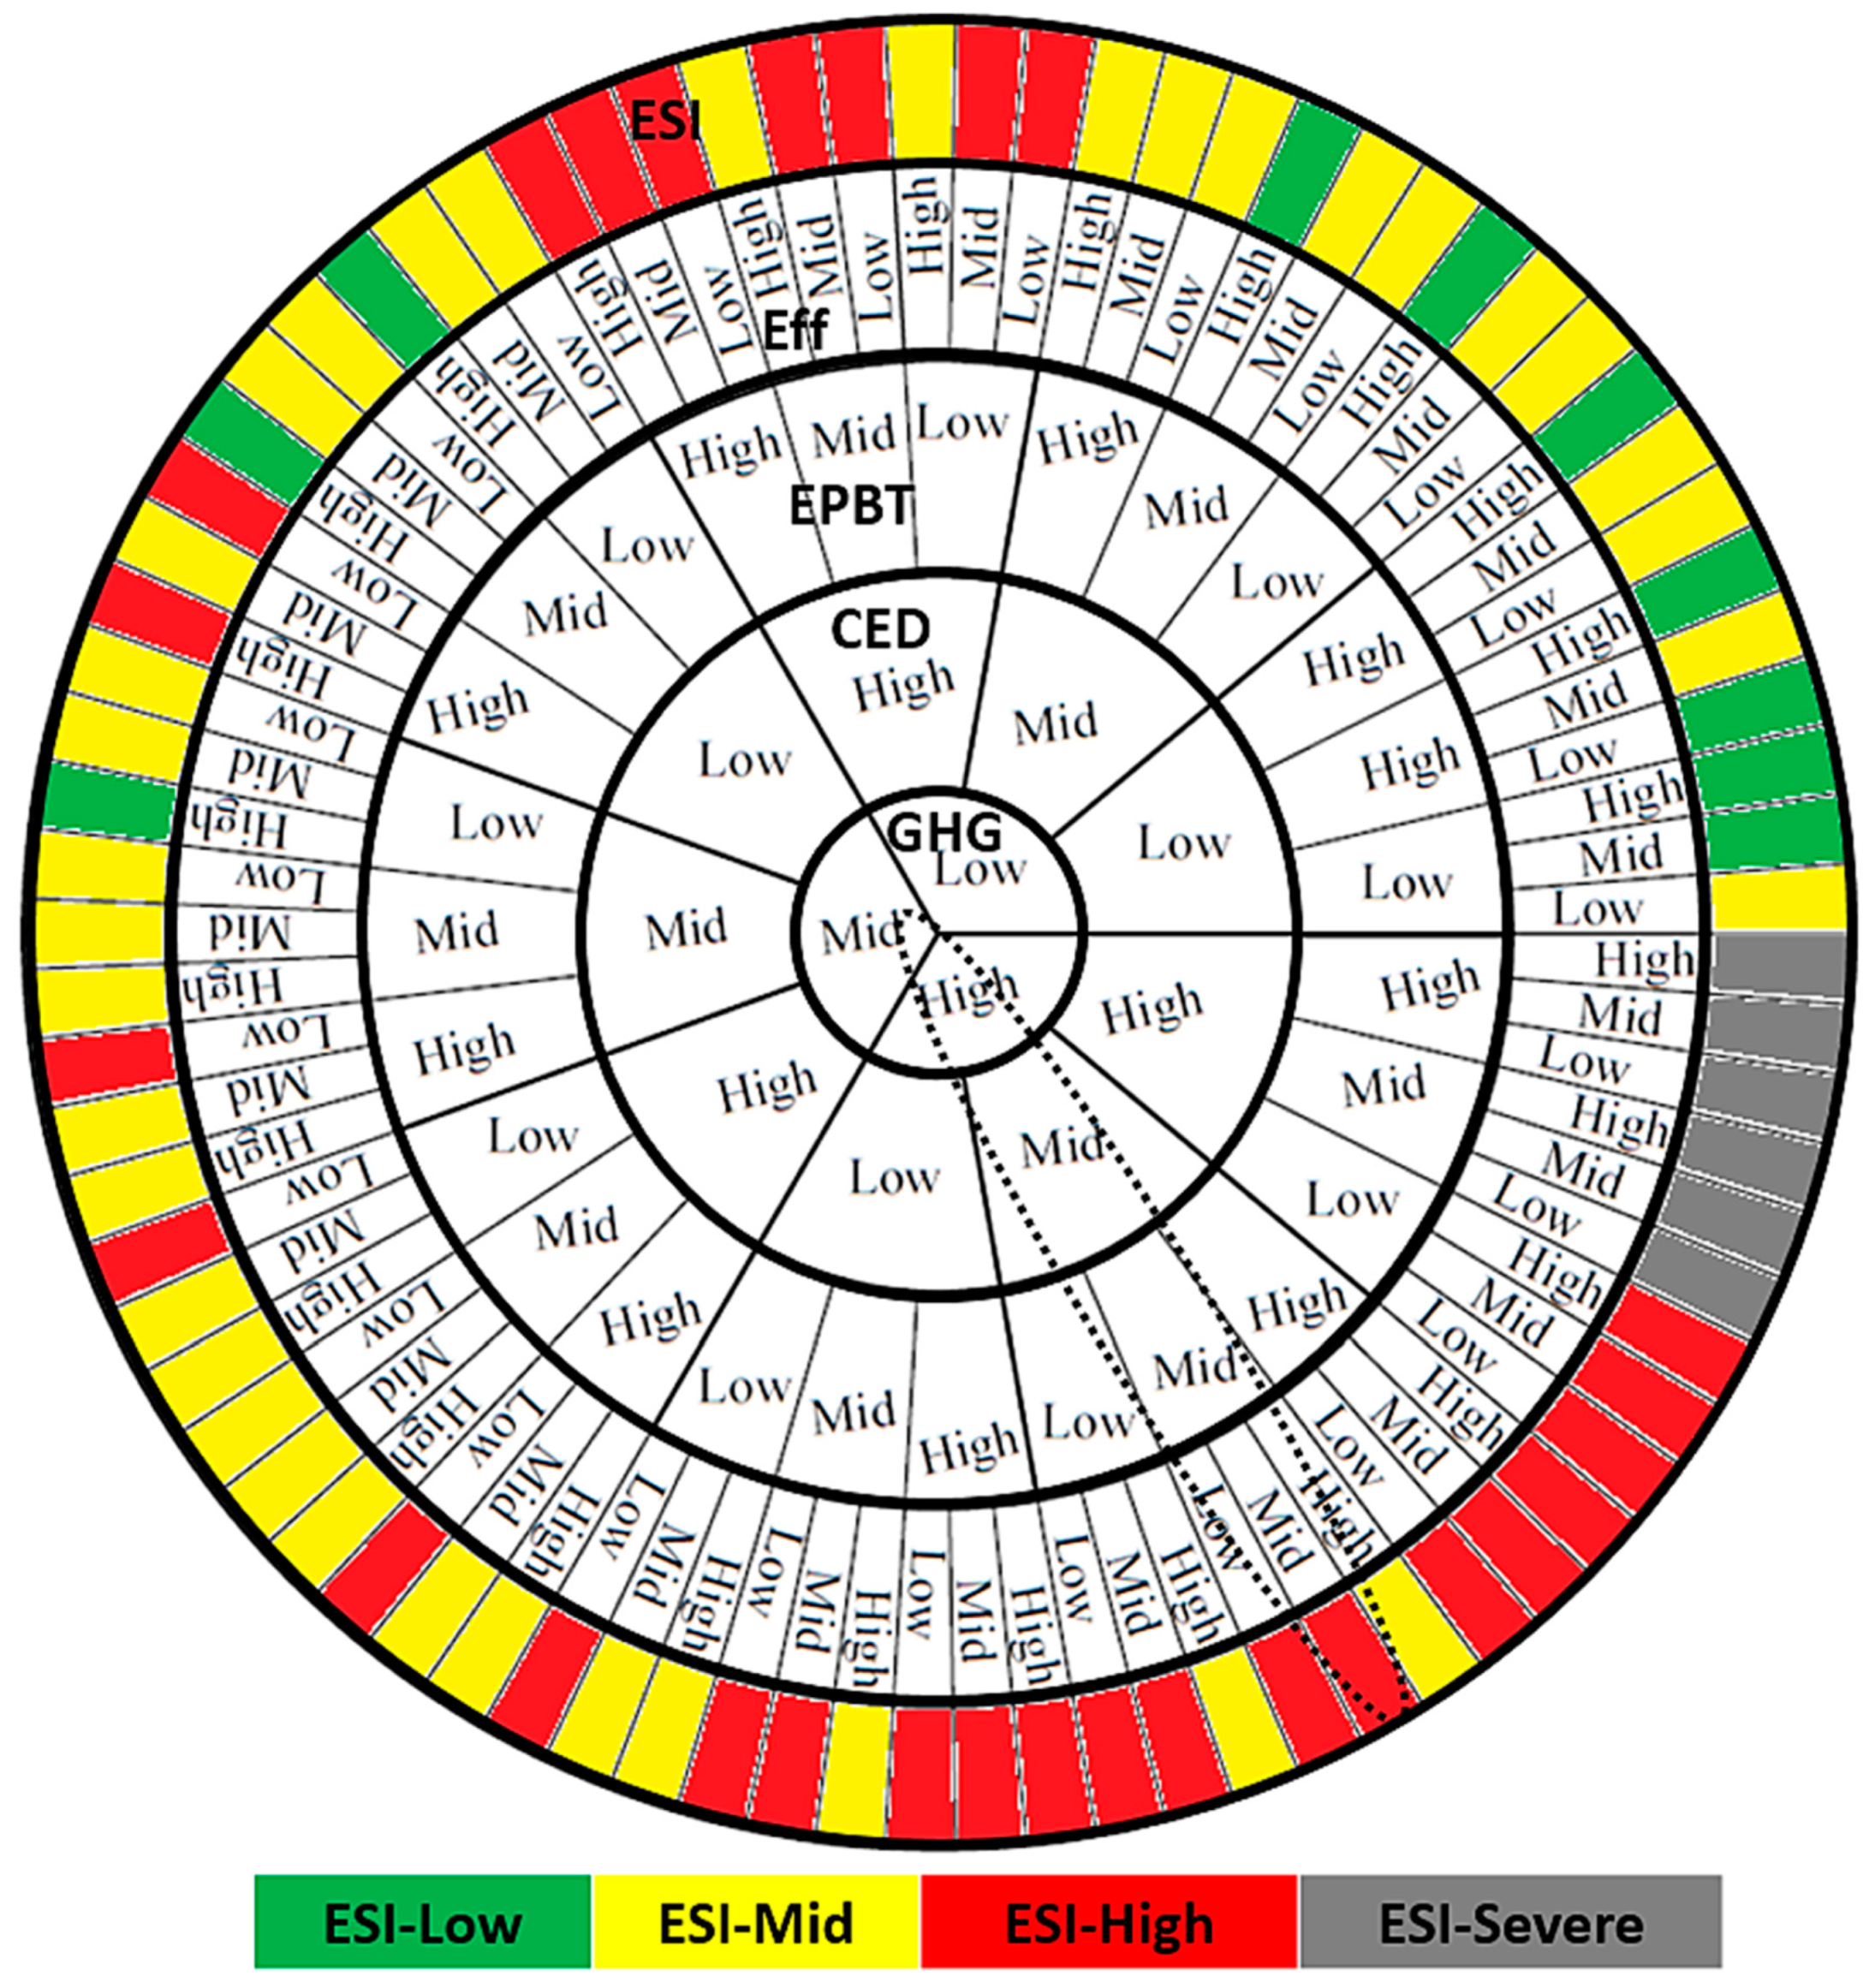
Figure 10.
ESI for different types of PV cells.

Figure 11.
ESI results for the 13 PV cells.
© 2018 by the authors. Licensee MDPI, Basel, Switzerland. This article is an open access article distributed under the terms and conditions of the Creative Commons Attribution (CC BY) license (http://creativecommons.org/licenses/by/4.0/).
Share and Cite
MDPI and ACS Style
Bani Salim, M.; Emre Demirocak, D.; Barakat, N. A Fuzzy Based Model for Standardized Sustainability Assessment of Photovoltaic Cells. Sustainability 2018, 10, 4787. https://doi.org/10.3390/su10124787
AMA Style
Bani Salim M, Emre Demirocak D, Barakat N. A Fuzzy Based Model for Standardized Sustainability Assessment of Photovoltaic Cells. Sustainability. 2018; 10(12):4787. https://doi.org/10.3390/su10124787
Chicago/Turabian StyleBani Salim, Muath, Dervis Emre Demirocak, and Nael Barakat. 2018. "A Fuzzy Based Model for Standardized Sustainability Assessment of Photovoltaic Cells" Sustainability 10, no. 12: 4787. https://doi.org/10.3390/su10124787
Note that from the first issue of 2016, this journal uses article numbers instead of page numbers. See further details here.