Changes in Soil Organic Carbon and Total Nitrogen at a Small Watershed Scale as the Result of Land Use Conversion on the Loess Plateau

1
State Key Laboratory of Soil Erosion and Dryland Farming on Loess Plateau, Northwest A&F University, Yangling 712100, Shaanxi, China
2
School of Geography and Tourism, Shaanxi Normal University, Xi’an 710119, Shaanxi, China
*
Author to whom correspondence should be addressed.
Sustainability 2018, 10(12), 4757; https://doi.org/10.3390/su10124757
Submission received: 8 October 2018
/
Revised: 5 December 2018
/
Accepted: 9 December 2018
/
Published: 13 December 2018
(This article belongs to the Special Issue Soil Erosion and the Sustainable Management of the Landscape)
Abstract
:Soil organic carbon (SOC) and total nitrogen (total N) are important soil components for agricultural production. Soil quality is related to the total amount of SOC and total N sequestered in the soil. Land use plays a major role in the distribution and amount of SOC and total N. This study analyses the amount of SOC and total N under various land cover types in 1987, 2005 and 2010, and evaluated their storage in land use conversions in a comprehensively managed watershed on the Loess Plateau, China. Results show that concentrations of SOC and total N in shrub land and natural grassland areas were significantly higher than for other land uses (farmland, orchard, abandoned farmland, manmade grassland) while cropland had the lowest concentration. Storage of SOC and total N increased along the revegetation chronosequence. As the storage of SOC in 2005 and 2010, they were 3461.86 × 108 and 4504.04 × 108 g respectively. Soil organic carbon storage were enhanced one third just during 5 years. The effects of land use on SOC and total N were the most significant in the upper soil layers. The correlation between SOC, total N, and the C/N ratio indicated that the best combination of land uses were natural grassland and shrub land. They efficiently influenced the distribution and storage of SOC and total N, and benefited vegetation restoration.
1. Introduction
Soil organic carbon is an important element of the global carbon stock and contains approximately two times more carbon than the atmosphere or vegetation [1]. Soil carbon pool estimations (both organic carbon and inorganic carbon) in China are essential for appraising global terrestrial carbon inventories; they also optimize the mitigation of carbon dioxide (CO2) accumulation in the atmosphere [2]. Soil organic carbon and total nitrogen are the key indicators for estimating soil quality and act as important carbon and nitrogen reservoirs [3], and understanding the distribution of SOC and total N stocks are essential in achieving improvements in soil quality [4]. Scholars have performed a lot of studies on the SOC distribution and stock on global [5], country [6] and regional [7] scales. However, these studies had a high degree of uncertainty due to the dates came from different sources, so the inherent and spatial variability were just simulated pattern. It is different with inventory data (measured values) after the processing of spatial distribution technology that would reflect real spatial variation. Soil organic carbon were influenced by climate, hydrology, soil, land use, et al. abiotic factors and the other biotic factors, while land uses were the most sensitive to display human disturbance. Thus, monitoring the SOC in different land uses is essential for estimating the SOC distribution and stock.
The equilibrium of carbon and nitrogen stocks is the result of the inputs and outputs [8,9] of the carbon and nitrogen cycle. Some studies have reviewed the effects of land use conversion on soil carbon stocks, such as forest clearing [10,11] changes in tropical forest cover [12,13] disturbance and recovery [14] cultivation [15] deforestation for pasture, land-use management of crop, pasture and forest, and cultivation of native vegetation to grasslands [16]. Conversion from cultivation land into perennial vegetation land is found to accumulate SOC and total nitrogen by increasing carbon and nitrogen source from litter decomposition and soil mineralization [3,17,18,19]. Organic carbon losses due to land-use change from grasslands and forests to croplands are estimated 20% to 25% in the zone of cultivation within the first 40–50 yrs. [20]. These losses show a rapid decline over the first 20 years after which soil organic carbon levels gradually stabilize at a new steady state over about the next 30 years [21,22,23]. During the past two centuries, land uses practices have modified decomposition dynamics by changing soil aeration, water dynamics and storage, as well as the biochemistry and quantity of crop residues [24,25]. Cultivation of pasture soils has resulted in a 25 to 50 % decrease in soil organic carbon [26,27].
During the last century, China implemented the most damaging type of outmoded agricultural management, which led to habitat fragmentation and soil erosion. Increasing population pressures and sloped terrain, subjected to intensive cultivation, were the major causes that led to environment fragmentation and serious soil erosion. In order to withstand further deterioration of natural ecosystems, the Chinese government has launched a serious of nation-wide conservation projects focusing on vegetation rehabilitation and land recovery [12]. One of the most promising programs in achieving sustainable ecological restoration was the Grain for Green project. The project, implemented in 1999, focused on the recovery of damaged ecosystems. The crucial outcomes were sustainable agricultural development, controlled soil erosion, improved land quality, and widespread conversion of sloping cropland (the loess hilly area) to sustainable land uses. Croplands with slopes of greater than 15° were converted to green space [28].
This manuscript examines quantity and distribution of SOC and total N under various developmental stages of different land uses. We hypothesized that: (1) Land uses conversion would affect SOC and total N during the different developmental stages (1987, 2005 and 2010), and SOC and total N would increase after vegetation restoration; (2) shrub land and natural grassland related changes in SOC and total N significantly, natural grassland is the overwhelmingly dominant land use in SOC storage increasing and soil nitrogen mineralization promoting. Therefore, the objectives are: (1) Judge the effects of Grain for Green project implemented on the Loess Plateau under various developmental stages; (2) to analyze the influence of land uses in relation to increase SOC storage and promotion of soil nitrogen mineralization.
2. Materials and Methods
2.1. Study Area
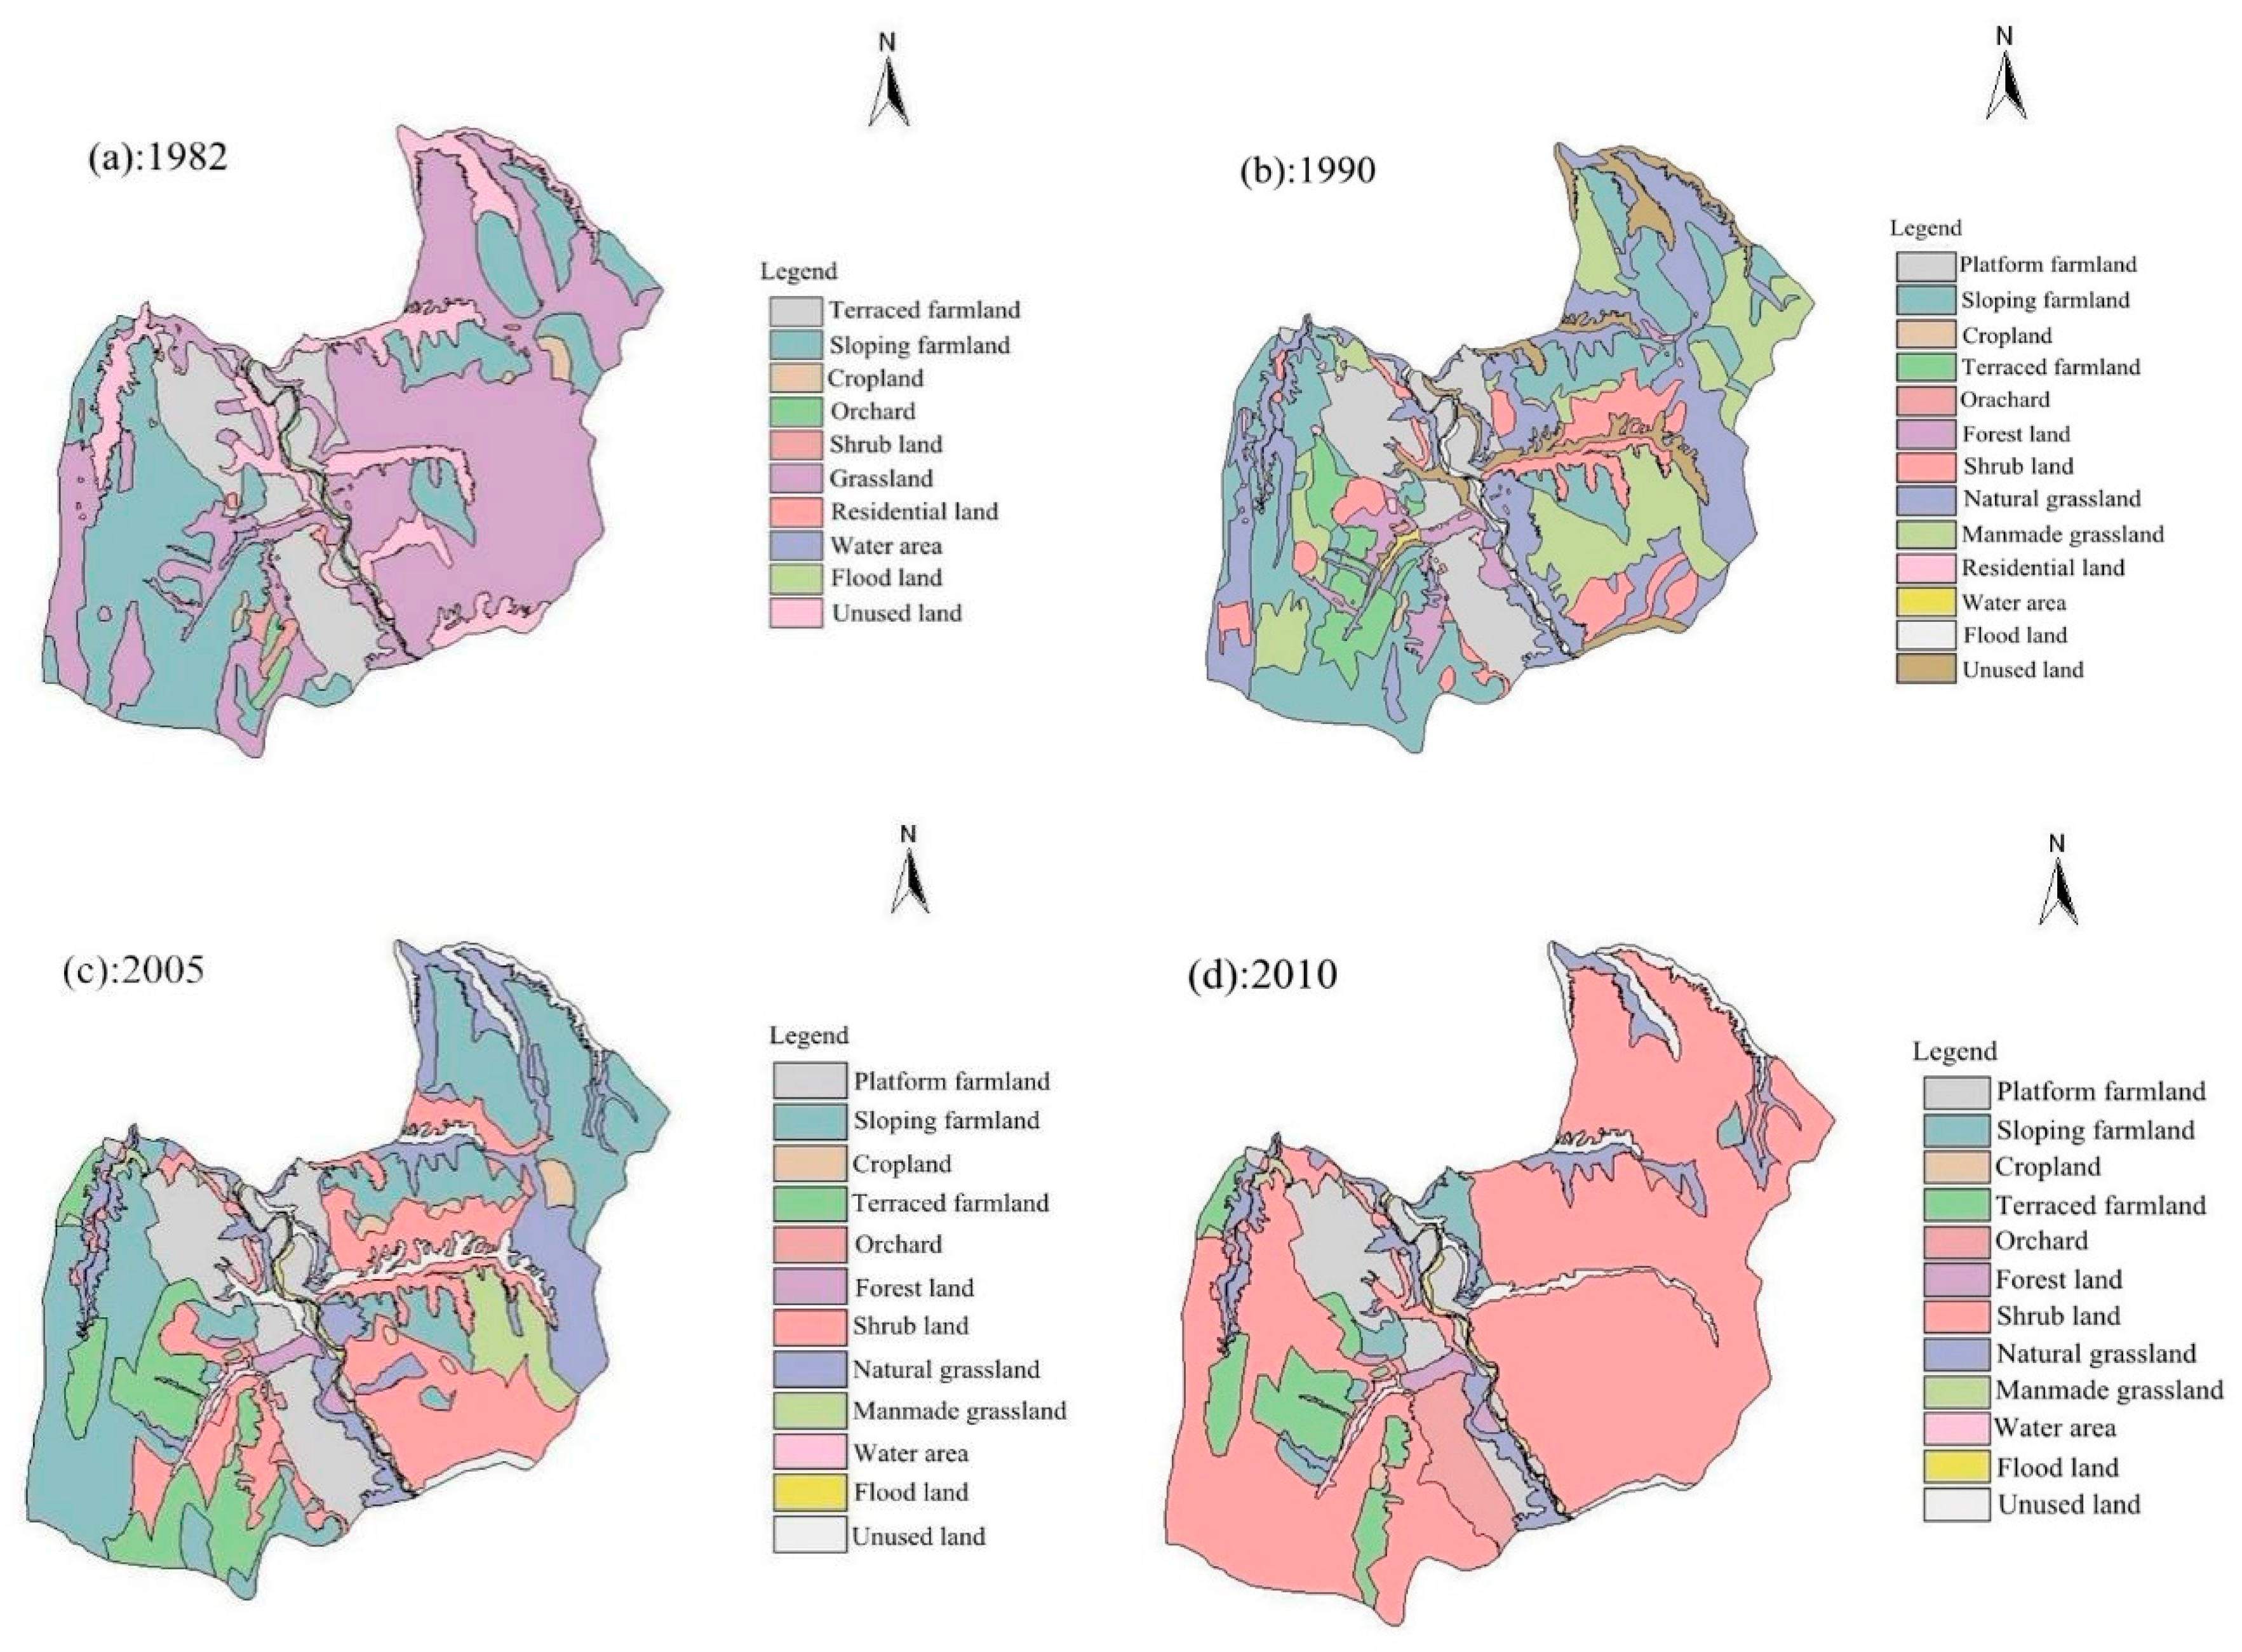
The comprehensive management watershed (Shanghuang) (106°26′106°30 E, 35°59′36°02′ N) is in the hilly-gully region on the Loess Plateau, Guyuan, Ningxia Province. The watershed has a semi-arid climate with an average annual temperature of 6.9 °C and an average annual rainfall of 419 mm (1982–2002). The rainy season starts in July and continues until October, with the average rainfall in August accounting for 24% of the total annual precipitation. The dominant soil type in the study area is loessal Cambisol [29]. The elevation of the study area ranges from 1530 to 1822 m above sea level, and the area covers 8.19 km2. According to field investigations, satellites and remote sensing images, the land use in the study area are: Platform farmland, sloping farmland, cropland, terraced farmland, orchard, forest land, shrub land, manmade grassland, natural grassland, residential land, water area, flood land, and fallow land (Figure 1a–d).
ArcGIS was used to perform a land use change analysis. Remotely sensed data was interpreted using digitized 1982 1:10000 scale topographic maps, color infrared aerial photographs from 1990, 2005 orthophotos and 2010 land use field studies (Table 1). In order to introduce uniformity and comparability, we used a five-class land use system: (I) Shrub land; (II) manmade grassland; (III) natural grassland; (IV) farmland; (V) abandoned farmland. The principle form of manmade shrub land is Caragana Korshinskii with two associated species, Armeniaca sibirica and Amygdalus davidiana. The dominant manmade grassland plant is Medicago sativa L. The dominant species in natural grassland are Artemisia gmelinii, Stipa bungeana, Artemisia scoparia, Artemisaia stelleriana, Stipa grandis, Thyme and Potentilla chinensis.
In 1982, the study area was characterized by broken topography, serious soil erosion, deteriorated ecological environment and lagging agricultural productivity. It is the result of long time over-exploitation and lower vegetation coverage. The primary land uses of sloping farmland, natural grassland, shrub land, and manmade grassland accounted for 1.3% of the total area (5.3 and 5.0 ha; Figure 1a: 1982). After the establishment of the research station, the land cover underwent a fundamental change. An optimization model for land use, based on the theory of aggro-ecological systems, was implemented to effectively improve the ecological environment and conserve soil and water. After grass was cultivated between 1982 and 1990, the areas of manmade shrub land and grassland rose to 27.2% (Figure 1b: 1990). A significant change in land use occurred between 2002 and 2010 during the “Grain for Green” restoration project. The Grain for Green program was implemented in Shanghuang to solve environmental and economic development issues; with regard to the former, the objective was to control soil erosion and improve land quality. As the result of the special terrain designation (90% of the area is hilly, with 51% of the land at an elevation of 1534.33–1822.30 m with closely dissected, sharp-edged, steep slopes [12], the program relocated high-slope farmland (>25°slope) to lower-slope areas and established shrub and grass land. During the years of Gain for Green, the study area was changed into a demonstration zone for successful land reclamation and comprehensive management, the area of shrub land occupied 66.7% of total area and farmland occupied 16.16% (Figure 1c,d).
2.2. Experimental Design and Sample Collection
SOC and total N data were collected by the same research group (1987, 2005, and 2010). But sample numbers and soil depths for each time period with different objectives were non-uniform. In 1987, 35 samples were collected from natural grassland at a sampling depth of just 0–10 cm. In July 2005, 45 samples were collected at sampling depths of 0–20 and 20–40 cm by the foundation of Nation Sciences, China (40701095). In June 2010, 42 samples were collected at sampling depths of 0–10, 10–30, and 30–60 cm by the foundation of Nation Sciences, China (4097117) (Table 1 and Table 2). Land use information was collected for soil samples in 1987, 2005, and 2010 (Figure 1 and Table 1), while soil sample numbers, depths and other basic management details were collected in 2005 and 2010 (e.g., vegetation types, dominant species, site coordinate fertilization).
A non-equidistant irregular grid (0.8 × 0.8 km) method was used for sample collection in 1987, 2005, and 2010. Six or seven replicated points were collected for each site. The dichromate oxidation method was used to measure SOC and the micro Kjeldahl method was used to determine total nitrogen [36]. The core ring method was used to determine bulk density.
2.3. Statistical Analysis
How to compare SOC and TN with non-uniform data directly? It is too difficult, so we use the indexes of the storage of soil organic carbon and total nitrogen, those indicators are the total quantity and spatial value of SOC and nitrogen. It can eliminate the influence that caused by different sample numbers. And the same time, two parameters Hi and n in equations eliminate the influence the thickness of soil and soil layers.
The density of soil organic carbon total nitrogen can indicate the contributions of global changes that form soil quality and terrestrial ecosystem. Generally, the mass of soil organic carbon and total nitrogen contained in soil per square meter, that represent soil organic carbon density and soil total nitrogen density.
- DSOC—Soil organic carbon density
- Ci—The gravel content on layer i (particle size > 2 mm, volume %);
- Bi—Soil bulk density on layer i (g/cm3);
- SOMi—The content of soil organic carbon on soil layer i (g/kg);
- Hi—The thickness of the soil (cm);
- n—The numbers of total soil layer (cm);
- 0.58—The conversion coefficient of Bemmenlen (SOC);
- DTN—Soil total nitrogen density;
- Ci—The gravel content on layer i (particle size > 2 mm, volume %);
- Bi—Soil bulk density on layer i (g/cm3);
- TNi—The content of total nitrogen on soil layer i (g/kg);
- Hi—The thickness of the soil (cm);
- n—The numbers of total soil layer (cm);
- SSOC, STN—Soil organic carbon storage, soil total nitrogen storage;
- Si—The area of land uses;
- DSOC, DTN—Soil organic carbon density, soil total nitrogen density;
A variety of statistical analyses were used to identify the effects of land use and soil depth on SOC and total N concentration. One-way ANOVA analysis with land use type (shrub land, manmade grassland, natural grassland, farmland and abandoned farmland) as the main factor was employed to test the significance of mean differences. The level of significant differences was p < 0.05. A univariate procedure was used to examine the normality of distribution of the observed data before conducting ANOVA. After the ANOVA test indicated a significant effect at p < 0.05, the means of SOC and total nitrogen for different land use types were classified using the Duncan multiple-range procedure. All statistical analyses were performed with SAS Enterprise Guide, Version 4.1.
3. Results
3.1. Land Uses Conversion Between 1982 and 2010
Based on the agricultural history of the area, the developmental stages of land use conversion were divided into three parts (Table 1). In the first stage (1982–1990), the primary land uses were natural grassland (46%) and farmland (40%) (Figure 1a). Due to increasing population pressure, natural grassland was converted into farmland. In the second stage, between 1990 and 2005, the area of natural grassland decreased by 21.04% and farmland became the major land use. Farmland increased by 10.85% from 316 ha in 1987 to 408 ha in 2005. As ecological restoration began to solve the problem of fragmentation, farmland and manmade grassland gradually decreased. In the third period (2005–2010), the area of orchard, shrub land and natural grassland increased. Farmland decreased dramatically from 407 ha in 2005 to 130 ha in 2010 at the percent of 34.39%, shrub land became the dominate land use.
3.2. Distribution of SOC and Total N Concentrations in 1987, 2005, and 2010
One-way ANOVA analysis indicated that land use had a significant effect on SOC and total N. In Table 3, natural grassland had the lowest concentration of SOC and total N in 1987, 5.90, and 0.70 g·kg−1, respectively. Whereas, after more than 10 years, they reached a high level in 2005 and in 2010. Among the different land uses, the concentration of SOC and total N declined in the following order: Natural grassland > shrub land, abandoned farmland > manmade, and grassland > farmland. Farmland had the lowest values of SOC and total N. As depth increased, the concentration of SOC and total N decreased gradually. The downward trend in concentration in natural grassland were drastic, SOC decreased 5.7 g·kg−1 from 0–20 to 20–40 cm in 2005, 5.46 g·kg−1 from 0–10 to 10–30, and 5.09 g·kg−1 from 10–30 to 30–60 cm in 2010. However, in farmland the reduction was not obvious, it decreased 1.67 g·kg−1 in 2005, and 1.26 g·kg−1 from 0–10 to 10–30, and 1.14 g·kg−1 from 10–30 to 30–60 cm in 2010.
3.3. Soil C/N Ratios in 1987, 2005, and 2010
For natural grassland, the ratio of soil organic carbon/ total nitrogen (C/N) was 8.43 in 1987 in Table 4, it was much lower than in 2005 and 2010. Shrub land showed the highest C/N ratios in 2005. However, natural grassland had the greatest C/N ratio in 2010 The lowest values were shown in farmland and abandoned farmland, whether in 2005 or in 2010; the C/N ratios of natural grassland and shrub land were higher than manmade grassland, abandoned farmland, and farmland in 2005 and 2010.
Based on the correlation analysis, the regression lines in Figure 2 describe the relationship between SOC and total N among the different land uses. The correlation between SOC and total N among the different land uses were positive. Shrub land (0.8189) and natural grassland (0.9318) had the highest correlation coefficients, and the variation tendencies were proximity (Figure 2a,c). The results indicate that SOC and total nitrogen of shrub land and natural grassland have the better couplings.
3.4. Distribution of BD, SOCD, and SND in 2005 and 2010
The distributions of soil bulk density (BD), soil organic carbon density (SOCD), and soil nitrogen density (SND) among the different land uses in 2005 and 2010 are shown in Figure 3. In 2005 and 2010, the BD values in manmade grassland and farmland were higher than natural grassland and shrub land. The differences among the values for each land use in 2005 were considerable (Figure 3a), manmade grassland, had the highest BD (1.26 g·m−3), which was 1.11 times higher than the minimum value (natural grassland). The comparison of SOCD and SND among the different land uses in 2005 and 2010 are shown in Figure 3b,c. The difference between SOCD values for the various land uses in 2005 was greater than in 2010, especially for natural grassland. SOCD was 3.72 g·m−3 in 2005 (0–20 cm), which was two times more than abandoned farmland (2.08 g·m−3). However, abandoned farmland has the lowest SOCD and SND of the different land uses; the order was: Natural grassland > farmland > shrub land > manmade grassland > farmland.
3.5. Soil Organic Carbon and Total Nitrogen Storage (SSOC and STN)
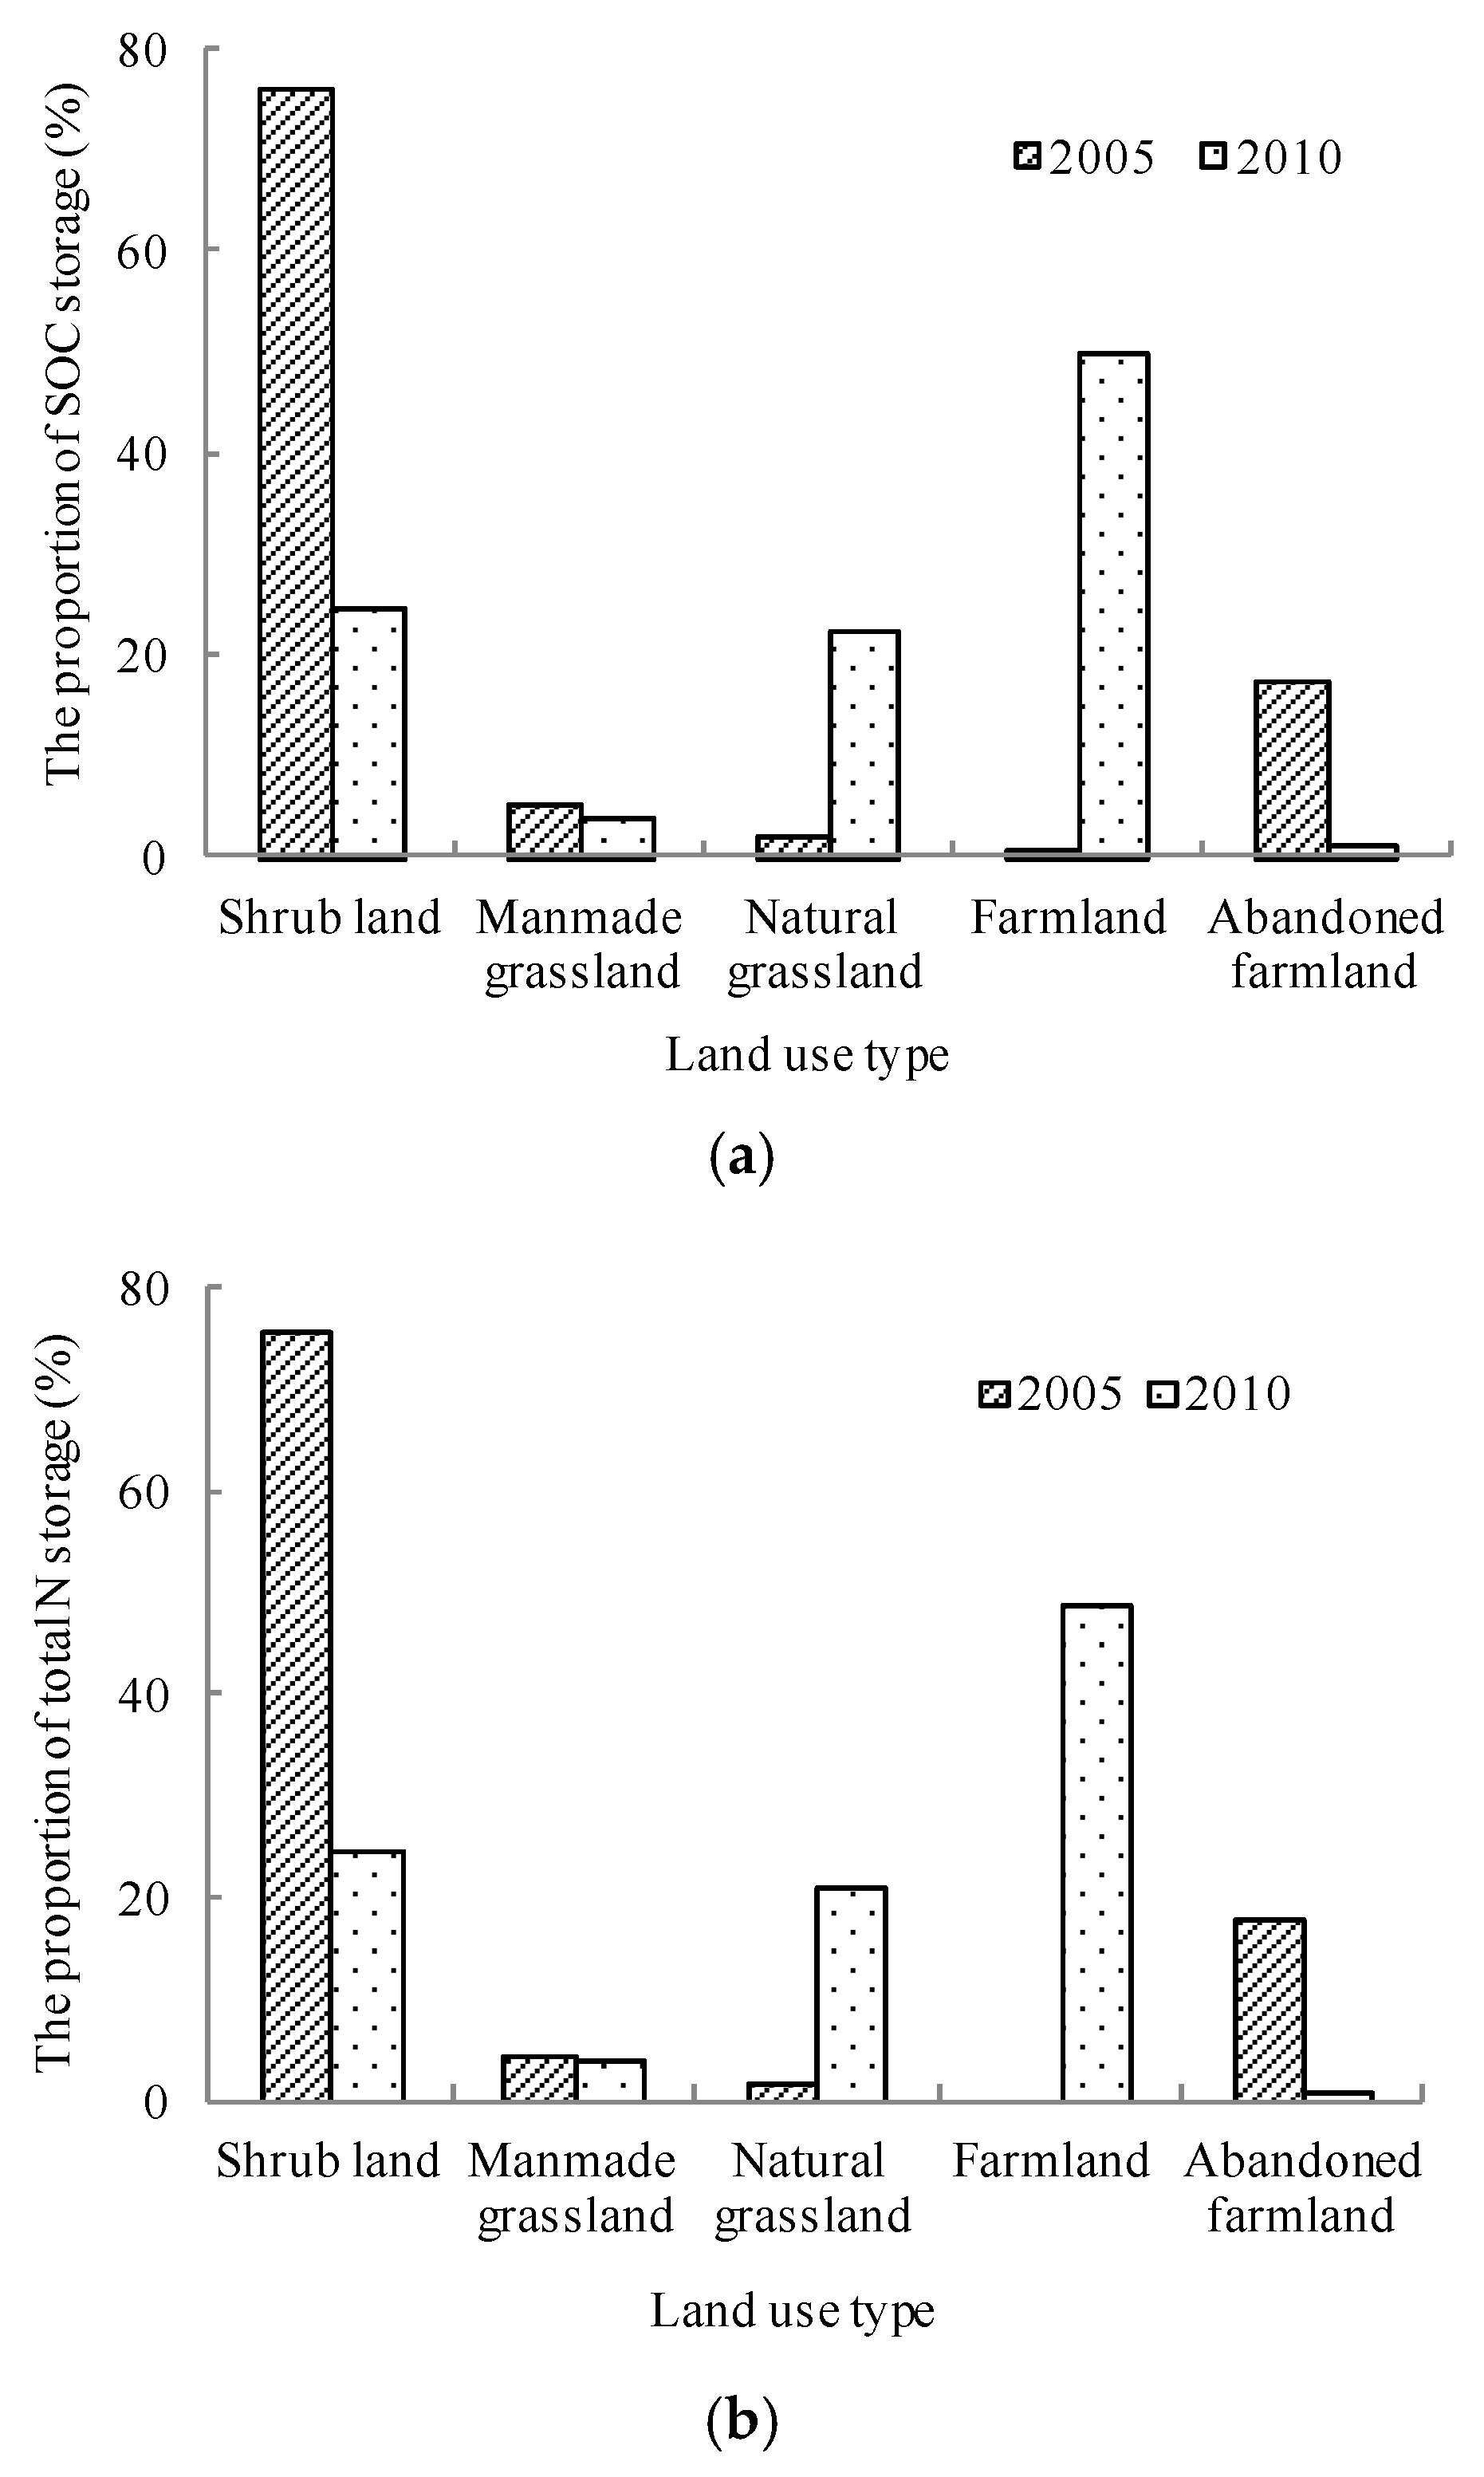
Soil carbon and nitrogen storage (SSOC and STN) in the surface soil of natural grassland was compared for 1987 and 2010. Table 5 shows that the concentration of SOCD and SND increased 1.16 and 0.06 g·cm−3 from 1987 to 2010, respectively. SSOC and STN accumulation in 2010 (221.1 × 10⁸ and 26.61 × 10⁸) was less than in 1987 (571.8 × 10⁸ and 144.8 × 10⁸ g). A comparison of the SSOC and STN of various land uses in 2005 and 2010 (Table 5b and Figure 4) showed that in 2005, SSOC and STN in shrub land (3466.3 × 108 and 82.75 × 10⁸ g) accounted for 82.75 % and 76.11 % of the total. However, in 2010, SSOC and STN of shrub land (1123.3 × 108, 62.37 × 10⁸ g), natural grassland (723.5 × 10⁸, 53.65 × 10⁸ g), and farmland (1401.3 × 108, 108.77 × 10⁸ g) were associated with the land uses, which occupied the greatest proportion of total storage (95.98 and 94.51%).
4. Discussion
Land use conversion significantly influences the terrestrial ecosystem structure, which makes the contribution of SOC and STN vary [3]. Microclimate, soil variation, and organic matter input are affected by land uses that impact SOC decomposition and N mineralization [2,37,38,39]. [40] indicated that cultivation does not increase accumulation of SOC or support perennial vegetation. SOC storage decreases by 42% and 59% when forest and grassland were converted to crop, respectively [18]. Soil nitrogen storage in black soil under grassland has increased in the past 20 years of vegetation rehabilitation. Additionally, there was a sustained decrease in SOC and soil nitrogen when natural ecosystems were subjected to human disturbance or were converted into agriculture land [41,42].
In the present study, the concentration of SOC and total N declined in the following order: Natural grassland > shrub land, abandoned farmland > manmade, grassland > farmland. The lowest concentration of SOC and total N in farmland would result in: (I) Lower organic matter that decreased with aerial growth, biomass production, and crop harvest; (II) long-term cultivation and uptake of nitrogen by crops would enhance mineralization and utilization of soil organic matter [35]. Natural grassland and shrub land are the most suitable land uses in Shanghuang watershed for ecological restoration and have greater SOC and total N than other land uses. This is because: (I) A sufficient carbon source is offered by higher litter inputs [15,43,44,45]; (II) lower herbaceous plants and a closed canopy is created by a moist environment; (III) a vertical distribution of root systems is created [33].
The root system distribution directly influences the vertical distribution of SOC and total N. Abundant carbon resources are produced by ageing, decay, and decomposition of roots [46]. Grass roots are always concentrated at a depth of 0–40 cm, indicating that a dramatic reduction of SOC in grasslands at greater soil depths is caused by fewer roots [47]. Although, some researchers show that manmade grassland is an effective means of grassland system restoration [48,49]. The present study shows that SOC and total N of manmade grasslands were lower than in other land uses (just a little higher than in farmland). Manmade grasslands containing Medicago sativa is the main forage vegetation for the animal husbandry industry in the Shanghuang watershed. In the early years of cultivation, Medicago sativa has a high nutrient consumption demand. As the years of cultivation increase, root nodule bacteria and litter decomposition generate and secrete nitrogen and organic carbon, which adds carbon and nitrogen to the soil [50]. However, this increase in SOC and total N does not satisfy the requirements of plant growth. Years of cultivation break the equilibrium of supply and demand, which decreases the amount of nutrients in the soil.
Soil bulk density (BD), the unit volume of the undistributed soil, is influenced by soil density and pore space and decreases with greater pore space and fluffier textures. The purpose of the Grain for Green project was to convert farmland (low productivity, unsustainable, and unreasonable land management conditions) into shrub land and grassland with small soil bulk density. [51] reported that the vegetation on farmland improved soil quality after 8 years of secondary succession. As succession proceeded, vegetation litter and humus accumulated on the surface and the root systems influenced soil bulk density. SOC and total N was significantly higher at the soil surface than at other soil profile depths. [14] indicated that SOC and total N declined consistently with project depth in sandy loam soils (Typic Udivitrands) of New Zealand. [21] also reported that SOM in cultivated lands at a depth of 0–20 cm were significantly reduced by 49% relative to SOM content of pasture in the highlands of southern Turkey when pasture was cultivated. Differences between soil profile depths were dependent on plant residue that was attributed to vegetative cover, years under development, land use type, and human activity. The incorporation of plant residue into the surface soil layer is easily distracted by external factors, especially in the 5 cm soil layer.
The soil C/N ratio is an important indicator of the soil microorganism community structure and changes in soil quality in terrestrial ecosystems [52,53]. The C/N ratio is closely related to soil nitrogen mineralization, fixation, and nitration [8]. The differences in soil C/N ratios among land uses result from: (I) The accumulation rate of SOC and total N; (II) the chemical properties of organic matter [54]. Tong, C.L, et.al. [55] reported that the SOC and total N accumulation are not synchronous. The accumulation rate of SOC is faster than that of total N. Litter decomposition is the major reason why the C/N ratio in farmland was lower than in natural grassland and shrub land. The lignin, waxiness, and organic matter in shrub land and grassland are higher than in farmland where it has difficulty decomposing [54,56]. The lignin content of grass roots was 15–19% [57], and 9–12% in crop (wheat and corn) roots [58]. Therefore, shrub land with the highest C/N ratio is related to a greater amount of material in a slowly decomposing organic matter fraction.
The advantages of ecological restoration in Shanghuang watershed were not only seen in vegetation cover and production increases, but also in soil microbial parameters and nutrient enhancements. It also improved land productivity, strengthened soil carbon sinks, and decreased greenhouse gas emission.
5. Conclusions
Through the process of ecological restoration, natural grassland gradually recovered and large proportions of farmland were converted into shrub land and abandoned grassland. Soil carbon and nitrogen storage in Shanghuang increased along the revegetation chronosequence. The positive coefficient of C/N ratios indicated that the best combination of land uses were natural grassland and shrub land. The contribution of land use conversion on SOC and total N concentration was obvious in the Shanghuang watershed. The projects on the Chinese Loess Plateau promoted soil organic carbon storage and soil nitrogen mineralization.
Author Contributions
Project Administration, Writing-Review & Editing, Supervision, S.A.; Methodology, Software, Formal Analysis, Resources, Data Curation, Writing-Original Draft Preparation, Funding Acquisition, Z.X.
Funding
This study was supported by Key Laboratory Open Project Fund (A314021402-1707), the National Natural Sciences Foundation of China (41807060), National Special Research and Development Project during the Thirty Five-year Plan Period (2017 YFC0504702).
Acknowledgments
The authors would like to thank the Institute of Soil and Water Conservation, Northest A & F University (http://www.iswc.ac.cn/) for providing the land uses data-set. And we would also thanks the articles from Jia H. Y. (1987,1990), Liu M. Y. (2005), An S. S. (2010), Xue Z. J. (2013) and the Natural Science Foundation of China (40701095, 40971171), which proving the historical data of soil organic carbon and total nitrogen.
Conflicts of Interest
The authors declare no conflict of interest.
References
- IPCC. Land-use, land-use change, and forestry. In Land-Use, land-Use Change, and Forestry, A Special Report of the Intergovernmental Panel on Climatic Change (IPCC); Watson, R.T., Noble, I.R., Bolin, B.R., Ravindranath, N.H., Verardo, D.J., Dokken, D.J., Eds.; Cambridge University Press: Cambridge, UK, 2000; pp. 1–51. [Google Scholar]
- Schlesinger, W.H. Changes in soil carbon storage and associated properties with disturbance and recovery. In The Changing Carbon Cycle: A Global Analysis; Trabalka, J.R., Reiche, D.E., Eds.; Spinger: New York, NY, USA, 1986; pp. 194–220. [Google Scholar]
- Bolin, B.; Sukumar, R. Global perspective. In Land Use, land-Use Change, and Forestry; Watson, R.T., Nobal, I.R., Bolin, B., Racindranath, N.H., Verardo, D.J., Dokken, D.J., Eds.; Cambridge University Press: Cambridge, UK, 2000; pp. 23–51. [Google Scholar]
- Gregorich, E.G.; Carter, M.R.; Angers, D.A.; Monreal, C.M.; Ellert, B.H. Toward minimum data set to assess soil organic-matter quality in agricultural soils. Can. J. Soil Sci. 1994, 74, 885–901. [Google Scholar] [CrossRef]
- Bohn, H.L. Estimate of organic carbon in world soils. Soil Sci. Soc. Am. J. 1982, 46, 1118–1119. [Google Scholar] [CrossRef]
- Krogh, L.; Noergaard, A.; Hermanen, M. Preliminary estimates of contemporary soil organic carbon stocks in Denmark, using multiple datasets and four scaling-up methods. Agric. Ecosyst. Environ. 2003, 96, 19–28. [Google Scholar] [CrossRef]
- Sun, W.X.; Shi, X.Z.; Yu, D.S. Estimation of soil organic carbon density and storage of Northeast China. Acta Pedol. Sin. 2004, 41, 298–301. (In Chinese) [Google Scholar]
- Aber, J.D. Nitrogen cycling and nitrogen saturation in temperate forest ecosystems. Trends Ecol. Evol. 1992, 7, 220–224. [Google Scholar] [CrossRef]
- Fearnside, P.M.; Barbosa, R.I. Soil carbon change from conversion of forest to pasture in Brazilian Amazonia. For. Ecol. Manag. 1998, 108, 147–166. [Google Scholar] [CrossRef]
- Allen, J.C. Soil response to forest clearing in the United States and the tropics: Geological and biological factors. Biotropica 1985, 17, 15–27. [Google Scholar] [CrossRef]
- Neil, C.; Davidson, E.A. Soil carbon accumulation or loss following deforestation for pasture in the Brazilian Amazon. In Soil Processes and the Carbon Cycle; Lal, R., Kimble, J.M., Follett, R.M., Stewart, B.A., Eds.; CRC Press: New York, NY, USA, 2000; pp. 9–28. [Google Scholar]
- An, S.S.; Huang, Y.M.; Liu, M.Y. Soil organic carbon density and land restorations example of southern mountain area of Ningxia province, northwest China. Commun. Soil Sci. Plant Anal. 2010, 4, 181–189. [Google Scholar] [CrossRef]
- Detwiler, R.P. Land use change and the global carbon cycle: The role of tropical soils. Biogeochemistry 1986, 2, 67–93. [Google Scholar] [CrossRef]
- Ross, D.J.; Tate, K.R.; Scott, N.A.; Feltham, C.W. Land-use change: Effects on soil carbon, nitrogen and phosphorus pools and fluxes in three adjacent ecosystems. Soil Boil. Biochem. 1999, 31, 803–813. [Google Scholar] [CrossRef]
- Mann, L.K. Changes in soil carbon storage after cultivation. Soil Sci. 1986, 142, 279–288. [Google Scholar] [CrossRef]
- Conant, R.T.; Paustian, K.; Eilliott, E.T. Grassland management and conversion in to grassland: Effects on soil carbon. Ecol. Appl. 2001, 11, 343–355. [Google Scholar] [CrossRef]
- Chang, R.Y.; Fu, B.J.; Liu, G.H.; Liu, S. Soil carbon sequestration potential for “Grain for Green” project in Loess Plateau, China. Environ. Manag. 2011, 48, 1158–1172. [Google Scholar] [CrossRef] [PubMed]
- Guo, L.B.; Gifford, R.M. Soil carbon stocks and land use change: A meta analysis. Glob. Chang. Boil. 2002, 8, 345–360. [Google Scholar] [CrossRef]
- Laganière, J.; Angers, D.A.; Parè, D. Carbon accumulation in agricultural soils after afforestation: A meta-analysis. Glob. Chang. Boil. 2010, 16, 439–453. [Google Scholar] [CrossRef]
- Bruce, J.P.; Frome, M.; Haites, E.; Janzen, H.; Lal, R.; Paustian, K. Carbon sequestration in soils. Soil Water Conserv. 1999, 54, 381–389. [Google Scholar]
- Celik, I. Land-use effects on organic matter and physical properties of soil in a southern Mediterranean highland of Turkey. Soil Tillage Res. 2005, 83, 270–277. [Google Scholar] [CrossRef]
- Fiener, P.; Gottfried, T.; Sommer, M.; Steger, K. Soil organic carbon patterns under different land uses in South India. Geod. Reginal 2014, 2–3, 91–101. [Google Scholar] [CrossRef]
- Tom, L.; Luck, V.; Bruce, H. Reforestation of agricultural land in the tropics: The relative contribution of soil, living biomass and debris pools to carbon sequestration. Sci. Total. Environ. 2019, 649, 1502–1513. [Google Scholar]
- Drinkwater, L.E.; Snapp, S.S. Nutrients in agro ecosystems: Rethinking the management paradigm. Adv. Agron. 2006, 92, 163–186. [Google Scholar]
- Martens, D.A. Plant residue biochemistry regulates soil carbon cycling and carbon sequestration. Soil Boil. Biochem. 2002, 32, 361–369. [Google Scholar] [CrossRef]
- Elliott, E.T. Aggregate structure and carbon, nitrogen, and phosphorus in native and cultivated soils. Soil Sci. Soc. Am. J. 1986, 50, 627–633. [Google Scholar] [CrossRef]
- Grupta, V.S.R.; Germida, J.J. Distribution of microbial biomass and its activity in different soil aggregate size classes as affected by cultivation. Soil Biochem. 1988, 20, 210–216. [Google Scholar]
- Chen, L.D.; Gong, J.; Fu, B.J.; Huang, Z.L. Effect of land use conversion on soil organic carbon sequestration in the loess hilly area, Loess Plateau of China. Ecol. Res. 2007, 22, 641–648. [Google Scholar] [CrossRef]
- IUSS Working Group WRB. World Reference Base for Soil Resources 2014, Update 2015. In International Soil Classification System for Naming Soils and Creating Legends for Soil Maps; World Soil Resources Reports No. 106; FAO: Rome, Italy, 2015. [Google Scholar]
- Jia, H.Y.; Cheng, P.G. The assessment of soil resources and its improvement and utilization Shanghuang village of Guyuan county. Mem. NISWC Acad. Sin. 1987, 5, 45–56. [Google Scholar]
- Jia, H.Y. The improvement of soil physicochemical property of grassland on Loess Plateau. Memoir of NISWC. Acad. Sin. 1987, 2, 22–26. [Google Scholar]
- Jia, H.Y.; Cheng, P.G. The soil association of land types and the change of soil nutrient on way of use. Res. Soil Water Conserv. 1990, 11, 64–70. [Google Scholar]
- Li, Y.N.; Wang, Q.X.; Du, M.Y. A study on replenishment and decomposition of organic matter in and Mat-Cryic Cambisols CO2 flux between vegetation and atmosphere. Agrestia Sin. 2008, 14, 165–169. [Google Scholar]
- Liu, M.Y.; An, S.S.; Chang, Q.R. Features of soil organic carbon under different land use in mountain area of southern Ningxia. Res. Soil Water Conserv. 2005, 12, 47–49. [Google Scholar]
- Xue, Z.; Cheng, M.; An, S. Soil nitrogen distributions for different land uses and landscape positions in a small watershed on Loess Plateau, China. Ecol. Eng. 2013, 60, 204–213. [Google Scholar] [CrossRef]
- Nelson, W.; Sommer, L.E. Total carbon, organic carbon and organic matter. In Methods of Soil Analysis. Part 2; Sparks, D.L., Page, A.L., Helmke, R.A., Loeppert, R.H., Sottanpor, P.N., Tabatabai, M.A., Johnson, C.T., Sumner, M.E., Eds.; American Society of Agronomy and Soil Science Society of America: Madison, WI, USA, 1975. [Google Scholar]
- Ariel, E.L.; Mary, J.S. Land use and organic carbon content of some subtropical soils. Plant Soil 1986, 96, 185–196. [Google Scholar]
- Davidson, E.A.; Ackerman, I.L. Changes in soil carbon inventories following cultivation of previously untilled soils. Biogeochemistry 1993, 20, 161–193. [Google Scholar] [CrossRef]
- Post, W.M.; Mann, L.K. Changes in soil organic carbon and nitrogen as a result of cultivation. In Soils and the Greenhouse Effect; Bouwman, A.F., Ed.; John Wiley & Sons: New York, NY, USA, 1990; pp. 401–406. [Google Scholar]
- Post, W.M.; Kwon, K.C. Soil carbon sequestration and land-use change: Processes and potential. Glob. Chang. Boil. 2000, 6, 317–328. [Google Scholar] [CrossRef]
- Su, Z.Y.; Xiong, Y.M.; Zhu, J.Y.; Ye, Y.C.; Ye, M. Soil organic carbon content and distribution in a small landscape of Dongguan, south China. Pedosphere 2006, 16, 10–17. [Google Scholar] [CrossRef]
- Zhu, X.; Han, X.Z. Effect of land use on nitrogen content in black soil. Jiangsu J. Agric. Sci. 2008, 24, 843–847. [Google Scholar]
- Li, X.L.; Tian, J.Y.; Zhang, C.E. A study on effects of different types of forest on the loess plateau on physical properties of soil. Sci. Silvae Sin. 1992, 28, 98–106. [Google Scholar]
- Wu, J.G.; Zhang, X.Q.; Xu, D.Y. The mineralization of soil organic carbon under different land uses in the Liupan mountain forest zone. Acta Phytoecol. Sin. 2004, 59, 621–628. [Google Scholar]
- Liu, M.Y.; An, S.S.; Chang, Q.R.; Du, C.S. Features of soil chemical property under different land use. J. Northwest Sci.-Tech. Univ. Agric. For. 2005, 33, 39–42. [Google Scholar]
- Jobbagy, E.G.; Robert, B.J. The vertical distribution of soil organic carbon and it’s relation to climate and vegetation. Ecol. Appl. 2002, 10, 423–436. [Google Scholar] [CrossRef]
- Zhou, M.H.; Cheng, J.M.; Wang, H.E. Distribution characteristics of the root system of the Stipa bungeana Trin. Community in Yunwu Mountain. Agrestia Sin. 2008, 16, 267–271. [Google Scholar]
- Li, J.F.; Cheng, J.M.; Liu, W.; Gu, X.L. Distribution of soil organic carbon and total nitrogen of grassland in Yunwu Mountain of loess plateau. Acta Agrestia Sin. 2010, 18, 661–668. [Google Scholar]
- Xue, X.H.; Lu, F.; Zhang, X.C. Distribution of soil organic matters on loess plateau of Northern Shaanxi. J. Northwest Sci.-Tech. Univ. Agric. For. 2005, 33, 69–74. [Google Scholar]
- Li, D.; Wang, Z.F.; Zheng, B.J.; Gao, M. Contents of soil organic matter, nitrogen, phosphorus and potassium under different land-use patterns in purple hill area. Chin. J. Soil Sci. 2009, 40, 310–314. [Google Scholar]
- Wei, L.Y.; ShangGuan, Z.P. Relationship between vertical distribution of fine root in different successional stages of herbaceous vegetation and soil environment in loess plateau. Acta Ecol. Sin. 2006, 26, 3741–3747. [Google Scholar]
- Hogberg, M.N.; Hogberg, P.; Myrold, D.D. Is microbial community composition in boreal forests oils determined by pH, C-to-N ratio, the trees, or all three? Oecologia 2007, 150, 590–601. [Google Scholar] [CrossRef] [PubMed]
- Tang, G.Y.; Su, Y.R.; Xiao, H.A.; Huang, D.Y.; Liu, S.L.; Huang, M.; Wu, J.S. The spatial variability of soil organic carbon, nutrients and microbial biomass in red soil paddy of hilly Xiang Bei. Plant Nutr. Fertil. Sci. 2007, 13, 15–21. [Google Scholar]
- O’Brien, S.L.; Jastrow, J.D.; Grimley, D.A.; Gonzalez-Meler, M.A. Moisture and vegetation controls on decadal-scale accrual of soil organic carbon and total nitrogen in restored grasslands. Glob. Chang. Boil. 2010, 16, 2573–2588. [Google Scholar] [CrossRef]
- Tong, C.L.; Xiao, H.A.; Tang, G.Y.; Wang, H.; Huang, T.; Xia, H.; Keith, S.J.; Li, Y.; Liu, S.; Wu, J. Long-term fertilizer effects on organic carbon and total nitrogen and coupling relationships of C and N in paddy soils in subtropical China. Soil Tillage Res. 2009, 106, 8–14. [Google Scholar] [CrossRef]
- Fu, X.L.; Shao, M.G.; Wei, X.R.; Horton, R. Soil organic carbon and total nitrogen as affected by vegetation types in northern Loess Plateau of China. Geoderma 2010, 155, 31–35. [Google Scholar] [CrossRef]
- Dignac, M.F.; Bahri, H.; Rumpel, C.; Rasse, D.P.; Bardoux, G.; Balesdent, J.; Girardin, C.; Chenu, C.; Mariotti, A. Carbon-13 natural abundance as a tool to study the dynamics of lignin monomers in soil: An appraisal at the Closeaux experimental field (France). Geoderma 2005, 128, 3–17. [Google Scholar] [CrossRef]
- Puget, P.; Drinkwater, L.E. Short-term dynamics of root-and shoot-derived carbon from a leguminous green manure. Soil Sci. Soc. Am. J. 2001, 65, 771–779. [Google Scholar] [CrossRef]
Figure 1.
Land uses conversion of the Shanghuang watershed between 1982 and 2010. (a) in 1982; (b) in 1990; (c) in 2005; (d) in 2010.
Figure 1.
Land uses conversion of the Shanghuang watershed between 1982 and 2010. (a) in 1982; (b) in 1990; (c) in 2005; (d) in 2010.

Figure 2.
Correlations between SOC and total N during 2010 in the different land uses. (a) Shrub land; (b) Manmade grassland; (c) Natural grassland; (d) Farmland; (e) Abandoned farmland.
Figure 2.
Correlations between SOC and total N during 2010 in the different land uses. (a) Shrub land; (b) Manmade grassland; (c) Natural grassland; (d) Farmland; (e) Abandoned farmland.


Figure 3.
Distributions of soil bulk density (BD), soil organic carbon density (SOCD), and nitrogen density (SND) among the different land uses in 2005 and 2010. (a) Soil bulk density; (b) Soil organic carbon density; (c) Soil nitrogen density.
Figure 3.
Distributions of soil bulk density (BD), soil organic carbon density (SOCD), and nitrogen density (SND) among the different land uses in 2005 and 2010. (a) Soil bulk density; (b) Soil organic carbon density; (c) Soil nitrogen density.


Figure 4.
Soil carbon and nitrogen storage of different land use types in 2005 and 2010. (a) Soil carbon storage; (b) Soil nitrogen storage.
Figure 4.
Soil carbon and nitrogen storage of different land use types in 2005 and 2010. (a) Soil carbon storage; (b) Soil nitrogen storage.


Table 1.
Land use conversion between 1982 to 2010 among various land uses.
| Land Use | Area (ha) | |||||||
|---|---|---|---|---|---|---|---|---|
| 1982 | 1990 | 2005 | 2010 | |||||
| Area (ha) | (%) | Area (ha) | (%) | Area (ha) | (%) | Area (ha) | (%) | |
| Farmland | 320.11 | 39.70 | 316.1 | 39.26 | 407.61 | 50.55 | 130.35 | 16.16 |
| Orchard | 4.68 | 0.58 | 1.05 | 0.13 | 19.38 | 2.40 | 27.68 | 3.43 |
| Shrub land | 5.31 | 0.66 | 97.13 | 12.02 | 174.50 | 21.64 | 539.22 | 66.87 |
| Natural grassland | 371.33 | 46.05 | 283.78 | 35.03 | 112.81 | 13.99 | 44.73 | 7.16 |
| Manmade grassland | 5.00 | 0.62 | 42.00 | 5.22 | 34.00 | 4.22 | 13.00 | 5.55 |
| Total | 87.61 | 91.66 | 92.8 | 99.61 | ||||
Note: The area was the statistical data from remote sensing. It was divided into kinds of land uses; we just choose useful ones displayed in table.
Table 2.
Sampling strategies from 1987 to 2010.
| Soil Depth (cm) | Land Use Types | Sample (Num.) | Area (ha) | % | Reference and Acknowledgments | |
|---|---|---|---|---|---|---|
| 1987 | 0–10 | Natural grassland | 35 | 354.34 | 13.28 | [30,31,32]; |
| 2005 | 0–20 20–40 | Shrub land | 15 | 174.5 | 23.70 | [12,33,34] The Nation Sciences Foundation of China (40701095) |
| Manmade grassland | 10 | 34 | 4.62 | |||
| Natural grassland | 6 | 112.81 | 15.32 | |||
| Farmland | 8 | 407.61 | 55.36 | |||
| Abandoned farmland | 6 | 7.36 | 1 | |||
| 2010 | 0–10 10–30 30–60 | Shrub land | 6 | 539.20 | 73.72 | [35]; The Nation Sciences Foundation of China (40971171) |
| Manmade grassland | 5 | 44.73 | 6.12 | |||
| Natural grassland | 8 | 13 | 1.78 | |||
| Farmland | 10 | 4.10 | 0.56 | |||
| Abandoned farmland | 13 | 130.4 | 17.83 |
Table 3.
Concentration of SOC and total N in 1987, 2005, and 2010.
| Land Uses | Sample Num. | Soil Organic Carbon (g·kg−1) | Total Nitrogen (g·kg−1) | |||||
|---|---|---|---|---|---|---|---|---|
| 1987 | Natural grassland | 35 | 0–10 cm | |||||
| 5.90 ± 1.25 | 0.70 ± 0.13 | |||||||
| 2005 | Soil layer (cm) | 0–20 | 20–40 | 0–20 | 20–40 | |||
| Shrub land | 15 | 14.4 ± 0.92 b | 11.8 ± 0.83 a | 1.17 ± 0.12 a | 0.77 ± 0.11 a | |||
| manmade grassland | 10 | 11.7 ± 0.18 c | 8.52 ± 0.14 c | 0.85 ± 0.13 c | 0.55 ± 0.11 b | |||
| Natural grassland | 6 | 16.6 ± 1.02 a | 10.9 ± 1.36 a | 1.88 ± 0.23 b | 0.87 ± 0.12 b | |||
| Farmland | 8 | 8.76 ± 0.21 c | 7.09 ± 10.9 b | 0.72 ± 0.11 c | 0.60 ± 0.08 b | |||
| Abandoned farmland | 6 | 14.7 ± 1.22 d | 10.8 ± 1.12 c | 1.07 ± 0.12 ab | 0.88 ± 0.09 a | |||
| 2010 | Soil layer (cm) | 0–10 | 10–30 | 30–60 | 0–10 | 10–30 | 30–60 | |
| Shrub land | 6 | 11.7 ± 4.45 b | 8.25 ± 3.16 b | 4.36 ± 1.74 b | 0.99 ± 0.34 ab | 0.72 ± 0.34 a | 0.51 ± 0.24 ab | |
| Manmade grassland | 5 | 7.45 ± 3.40 d | 5.72 ± 2.38 c | 3.49 ± 1.61 c | 0.73 ± 0.37 c | 0.62 ± 0.33 b | 0.43 ± 0.28 b | |
| Natural grassland | 8 | 17.0 ± 2.60 a | 11.5 ± 1.72 a | 6.44 ± 1.16 a | 1.38 ± 0.31 a | 1.13 ± 0.23 a | 0.60 ± 0.17 a | |
| Farmland | 10 | 7.21 ± 1.74 d | 5.95 ± 1.84 c | 4.81 ± 1.46 c | 0.61 ± 0.22 c | 0.56 ± 0.27 b | 0.47 ± 0.23 b | |
| Abandoned farmland | 13 | 8.33 ± 5.15 c | 6.40 ± 3.17 b | 3.88 ± 2.39 bc | 0.92 ± 0.35 b | 0.80 ± 0.28 a | 0.53 ± 0.18 a | |
Values are mean ± standard. The lower letters are significantly different at p < 0.05.
Table 4.
C/N ratios among different land uses in 1987, 2005, and 2010.
| Land Uses | Sample Num. | C/N Ratio | |||
|---|---|---|---|---|---|
| 1987 | Soil layer (cm) | 0–10 | |||
| Natural grassland | 35 | 8.43 ± 1.71 | |||
| 2005 | Soil layer (cm) | 0–20 | 20–40 | ||
| Shrub land | 15 | 12.31 ± 3.12 | 15.32 ± 5.16 | ||
| Manmade grassland | 10 | 13.76 ± 3.88 | 15.49 ± 4.98 | ||
| Natural grassland | 6 | 14.07 ± 4.26 | 12.53 ± 3.56 | ||
| Abandoned grassland | 6 | 13.74 ± 3.95 | 12.27 ± 3.46 | ||
| Farmland | 8 | 12.17 ± 3.85 | 11.82 ± 2.76 | ||
| 2010 | Soil layer (cm) | 0–10 | 10–30 | 30–60 | |
| Shrub land | 6 | 11.79 ± 3.20 | 11.47 ± 2.35 | 8.50 ± 3.59 | |
| Manmade grassland | 5 | 10.24 ± 2.55 | 9.31 ± 1.83 | 8.12 ± 2.11 | |
| Natural grassland | 8 | 12.35 ± 4.06 | 10.18 ± 4.39 | 10.76 ± 3.47 | |
| Farmland | 10 | 11.81 ± 2.96 | 10.60 ± 4.98 | 10.09 ± 5.07 | |
| Abandoned grassland | 13 | 9.01 ± 2.12 | 7.99 ± 2.19 | 7.35 ± 1.92 | |
Values are mean ± standard.
Table 5.
Distributions of soil carbon and nitrogen storage. (a) SSOC and STN of natural grassland in the 0–10 cm profile depth; (b) SSOC and STN for the different land use types in 2005 and 2010.
Table 5.
Distributions of soil carbon and nitrogen storage. (a) SSOC and STN of natural grassland in the 0–10 cm profile depth; (b) SSOC and STN for the different land use types in 2005 and 2010.
| (a) | ||||||||
| Land Use Types | DSOC (g·cm−2) | DTN (g·cm−2) | SSOC (108 g) | STN (108 g) | ||||
| Natural grassland | 1987 | 0.74 | 0.09 | 571.8 | 144.81 | |||
| 2010 | 1.90 | 0.15 | 221.1 | 26.61 | ||||
| (b) | ||||||||
| Land Use Types | DSOC (g·cm−2) | DTN (g·cm−2) | % | SSOC (108 g) | % | STN (108 g) | % | |
| 2005 | Shrub land | 4.83 | 0.46 | 23.70 | 842.31 | 24.33 | 80.93 | 24.67 |
| Manmade grassland | 3.54 | 0.39 | 4.62 | 120.53 | 3.48 | 13.26 | 4.04 | |
| Natural grassland | 6.76 | 0.62 | 15.32 | 762.92 | 22.04 | 69.52 | 21.19 | |
| Farmland | 4.19 | 0.39 | 55.36 | 1708.38 | 49.35 | 160.88 | 49.04 | |
| Abandoned farmland | 3.77 | 0.47 | 1 | 27.72 | 0.80 | 3.47 | 1.06 | |
| Total | 3461.86 | 328.05 | ||||||
| 2010 | Shrub land | 6.33 | 0.47 | 73.72 | 3413.14 | 75.78 | 252.28 | 75.52 |
| Manmade grassland | 4.98 | 0.35 | 6.12 | 222.58 | 4.94 | 15.44 | 4.62 | |
| Natural grassland | 6.07 | 0.45 | 1.78 | 78.95 | 1.75 | 5.88 | 1.76 | |
| Farmland | 3.44 | 0.29 | 0.56 | 14.09 | 0.31 | 1.17 | 0.35 | |
| Abandoned farmland | 5.95 | 0.45 | 17.83 | 775.28 | 17.21 | 59.27 | 17.74 | |
| Total | 4504.04 | 334.04 | ||||||
© 2018 by the authors. Licensee MDPI, Basel, Switzerland. This article is an open access article distributed under the terms and conditions of the Creative Commons Attribution (CC BY) license (http://creativecommons.org/licenses/by/4.0/).
Share and Cite
MDPI and ACS Style
Xue, Z.; An, S. Changes in Soil Organic Carbon and Total Nitrogen at a Small Watershed Scale as the Result of Land Use Conversion on the Loess Plateau. Sustainability 2018, 10, 4757. https://doi.org/10.3390/su10124757
AMA Style
Xue Z, An S. Changes in Soil Organic Carbon and Total Nitrogen at a Small Watershed Scale as the Result of Land Use Conversion on the Loess Plateau. Sustainability. 2018; 10(12):4757. https://doi.org/10.3390/su10124757
Chicago/Turabian StyleXue, Zhijing, and Shaoshan An. 2018. "Changes in Soil Organic Carbon and Total Nitrogen at a Small Watershed Scale as the Result of Land Use Conversion on the Loess Plateau" Sustainability 10, no. 12: 4757. https://doi.org/10.3390/su10124757
Note that from the first issue of 2016, this journal uses article numbers instead of page numbers. See further details here.