Article

The Spatial-Temporal Characteristics and Dilemmas of Sustainable Urbanization in China: A New Perspective Based on the Concept of Five-in-One

School of Public Administration, China University of Geosciences, Wuhan 430074, China
*
Author to whom correspondence should be addressed.
Sustainability 2018, 10(12), 4733; https://doi.org/10.3390/su10124733
Submission received: 17 October 2018 / Revised: 16 November 2018 / Accepted: 8 December 2018 / Published: 12 December 2018
(This article belongs to the Special Issue Urban Transformations Towards Sustainability)

Abstract

:
A large amount of ink has been spilled to paint the picture of China’s urbanization. However, more research might be done on the connotation of sustainable urbanization in China. On the basis of a literature review, this study is the first to propose the perspective of evaluating the sustainability of urbanization from the five dimensions of urbanization: economic, political, cultural, social, and ecological. Based on the Analytic Hierarchy Process (AHP) method and entropy method, a five-dimensional indicator system was established to evaluate the urbanization quality of 31 provincial regions in China during 2005–2015. Then, the coupling coordination degree model was used to calculate the coupling coordination degree of the five dimensions for each region. Furthermore, Moran’s I index and a local indicators of spatial association (LISA) cluster map were used to measure and describe the spatial disparity. Finally, a factor identification model was used to recognize the weaknesses of each region. This study leads to four major findings. (1) In 2015, only ecological urbanization had a high-quality and balanced development, while the development of cultural urbanization was inadequate and regionally unbalanced. Economic, ecological, and cultural dimensions had a significantly positive global spatial autocorrelation. The local spatial autocorrelation varies with dimension. (2) The quality of comprehensive urbanization increased during 2005–2015, while the regional disparity experienced a reduction. A positive global spatial autocorrelation was shown during 2005–2015. The High-High type in the eastern coastal areas centralized over time, while the Low-Low type in the western areas experienced a decline, and the Low-High type was stabilized in the central areas. Only Chongqing was in the High-Low type in 2015. (3) The increase of coupling coordination degree and decrease of coefficient of variation indicated a favorable situation. The coupling coordination degree also had a positive global spatial autocorrelation during 2005–2015. Both the High-High and Low-Low types experienced an obvious shrink and displacement. The Low-High type expanded and centralized in the central areas, while the High–Low type was in Guangdong in 2005, and in Chongqing in 2015. (4) The highest obstacle degrees of each region were all within the cultural dimension, while the ecological dimension caused the least resistance. The lack of innovation had become the biggest barrier in most regions. Based on the above conclusions, this paper concludes with recommendations for policy makers to advance sustainable urbanization in China. Meanwhile, this study can provide lessons and suggestions for other developing countries in the world.

1. Introduction

Urbanization, which is defined as the population shift from rural to urban areas, has been one of the world’s most influential events in the 20th and 21st centuries [1,2]. With the acceleration of economic globalization, the setup of global urbanization has been experiencing rapid reconstruction. According to Northam’s curve [3,4,5], urbanization in the United States and European countries reached the final stage when the proportion of urban population exceeded 70%, and the focus of world urbanization shifted to developing countries, such as China, which has been pursuing urbanization as a national strategy for the overall urban–rural development [6]. Back in 2004, the United Nations (UN) predicted that the urbanization rate of China would reach 50% by 2020. In fact, since the reform and opening-up in 1978, the proportion of urbanization in China has witnessed an annual increase of 1.36% on average and reached 57.35% in 2016 (Figure 1), which is expected to exceed 60% by 2020. Meanwhile, the urban built-up area has increased from 7438 km2 in 1981 to 54,300 km2 in 2016, experiencing a 6.3-fold increase. The explosion of urban population and built-up area makes it obvious that China has experienced an unprecedented process of urbanization since the government’s strict regulation on intra-country migration slackened in 1978 [7].
China’s urbanization has been considered unique, because it has not duplicated the model of developed economies, nor was it identical to that of developing countries [8]. Data from the World Bank revealed that the cumulative decrease of the poverty-stricken population in China reached 728 million between 1981–2015, accounting for 82% of the total decrease in the world. Undeniably, with the overall advancement of urbanization, China has made remarkable achievements in economic development and poverty reduction. However, rapid urbanization also has its side effects, such as population explosion, rapid land sprawl, the relentless occupation of fertile farmland [9], the continued degradation of water and soil resources, and so on [10,11,12,13]. The above-mentioned threats put the human living environment onto a severe trial [14,15]. In summary, China has pursued an accelerated but unbalanced urbanization model for a long time [16,17]. It was within this context that in 2014 the Central Committee of the Communist Party of China (CPC) and the State Council jointly released the National New Urbanization Planning (2014–2020)” (NNUP). Traditional urbanization focuses on urbanization speed and economic benefits, rather than urbanization quality and comprehensive benefits. Although traditional urbanization has enjoyed a strong momentum, it is unsustainable [18]. Compared with the traditional urbanization in China, the NNUP aims to discard the dross and select the essence, identifying sustainability as a guiding principle for urbanization [19].
Sustainable urbanization has been emphasized by many scholars, which is regarded as an effective way to solve the potential problems, such as food safety, ecological deterioration, and unsustainable situations [20,21]. The concept of sustainable development was initially proposed in 1972 at the UN Conference, and it was promoted as a significant component of sustainable development [22]. According to the European Commission (2006), sustainable urbanization was defined as the challenge of solving the problems experienced within cities and problems caused by cities, admitting that cities themselves could provide enough feasible solutions [23]. Based on the sustainable development theory, sustainable urbanization was defined as an urbanization practice that complies with sustainable development principles [24]. It is not only a dynamic process, but also a complex integrated concept based on the system theory. Sustainable urbanization has been well established as a multi-dimensional process that covers environmental, economic, and social dimensions. Besides, more recent studies have argued that a sustainable urbanization process must also consider the governance, physical, and technological dimensions [25,26,27,28,29]. Sustainable urbanization is often characterized by issues such as the minimal use of non-renewable resources, protection of the environment, proper use of resources to guarantee generational equity, economic vitality, social stability, and satisfaction of basic human needs [30,31].
To better understand the status quo and obstacles for a region in the process of sustainable urbanization, evaluation is considered an effective method; it is a process of collecting data, selecting indicators, analyzing information, and finding patterns. Evaluation indicators are considered crucial for setting objectives, performance appraisal, and facilitating communication among policy makers, scholars, experts, and the public [32]. Various indicator systems have been developed to evaluate urbanization from different perspectives. Some scholars held the view that urban sustainability was supposed to be assessed from the aspects of economic, social, and ecological dimensions [33,34,35,36]. Zhang evaluated sustainable urbanization from the aspects of population, industry, and built-up land [37]. Moreover, a comprehensive evaluation index system in four aspects has been established, which involves population, economy, society, and land [38]. Furthermore, Li developed a Full Permutation Polygon Synthetic Indicator System with 52 indicators covering economic growth, ecological construction, environmental protection, and social and welfare progress [20,39]. By examining nine different practices, Shen proposed a comparative basis, namely, the International Urban Sustainability Indicators List for the better selection of indicators under different circumstances [40]. Besides, the assessment of the effectiveness of established indicator systems was supposed to be imperative, and eight typical urbanization indicator systems in China were examined [41]. The result showed that the existing indicator systems had limitations due to large inconsistencies among them. Existing evaluations that used different indicator systems cannot be compared, and might be inconsistent. Moreover, soft indicators, such as governance, corruption, and poverty, were seldom involved due to the unavailability of data [18,42].
In 2012, the report of the 18th CPC National Congress initially put forward the concept of five-in-one, which stands for promoting balanced economic, political, cultural, social, and ecological progress. This concept has been deemed to be the guiding principle of China since 2012. In 2017, the report of the 19th CPC National Congress put it in a higher strategic position. Under the situation of sustainable development, China’s new-type urbanization is supposed to embody the essence of the five-in-one overall layout, coordinate the relationship among the internal elements, and strive to form a good development momentum of prosperity, democracy, civilization, harmony, and beauty. However, existing research cannot fully reflect the epoch connotation of China’s new-type urbanization, and more research might be done on the connotation of sustainable urbanization in China.
Thus, this study aims to propose a new perspective based on the concept of five-in-one in order to evaluate the sustainability of urbanization in China holistically and objectively, trying to verify the urbanization quality and coupling coordination degree of the five aspects in 31 provincial regions during 2005–2015. Besides, the dynamic changes during the surveyed period will be tracked. Furthermore, a factor identification model was used to recognize the weaknesses of each region. In the end, recommendations were proposed for policy makers to advance sustainable urbanization in China. This paper is committed to promoting balanced economic, political, cultural, social, and ecological urbanization in China, insisting that only comprehensive coordinated development leads to sustainable urbanization. Compared with the past research, this study can help give a more detailed understanding of sustainable urbanization for the particularity of China, and provide lessons and suggestions for other developing countries in the world.

2. Background

In this study, urbanization was divided into five aspects: economic urbanization, social urbanization, ecological urbanization, cultural urbanization, and political urbanization. The five dimensions are interacted and interdependent. Literally, the five-in-one model means the integration of five-dimensional urbanization (Figure 2). Only when the five dimensions promote each other can the urbanization be called sustainable. Based on sustainable development theory [43], smart growth theory [44], man-earth relationship theory [45], and system theory [46], this model evaluates the sustainability of urbanization from five perspectives, giving a new connotation to sustainable urbanization.
Economic urbanization is the impetus to urbanization [47]. In essence, it can be interpreted as the process through which economic elements shift from agricultural sectors to non-agricultural sectors, and is caused by the change of productive forces [48]. The most striking feature of China’s urbanization was the change of industrial structure, where the agricultural industry’s contribution to total output value declined and the proportion of non-agriculture industry increased. Non-agriculture industry has the characteristic of spatial agglomeration, which can promote the expansion and establishment of cities [49]. Economic urbanization focuses on economic effectiveness; it can enhance economic development and result in many other visible benefits, such as poverty reduction [50].
Social urbanization is the foundation of urbanization. Traditional urbanization focuses on buildings, but ignores the most important thing: people living in society [51]. Cities are not only the material space consisting of buildings or structures, they are also human-centered holocoen [52]. The large income gap between urban and rural residents is the main reason for rural to urban migration in China. However, China’s system of household registration makes it difficult for migrants to gain access to urban education and health care, which has resulted in many social problems. Hence, the value of a city is not only measured by its economic strength, but also the supply of social insurance, job opportunities, and other benefits for residents [53]. Therefore, social urbanization must put people first, and build a harmonious society in its true sense.
Ecological urbanization embodies the philosophy of urbanization [54]. The philosophy of urbanization refers to the harmony between human and nature. Ecological urbanization emphasizes the importance of the ecological and environmental aspects of urbanization, which is to approach a balanced and healthy ecosystem during urbanization. In 2012, the CPC included the goal of achieving an ecological civilization in its constitution, and it also featured in its five-year plan [55]. Since 2017, the construction of ecological civilization has been considered as a crucial strategy for the next millennium. To some extent, urban construction will do some inevitable harm to the environment. Land use changes sharply under rapid urbanization, yet ecological and environmental effects are often neglected in land-use decisions [56]. Ecological urbanization lays an emphasis on the structure of vegetation coverage, energy efficiency, and pollution abatement. It inherits and transcends traditional urbanization, striving to achieve the coordinated development between nature and humanity.
Cultural urbanization affords the potential for urbanization [57]. Cultural urbanization, exactly, can be interpreted as cultural and technical urbanization. Economic indicators were often used to measure the strength of a nation, while cultural and technical indicators were not. However, culture and technology are the primary productive forces, which can accelerate the growth of the economy, develop the society, push the civilization forward, and provide new ideas for the transformation of resources-based cities [58]. Hence, if the economy is regarded as hard power, culture and technology can be seen as soft power. Cultural urbanization advocates innovation, investment in science, technology and education, and the inheritance of natural scenery, cultural relics, and art [59,60]. Cultural urbanization can upgrade the level of economic development, improve the quality of the population, and accelerate development in a profound way.
Political urbanization is the guarantee of urbanization [61]. In China, governments can choose where and how urbanization goes through policy and planning, which enables China to continue its nationwide experiment of urbanization generated by planning and strategy, rather than geography and the market [62,63]. Without control from the state and government, there will not be the thriving scene of urbanization in China. Besides, what we now face in China is the contradiction between unbalanced and inadequate development and the people’s ever-growing needs for a better life. Only geography and markets cannot eliminate this contradiction, but policies and government regulations can make sense. Political urbanization focuses on the potential for macroeconomic regulation and control to advance balanced regional development and legal construction, and guarantee the process of economic, social, ecological, and cultural urbanization.

3. Study Areas

China, officially the People’s Republic of China (PRC), is a unitary sovereign state in East Asia and one of the world’s most populous countries, with a population of around 1.404 billion. Governed by the CPC, it exercises jurisdiction over 34 provincial-level administrative regions, including 23 provinces, four directly-controlled municipalities (Beijing, Tianjin, Shanghai, and Chongqing), five autonomous regions (the Inner Mongolia Autonomous Region, the Ningxia Hui Autonomous Region, the Xinjiang Uygur Autonomous Region, the Guangxi Zhuang Autonomous Region, and Tibet), and the special administrative regions Hong Kong and Macau (Figure 3). Considering the availability for data collection, 31 provincial regions were selected as the study areas, excluding Taiwan, Hong Kong, and Macau.
In the last 30 years, China has experienced an unprecedented process of urbanization. Compared with other countries, urbanization in China has distinctive features [64]. These features are: (1) high rate of urbanization, (2) population urbanization lags behind land urbanization; (3) large and growing urban–rural income gap, (4) unbalanced economic structure of cities, and (5) strict administrative hierarchy. Nowadays, China has become the world’s second largest economy, and the principal social contradiction has translated into the contradiction between unbalanced and inadequate development and the people’s ever-growing needs for a better life. People look forward to a better environment, living conditions, education, jobs, medical treatment, social security, and social equity. Therefore, China’s new-type urbanization is supposed to promote balanced economic, political, cultural, social, and ecological urbanization rather than merely the pursuit of economic growth. Besides, China is confronted with challenges of unbalanced development between west China and east China, as well as unbalanced development between rural and urban areas. So, the question of how to promote balanced and coordinated development has become an inevitable problem in China at present. Therefore, this study selects China as the study area, which is believed to be typical.

4. Materials and Methods

4.1. Data Sources and Data Pre-Processing

4.1.1. Data Sources

The data utilized in this study can be divided into three categories: statistical data, demographic data, and vector data (Table 1). The statistical data were collected or calculated from Chinese central statistical yearbooks. In addition, the provincial statistical yearbooks of 31 regions were used as supplemental materials. The case study focused on the dynamic changes of China from 2005 to 2015. There is a tradition of Chinese official statistical yearbooks that the data published were actually from the previous year. That is to say, the data of 2005, 2010, and 2015 were recorded in the 2006, 2010, and 2016 versions of the statistical yearbooks respectively.

4.1.2. Data Pre-Processing

The numeric data that was used for evaluation was collected or calculated from China’s official statistical yearbooks, while different data may have different units and characteristics. Therefore, in order to eliminate the influence of dimension, magnitude, and positive and negative orientation, the numeric data needs pre-processing. In this study, the standardization method of the data range was used to pre-process the original data (Formula (1)) [37,65]. After the transformation, all the indicators’ values were transformed into normalized values with a numerical range from 0 to 1. For an indicator, if one region has a high normalized value, that is to say, the region does well in this field. The larger the value is, the better the quality will be.
X i = { ( X i X m i n ) / ( X m a x X m i n ) ( p o s i t i v e   i n d i c a t o r ) ( X m a x X i ) / ( X m a x X m i n ) ( n e g a t i v e   i n d i c a t o r )
where X i means the normalized value, X i refers to the original value, and X m a x and X m i n are the maximum and minimum values, respectively.

4.2. Construction of Five-Dimensional Indicator System

The indicator system consists of five dimensions, which are economic, social, ecological, cultural, and political. First, the original indicator database was identified after the literature review of existing research studies. Then, based on the principle of being scientific, representative, systematic, comparable, and the availability of data, we initially established the indicator system for the particularity of China. To guarantee authority, the indicators were sent to experts and decision makers from urbanization-related fields. After several rounds of elimination and supplement, the final five-dimensional indicator system was established (Table 2). It is convincing that the selection of variables was objective.

4.3. Determining the Indicators’ Weight Determine the Weight

There are many scientific approaches to determine the weight of variables. The Analytic Hierarchy Process (AHP) method, which was initially proposed by Myers and Alpert in 1968 [66] and advanced by Saaty in 1977 [67], is a flexible, simple, and practical multi-criteria assessment method. This method was used to determine the subjective weight of indicators. Besides, the entropy weight method was introduced to calculate the objective weight of each indicator in this study. However, although the AHP method obtains the results reasonably, it leads to relatively strong subjectivity. Similarly, the entropy weight method gets the results with strong objectivity, but lacks the experts’ experience and decision makers’ decisions, which may be inconsistent with the practical situation [68,69]. Therefore, in order to make the evaluation more scientific, accurate, and comprehensive, the combination weight is adopted to synthesize the subjective weight and objective weight.

4.3.1. The AHP Method

The AHP method has been widely used for preference analysis in complex, multi-attribute problems [70]. The three levels in the five-dimensional indicator system are corresponding to the three hierarchies in AHP, respectively. The detailed steps are shown in Figure 4. After the normalization, the subjective weights of the evaluation indicators determined by the AHP method can be obtained as W = ( w 1 , w 2 , , w n ) , which satisfies the condition 0 w j 1 , j = 1 n w j = 1 .

4.3.2. The Entropy Weight Method

The information entropy, as introduced by Shannon [71], could measure the disorder degree of system information, and reflect the amount of useful information of the data [72]. The smaller the entropy of an indicator, the greater the amount of information provided by the indicator, and the greater the role it plays in the comprehensive evaluation. Accordingly, it deserves a higher weight [73]. The processes are as follows:
(1) Set the decision matrix R = ( r i j ) m × n = R = [ r 11 r 12 r 1 n r 21 r 22 r 2 n r m 1 r n 2 r m n ] , where r i j is the normalized value of the i th evaluation object to the j th indicator. In this study, we have 31 evaluation objects and 30 indicators; therefore, m = 31, n = 30.
(2) Calculate the contribution of the i th evaluation object to the j th indicator.
p i j = r i j / i = 1 m r i j
(3) Calculate the entropy value of the j th indicator.
The entropy value e j represents the total contribution of all the evaluation objects to the j th indicator.
e j = k i = 1 m p i j l n p i j
where k = 1 / l n m .
(4) Calculate the diversity coefficient D j of the j th indicator.
The diversity coefficient D j indicates the inconsistency degree of each evaluation object’s contribution under the j th indicator. From the following formula, it is observed that the greater the D j is, the more important the j th indicator will be:
D j = 1 e j
(5) Determine the weight coefficient:
u j = D j / j = 1 n D j
where u j means the objective weight of the j th indicator. Thus, the objective weights determined by the entropy weight method can be obtained as U = ( u , u 2 , , u n ) , satisfies the condition 0 u j 1 ≤ 1, j = 1 n u j = 1 .

4.3.3. Determine the Combination Weight

Based on the above calculation, the combination weight λ j is adopted to synthesize the subjective weight ( w j ) and objective weight ( u j ) , as shown in the following equation:
λ j = α w j + β u j
where α and β satisfy the condition α ,   β > 0 , α + β = 1 . α and β respectively represent the combination coefficients of subjective and objective weights, which directly determine the final result of the combination weight. This study considers both subjective and objective weight as equally important; therefore, α = β = 0.5 . Finally, according to the previous steps, the combination weights can be obtained as λ = ( λ 1 , λ 2 , , λ n ) .

4.4. Calculation of Urbanization Quality

Based on the normalized values and weights of indicators system, the urbanization quality of the criterion level was calculated. U ( g ) ,   U ( s ) ,   U ( e ) ,   U ( c ) , and U ( p ) represent the economic, social, ecological, cultural, and political urbanization quality indexes, respectively.
U ( x ) = j = 1 n ( X j × λ j )
where x namely is g , s , e , c , or p ; X j means the normalized value of indicator j ; while λ j is the corresponding relative index weight, and n represents the quantity of indicators at each criterion level.
Then, we get the comprehensive urbanization quality ( T ) by Formula (8):
T = a U ( g ) + b U ( s ) + c U ( e ) + d U ( c ) + e U ( p )
where a ,   b ,   c ,   d ,   e denote the contribution of economic, social, ecological, cultural, and political urbanization, respectively.

4.5. The Coupling Coordination Degree Model

The concept of coupling stems from the physics [74,75,76]. Coupling describes the phenomenon by which two or more systems influence each other through interactive mechanisms [77,78,79,80]. So, coupling can be used to identify the relationship among the five aspects of urbanization. The mathematic formula can be written as:
C = { ( u 1 , u 2 , , u m ) / ( u i + u j ) } 1 n
where u i refers to the evaluation function of each subsystem: i = 1 ,   2 ,   3 , ,   m .
However, the inadequacy of this model is that, once one subsystem’s value is 0, no matter whatever the other subsystems’ values are, the coupling degree is 0. This situation obviously doesn’t comply with the reality of the socioeconomic system [78]. Besides, the values of the coupling degree distribute in a relative narrow range, which leads to the lack of hierarchy. Hence, this study tries to deduce a new model that can overcome the above problem based on the statistical coefficient of variation. The revised coupling degree model is specified as follows:
C = 2 5 { [ U ( g ) ] 2 + [ U ( s ) ] 2 + [ U ( e ) ] 2 + [ U ( c ) ] 2 + [ U ( p ) ] 2 } / [ U ( g ) + U ( s ) + U ( e ) + U ( c ) + U ( p ) ] 2
where C refers to the coupling degree coefficient of the five dimensions, with a value between zero and one. It could well reflect the coupling degree of the economic, social, ecological, cultural and political urbanization quality. When U ( g ) ,   U ( s ) ,   U ( e ) ,   U ( c ) , and U ( p ) have non-zero identical values, C is equal to one, which means that the system has the highest coupling degree. There is one special situation, in which when the function values of the five subsystems are all equal to one, optimum-resonance coupling occurs. When C is equal to zero, the five subsystems are entirely independent.
The coupling degree can only signify how strongly the five subsystems interact with each other without reflecting the level of coordination development [37], which makes it required to introduce the coupling coordination degree model as follows [74,75,76,77,78,79,80]:
D = C × T
where D refers to the coupling coordination degree of each dimension.

4.6. Spatial Autocorrelation and Identification of Clusters

The well-known “First Law of Geography” [81], which is the foundation of the fundamental concepts of spatial dependence and spatial autocorrelation, defines that everything is related to everything else, but near things are more related than distant things. Spatial analysis techniques allow us to study where specific phenomena appear in space, and identify relationships with other phenomena that occur at the same time and in the same place [82,83].
With this in mind, we used the Global Moran’s I to explain the extent to which the factors that are analyzed are spatially grouped, dispersed, or distributed in a random manner [84]. The Global Moran’s I is defined as:
I = n W i = 1 n j = 1 n w i j ( x i x ¯ ) ( x j x ¯ ) i = 1 n ( x i x ¯ ) 2
where n is the number of spatial units indexed by i and j ; x refers to the variable; x ¯ denotes the mean of x ; w i j is a matrix of spatial weights of unit i and j with zeroes on the diagonal; and W is the sum of all w i j . The value of I ranges from −1 to 1. When the value of I is less than zero, the spatial autocorrelation is negative. The larger the absolute value of I , the stronger the spatial autocorrelation. When the value is equal to zero, it indicates the spatial randomness.
Global Moran’s I just use one statistic to summarize the whole study area, which means that global analysis assumes spatial homogeneity. However, here is a situation in which there is no global autocorrelation or clustering, but we can still find clusters at a local level. Therefore, the Local Moran’s I, which is defined as the local version of Moran’s I, was used to evaluate the clustering in those individual units [85,86,87]. The model is specified as follows:
I i = n ( x i x ¯ ) i = 1 n ( x i x ¯ ) 2 j = 1 n w i j ( x j x ¯ )
Utilizing maps of local indicators of spatial association (LISA), the Local Moran’s I i indicator makes it possible to distinguish areas with high and low spatial values, as well as outliers and elements with no statistical significance [86]. Clusters with a high value of urbanization were identified as the High–High type, while those clusters with low value were identified as the Low–Low type. The High–Low and Low–High types were considered outliers. When applying the local Moran I indicator did not provide significant results, these regions were identified as the Not Significant type.

4.7. Obstacle Identification

After the statistical evaluation of the urbanization quality, it is crucial for the identification of the obstacle factors that limit the quality of urbanization. Factor contribution ( F j ), index deviation ( I j ) and obstacle degree ( O j ) were introduced to build the factor identification model.
Firstly, the F j and I j were calculated:
F j = λ j
I j = 1 X j
Then, the O j of each indicator was calculated:
O j = ( I j × F j ) / j = 1 n I j × F j
Based on the obstacle degree of each indicator, the obstacle degree of each criterion Q i was calculated:
Q i = j = 1 n O i j
where n refers to the indicator amount in the i th criterion.

5. Results

The above equations were used to calculate the five-dimensional urbanization quality of 31 provincial regions in 2015, the comprehensive urbanization quality, and the coupling coordination degree in 2005, 2010, and 2015. Based on the results, ArcGIS (Ver.10.2, ESRI, Redlands, California, USA) software and Origin (Ver.8.0, Originlab Corporation, Wellesley Hills, MA, USA) software were used to create the maps. Geoda (Ver.1.6.7, the Center for Spatial Data Science, Chicago, IL, USA) was used to calculate the Global Moran’s I indexes and create the LISA cluster maps. Finally, the obstacle factors in 2015 were identified.

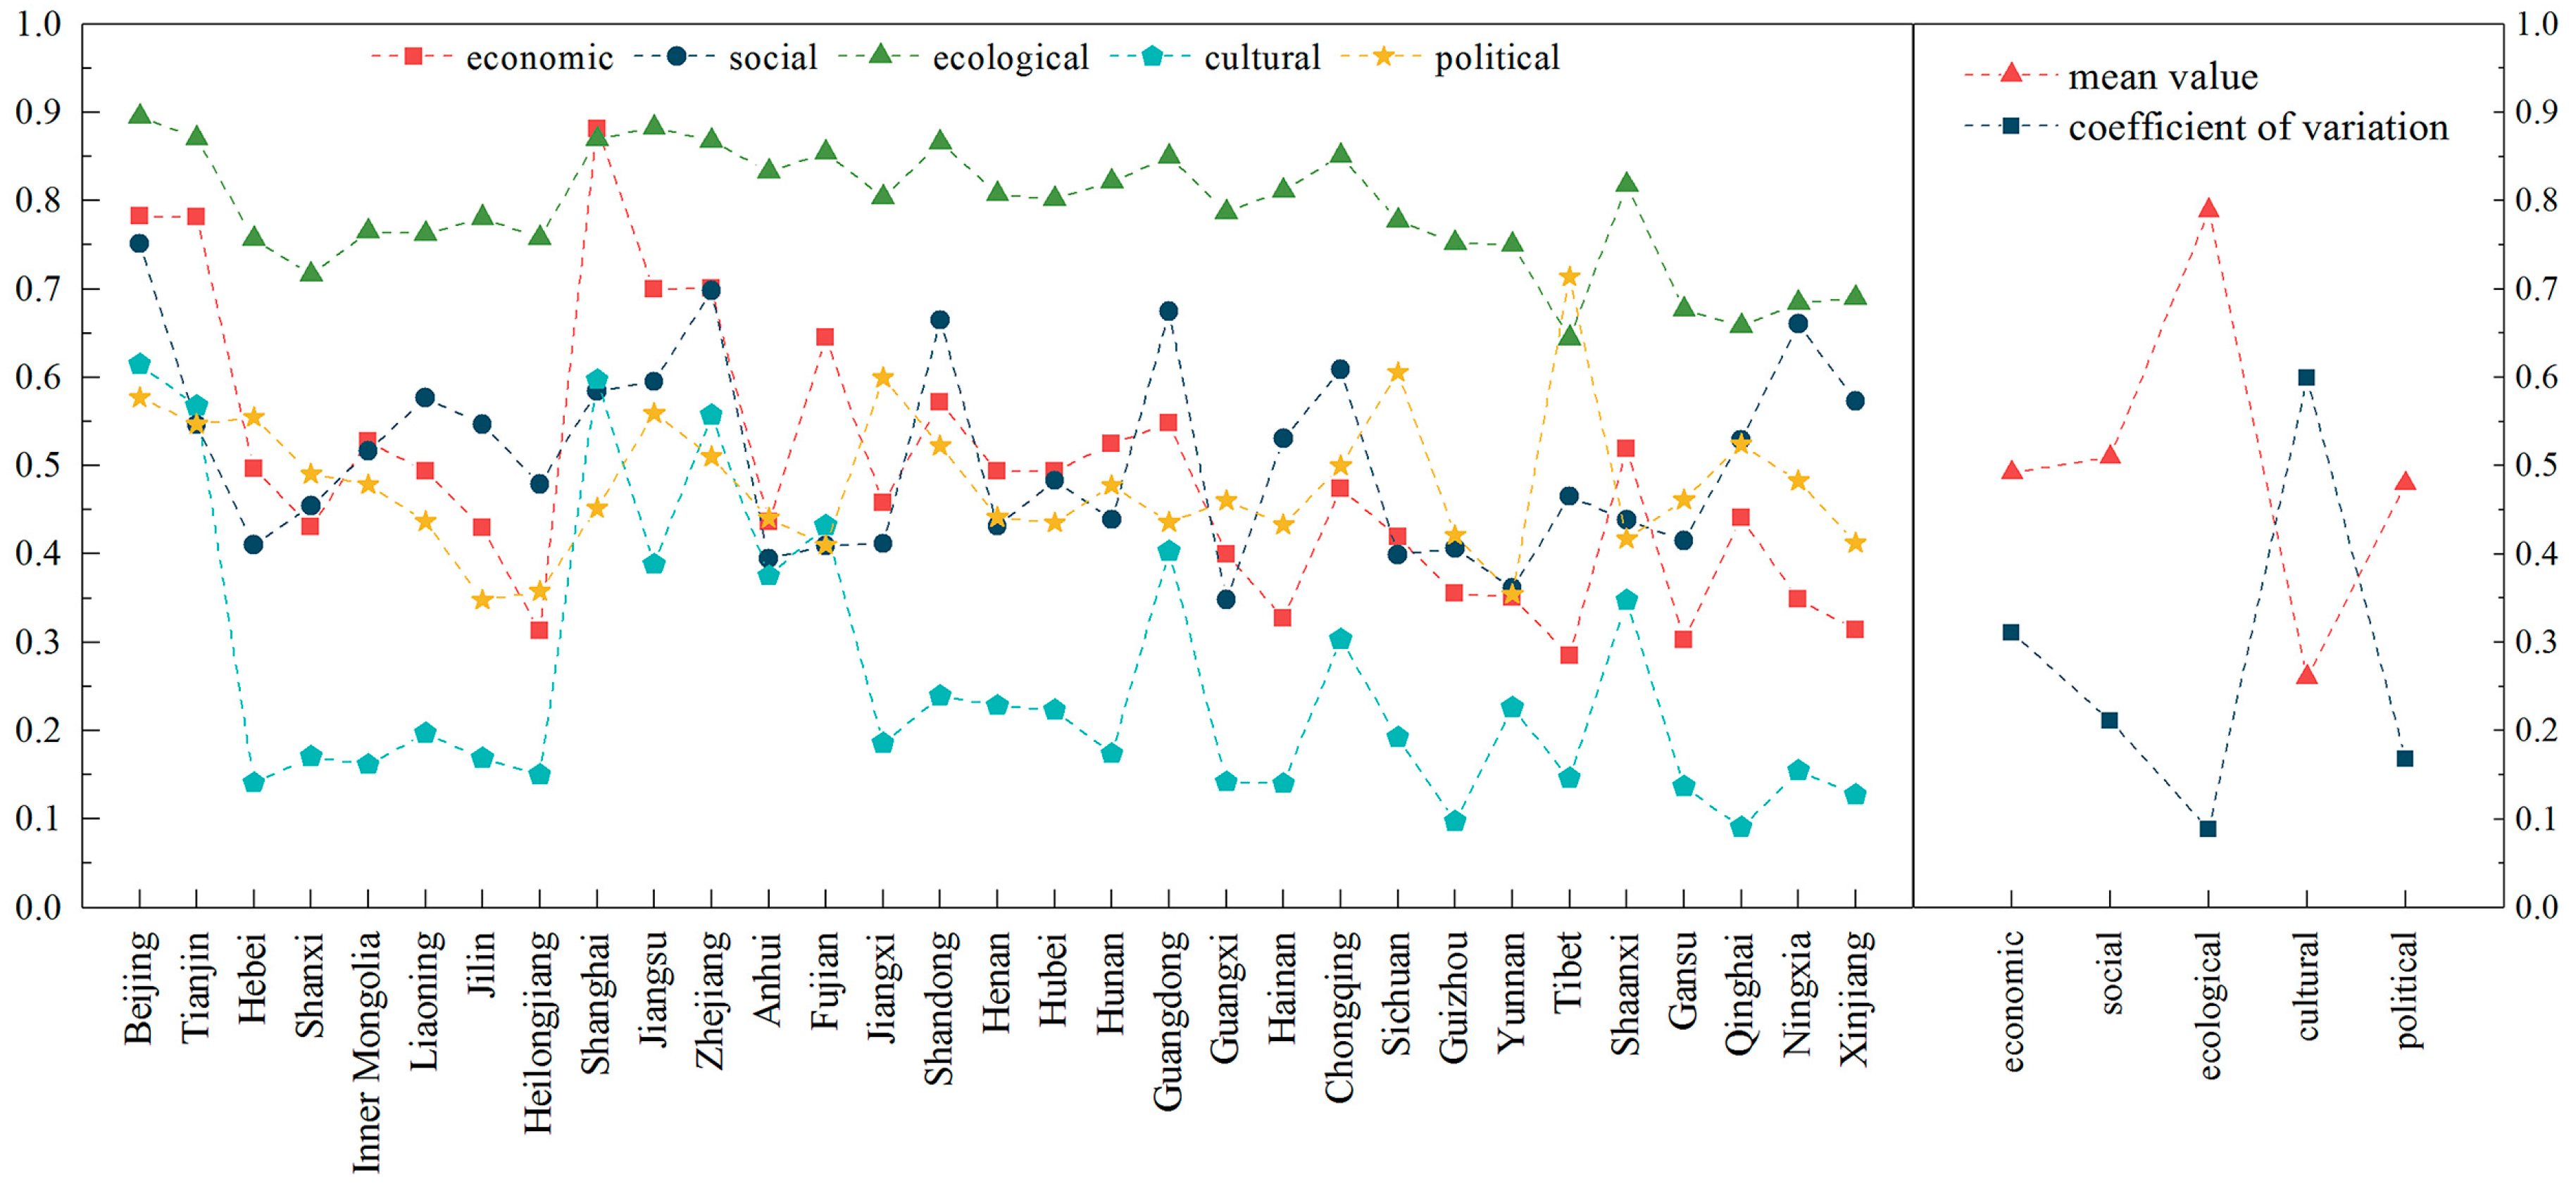
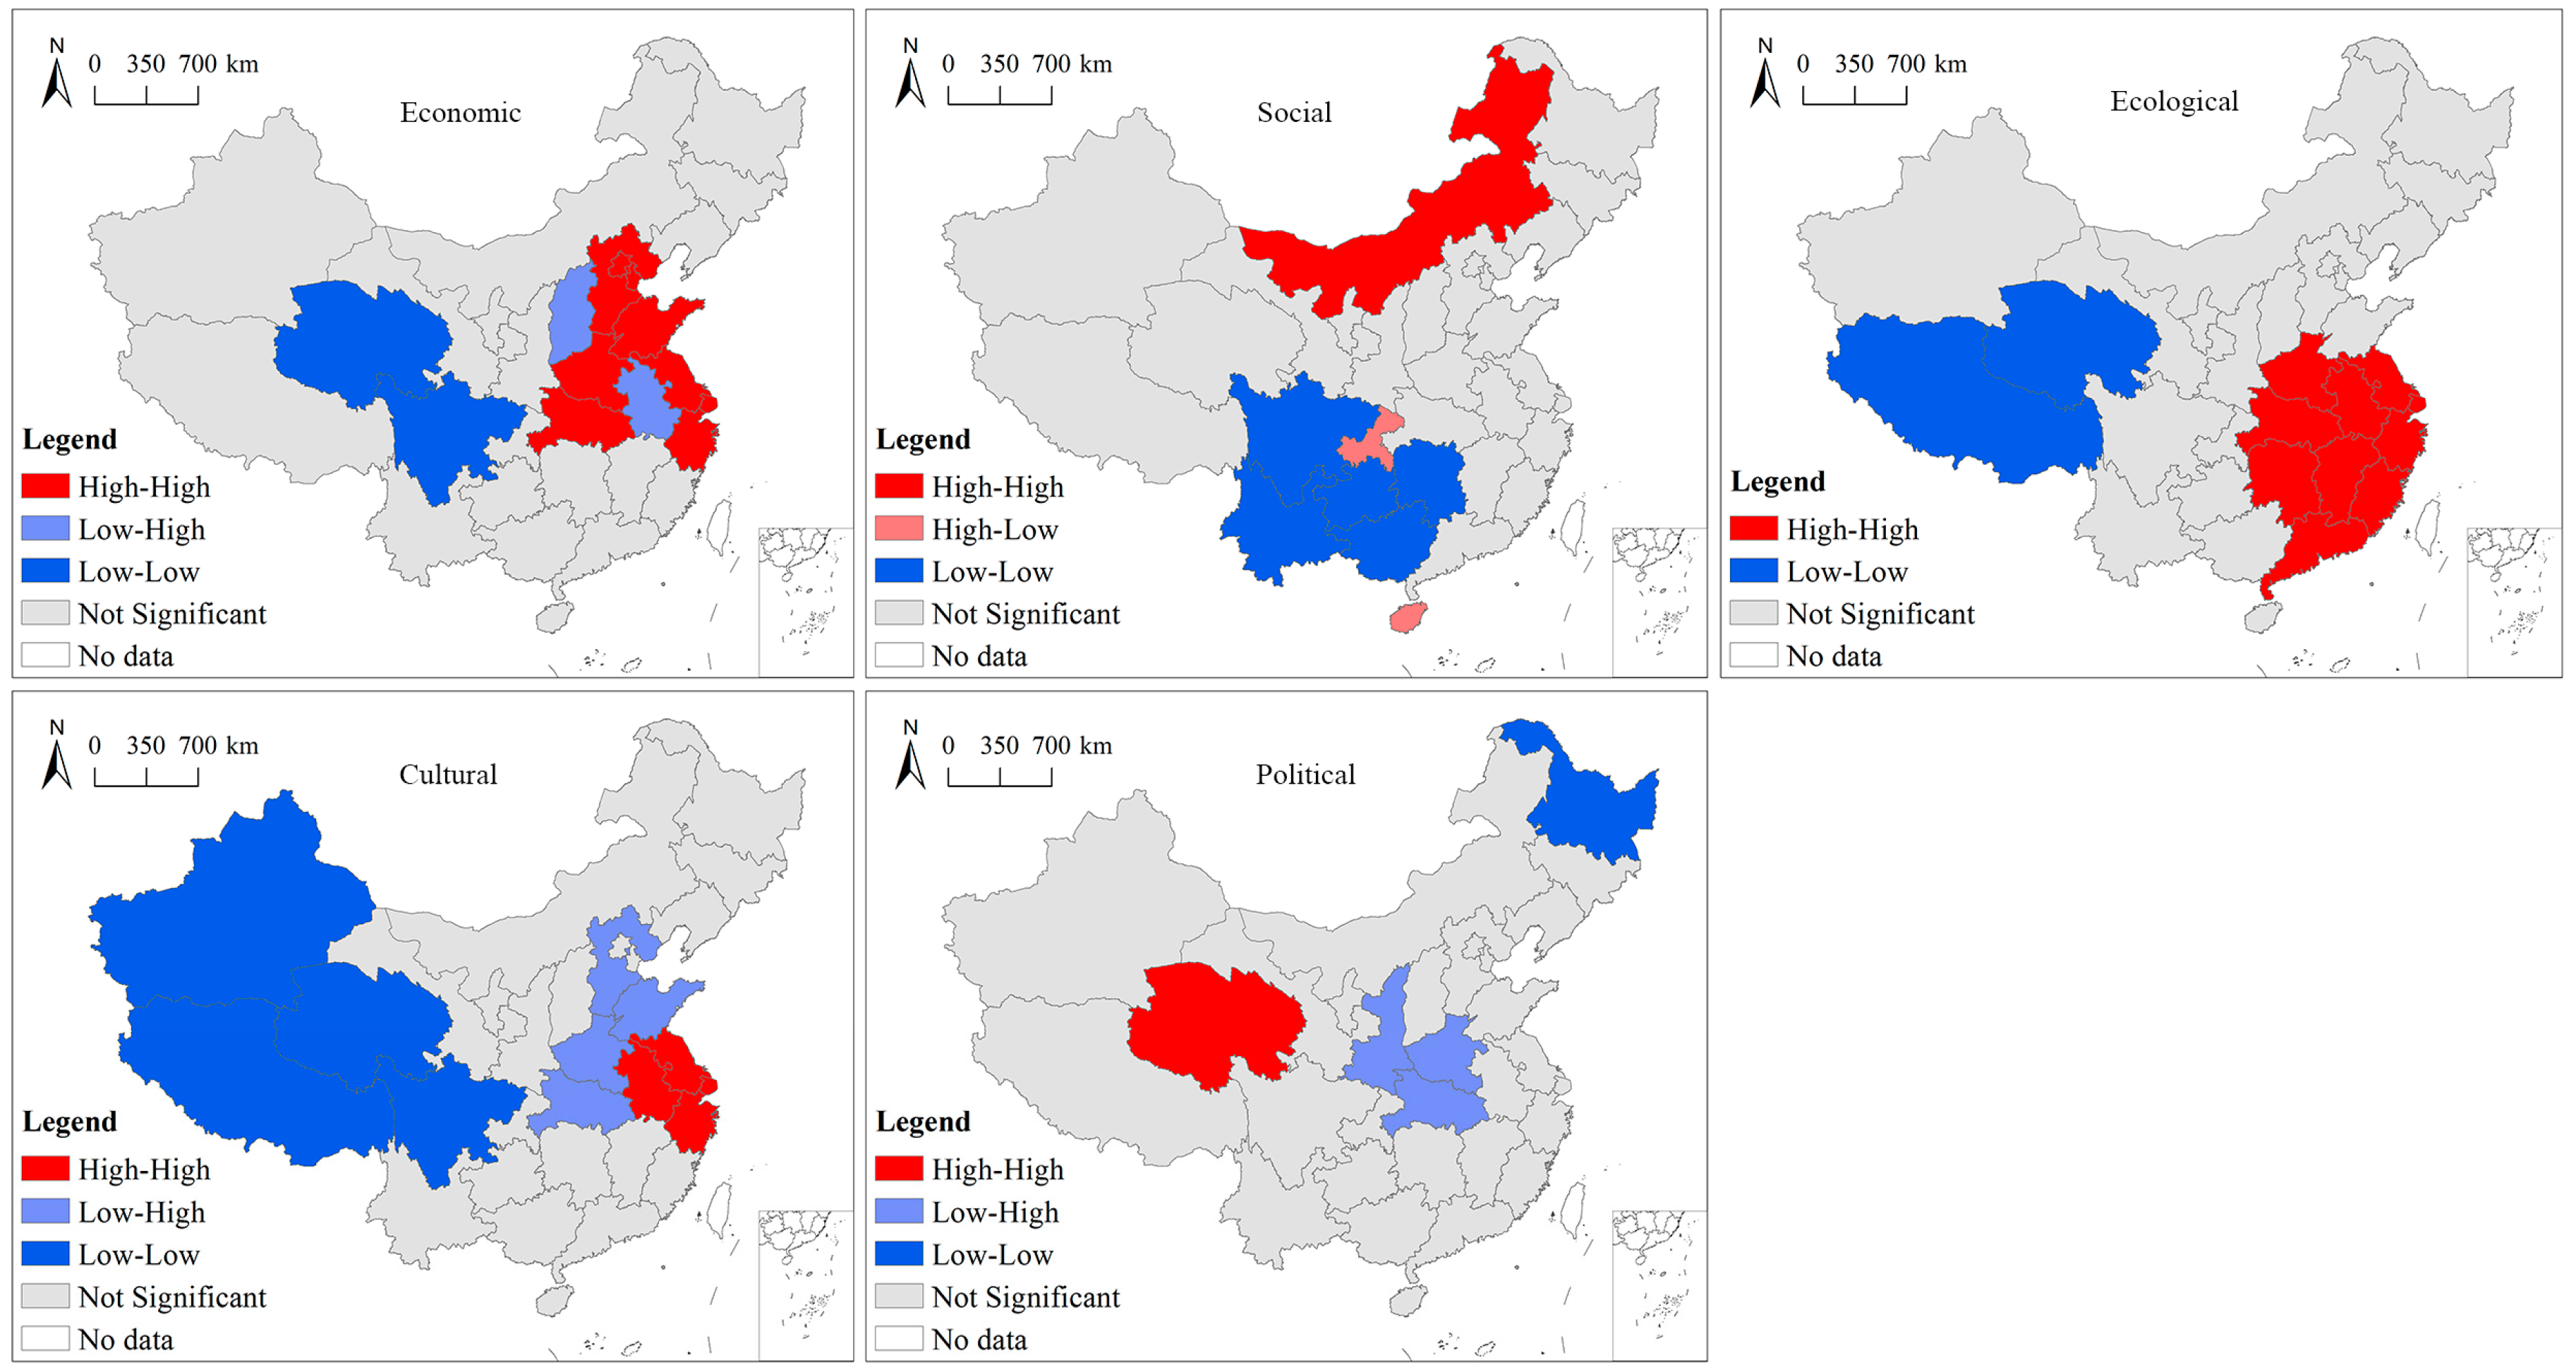
5.1. The Spatial Disparity of Five-Dimensional Urbanization in 2015

It can be observed from Figure 5 that the ecological urbanization had the highest mean value with the minimum coefficient of variation, which means that China has experienced a high-quality and balanced ecological urbanization. In recent years, China has been aware of the necessity and importance of ecological civilization construction, and put it in a prominent position, which led ecological urbanization to a higher level and accelerated the overall development. On the contrary, cultural urbanization had the lowest mean value with the maximum coefficient of variation, indicating that the development of cultural urbanization was inadequate and regionally unbalanced. As everyone knows, China is the global leader of the manufacturing industry, but it still has a long way to go from “made in China” to “created in China” due to the limitations regarding core technology and low capability for independent innovation. The mean value of economic, social, and political urbanization didn’t have much difference, with a value of around 0.5.
We can infer from Table 3 that the social and political dimensions failed the test of significance, which means that the spatial distribution of social and political dimensions was random. The spatial distribution of economic and ecological dimensions was significant in the level of 0.01, while the cultural dimension was significant in the level of 0.05. Ecological dimension had a Global Moran’s I index of 0.4714, indicating a clearly positive autocorrelation. There was also a tendency for spatial grouping for economic and cultural dimension; although the index was weaker than that of ecological dimension, it was still significant.
The Jenks function in ArcGIS 10.2 were used to divided the 31 regions into five levels, which were low, relatively low, medium, relatively high, and high (Figure 6). In order to measure the spatial disparity more visually, LISA cluster maps were made (Figure 7).
The distribution of economic urbanization was high in the east and low in the west, showing an obvious spatial agglomeration. The High-High types were mainly distributed in eastern and central China, while the Low-Low types were in the west. Shanxi and Anhui were the Low-High type. The spatial distribution was due to China’s long-standing economic pattern.
For social urbanization, high-value regions were scattered in the eastern coastal and northwest areas, while the low-value regions were distributed mainly in the central and southwest areas. The eastern coastal regions, which developed first from the period of the reform and opening-up, experienced a high level of social and economic development. Besides, China implemented the strategy of developing its underdeveloped western provinces in 2000, and showed a relatively high level of social urbanization in 2015. Despite the failure in global spatial autocorrelation, social urbanization still has a local spatial autocorrelation. The Low-Low type was mainly distributed in the southwest of China, while Chongqing and Hainan were of the High-Low type. Only Inner Mongolia was of the High-High type.
For ecological urbanization, the high-value regions were mainly distributed in eastern coastal areas, while the low-value regions were centralized in northwest areas and Shanxi. The exceptionally large amount of coal mining and usage in Shanxi led to the low level of ecological urbanization. The obsolete industrial equipment, polluting enterprises, and weak environmental consciousness in northwest areas led to centralized low-value areas. Ecological urbanization has a clearly positive autocorrelation. The High-High type showed a concentrated distribution in central and east China, while the Low-Low type gathered in the northwest areas.
For cultural urbanization, Beijing, Tianjin, Shanghai, and Zhejiang were on the high level, while Qinghai and Guizhou were on the low level. High-value regions were mainly distributed in eastern and central China. Cultural urbanization also had a tendency to spatial grouping. The High–High type was concentrated in the Yangtze River Delta, while the Low-Low type gathered in the west of China. Henan, Hebei, Shandong, and Hubei were of the Low-High type.
For political urbanization, Tibet was on the high level, while Yunnan, Heilongjiang, and Jilin experienced a low level. The spatial distribution of political urbanization was random globally, but a local spatial autocorrelation was observed. Qinghai was of the High-High type, while Heilongjiang was of the Low-Low type. The Low-High type was centralized in Henan, Hubei, and Shaanxi.

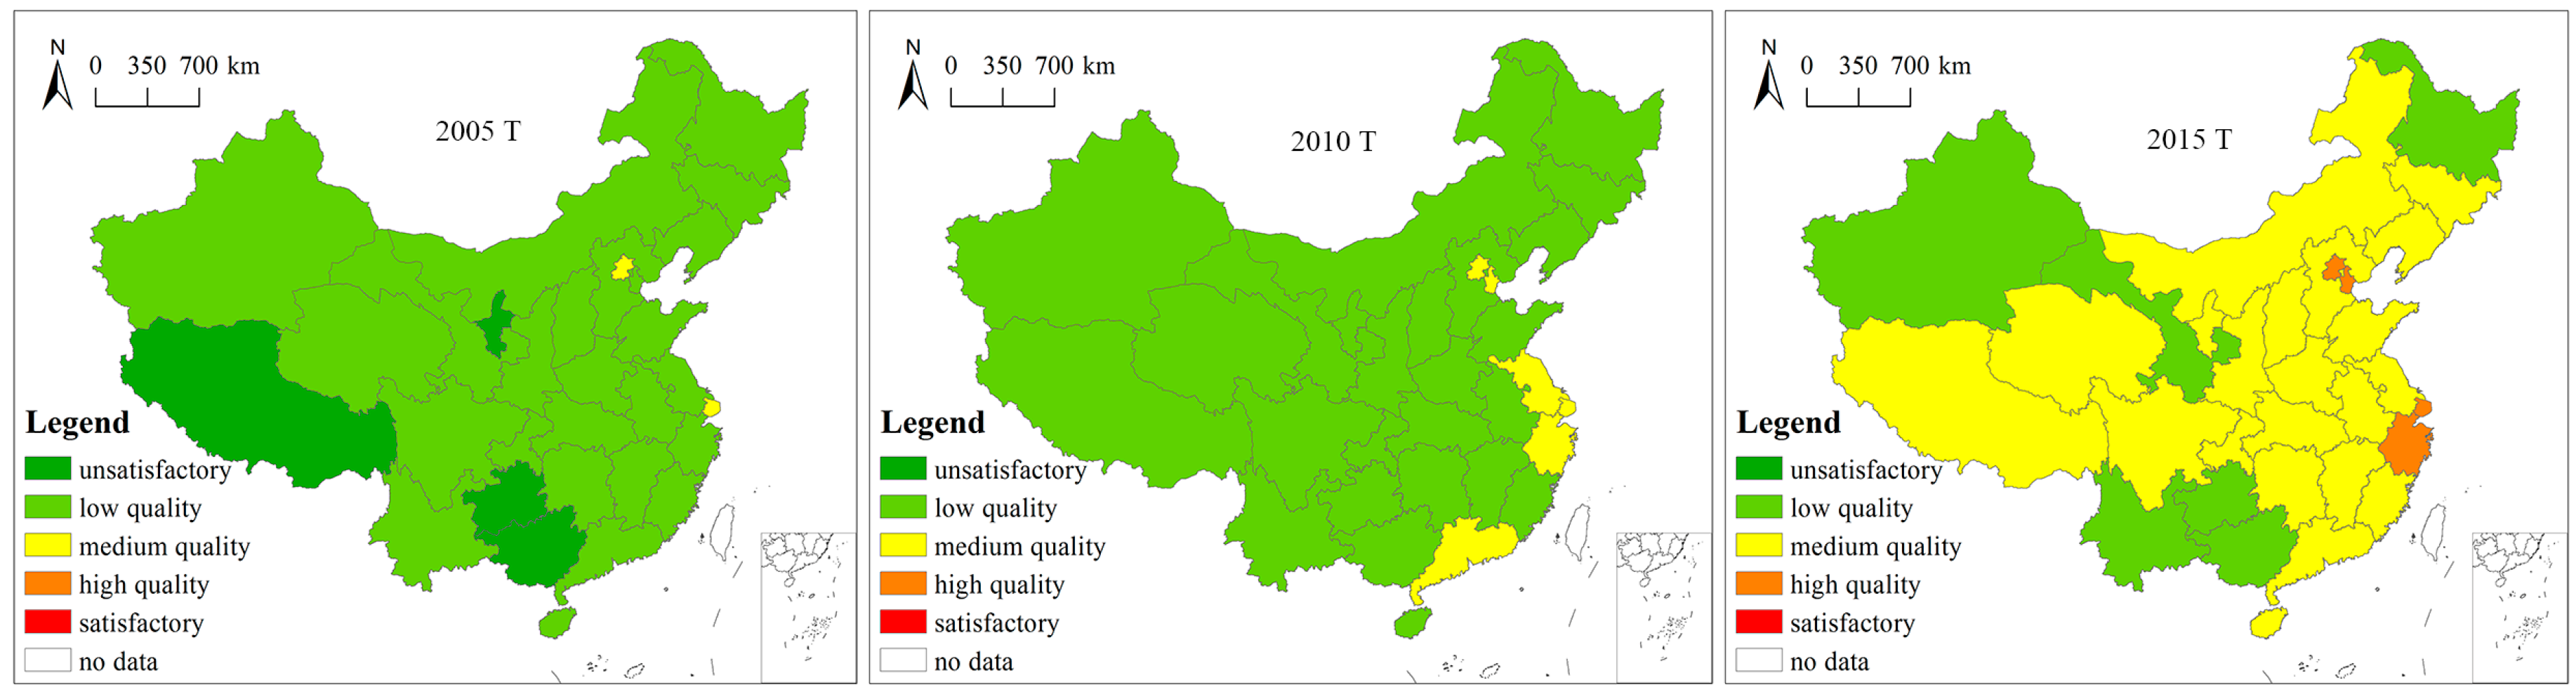
5.2. The Temporal and Spatial Disparity of Comprehensive Urbanization Quality

From Figure 8, it can be observed that the comprehensive urbanization quality of all of the regions increased over time. The mean value increased over time, while the coefficient of variation decreased, which indicated that both comprehensive urbanization quality and the balance of regional development were getting better and better. This study classified the quality of comprehensive urbanization into five grades (Figure 9), which were satisfactory quality (0.8–1.0), high quality (0.6–0.8), medium quality (0.4–0.6), low quality (0.2–0.4), and unsatisfactory (0–0.2).
(1) In 2005, the mean value of comprehensive urbanization was just 0.2577, which means that the overall quality of comprehensive urbanization was very low. No region was in the high-quality grade or satisfactory grade. Only Beijing and Shanghai were in the medium-quality grade. Most of the regions were in the low-quality grade. Tibet, Ningxia, Guizhou, and Yunnan experienced the worst grade. In a word, the development of comprehensive quality was quite unsatisfactory. Besides, the coefficient of variation of 0.2695 indicated the unbalanced development of comprehensive urbanization in China.
(2) Compared with 2005, the overall level of comprehensive urbanization increased in 2010. Although no region’s value was in the high-quality grade or satisfactory grade, which was the same as 2005, eight regions upgraded, and no region was in the unsatisfactory grade. Besides, the coefficient of variation decreased compared with 2005, which means the situation of regional balanced development improved. However, the mean value was just 0.3617 in 2010, indicating that the overall level was still far from ideal.
(3) In 2015, the overall level of comprehensive urbanization had improved significantly. Twenty-three out of the 31 regions upgraded a level compared with 2010, showing apparent growth. Beijing, Tianjin, Shanghai, and Zhejiang were of the high-quality grade. No region was in the satisfactory grade or unsatisfactory grade, while most of the regions were in the medium-quality grade. The coefficient of variation fell to 0.2041, which means that the regional development became more balanced. It is noteworthy that even though the quality increased over time, the mean value in 2015 was just 0.4702, which means that the average level of China was medium-level. That was to say, despite the continuous improvement, there was still a long way to go to realize the comprehensive improvement of urbanization in China.
From Table 4, we can infer that the spatial distribution of comprehensive urbanization in 2005, 2010, and 2015 were all significant at the level of 0.05, and the spatial distribution in 2010 was significant at the level of 0.01, which indicates a positive autocorrelation in the spatial distribution of comprehensive urbanization.
It can be observed from Figure 10 that the High-High type was mainly distributed in eastern China. The High-High type became more centralized during 2005–2010, while it experienced a shrink during 2010–2015. Benefiting from the advantages for terrain, transportation, labor force, and preferential policies, the urbanization quality in eastern areas was significantly higher than that of the central and western regions.
The Low-Low type was mainly distributed in the western China. The Low-Low type did not change during 2005–2010, but it experienced a reduction in 2015. The shrink of the Low-Low type indicated an improvement of urbanization quality in west areas, which benefited from the dividends of policies for western development. It was worth noting that Chongqing and Yunnan escaped the Low-Low type in 2015. As the only municipality in west China, Chongqing experienced a significant improvement in the past 10 years, and transcended the surrounding areas, fitting into the High-Low type in 2015. Yunnan strived to develop cultural tourism to promote the urbanization, due to the advantages of its natural resources.
The distribution of the Low-High type experienced a gather in central areas during 2005–2010, and did not change during 2010–2015. Anhui was of the Low-High type in 2005, and became typical of the High-High type in 2010 and 2015, indicating an obvious improvement. With more emphasis on the central region strategy in 2004, Anhui seized the opportunity and achieved rapid development. Meanwhile, Hubei, which was adjacent to Anhui, was of the High-High type in 2005, but fit into the Low-High type in 2010 and 2015. Urbanization in central areas was faced with opportunities as well as challenges simultaneously.

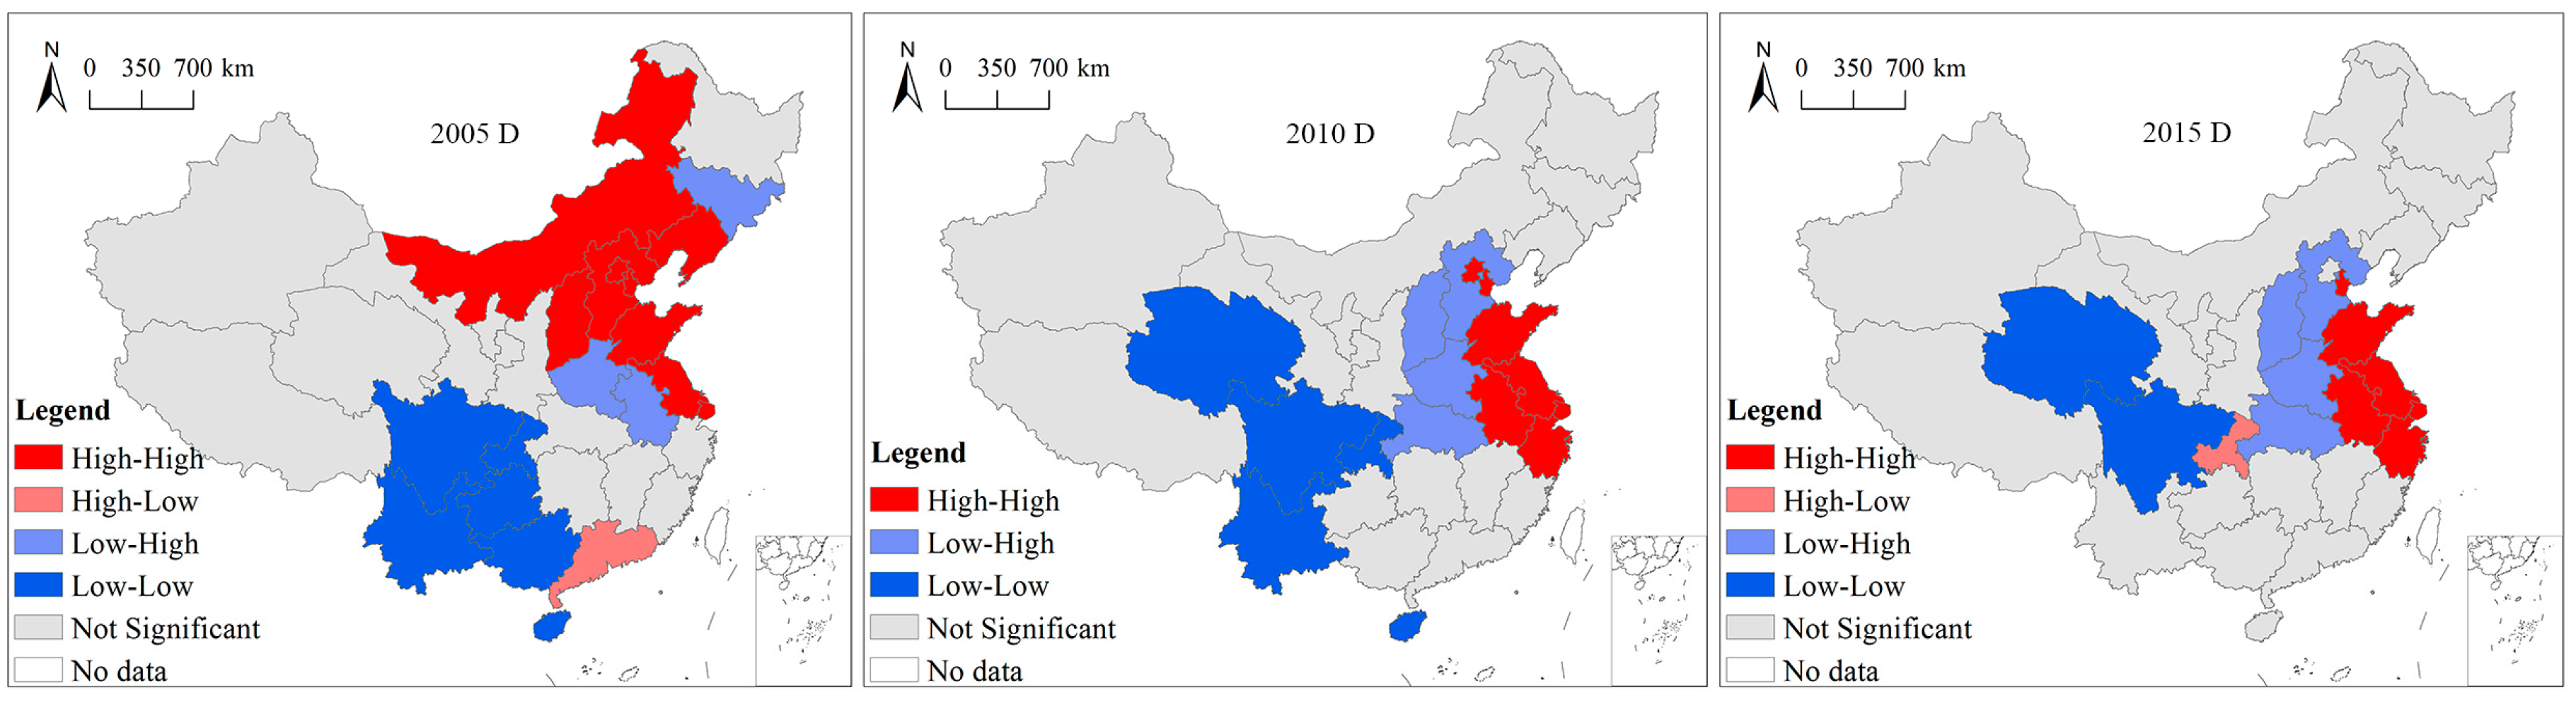
5.3. The Temporal and Spatial Disparity of Coupling Coordination Degree

To some extent, the coupling coordination degree is determined by comprehensive urbanization quality, according to Equation (11). Therefore, Figure 11 has exhibited the same development tendency as Figure 8. All of the regions’ coupling coordination degree increased over time. The mean value of the coupling coordination degree showed a sustainable growth, while the coefficient of variation steadily decreased. The increase of the coupling coordination degree and the decrease of coefficient of variation indicated a favorable situation. In general, the sustainability of urbanization in China was getting better and better. This study classified the coupling coordination degree into five grades (Figure 12), which were satisfactory coordination (0.8–1.0), high-level coordination (0.6–0.8), medium-level coordination (0.4–0.6), low-level coordination (0.2–0.4), and unsatisfactory coordination (0–0.2).
In 2005, the mean value of the coupling coordination degree was just 0.4186; the overall level was unsatisfactory (Figure 13). Although no region was in an unsustainable coordination grade, no region was in a sustainable coordination grade, either. Only Beijing and Shanghai were in the high-level coordination grade, while most of the regions were in the medium-level coordination grade. Thirteen out of the 31 regions were in the low-level coordination grade, and most of them were located in central and western China. From the perspective of space, the coupling coordination degree in the east and north area was higher than the west and south areas. An obvious spatial difference was observed; the regional balanced development can be enhanced.
In 2010, the overall level of the coupling coordination degree upgraded significantly, and 17 regions got a promotion. There were six regions in the high-level coordination grade, while the remaining 25 regions were all in the medium-level coordination grade. The distribution of the coupling coordination degree was strongly linked to the comprehensive urbanization quality in 2010. High-value areas were distributed in the southeastern coastal areas and the Beijing-Tianjin region. The spatial difference in 2010 was significantly reduced compared with 2005.
In 2015, the situation of the coupling coordination degree kept getting better. A significant improvement could be observed; 19 regions experienced a level upgrade. Beijing and Shanghai were in the sustainable coordination grade, while 21 regions were in the high-level coordination grade. The coupling coordination degree was high in the east and low in the west. The coefficient of variation decreased approximately 50% compared with 2005. China had made great progress in the process of national urbanization, and the sustainability of urbanization in China experienced an overall improvement.
As seen from Table 5, the spatial distribution of the coupling coordination degree in 2005, 2010, and 2015 were all significant at the level of 0.01, which indicated a positive autocorrelation in the spatial distribution.
The High-High type experienced an obvious shrink and displacement during 2005–2010, and a little shrink during 2010–2015. The High-High type mainly gathered in the Beijing-Tianjin region and Yangtze River Delta, which was similar to comprehensive urbanization quality.
The Low-Low type experienced a displacement from southwest to northwest during 2005–2010, and a shrink during 2010–2015. The reduction of the Low-Low type indicated an obvious overall development. Qinghai became the Low-Low type, having a relatively backward development, due to the geographical disadvantages and failure to fully utilize regional resources. Besides, Chongqing, Yunnan, Guangxi, Guizhou, and Hainan successfully escaped the Low-Low type in 2015.
The Low-High type expanded and became more centralized in central China during 2005–2010, and stabilized during 2010–2015. The Low-High type has a “siphon effect” in regional development. Sometimes, eastern coastal areas become growth poles and stimulate the progress of urbanization in the surrounding areas. However, sometimes, the eastern coastal areas failed to promote urbanization in their neighboring inland provinces, and even squeezed their development opportunities to some extent. As we mentioned before, central China was faced with both opportunities and challenges.
The spatial variation of the coupling coordination degree was similar to that of comprehensive urbanization. Disparity between the east and the west remains a major issue for China to address. In China, what we now face is the contradiction between unbalanced and inadequate development and the people’s ever-growing needs for a better life. Although the overall sustainability of urbanization was getting better during 2005–2015, it was worth noting that only Beijing and Shanghai had sustainable coordination in 2015. Therefore, it is crucial to figure out what limited the sustainability of the other regions. It has been mentioned that the coupling coordination degree was determined by the quality of five-dimensional urbanization. So, with the help of obstacle factors, the reasons were dissected.

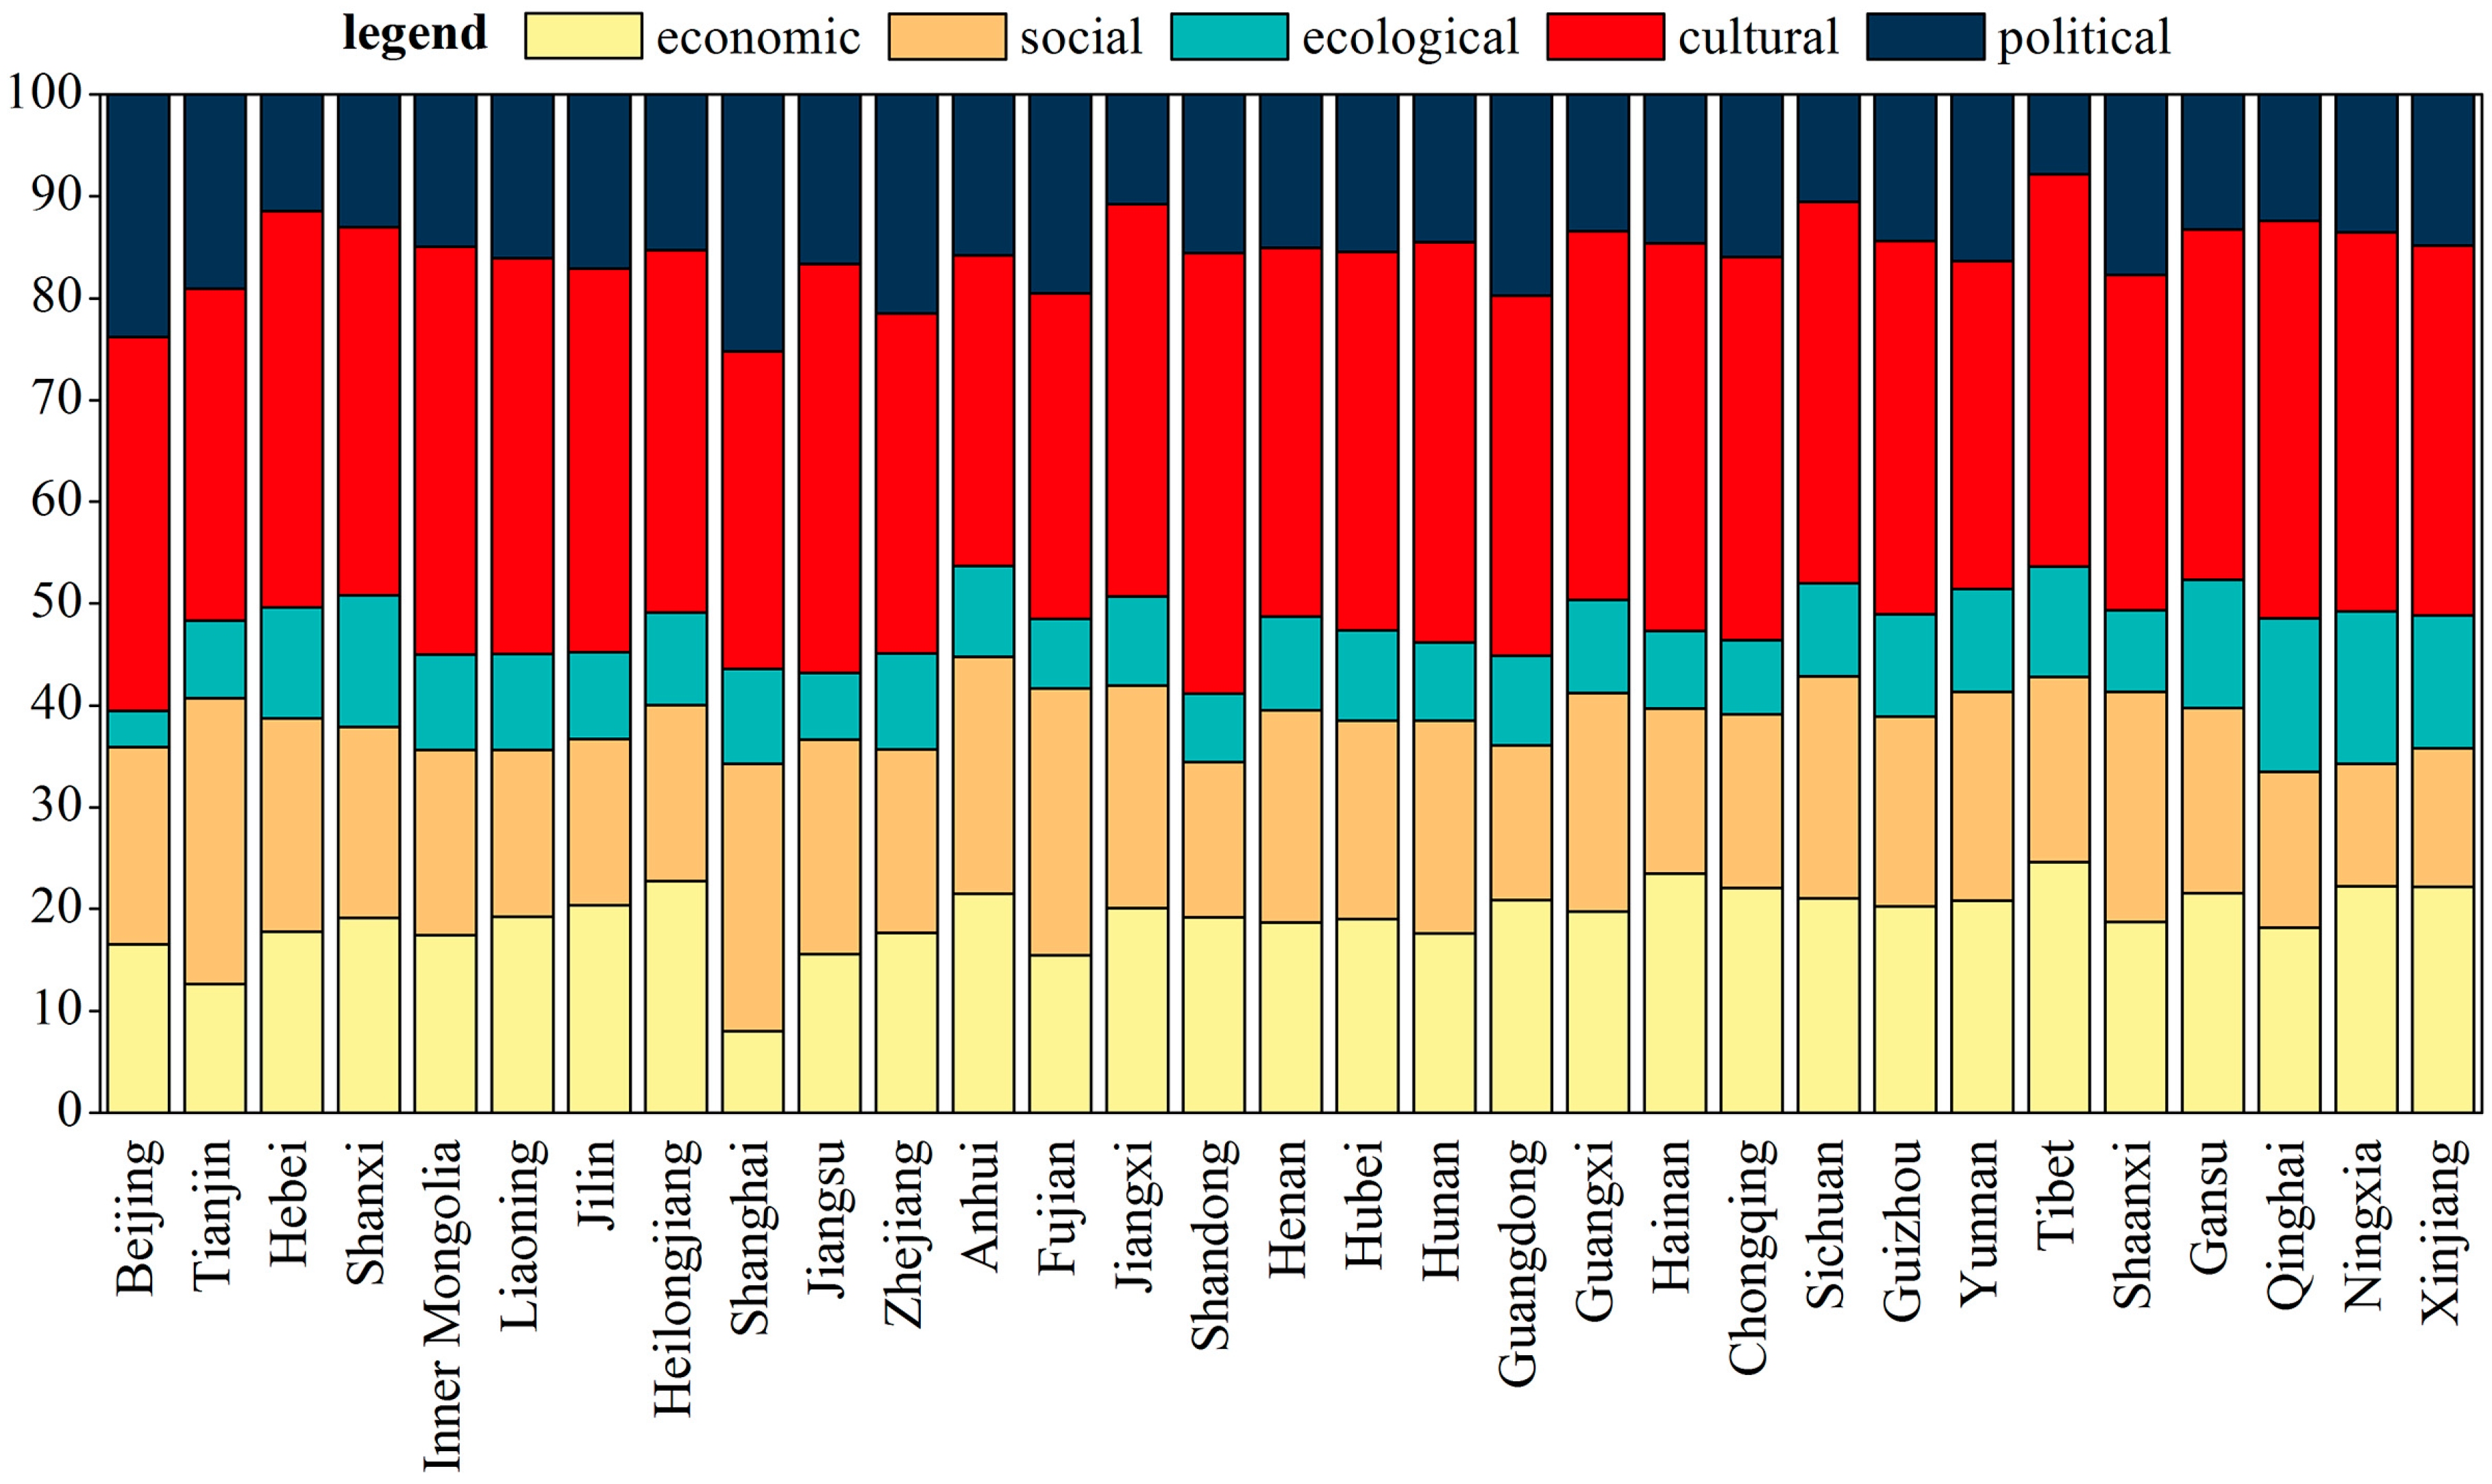
5.4. Identification of Obstacle Factors in 2015

According to Equations (14)–(17), the obstacle degree of each criterion and indicator were calculated. As seen from Figure 14, each dimension had different obstacle degree, and the average degrees from high to low were cultural, economic, social, political, and ecological urbanization, with the values of 40.42%, 18.40%, 17.67%, 17.64%, and 5.87% respectively. Besides, the highest obstacle degrees of each region were all of the cultural dimension, which means that the cultural dimension was the primary obstacle to sustainable urbanization. The economic, social, and political dimension had almost the same shares of obstacle degree. Ecological dimension caused the least resistance.
The factors with the top eight obstacle degrees were shown in Table 6. It is apparent that the cultural dimension accounted for a majority of indicators: about 57.7%. The economic dimension accounted for 16.9%, the political dimension accounted for 14.1%, and the social dimension accounted for 11.3%, while the ecological dimension didn’t appear in the ranking list. Among the ranking list, D1 and D4 both accounted for 12.1%, A3 and D6 both accounted for 11.7%, D2 and E3 both accounted for 11.3%, D5 accounted for 10.1%, B2 accounted for 8.5%, and A1 accounted for 4%, which confirmed the backward urbanization of culture and scientific technology more specifically. The cumulative percentage of the above nine factors reached 92.7%.
Different regions had differing biggest obstacles. Twenty-four out of the 31 regions’ biggest obstacle was D2, which means that the lack of innovation has become the biggest barrier of high-quality urbanization. Four regions’ biggest obstacle was D6, which indicated that cultural and artistic activities ought to be reinforced in these regions. Jiangsu’s biggest obstacle factor was D5, indicating that the inheritance level of natural scenery and cultural relics is yet to be improved. The biggest obstacle of Fujian was D1, which shows that the input intensity of research and development expenditure needs to be improved. Zhejiang’s biggest obstacle factor was E3, indicating that the legal assistance needs further development.
After the identification of these obstacles, each region must recognize their individual limitations and take corresponding measures. The relevant departments and experts ought to respond to the existing problems and give valuable suggestions regarding urbanization planning and strategy. The reports of the 19th National Congress of the CPC in 2017 put innovation at the top of the five development concepts (innovative, coordinated, green, open, and shared), emphasizing innovation as the primary engine of development. China could seize the opportunity of technology innovation to catch up with and surpass competitors. Only in this way can the sustainability of urbanization in China improve.

6. Discussion

Urbanization is an inevitable trend of social development, especially in developing countries [88]. A number of studies have been carried out with a diverse range of work that refers to urban sustainability in China. Provinces and cities such as Beijing [89], Shanghai [65,77], Guangxi [37] and urban agglomerations [39] were taken as research areas to analyze urban sustainability issues. It can be seen that different indicators systems were developed for different regions. Therefore, the results cannot be compared, and may be inconsistent by using different indicator systems [18]. Nowadays, China is in an important transitional period from traditional urbanization processes to new-type urbanization processes. China’s new-type urbanization is supposed to embody the essence of the five-in-one overall layout, and promote balanced economic, political, cultural, social, and ecological urbanization. Therefore, this study established an evaluation framework including the five aspects for provincial evaluation, which can bring some meaningful effects to urbanization research in China. As for the city level, appropriate adjustments can be made to make the indicators more specific, with the framework of the five aspects remaining the same. For example, water quality, air quality, and biodiversity can be included in ecological indicators when making the city level evaluation. Besides, soft indicators such as governance and corruption were seldom used for urbanization evaluation in existing research, for the reason that relevant data was difficult to acquire. Therefore, this study chose “abuse-of-power criminals per 10,000 civil servants” to assess the corruption situation during rapid urbanization. Besides, the “coordination degree of urban and rural income” and “coordination degree of urban population and built-up area” were chosen to assess the governmental administrative capability.
In recent years, China had made great progress in the process of national urbanization, and the sustainability of urbanization in China experienced an overall improvement. The results of analysis in this study pointed to the conclusion that urbanization quality, as well as the coupling coordination degree of five dimensions, was getting better and better during 2005–2015. However, despite the continuous improvement of urbanization quality in China [90], China’s urbanization is still in a relatively low level of sustainability [91]. In 2015, only Beijing, Tianjin, Shanghai, and Zhejiang were in the high-quality grade of comprehensive urbanization, while no region was in the satisfactory grade, and most regions were in the medium-quality grade. As for the coupling coordination degree, only Beijing and Shanghai were in the sustainable coordination grade. Besides, urbanization quality varied with dimension. Due to national attention and citizens’ awareness of environmental protection, China has experienced a high-quality and balanced ecological urbanization in 2015. Meanwhile, the development of cultural urbanization was inadequate and regionally unbalanced. The results of the identification of obstacle factors confirmed the backward urbanization of culture and scientific technology more specifically. As the global leader of the manufacturing industry, China still has a long way to go from “made in China” to “created in China”. Besides, there have been significant differences between regions. What we now face in China is the contradiction between unbalanced and inadequate development and the people’s ever-growing needs for a better life. Disparity between the east and the west remains a major issue for China to address [90]. In brief, there was still a long way to go to realize the comprehensive improvement of urbanization in China.
Therefore, China should rethink the present situation of China and its countermeasures in its development strategy. Mingxing Chen stated that at present, the core of China’s urbanization is to improve the quality of urbanization, rather than urbanization quantity or speed [16], and he also analyzed the evolution and challenge for land-centered urbanization, and the way forward for people-oriented urbanization in China [19]. Xin-hai Lu proposed that a sustainable urban land-use policy had a significant positive effect on China’s sustainable urbanization [92]. Therefore, based on the results and analysis, recommendations were proposed for policy makers to advance sustainable urbanization in China at the end of this paper.

7. Conclusions

This study first proposed the perspective to evaluate the sustainability of urbanization from five dimensions of urbanization: economic, political, cultural, social, and ecological. Based on the AHP method and entropy method, a five-dimensional indicator system was established to evaluate the urbanization quality of 31 provincial regions in China during 2005–2015. Then, the coupling coordination degree model was used to calculate the coupling coordination degree of the five aspects. Furthermore, Moran’s I index and a LISA cluster map were used to measure and describe the spatial disparity. Finally, a factor identification model was used to recognize the weaknesses of each region. This study can help provide a more detailed understanding of sustainable urbanization in China. Without doubt, China’s example could have lessons for the rest of the developing countries, although the economic, social, environmental, cultural, and political contexts may be different. The main conclusions can be drawn as follows:
(1) In 2015, only ecological urbanization had a high-quality and balanced development, while the development of cultural urbanization was inadequate and regionally unbalanced. The quality of economic, social, and political urbanization was moderate. The quality of economic, ecological, and cultural urbanization had a significantly positive global spatial autocorrelation, while the spatial distribution of social and political urbanization was random. The local spatial autocorrelation varies with dimensions.
(2) The quality of comprehensive urbanization increased during 2005–2015, while the regional disparity experienced a reduction. However, the mean value of comprehensive quality in 2015 was just 0.4702, while only four regions were in the high-quality grade, and no region was in the satisfactory grade. That is to say, urbanization in China was going in a good direction, but there is still a long way to go to realize the comprehensive improvement of urbanization. The quality of comprehensive urbanization had a significantly positive global spatial autocorrelation during 2005–2015. The High-High type in the eastern coastal areas centralized over time, while the Low-Low type in the western areas experienced decline; meanwhile, the Low-High type was stabilized in the central areas during 2005–2015. Only Chongqing was in the High-Low type in 2015.
(3) The coupling coordination degree had the same development tendency as comprehensive urbanization. The increase of mean value and decrease of coefficient of variation indicated a favorable situation. However, it was worth noting that only Beijing and Shanghai had sustainable coordination in 2015, so there is still much room for most regions to advance. Similarly, the coupling coordination degree also had a significant positive global spatial autocorrelation during 2005–2015. The High-High type in the eastern coastal areas experienced an obvious shrink and displacement during 2005–2015, while the Low-Low type in western areas also experienced a displacement and shrink; the Low-High type expanded and became more centralized in central areas over time, while the High-Low type included Guangdong in 2005, and Chongqing in 2015.
(4) The obstacle degree of each criterion and indicator was calculated in 2015. At the criterion level, the highest obstacle degrees of each region were all within the cultural dimension, while the ecological dimension caused the least resistance. That is to say, the cultural dimension was the primary obstacle to sustainable urbanization in China at present. The average degrees of cultural, economic, social, political, and ecological urbanization were 40.42%, 18.40%, 17.67%, 17.64%, and 5.87%, respectively. From an indicator level, among the ranking list of factors with the top eight obstacle degrees, D1 and D4 both accounted for 12.1%, A3 and D6 both accounted for 11.7%, D2 and E3 both accounted for 11.3%, D5 accounted for 10.1%, B2 accounted for 8.5%, and A1 accounted for 4%. The main obstacle factor varied with region, and the lack of innovation was the biggest barrier in most regions, which confirmed the backward urbanization of culture and scientific technology more specifically.
Based on the above conclusions, this paper concludes with recommendations for policy makers to advance sustainable urbanization in China. Sustainable urbanization is a complex process involving economics, social issues, the environment, culture, and scientific technology, as well as governance. Therefore, when improving the urbanization quality, all of these aspects must be taken into consideration. If urbanization focuses on just one aspect or sacrifices one aspect for another, the ignored aspects will inevitably drag down the overall level of urbanization quality.
Each region ought to adjust measures to local conditions for the obvious regional disparity of urbanization quality. (1) For the eastern area, due to the virtue of their geographical location, it has taken maximum benefit from China’s reform and opening-up policies. Plenty of rural surplus labor force was absorbed by labor-intensive enterprises in eastern areas, which made a large contribution to the high-quality urbanization. Urbanization in the eastern areas ought to focus on the social insurance and employment opportunities for rural migrant workers in cities and gradually diminish the considerable disparity between the urban and rural areas. Furthermore, urbanization in the eastern areas was supposed to strengthen the supply-side structural reform and upgrade the industrial system. (2) For central areas, transportation is the biggest advantage, as it provides the junction between east and west, as well as north and south. Besides, abundant mineral resources and grain output have also laid a good foundation for urbanization. Urbanization in central areas could use the successful experiences of eastern areas and strive to build green cities or smart cities. Moreover, urbanization ought to increase the radiation effect of the capital city, and highlight the agglomeration effect. (3) For western areas, the foundation of urbanization is weak, but the central government formed many preferential policies. Urbanization in western areas is supposed to be fully aware of their advantages and limitations in order to seize the opportunities. Therefore, western regions could energetically develop characteristic tourism, ecological agriculture, and light industry, which were compatible with the local resources and environment. Besides, funds and technology can be introduced from eastern and central areas to achieve high-quality development in western areas.
This study also shows that urbanization in China has an evident spatial autocorrelation, so regional synergy cannot be neglected. Currently, China has nine state-level urban agglomerations, and is committed to construct an urban spatial structure with complementary functions and regional linkage. Besides, China is implementing three national strategies, which are the Belt and Road, Beijing-Tianjin-Hebei integration, and the Yangtze Economic Belt. These strategies have offered a favorable platform for synergetic development. If the local government seizes these opportunities, the quality and sustainability of urbanization will definitely experience a significant improvement.

Author Contributions

Conceptualization, C.W., Z.W. and X.L.; Data Curation, M.F.; Formal Analysis, C.W.; Funding Acquisition, Z.W.; Software, C.W., X.L. and H.Z.; Writing-Original Draft, C.W.; Writing-Review & Editing, C.W. All authors read and approved the final manuscript.

Funding

This work was supported by the National Natural Science Foundation of China (Grant No. 71673258).

Acknowledgments

We would like to express our great gratitude to editor (Mr. Hank Liu) and reviewers for their dedicated work. We also want to thank Qiaowen Lin and Kai Sheng for their help in English refinement.

Conflicts of Interest

The authors declare no conflict of interest.

References

  1. Bertinelli, L.; Strobl, E. Urbanisation, Urban Concentration and Economic Development. Urban Stud. 2014, 44, 2499–2510. [Google Scholar] [CrossRef]
  2. Jianming, C. Dynamics of Chinese Urbanization Progress and its Future Developmental Strategies. Prog. Geogr. 1997, 16, 11–16. [Google Scholar] [CrossRef]
  3. Zhao, X.; Zhang, L. Urban Performance and the Control of Urban Size in China. Urban Stud. 1995, 32, 813–845. [Google Scholar] [CrossRef]
  4. Kipnis, B.A. The Impact of Factory Size on Urban Growth and Development. Econ. Geogr. 1977, 53, 295–302. [Google Scholar] [CrossRef]
  5. Northam, R.M. Urban Geography; John Wiley & Sons: Hoboken, NJ, USA, 1979. [Google Scholar]
  6. Friedmann, J. Four Theses in the Study of China’s Urbanization. Int. J. Urban Reg. Res. 2008, 30, 440–451. [Google Scholar] [CrossRef]
  7. Kojima, R. Urbanization in China. Dev. Econ. 1995, 33, 151–154. [Google Scholar] [CrossRef]
  8. Young, D.; Deng, H. Urbanisation, agriculture and industrialisation in China, 1952-91. Urban Stud. 1998, 35, 1439–1455. [Google Scholar] [CrossRef]
  9. Lambin, E.F.; Meyfroidt, P. Global land use change, economic globalization, and the looming land scarcity. Proc. Natl. Acad. Sci. USA 2011, 108, 3465–3472. [Google Scholar] [CrossRef] [Green Version]
  10. Deng, X.; Huang, J.; Rozelle, S.; Zhang, J.; Li, Z. Impact of urbanization on cultivated land changes in China. Land Use Policy 2015, 45, 1–7. [Google Scholar] [CrossRef] [Green Version]
  11. Wang, Y.P.; Wang, Y.; Jiansheng, W.U. Urbanization and Informal Development in China: Urban Villages in Shenzhen. Int. J. Urban Reg. Res. 2009, 33, 957–973. [Google Scholar] [CrossRef]
  12. Wu, F. The global and local dimensions of place-making: Remaking Shanghai as a world city. Urban Stud. 2000, 37, 1359–1377. [Google Scholar] [CrossRef]
  13. Wang, S.; Li, G.; Fang, C. Urbanization, economic growth, energy consumption, and CO2 emissions: Empirical evidence from countries with different income levels. Renew. Sust. Energ. Rev. 2018, 81, 2144–2159. [Google Scholar] [CrossRef]
  14. Cao, S.; Lv, Y.; Zheng, H.; Wang, X. Challenges facing China’s unbalanced urbanization strategy. Land Use Policy 2014, 39, 412–415. [Google Scholar] [CrossRef]
  15. Anderson, W.P.; Kanaroglou, P.S.; Miller, E.J. Urban form, energy and the environment: A review of issues, evidence and policy. Urban Stud. 1996, 33, 7–35. [Google Scholar] [CrossRef]
  16. Chen, M.; Liu, W.; Tao, X. Evolution and assessment on China’s urbanization 1960–2010: Under-urbanization or over-urbanization? Habitat Int. 2013, 38, 25–33. [Google Scholar] [CrossRef]
  17. Saaty, T.L. Decision making—The Analytic hierarchy and network processes (AHP/ANP). J Syst. Sci. Syst. Eng. 2004, 13, 1–35. [Google Scholar] [CrossRef]
  18. Tan, Y.; Xu, H.; Zhang, X. Sustainable urbanization in China: A comprehensive literature review. Cities 2016, 55, 82–93. [Google Scholar] [CrossRef]
  19. Chen, M.; Liu, W.; Lu, D. Challenges and the way forward in China’s new-type urbanization. Land Use Policy 2016, 55, 334–339. [Google Scholar] [CrossRef] [Green Version]
  20. Li, F.; Liu, X.; Hu, D.; Wang, R.; Yang, W.; Li, D.; Zhao, D. Measurement indicators and an evaluation approach for assessing urban sustainable development: A case study for China’s Jining City. Landsc. Urban Plann. 2009, 90, 134–142. [Google Scholar] [CrossRef]
  21. Enserink, B.; Koppenjan, J. Public participation in China: Sustainable urbanization and governance. Manag. Environ. Qual. Int. J. 2007, 18, 459–474. [Google Scholar] [CrossRef]
  22. Roy, M. Planning for sustainable urbanisation in fast growing cities: Mitigation and adaptation issues addressed in Dhaka, Bangladesh. Habitat Int. 2009, 33, 276–286. [Google Scholar] [CrossRef]
  23. Ochoa, J.J.; Tan, Y.; Qian, Q.K.; Shen, L.; Moreno, E.L. Learning from best practices in sustainable urbanization. Habitat Int. 2018, 78, 83–95. [Google Scholar] [CrossRef]
  24. Shen, L.; Peng, Y.; Zhang, X.; Wu, Y. An alternative model for evaluating sustainable urbanization. Cities 2012, 29, 32–39. [Google Scholar] [CrossRef]
  25. Ng, M.K. Sustainable urban development Issues in Chinese transitional cities: Hong Kong and Shenzhen. Int. Plann. Stud. 2002, 7, 7–36. [Google Scholar] [CrossRef]
  26. Pincetl, S. Nature, urban development and sustainability—What new elements are needed for a more comprehensive understanding? Cities 2012, 29, S32–S37. [Google Scholar] [CrossRef]
  27. Pan, H. Urban Spatial Structure towards Low Carbon:New Urban Transport and Land Use Model. Urban Stud. 2010, 1, 40–45. [Google Scholar]
  28. Satterthwaite, D. Sustainable cities or cities that contribute to sustainable development? Urban Stud. 1997, 34, 1667–1691. [Google Scholar] [CrossRef]
  29. Cash, D.W.; Clark, W.C.; Alcock, F.; Dickson, N.M.; Eckley, N.; Guston, D.H. Knowledge systems for sustainable development. Proc. Natl. Acad. Sci. USA 2003, 100, 8086–8091. [Google Scholar] [CrossRef] [PubMed] [Green Version]
  30. Hardoy, J.E.; Mitlin, D.; Satterthwaite, D. Environmental Problems in Third World Cities; Earthscan Publications Ltd.: London, UK, 1992; p. 244. [Google Scholar]
  31. Choguill, C.L. Toward sustainability of human settlements. Habitat Int. 1996, 20, v–viii. [Google Scholar] [CrossRef]
  32. Kuik, O.J.; Verbruggen, H. Search of Indicators of Sustainable Development; Springer Publishing: New York, NY, USA, 1991; p. 1. [Google Scholar]
  33. Harris, N. Wastes, the environment and the international economy. Cities 1992, 9, 177–185. [Google Scholar] [CrossRef]
  34. Burgess, R.; Carmona, M.; Kolstee, T. The Challenge of Sustainable Cities; Zed Books: London, UK, 1997. [Google Scholar]
  35. Marcotullio, P.J. Asian urban sustainability in the era of globalization. Habitat Int. 2001, 25, 577–598. [Google Scholar] [CrossRef]
  36. Giddings, B.; Hopwood, B.; O’Brien, G. Environment, economy and society: fitting them together into sustainable development. Sustain. Dev. 2002, 10, 187–196. [Google Scholar] [CrossRef]
  37. Zhang, Y.; Su, Z.; Li, G.; Zhuo, Y.; Xu, Z. Spatial-temporal evolution of sustainable urbanization development: A perspective of the coupling coordination development based on population, industry, and built-up land spatial agglomeration. Sustainability 2018, 10, 1766. [Google Scholar] [CrossRef]
  38. Chen, M.; Lu, D.; Zha, L. The comprehensive evaluation of China’s urbanization and effects on resources and environment. J. Geogr. Sci. 2010, 20, 17–30. [Google Scholar] [CrossRef]
  39. Xu, C.; Wang, S.; Zhou, Y.; Wang, L.; Liu, W. A comprehensive quantitative evaluation of new sustainable urbanization level in 20 Chinese urban agglomerations. Sustainability 2016, 8, 91. [Google Scholar] [CrossRef]
  40. Shen, L.Y.; Ochoa, J.J.; Shah, M.N.; Zhang, X. The application of urban sustainability indicators—A comparison between various practices. Habitat Int. 2011, 35, 17–29. [Google Scholar] [CrossRef]
  41. Shen, L.; Zhou, J. Examining the effectiveness of indicators for guiding sustainable urbanization in China. Habitat Int. 2014, 44, 111–120. [Google Scholar] [CrossRef]
  42. Swyngedouw, E. Governance innovation and the citizen: The janus face of governance-beyond-the-state. Urban Stud. 2016, 42, 1991–2006. [Google Scholar] [CrossRef]
  43. Cornelissen, A.M.G.; Berg, J.V.D.; Koops, W.J.; Grossman, M.; Udo, H.M.J. Assessment of the contribution of sustainability indicators to sustainable development: a novel approach using fuzzy set theory. Agric. Ecosyst. Environ. 2001, 86, 173–185. [Google Scholar] [CrossRef]
  44. Turner, M.A. A simple theory of smart growth and sprawl. J. Urban Econ. 2007, 61, 21–44. [Google Scholar] [CrossRef] [Green Version]
  45. Wang, A.M.; Liu, J.L.; Miao, L.L. Prospect of man-earth relationship in land-use. Areal Res. Dev. 2002, 21, 9–12. [Google Scholar]
  46. Liu, G.L.; Gu, C.L. The application of the ecological system theory and method on the urban land evaluation. Urban Plan. Rev. 2000, 4, 11–16. [Google Scholar] [CrossRef]
  47. Pengfei, F.; Liutao, L.; Yanpu, L. Evaluation of coordinated development of urbanization from the perspective of system coupling in the Beijing-Tianjin-Hebei. Resour. Sci. 2016, 38, 2361–2374. [Google Scholar] [CrossRef]
  48. Yang, Z.; Du, Z.H. Urbanization and evolution of economic structure. J. Renmin Univ. China 2000, 14, 82–88. [Google Scholar]
  49. Huang, H.; Bai, J. Change Analysis of Coupling Coordination Degree between Urbanization and Non-agriculture Industry in Central Plains Economic Zone. Mod. Urban Res. 2016, 7, 98–102. [Google Scholar]
  50. Liu, S.; Lo, K. Measuring sustainable urbanization in China: A case study of the coastal Liaoning area. Sustain. Sci. 2013, 8, 585–594. [Google Scholar] [CrossRef]
  51. Tao, R.; Xu, Z.G. Urbanization, rural land system and migrant’s social security. Econ. Res. J. 2005, 12, 45–56. [Google Scholar]
  52. Wang, C.G. The urbanization and social structure change in China. J. China Agr. Univ. 2008, 25, 55–67. [Google Scholar] [CrossRef]
  53. Sato, Y.; Zenou, Y. How urbanization affect employment and social interactions. Eur. Econ. Rev. 2015, 75, 131–155. [Google Scholar] [CrossRef] [Green Version]
  54. Shen, Q.J. Study on new urbanization based on ecological civilization. Urban Plan. Forum 2013, 31, 29–36. [Google Scholar]
  55. Wang, Z.; He, H.; Fan, M. The ecological civilization debate in China: The role of ecological marxism and constructive postmodernism-beyond the predicament of legislation. Mon. Rev. 2014, 66, 37. [Google Scholar] [CrossRef]
  56. Du, X.; Huang, Z. Ecological and environmental effects of land use change in rapid urbanization: The case of hangzhou, China. Ecol. Indic. 2017, 81, 243–251. [Google Scholar] [CrossRef]
  57. Wang, X.; Li, F. The cultural heritage protection in the process of urbanization. Appl. Mech. Mater. 2013, 357–360, 1975–1978. [Google Scholar] [CrossRef]
  58. Skrede, J. What may culture contribute to urban sustainability? Critical reflections on the uses of culture in urban development in Oslo and beyond. J. Urbanism Int. Res. Placemaking Urban Sustain. 2015, 7, 1–18. [Google Scholar] [CrossRef]
  59. Zhang, Y.H.; Zhou, J.Y.; Liu, S.L. Cultural urbanization: new model of resource-based city’s transformation and development. China Ancient City 2015, 8, 78–83. [Google Scholar]
  60. Zhao, J.X. The cultural inheritance in China’s urbanization. J. Shandong Univ. 2014, 4, 34–43. [Google Scholar]
  61. Harding, A.; Wilks-Heeg, S.; Hutchins, M. Business, Government and the Business of Urban Governance. Urban Stud. 2000, 37, 975–994. [Google Scholar] [CrossRef]
  62. Cheng, J.; Turkstra, J.; Peng, M.; Du, N.; Ho, P. Urban land administration and planning in China: Opportunities and constraints of spatial data models. Land Use Policy 2006, 23, 604–616. [Google Scholar] [CrossRef]
  63. Repetti, A.; Desthieux, G. A relational indicatorset model for urban land-use planning and management: Methodological approach and application in two case studies. Landsc. Urban Plan. 2006, 77, 196–215. [Google Scholar] [CrossRef]
  64. Henderson, J.V.; Quigley, J.; Lim, E. Urbanization in China: Policy Issues and Options. Available online: https://www.nathanschiff.com/webdocs/grad_urban/Henderson_Urbanization_China_Policy_2009.pdf (accessed on 10 December 2018).
  65. Myers, J.H.; Alpert, M.I. Determinant buying attitudes: Meaning and measurement. J. Market. 1968, 32, 13–20. [Google Scholar] [CrossRef]
  66. Saaty, T.L. A scaling method for priorities in hierarchical structures. J. Math. Psychol. 1977, 15, 234–281. [Google Scholar] [CrossRef]
  67. Zhao, H.; Yao, L.; Mei, G.; Liu, T.; Ning, Y. A fuzzy comprehensive evaluation method based on AHP and entropy for a landslide susceptibility map. Entropy 2017, 19, 8. [Google Scholar] [CrossRef]
  68. Bai, L.; Wang, H.; Huang, N.; Du, Q.; Huang, Y. An environmental management maturity model of construction programs using the AHP-entropy approach. Int. J. Environ. Res. Public Health 2018, 15, 1317. [Google Scholar] [CrossRef] [PubMed]
  69. Ananda, J.; Herath, G. The use of Analytic Hierarchy Process to incorporate stakeholder preferences into regional forest planning. Forest Policy Econ. 2003, 5, 13–26. [Google Scholar] [CrossRef]
  70. Shannon, C.E. A mathematical theory of communication. Bell Syst. Tech. J. 1948, 27, 379–423. [Google Scholar] [CrossRef]
  71. Liu, D.; Li, L. Application study of comprehensive forecasting model based on entropy weighting method on trend of PM2.5 concentration in Guangzhou, China. Int. J. Environ. Res. Public Health 2015, 12, 7085–7099. [Google Scholar] [CrossRef] [PubMed]
  72. Fang, F.; Qiao, L.L.; Ni, B.J.; Cao, J.S.; Yu, H.Q. Quantitative evaluation on the characteristics of activated sludge granules and flocs using a fuzzy entropy-based approach. Sci. Rep. 2017, 7, 42910. [Google Scholar] [CrossRef] [PubMed] [Green Version]
  73. Kai, Y.; Shuran, L.; Jiancun, G.; Lei, P. Research on the coupling degree measurement model of urban gas pipeline leakage disaster system. Int. J. Disast. Risk Re. 2017, 22, 238–245. [Google Scholar] [CrossRef]
  74. Li, Y.; Li, Y.; Zhou, Y.; Shi, Y.; Zhu, X. Investigation of a coupling model of coordination between urbanization and the environment. J. Environ. Manag. 2012, 98, 127–133. [Google Scholar] [CrossRef] [PubMed]
  75. Shaojian, W.; Chuanglin, F.; Yang, W. Quantitative investigation of the interactive coupling relationship between urbanization and eco-environment. Acta Ecologica Sinica 2015, 35, 2244–2254. [Google Scholar]
  76. He, J.; Wang, S.; Liu, Y.; Ma, H.; Liu, Q. Examining the relationship between urbanization and the eco-environment using a coupling analysis: Case study of Shanghai, China. Ecol. Indic. 2017, 77, 185–193. [Google Scholar] [CrossRef]
  77. Li, J.; Fang, H.; Fang, S.; Siddika, S. Investigation of the relationship among university-research institute-industry innovations using a coupling coordination degree model. Sustainability 2018, 10, 1954. [Google Scholar] [CrossRef]
  78. Li, Y.R.; Wang, J.; Liu, Y.S.; Long, H.L. Spatial pattern and influencing factors of the coordination development of industrialization, informatization, urbanization and agricultural modernization in China: A prefecture level exploratory spatial data analysis. Acta Geogr. Sin. 2014, 69, 199–212. [Google Scholar]
  79. Wang, R.; Cheng, J.; Zhu, Y.; Lu, P. Evaluation on the coupling coordination of resources and environment carrying capacity in Chinese mining economic zones. Resour. Policy 2017, 53, 20–25. [Google Scholar] [CrossRef]
  80. Tobler, W.R. A computer movie simulating urban growth in the detroit region. Econ. Geogr. 1970, 46, 234–240. [Google Scholar] [CrossRef]
  81. Schabenberger, O.; Gotway, C.A. Statistical Methods for Spatial Data Analysis; Chapman & Hall/CRC: Thame, UK, 2004; pp. 340–389. [Google Scholar]
  82. Eagle, N.; Pentland, A.; Lazer, D. Mobile Phone Data for Inferring Social Network Structure; Springer Publishing: New York, NY, USA, 2008; pp. 79–88. [Google Scholar]
  83. Moran, P.A.P. The Interpretation of Statistical Maps. J. Roy. Stat. Soc. 1948, 10, 243–251. [Google Scholar] [CrossRef]
  84. Anselin, L. Local indicator of spatial association-LISA. Geogr. Anal. 1995, 27, 91–115. [Google Scholar] [CrossRef]
  85. Aaron Gutiérrez, X.D. The uneven distribution of evictions as new evidence of urban inequality: A spatial analysis approach in two Catalan cities. Cities 2016, 56, 101–108. [Google Scholar] [CrossRef]
  86. Anselin, L.; Syabri, I.; Kho, Y. GeoDa: An introduction to spatial data analysis. Geogr. Anal. 2005, 38, 5–22. [Google Scholar] [CrossRef]
  87. Mallupattu, P.K.; Reddy, S.; Reddy, J. Analysis of land use/land cover changes using remote sensing data and GIS at an urban area, Tirupati, India. Sci. World J. 2013, 2013, 268623. [Google Scholar] [CrossRef]
  88. Zhao, J.; Chai, L. A novel approach for urbanization level evaluation based on information entropy principle: A case of Beijing. Phys. A Stat. Mech. Appl. 2015, 430, 114–125. [Google Scholar] [CrossRef]
  89. He, C.; Han, Q.; de Vries, B.; Wang, X.; Guochao, Z. Evaluation of sustainable land management in urban area: A case study of Shanghai, China. Ecol. Indic. 2017, 80, 106–113. [Google Scholar] [CrossRef]
  90. Xiao, Y.; Song, Y.; Wu, X. How far has China’s urbanization gone? Sustainability 2018, 10, 2953. [Google Scholar] [CrossRef]
  91. Ren, Y.; Li, H.; Shen, L.; Zhang, Y.; Chen, Y.; Wang, J. What is the efficiency of fast urbanization? A China study. Sustainability 2018, 10, 3180. [Google Scholar] [CrossRef]
  92. Lu, X.; Ke, S. Evaluating the effectiveness of sustainable urban land use in China from the perspective of sustainable urbanization. Habitat Int. 2018, 77, 90–98. [Google Scholar] [CrossRef]
Figure 1. Urbanization rate in China. Data resource: China State Council.
Sustainability 10 04733 g001
Figure 2. The five-in-one model. Source: own elaboration.
Sustainability 10 04733 g002
Figure 3. Present land-use map of China in 2015. Data source: Resource and Environment Data Cloud Platform.
Sustainability 10 04733 g003
Figure 4. Steps of the AHP method. Source: own elaboration.
Sustainability 10 04733 g004
Figure 5. The quality of five-dimensional urbanization of China in 2015. Source: own elaboration.
Sustainability 10 04733 g005
Figure 6. The spatial distribution of five-dimensional urbanization of China in 2015. Source: own elaboration.
Sustainability 10 04733 g006
Figure 7. Local indicators of spatial association (LISA) cluster maps for five-dimensional urbanization (Mental Carlo 999 Random Permutations, significance of 0.05). Source: own elaboration.
Sustainability 10 04733 g007
Figure 8. The comprehensive urbanization quality of China in 2005, 2010, and 2015. Source: own elaboration.
Sustainability 10 04733 g008
Figure 9. The spatial distribution of comprehensive urbanization quality of China in 2005, 2010, and 2015. Source: own elaboration.
Sustainability 10 04733 g009
Figure 10. LISA cluster maps for comprehensive urbanization in 2005, 2010, and 2015 (Monte Carlo 999 Random Permutations, significance of 0.05). Source: own elaboration.
Sustainability 10 04733 g010
Figure 11. The coupling coordination degree of China in 2005, 2010, and 2015. Source: own elaboration.
Sustainability 10 04733 g011
Figure 12. The spatial distribution of coupling coordination degree of China in 2005, 2010, and 2015. Source: own elaboration.
Sustainability 10 04733 g012
Figure 13. LISA cluster maps for coupling coordination degree in 2005, 2010 and 2015 (Mental Carlo 999 Random Permutations, significance of 0.05). Source: own elaboration.
Sustainability 10 04733 g013
Figure 14. The obstacle degree of five-dimensional urbanization in 2015. Source: own elaboration.
Sustainability 10 04733 g014
Table 1. Data sources of this study.
YearData Sources
2006
2011
2016
Statistical data were collected or calculated from Chinese statistical yearbooks.
Central Statistical Yearbooks: «China Statistical Yearbook», «China Statistical Yearbook on Science and Technology», «China City Statistical Yearbook, «China Statistical Yearbook on environment», China Social Statistical Yearbook», «China Rural Statistical Yearbook, «China Energy Statistical Yearbook», «Procuratorial Yearbook of China, «China population and employment statistical yearbook»
Provincial Statistical Yearbooks: «Beijing Statistical Yearbook», «Hubei Statistical Yearbook», «Tianjin Statistical Yearbook», «Hunan Statistical Yearbook», «Hebei Statistical Yearbook», «Guangdong Statistical Yearbook», «Shanxi Statistical Yearbook», «Guangxi Statistical Yearbook», «Inner Mongolia Statistical Yearbook», «Hainan Statistical Yearbook, «Liaoning Statistical Yearbook», Chongqing Statistical Yearbook», Jilin Statistical Yearbook, «Sichuan Statistical Yearbook», «Heilongjiang Statistical Yearbook», Guizhou Statistical Yearbook», Shanghai Statistical Yearbook», «Yunnan Statistical Yearbook», «Jiangsu Statistical Yearbook», «Tibet Statistical Yearbook», «Zhejiang Statistical Yearbook», «Shaanxi Statistical Yearbook», «Anhui Statistical Yearbook, «Gansu Statistical Yearbook», «Fujian Statistical Yearbook», «Qinghai Statistical Yearbook, «Jiangxi Statistical Yearbook», «Ningxia Statistical Yearbook», «Shandong Statistical Yearbook», «Xinjiang Statistical Yearbook», «Henan Statistical Yearbook»
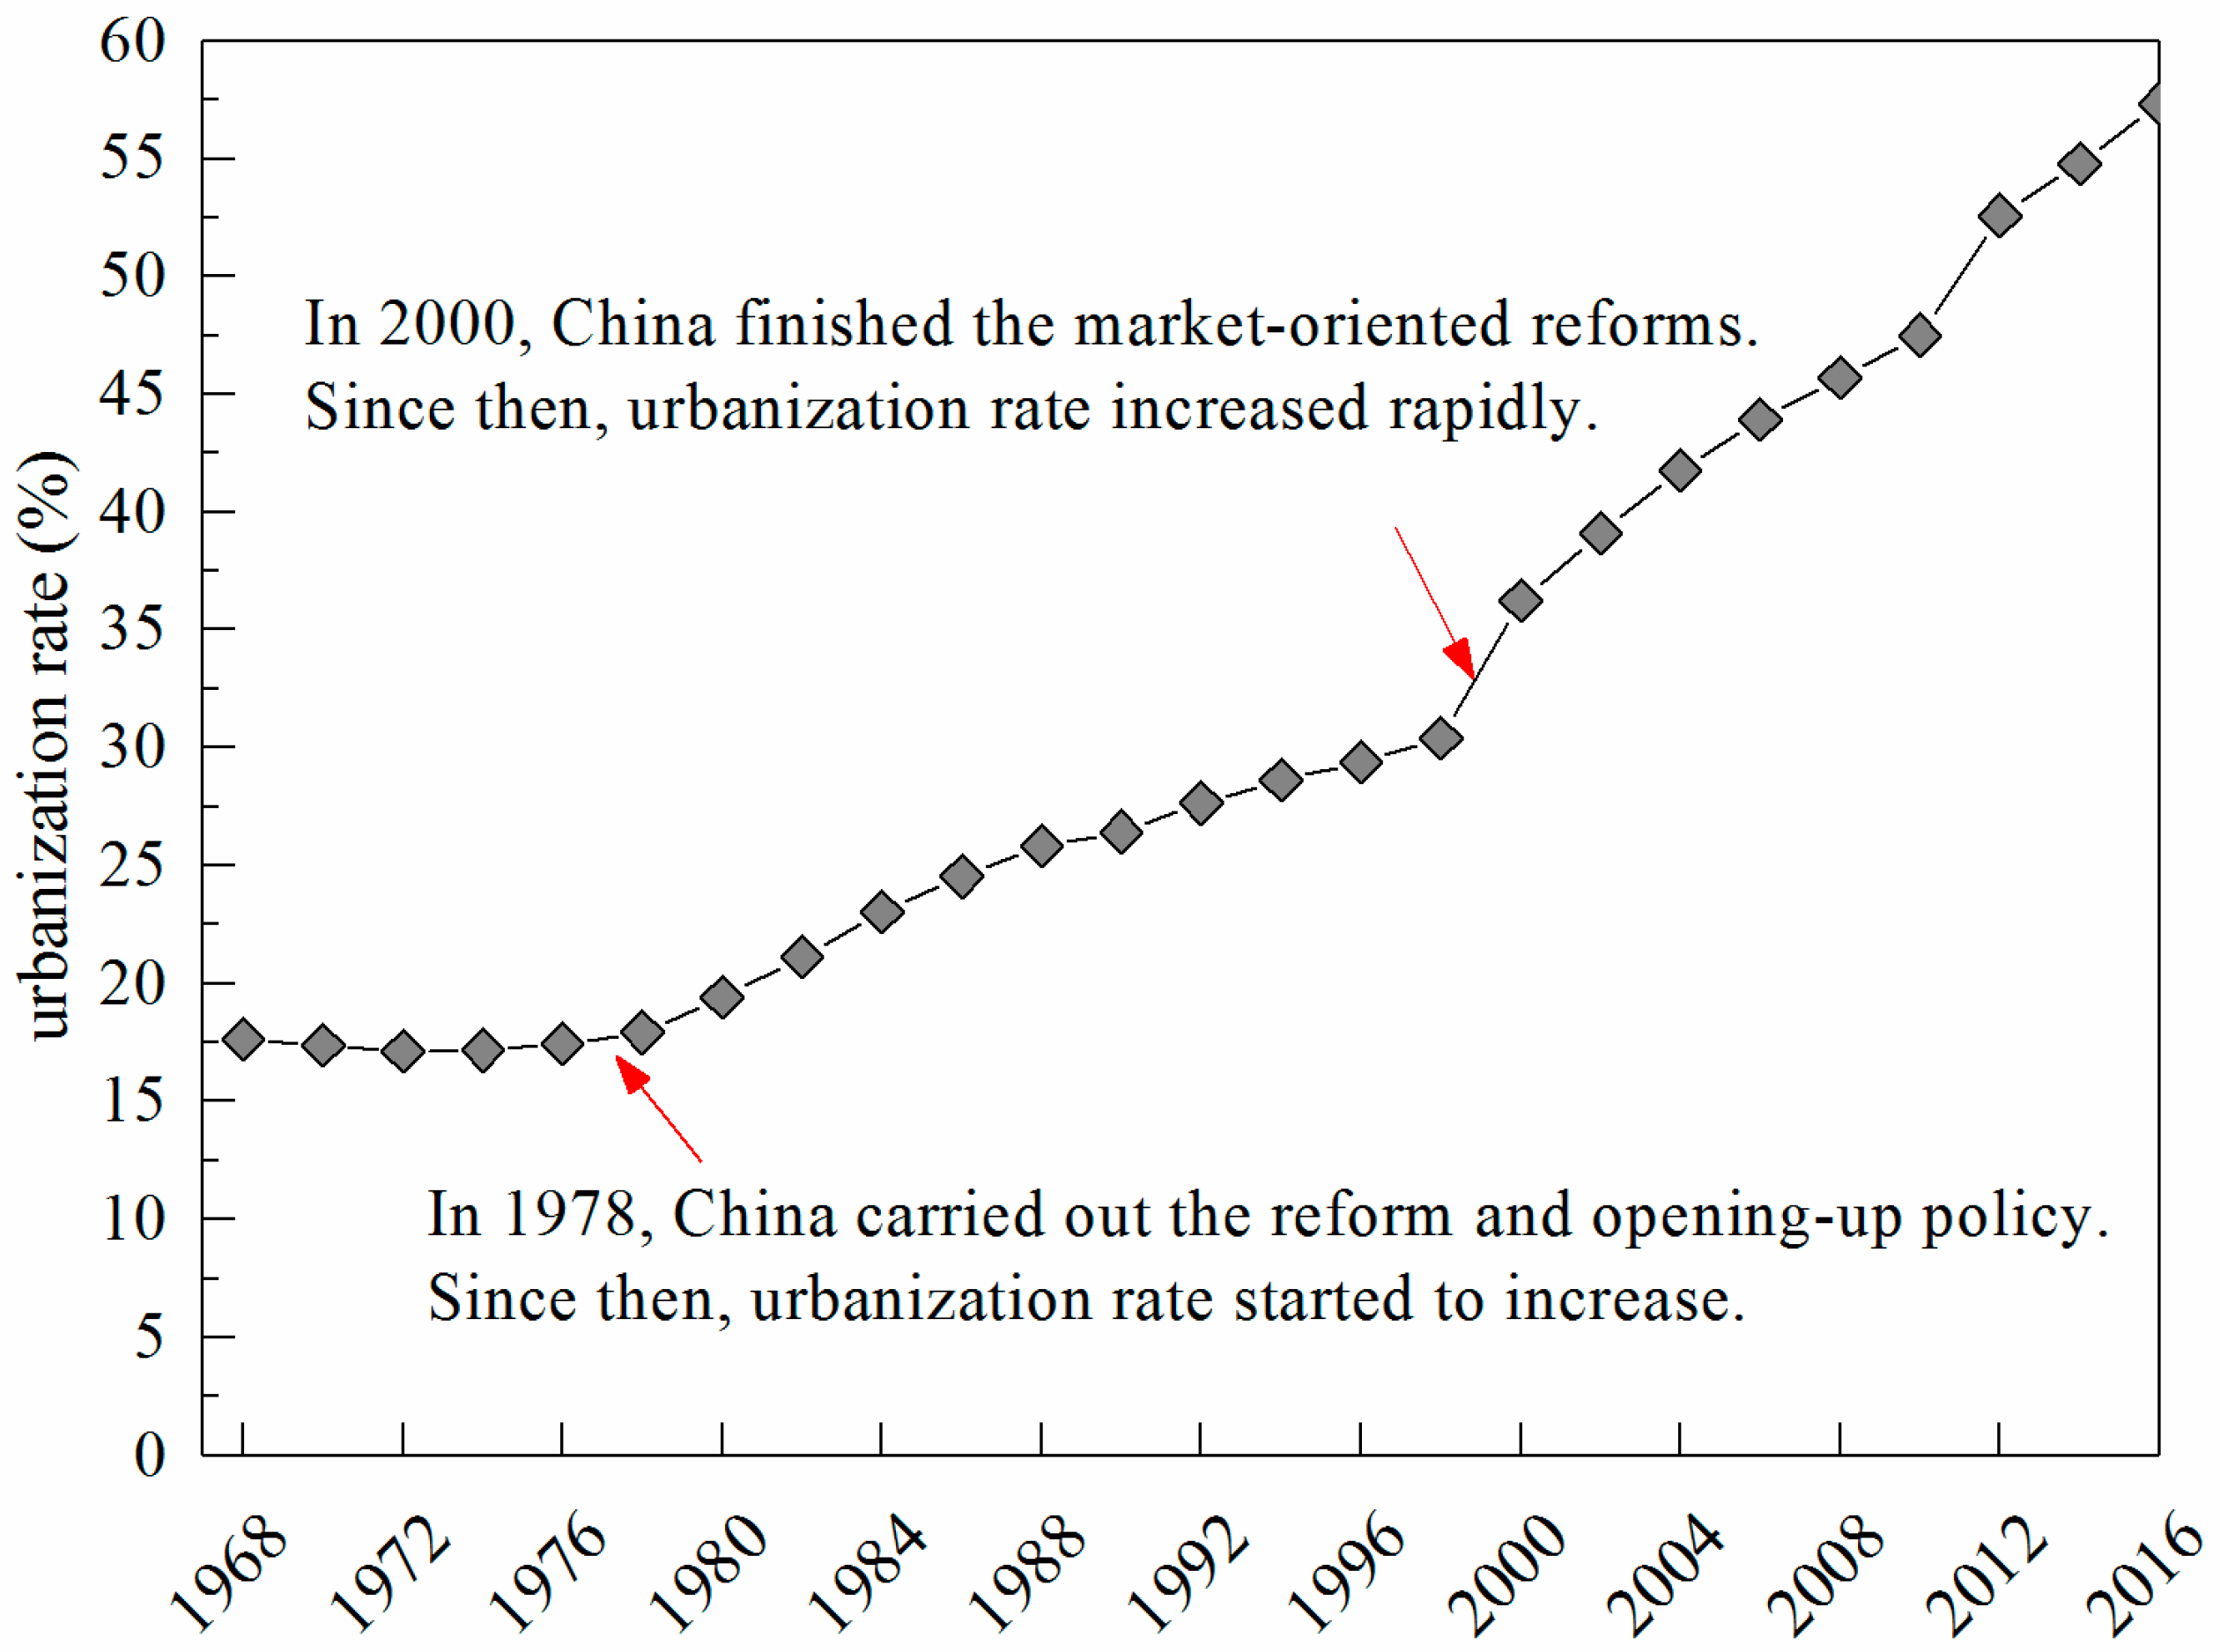
1968–2016Demographic data in Figure 1 were from China State Council
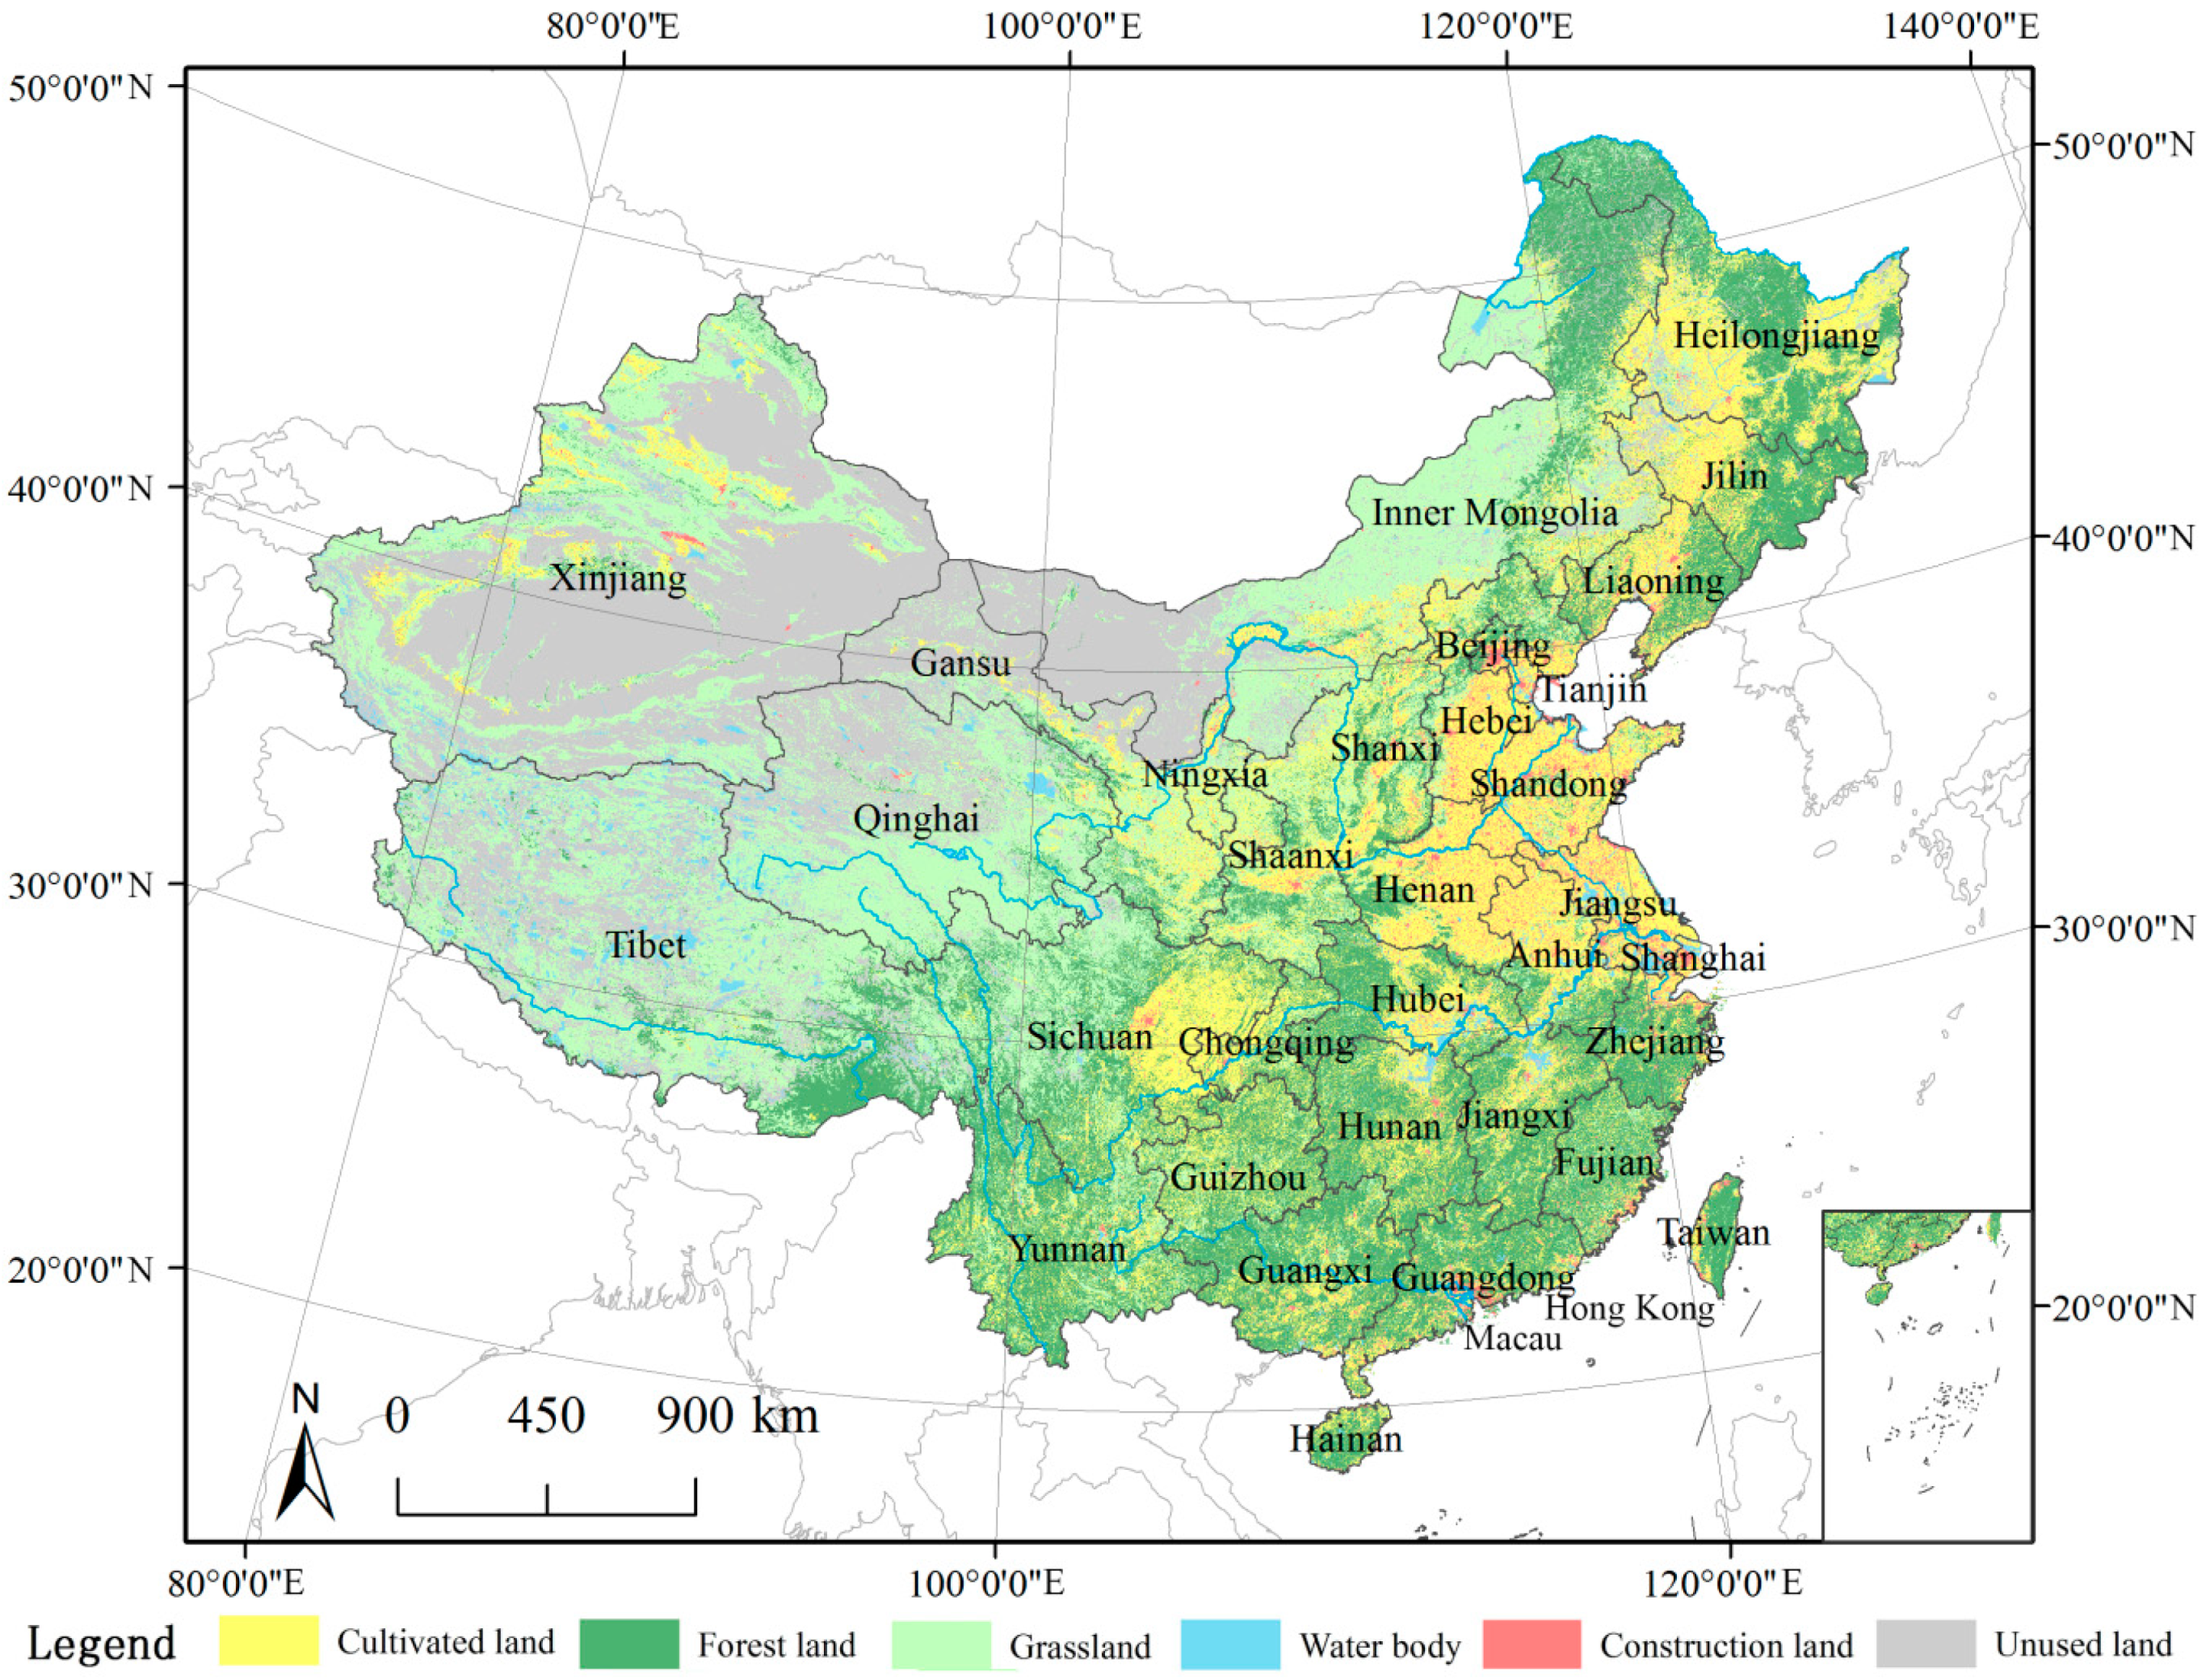
2015Vector data (including land use data in Figure 3) were from Resource and Environment Data Cloud Platform
Table 2. Evaluation indicator system and weight of five-dimensional urbanization. Data source: Chinese statistical yearbooks. AHP: analytic hierarchy process, GDP: gross domestic product, R&D: research and development.
CriteriaWeightCodeIndicatorsUnitsIndex PropertiesAHP Weight w Entropy Weight uCombination Weight λ
economic dimension0.20A1GDP per capita1 RMBpositive0.03810.05250.0453
A2GDP proportion of secondary and tertiary industry%positive0.04090.01350.0272
A3Disposable income of households per capita1RMBpositive0.05840.05270.0556
A4Investment of fixed assets per unit area100 million RMB/km2positive0.02710.02990.0285
A5Retail sales of consumer goods per unit area100 million RMB/km2positive0.01800.02030.0191
A6Scalable industrial output value per unit area100 million RMB/km2positive0.01760.02360.0206
social dimension0.20B1Proportion of urban population%positive0.03830.01620.0272
B2Average rate of participating basic pension insurance, basic medical care insurance, and unemployment insurance%positive0.05560.05440.0550
B3Area of paved roads per capitam2positive0.01860.04220.0304
B4Number of beds in health and medical institutions per 1000 personsbedpositive0.03480.03370.0343
B5Registered unemployment rate in urban areas%negative0.02500.02320.0241
B6Engel’s coefficient of urban family%negative0.02770.00900.0183
ecological dimension0.20C1percentage of greenery coverage in built-up areas%positive0.05000.01540.0327
C2Energy consumption per unit GDPtce */10,000 RMBnegative0.05000.01810.0340
C3Treatment rate of consumption wastes%positive0.02500.00660.0158
C4Rate of multipurpose use of solid waste%positive0.02500.01120.0181
C5Discharge of waste water per unit GDPton /10,000 RMBnegative0.02500.03080.0279
C6Discharge of industrial waste gas per unit of GDPm3/10,000 RMBnegative0.02500.01720.0211
cultural dimension0.20D1Input intensity of R&D Expenditure%positive0.05190.05210.0520
D2Number of granted patent applications of inventions, utility models and designs per 10,000 personpiecepositive0.04040.08500.0627
D3Number of regular students enrolled in normal and short-cycle courses in regular higher education per 10,000 personpersonpositive0.04290.02390.0334
D4Number of books in public libraries per 10,000 personcopypositive0.01490.07510.0450
D5Foreign exchange earnings from international tourism per unit area10,000 US dollar/km2positive0.02710.07310.0501
D6Number of performances by art performance troupes per 10,000 personshowpositive0.02280.07270.0477
political dimension0.20E1Number of criminal offences per 10,000 person%negative0.03600.01470.0254
E2Abuse-of-power criminals per 10,000 civil servantspersonnegative0.05070.01270.0317
E3Number of lawyers per 10,000 personpersonpositive0.01740.06440.0409
E4Number of labor law supervision organization of labor union per 10,000 personunitpositive0.03300.03080.0319
E5Coordination degree of urban and rural incomedimensionlessnegative0.03210.01940.0258
E6Coordination degree of urban population and built-up areadimensionlesspositive0.03070.00560.0182
* tce stands for ton of standard coal equivalent.
Table 3. Global Moran’s I indexes of five dimensions.
Global Moran’s Ip-ValueZ-Score
Economic dimension0.24390.0043.6052
Social dimension0.03690.1920.0866
Ecological dimension0.47140.0016.2811
Cultural dimension0.20760.0132.8141
Political dimension0.04490.1620.9491
Monte Carlo 999 Random Permutations.
Table 4. Global Moran’s I indexes of comprehensive urbanization quality.
Global Moran’s Ip-ValueZ-Score
T20050.19790.0142.9052
T20100.24560.0073.5020
T20150.20860.0113.0037
Monte Carlo 999 Random Permutations.
Table 5. Global Moran’s I indexes of coupling coordination degree.
Global Moran’s Ip-ValueZ-Score
D20050.24750.0033.5019
D20100.26910.0033.9143
D20150.22410.0033.3114
Monte Carlo 999 Random Permutations.
Table 6. Top eight obstacle factors of each region.
RegionsRanking List of IndicatorsRegionsRanking List of Indicators
1234567812345678
BeijingD6D5D4E4E3A4B3B4HubeiD2D6D5A3D4E3B2D1
TianjinD6E3D4D2B2D1A3B4HunanD2D5D6D1A3D4E3B2
HebeiD2D5B2D1A3D4D6E3GuangdongD6E3D4D1D2A3E4A4
ShanxiD2D5D1A3D4B2E3D6GuangxiD2D1D6B2A3E3D5D4
Inner MongoliaD2D1D5D6A3E3D4B2HainanD2D1D5D6A3D4E3E4
LiaoningD2D5D6D1E3A3D4B2ChongqingD2D5D1A3D4E3D6A1
JilinD2D6D1D5A3E3D4E2SichuanD2D5A3D4D6E3D1B2
HeilongjiangD2D6D5D1A3E3D4B2GuizhouD2D1A3D5D6E3D4B2
ShanghaiD6E3D2E4B3E1D1A4YunnanD2D1A3B2D6D4E3A1
JiangsuD5D6E3D4D1A3B2B4TibetD2D1A3B2D4D6D5A1
ZhejiangE3D1D4D5E1D3D6A3ShaanxiD2A3D6E3D4B2D1A1
AnhuiD2A3B2D4E3D1D5A1GansuD2D5A3D1D6B2D4A1
FujianD1D2B2E3D4A3D6B4QinghaiD2D1D5A3D6B2D4A1
JiangxiD2D1D6A3D5E3D4B2NingxiaD2D5D1A3D6E3D4A1
ShandongD2D5D6D4E3A3D1B4XinjiangD2D1A3D6D5D4E3A1
HenanD2D5A3D1D4B2E3A1

