Sustainable Development, Poverty, and Risk of Exclusion for Young People in the European Union: The Case of NEETs


1
Department of Economic Structure and Development Economics, Universidad Autónoma de Madrid-Spain, Madrid 28049, Spain
2
Department of Economics, Universidade da Coruña-Spain, A Coruña 15071, Spain
*
Author to whom correspondence should be addressed.
Sustainability 2018, 10(12), 4708; https://doi.org/10.3390/su10124708
Submission received: 25 October 2018
/
Revised: 25 November 2018
/
Accepted: 6 December 2018
/
Published: 10 December 2018
(This article belongs to the Special Issue Information Society and Sustainable Development—Selected Papers from the 5th International Conference ISSD 2018)
Abstract
:The difficulties of access to the labor market remains in the post-crisis period, particularly for younger people and for those countries more affected by the crisis. The economic conditions with the precariousness of the labor market and higher unemployment taxes for youth, draws a scenario where the risk of poverty and social exclusion could influence young people and discourage them from social and economic participation, and thus the number of young people not in employment, education, or training (NEETs) will increase. The sustainable development in general and the social sustainability in particular needs to solve this important issue to get a balanced and fair social and economic scenario. In this work, the influence of socio economic variables related to the level of prosperity of the country and social protection as well as the risk of poverty and social exclusion on young NEETs is evaluated based on the EUROSTAT data for the year, 2016, for young people. The method was a structural equations model and the results confirm that the key important factors for explaining the situation of the NEETs’ are more related to poverty and exclusion than to the economic environment. The main conclusion from these results is the importance of implementing some inclusive actions to prevent an increase in the number of young NEETs, and boosting, in this way, a more balanced and sustainable society.
1. Introduction
Achieving sustainable development worldwide requires an equitable and balanced social and economic environment. The people who are currently looking for their first job are mainly young people known as “millennials”. These young people are facing their access to the labor market under very special conditions. On the one hand, the economic situation, which has just emerged from a severe economic crisis; on the other hand, the changing dynamics of the labor market, which requires workers with high levels of training and mastery of information and communication technologies (ICTs). Then, sustainable and balanced development should be understood in the context of a smart growth, which is essential for developing an economy based on knowledge and innovation, and a connected digital single market, which can boost growth in Europe and generate multiple new jobs for younger job seekers together with a lively knowledge-based society [1]. In these circumstances, some young people face barriers that are very difficult to overcome and they become discouraged. This discouragement can affect both the continuation of studies, enrolment in training, and/or in the search for a job. The economic situation of the country and the social support are factors that influence the youth discouragement and, depending on it, young people could become part of the group known as NEETs (neither in employment nor in education and training). The negative consequences of youth unemployment affect not only individuals, but also the whole society [2].
The economic crisis, which began in the financial sector in August 2007 and had its transformation into the global economic crisis with the stock market crash of September 2008, caused by the fall of the Lehman Brothers, highlighted the weaknesses of the labor model in certain European countries, particularly those most affected by this crisis, whose intensity was unprecedented since the Great Depression of 1929. Some groups, among them youth, were more vulnerable. Although the evolution of the youth population between 1997 and 2017 has experienced a growth of 139 million people, while the youth workforce was reduced by 34.9 million people. The overall participation rate of the youth workforce has decreased over the past 20 years from 55.0% to 45.7%, and in the Organization for Economic Co-operation and Development (OECD) countries, almost 18% of unemployed youth have been without work for a year or more [3].
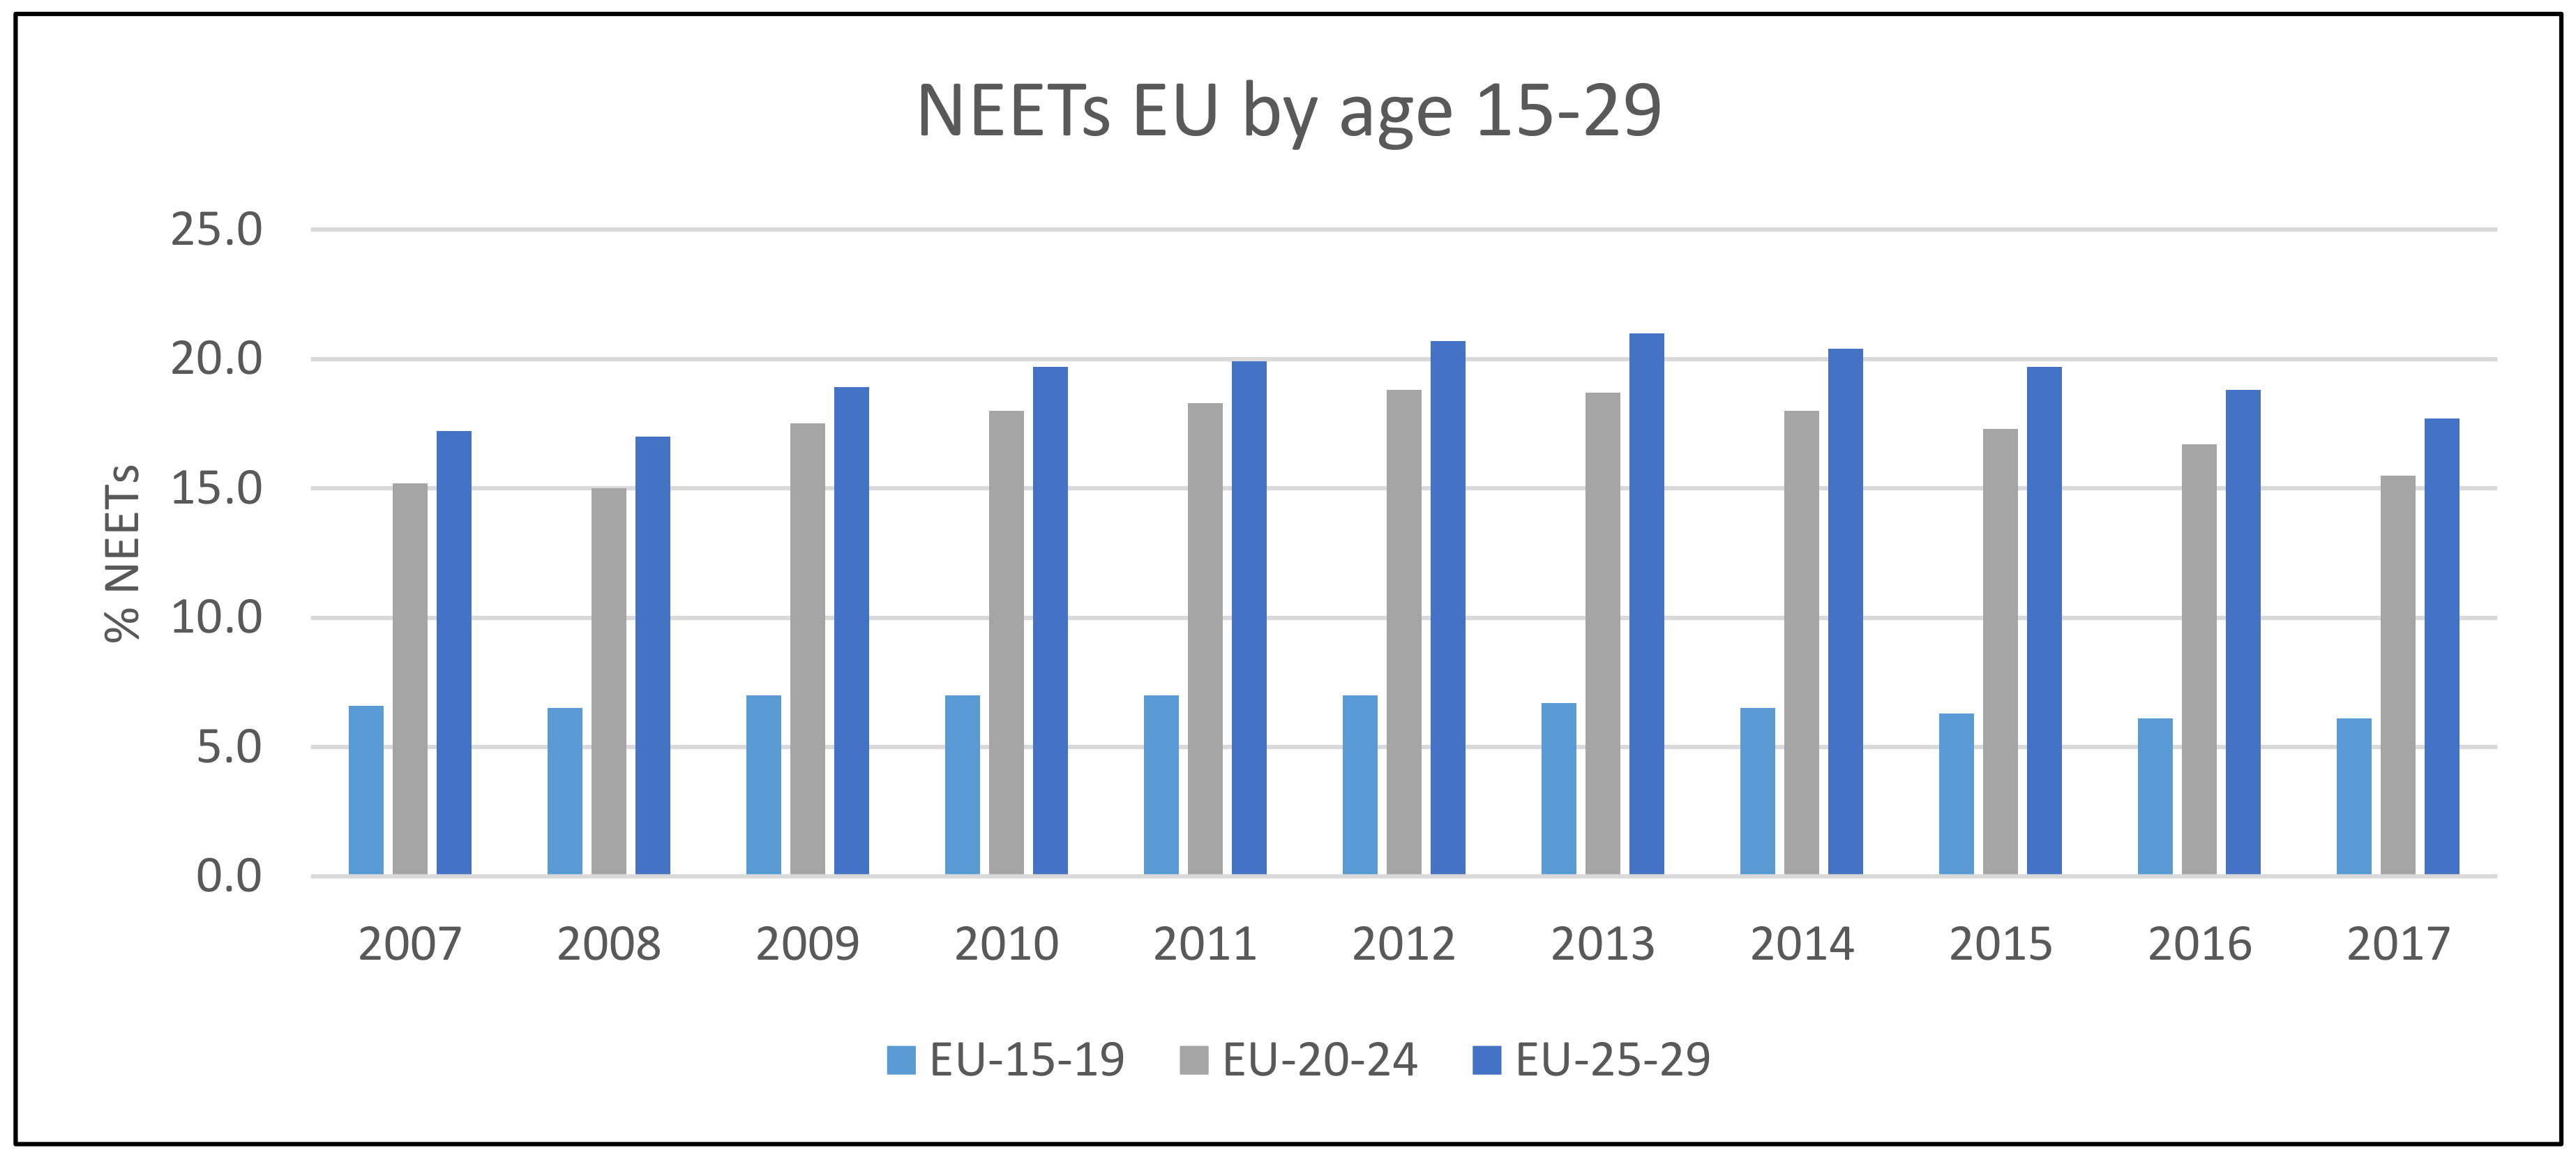
At the Luxembourg Summit (1997), the European Employment Strategy was adopted. Its main objective was to achieve progress over a five-year period, especially with regard to youth unemployment [4], and this issue continues to be the main concern, as is reflected in the importance given to it in the European Agenda 2030. Moreover, if the amount of NEETs is high, as Quintano, Mazzocchi, and Rocca (2008) [5] stated for the case of Italy, it could represent a social alarm because it could become an obstacle to economic growth, hampering productivity and competitiveness for the whole country, especially when this condition persists for a prolonged period [4]. The rate for young people neither in employment nor in education or training (NEETs) is closely linked to economic performance and the business cycle, but also related to labor policies and social protection. The NEETs rates in the EU-28 in 2016 were 6.1% for people aged 15–19, 16.7% for those aged 20–24, and 18.8% for those aged 25–29. Figure 1 reflects the importance and evolution of the percentages of NEETs. It is shown that there is a great difference attending age groups, and that for the youth from 25 to 29, this is an essential issue, since for 2013 and 2014, the incidence was 21.6% and 21.2%, respectively.
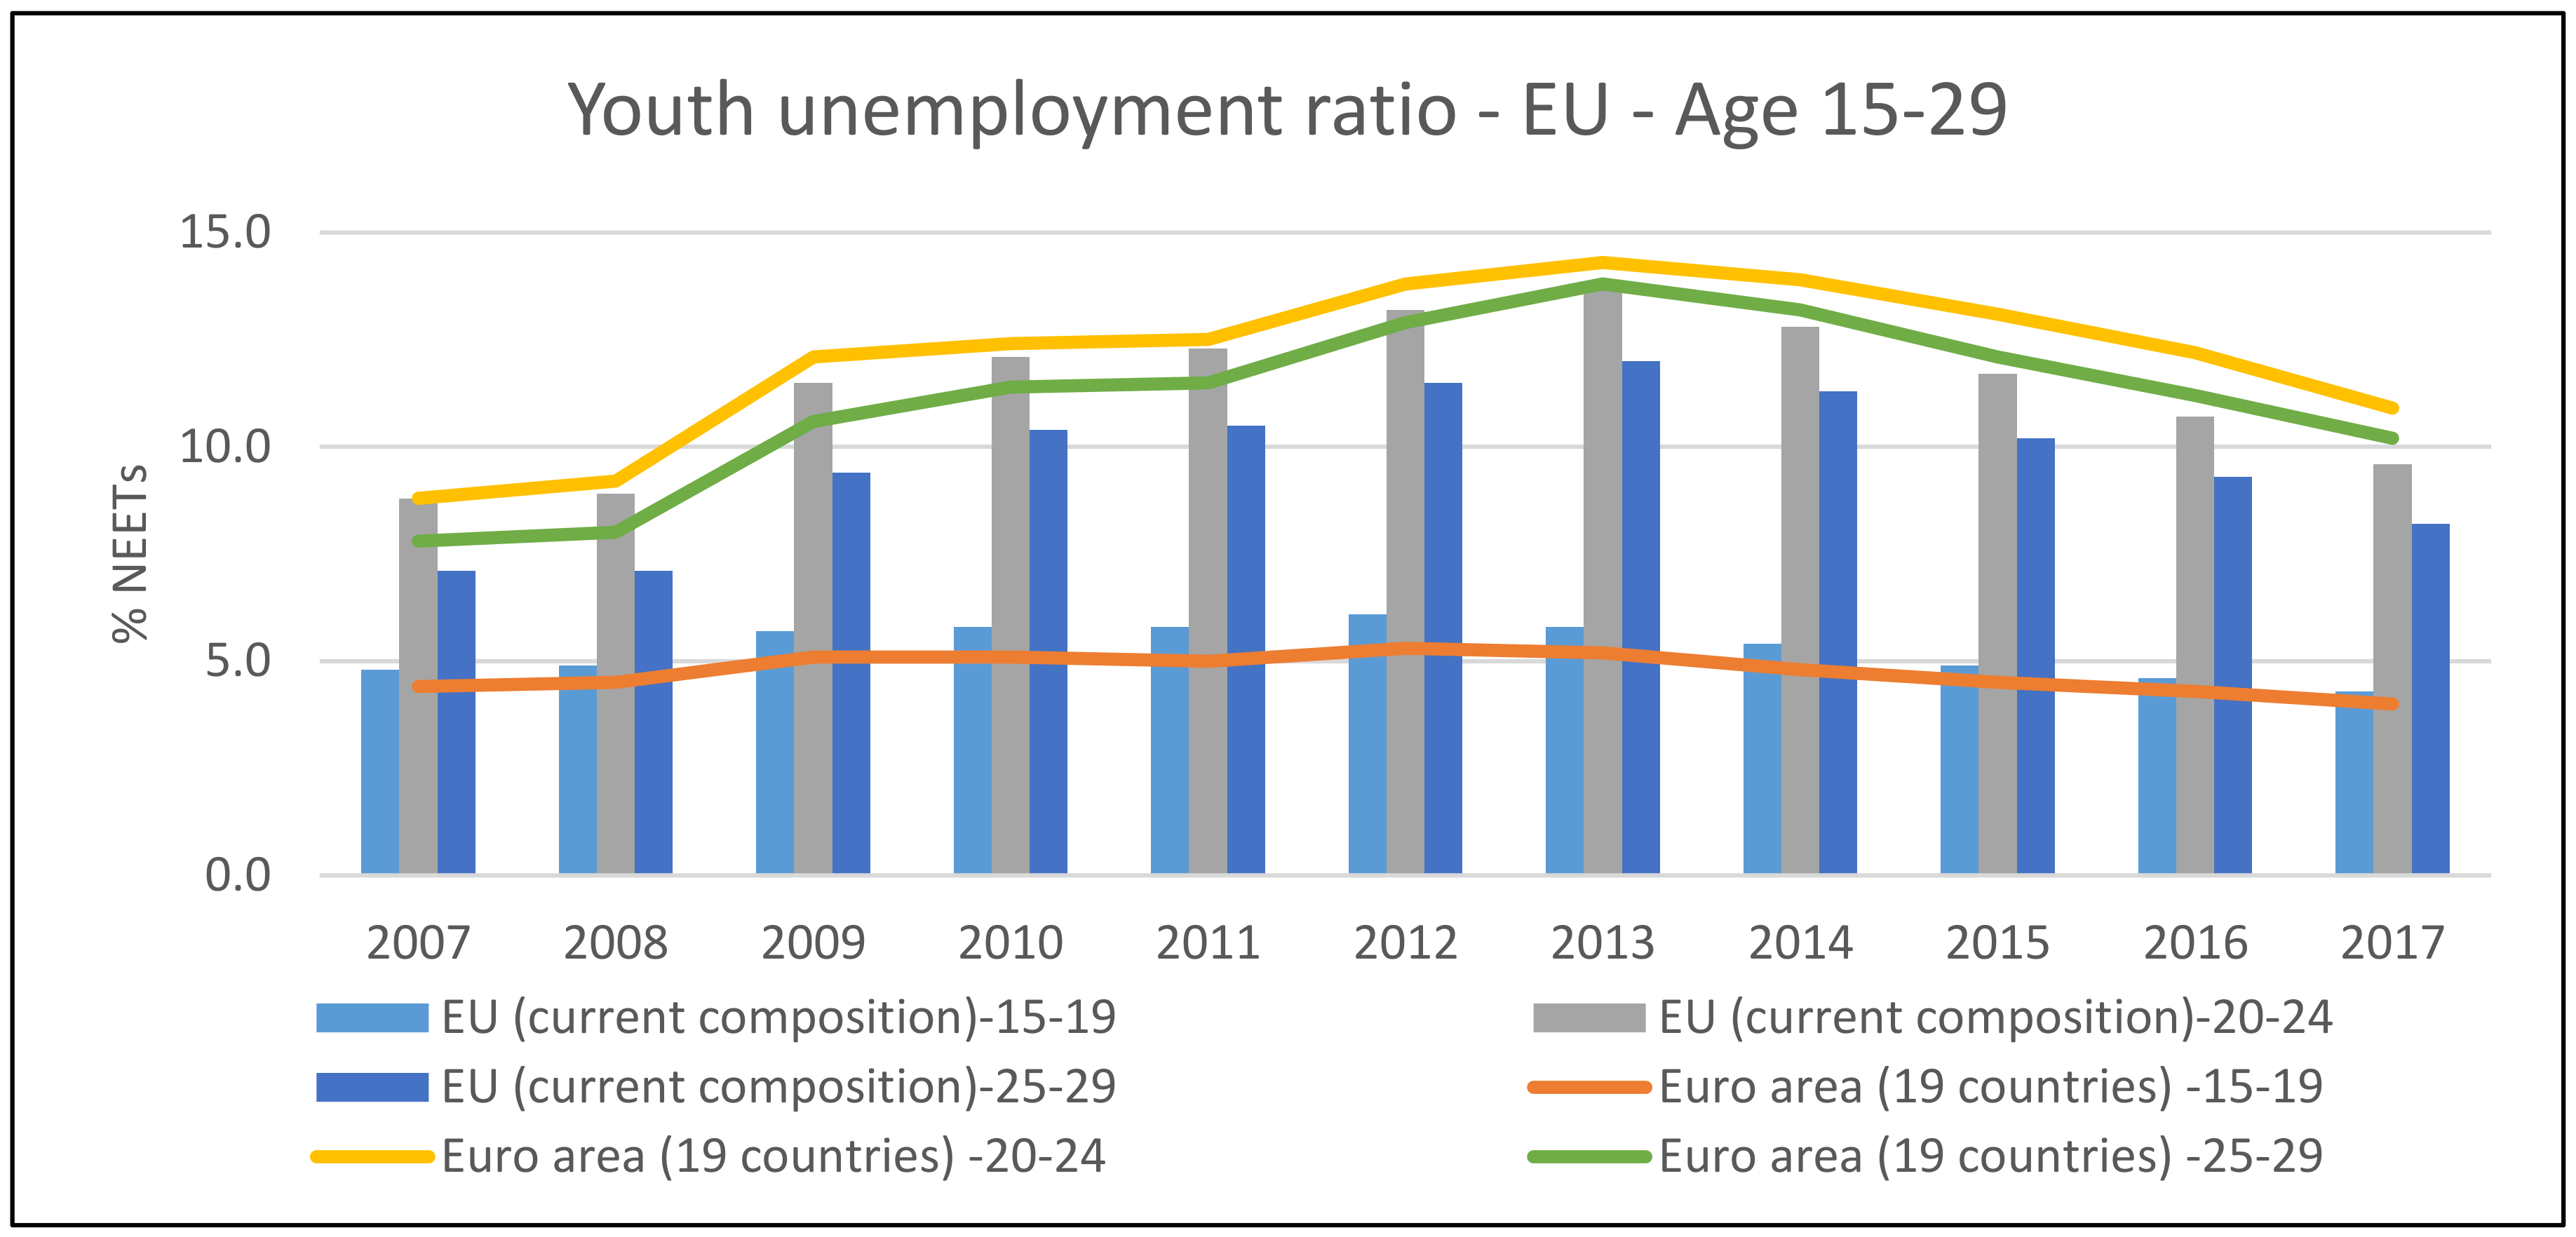
The economic crisis intensified young people’s situation, increasing social inequalities [5], since in the economic context crisis, there is a risk of the emergence of ‘the precariat’ as a new social class, which involves all those without work or precarious jobs, sometimes highly qualified individuals, who are affected by the environment, which has not allowed them to develop their career as they would have liked [6,7]. The unemployment taxes among youth (15–24 years) have risen quickly, as is shown in Figure 2. The high unemployment levels for youth are one important factor to explain the risk of exclusion and why it is higher for youth than for the whole population. Considering all these circumstances, there is an important risk of exclusion for youth, but is seems to be higher for the NEETs, as is proved by the data related to the EU, as is shown in Figure 3, and an overview of the total population by age in Figure 4.
Academic literature points to the economic situation [8,9] and the risk of exclusion [5,10] as important factors interacting [11,12] to influence the youth’s discouragement and the possible increase of the number of NEETs. Trying to locate the link among these three variables, in general, and trying to identify a causal relation is the main objective of this work. There is a growing body of academic research on sustainable development and the risk of exclusion for young people, focusing on a wide range of factors of exclusion and its multiple factors, from health and education to labor market access [13,14,15].
The interest of our research and its main contribution to the literature relies on two main points: On the one hand, establishing and quantifying a causal relation between the number of NEETs and the economic environmental conditions as well as their risk of poverty and social exclusion; on the other hand, to prove that the significant variable to explain the number of NEETs is the risk of poverty and social exclusion, whilst the economic factors become less relevant (data of European Union Statistics Office-EUROSTAT have been used).
The main goal of this paper is to analyze the influence of the socioeconomic environment and the risk of vulnerability as explanatory variables for the incidence of the NEETs phenomenon in the context of the European Union, through a quantitative analysis, which uses the data provided by the statistical office of the European Union. (EUROSTAT) for the year, 2016.
The structure of this paper is as follows: After the statement of the importance of the analyzed issue, as well as its contextualization, shown in Section 1, the influences of the economic environment and the risk of vulnerability as meaningful variables for the explanation of the youth inclusion on the labor market and to avoid their risk of becoming a NEET and the interrelation among the explained variables as well as the causal model proposed in this research are stated in Section 2. The methodological approach is explained in Section 3. The results are given in Section 4, and a discussion and reflections are presented in Section 5. Finally, Section 6 is dedicated to the presentation of the conclusions, together with some policy recommendations. In this section, some limitations of this study are shown as well as some lines for further research.
2. The Economic Environment, Vulnerability, and Young People
The special situation experienced by young people currently seeking their first job, due to the economic crisis, has also been influenced by the dominant public policies at that time. In particular, social, labor, educational, and health policies are very relevant because they present a specific environment, which could lead to a situation of labor vulnerability. This occurs both in the case of those who find employment, because it is a job of poor quality, and in the case that they do not find it, because they could fall into discouragement. In this sense, the academic literature points out that the incidence of the number of NEETs is related to the socio-economic environment [5,7] and also with the situation of social vulnerability [16,17,18], mainly represented through the risk of poverty and social exclusion. Hence, the importance of analyzing the vulnerability of young people in their access to the labor market, considering the socio-economic environment in which they have developed, is identified. It is a complex situation in which the risk of poverty, social exclusion, and involvement in society are present [19]. It has been proven that inclusion avoids discouragement and the possibility of becoming a NEET; Robles, Funes Rivas, and Robles [11] proved both theoretically and empirically that engagement with society can potentially reduce the precarious economic situation, as well as a lack of education and relation being a way to drive young inactive people to be an integrated, active, and included citizen.
Additionally, it is worth highlighting that this problem goes beyond a specific group to become a social problem that has an important projection in the future [2], since the probability of finding a permanent job for those young people who previously were in the NEET position is lower and they assume a higher risk of precarious employment and other social issues, which even could come to a lack of trust in social institutions [18]. In all the countries of the European Union, the NEETs register high unemployment rates, and many of them, when finishing the basic or compulsory education, do not continue studying either. This inactivity leads to a delay in emancipation, family dependence, lack of integration in society, and can lead to psychological problems, with the ultimate effect of a process of social exclusion [18]. It is like a wound that will heal, but, perhaps, accompany them throughout life. In sociology it is called the “scar effect”, which points to the fact that we have generations ahead that will be distrustful and without great motivation neither for the work world nor for other issues. By not having many expectations, they survive reality in the way that they believe that the least harm can be done to them. For those who have had a previous job, this scar effect could be reduced if they have received an unemployment benefit [20], but this does not happen if they are looking for their first job, as it is, in general, the case that concerns this research.
The NEETs Distribution
The economic and social situation of many countries has been so much affected that a decade later they have barely managed to recover the levels of wellbeing prior to the economic crisis. This situation has particularly hurt the countries of the south of the European Union, belonging to the Euro area, which have not been able to use the mechanisms of monetary policy to deal with the crisis situation. This is the case of Greece, Portugal, Spain, and Italy [5,16,21]. The evolution of the incidence of NEETs (provided in Figure 5) seems to remain equal across time and it appears with a quite similar patron both for the whole EU and for the Euro area. The unequal sectorial result of the dynamics of labor supply and demand became imbalanced in the labor market and has worsened in recent decades. The significant presence of very intensive sectors in unskilled work (construction or tourism) explain the high volatility of employment, as was seen in some southern European countries, for example, in Spain [16,22]. However, this situation in the labor market was similar to what happened in other areas of the economy. Specifically, the general environment, due to the policies adopted in those countries to deal with the economic situation, which have been accompanied by restrictions on public spending on fundamental aspects, such as health [23] and education [24]. As a result, some social groups, like today’s youth, who were in their childhood or adolescence at the time of application of these policies and, therefore, have been affected by them, are at risk of being part of the NEETs group. It is important to try to avoid this risk, since the NEETs “are exposed to a high risk of poverty and social exclusion, as they cannot improve their skills and competences, losing competitiveness” [5].
The main previous research on causes for becoming a NEET are then linked to the economic threat of vulnerability [11,12]. For the proposal of this paper, the economic environment is understood not only from wealth, income, or production, but from a perspective of the population participation on the wealth of their country. Regarding the threat of vulnerability, the risks of poverty or social exclusion is a good indicator. According EUROSTAT, people at risk of poverty or social exclusion (AROPE), refers to persons who are either at risk of poverty, or are severely materially deprived or living in a household with a very low work intensity (those persons are only counted once even if they are present in several sub-indicators). The AROPE rate, the share of the total population which is at risk of poverty or social exclusion, is the headline indicator to monitor the EU 2020 Strategy poverty target.
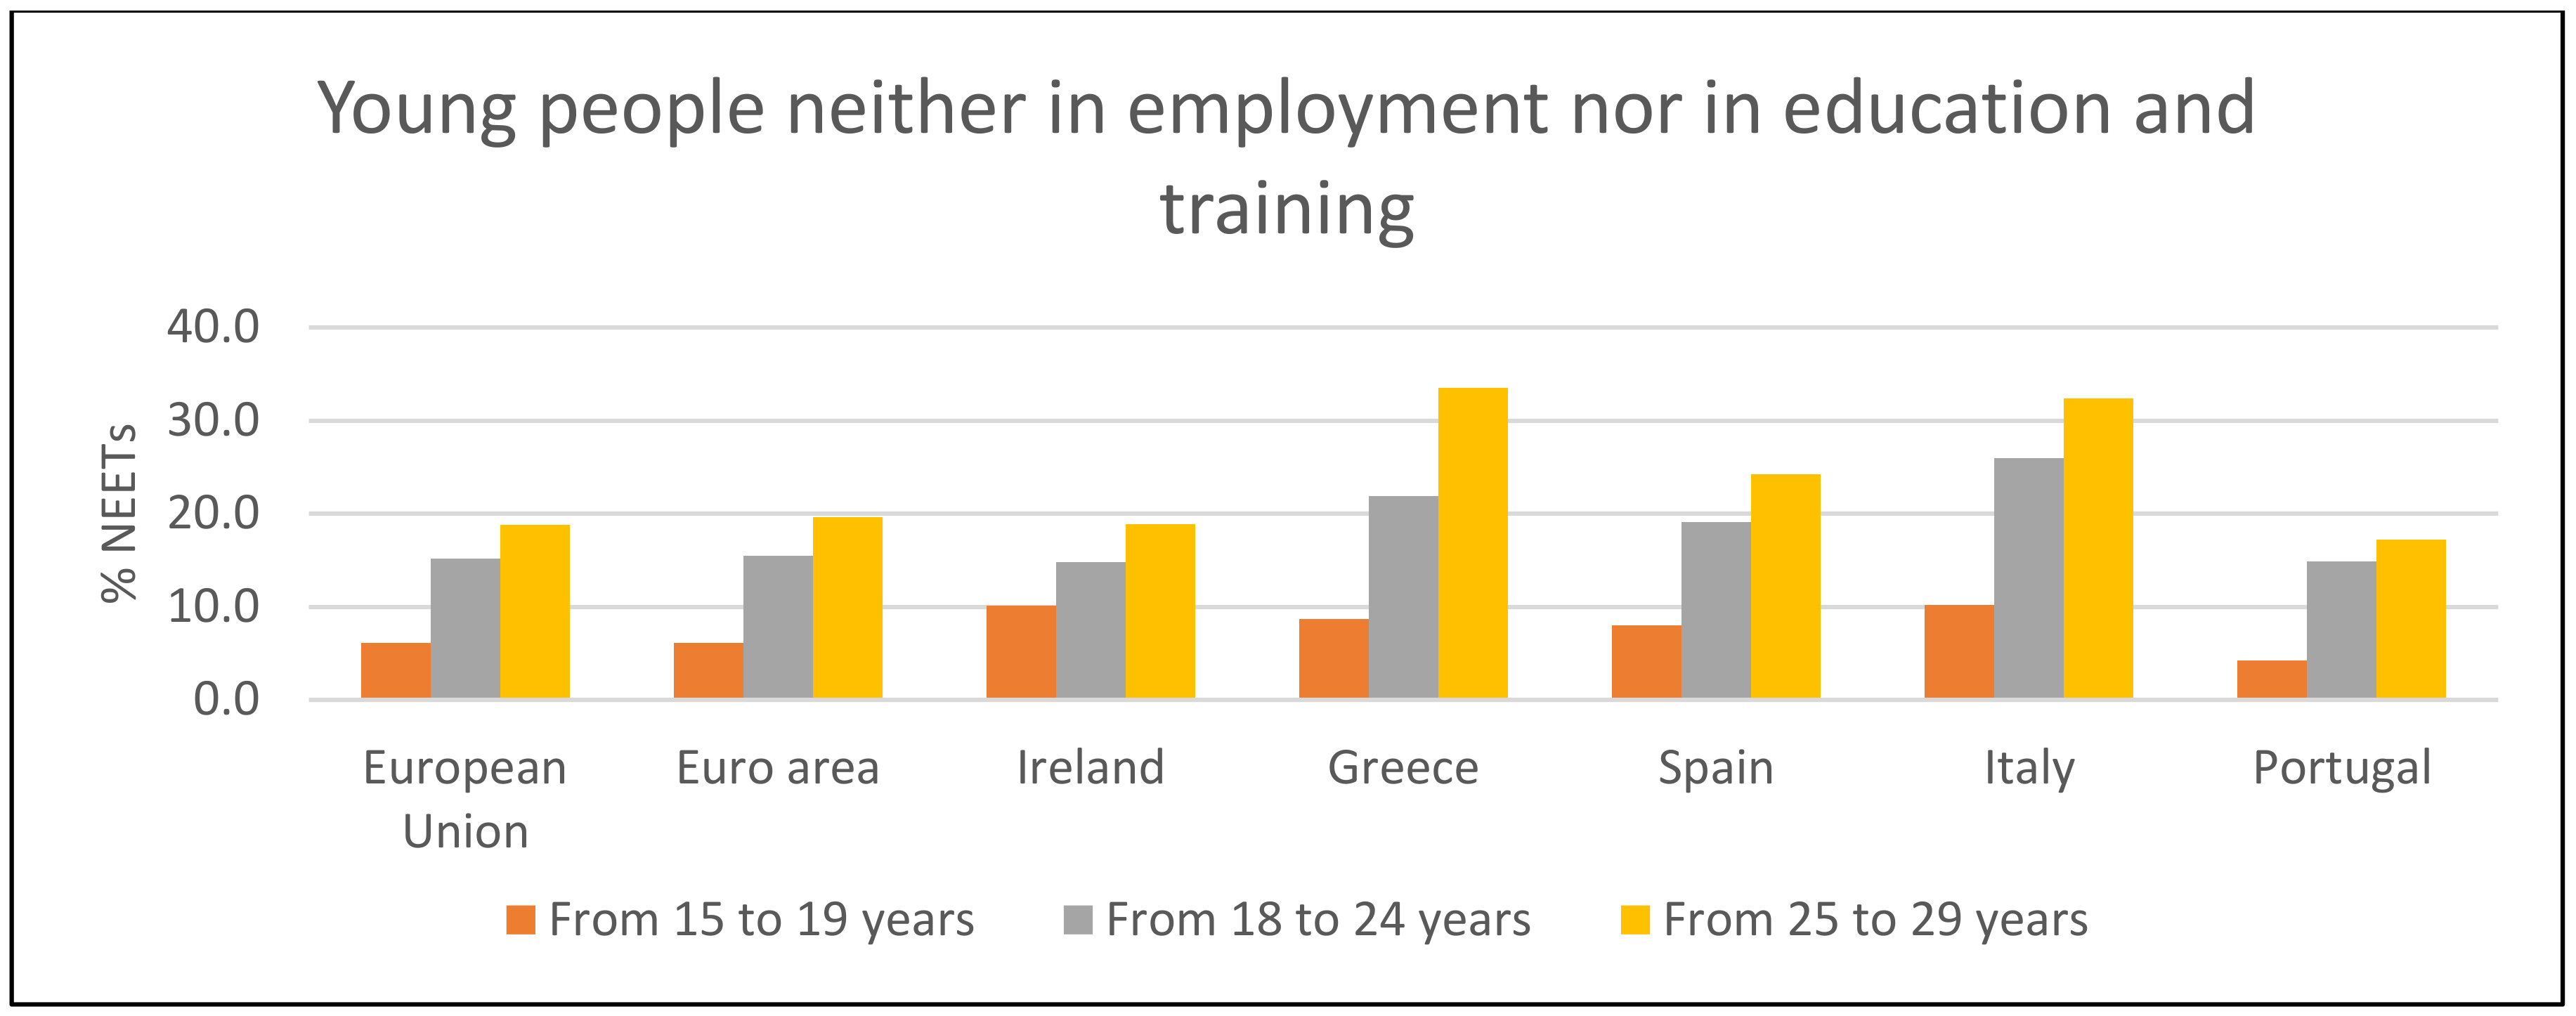
The risk of poverty and exclusion in the European Union is higher the younger the population is, as can be seen in Figure 4 and Figure 6, where the EU, Euro area, and the countries more affected by the economic crisis, are shown for the people at risk of poverty or social exclusion and the NEETs, respectively.
Detailed data for every single country as well as the evolution of the last years can be seen in Table 1. There are substantial differences among countries. Nevertheless, complex and different factors seem to be the explanatory reasons for these disparities. One of the possible reasons, related to economic issues and the economic crisis, could rely on belonging (or not) to the Euro Area because those countries involved in the unique coin have lost the monetary policy as a very powerful instrument to face the crisis. This point is taken into account in this work and it is analyzed.
Considering the described scenario, the research question to solve here is if the economic environment and risk of vulnerability influences the incidence of NEETs’ problem in the context of the EU and, if so, the magnitude of this influence. In accordance, the model proposed in this work tries to link the economic framework, on the one hand, the poverty, and social exclusion risk, and, on the other, to explain the amount of NEETs. Then, the dependent variable will be the people at NEETs situation and the impendent ones will be the economic environment and the risk of poverty and exclusion and, by means of this simple model, a casual relation is explored.
As it was shown, according to the literature, it is expected that a causal relation between the situation of the economy and the incidence of the number of NEETs, as well as a direct and positive causal relation between the social situation (in terms of poverty and social exclusion) and the NEETs exists. Then, these relations can be summarized as the specific hypothesis to be tested, which are shown in Table 2. The first hypothesis (H1) is testing if the economic environment is a cause influencing the number of NEETs; if so, according to the literature, the expected sign of this relation should be negative, since the better the economic environment, the lower the NEETs incidence in the EU. The second hypothesis (H2) is testing whether the risk of poverty and social exclusion influences the number of NEETs in the EU. In the case of the existence of this causal relationship, the expected sign is positive, since the higher the risk, the greater the number of NEETs.
The graph representing this model is shown in Figure 7, by means of the output of the AMOS-IBM SPSS software. The big circles represent the latent variables (ξ in Equation (1)), the squared/rectangles are the observable variables. The circles with the “ei” (δ in Equation (1)) names are the measurement errors (related to the measurement model and the construction of the latent variables) and the circle with the “z1” is the estimation error (related to the structural model and the regression analysis).
In addition to this analysis, possible differences between countries should be explored to demonstrate the validity of the approach focused on the study of the European Union as a whole as well as to strengthen the proposed model, in the case no differences have been found.
3. Method
The methodologic approach used is a quantitative analysis based on structural equation modelling (SEM). It is worth highlighting the potential of the proposed methodology for the study of causal relationships between unobservable variables. This method applies jointly to the techniques of factor analysis and linear regression. SEM has been useful to address many substantive problems in society, which are based on the “path analysis” proposed by Wright [25,26] and later developed by Jöreskog [27,28] and for Jöreskog y Sörbom [29]. SEM models analyze the causality between one or several variables (independent/or dependent) by considering the existence of multiple interrelationships between them, with the possibility of working simultaneously with observed and latent variables, as well as stablishing causal relationships. From our point of view, it is an adequate method since the main objective is to establish a causal relationship.
It is worth highlighting the potential of the proposed methodology for the study of causal relationships between unobservable variables. The aim is to jointly apply the techniques of factor analysis and linear regression, in the context of a specific theoretical frame of reference. Thus, it is intended to compare the behavior of a real situation with the expected (through the comparative analysis of the variance-covariance matrix of the model to be tested with the theoretical proposal). The confirmatory factor analysis allows the “creation” or “construction” of those variables that cannot be directly observed, mainly due to the multiplicity of factors that make them up (which are known as observable and quantifiable). All these observable variables together, as a set, constitutes the so-called “latent variable or construct”.
The constructs are evaluated according to the so-called “measurement model”, which analyzes their internal consistency and reliability. In addition, the “structural model” studies the causal analysis, which allows testing hypotheses of causality, according to an expected theoretical model. The advantages of structural equations are manifested mainly in determining the reliability of the latent variable and its relation to each of the indicators that make it up, and, on the other hand, allows us to test and quantify the expected dependence causal relationships, according to a model of linear regression, in which dependent and independent variables can be observable or latent.
In this study, we have three latent variables: The economic environment and the risk of poverty and social exclusion (as independent or explanatory variables) and the incidence of NEETs phenomenon (as the dependent or explained variable).
3.1. The Measurement Model
The observable variables’ data were collected from the EUROSTAT database, specifically from income and living conditions (ilc) and annual national accounts (nama10) statistics for the structural model and from other EUROSTAT sources, such as [yth_empl_160], [yth_empl_140], [ilc_peps01], [edat_lfse_20], and [nama_10_gdp]. The latent variables construction aimed to integrate all the relevant information about each of them. The NEETs variable ( assembles all information about the percentage of NEETs in the European Union who are unemployed. To collect the range of the different indicators, the main three age groups were considered: From 15 to 19 years, from 20 to 24 years, and from 25 to 29 years (see Table 3); in this way, the difference incidence of NEETs according to the age groups (see Figure 4) was considered. It is interesting to point out that the range of age for NEETs is variable for different organizations and countries, for example, the United Kingdom references to people between 16 and 26 years; and in Japan, it is from 15 to 34 years. The European Union considers youth to be those aged between 15–24 years, but for analyzing NEETs, EUROSTAT provide data for those aged from 15 to 29 years. In this paper, we take all these range of age [15,16,17,18,19,20,21,22,23,24,25,26,27,28,29], due to the relevance for the last stretch of ages.
The economic environment latent variable ( was constructed with the aim of collecting information about different spheres of the economy: One related to the general economic position of the country, the other to consumers’ purchasing capability and another about the public policies that exist to support citizens. So, three indicators or observable variables were selected: One related to the global welfare situation of the country (“gross domestic product”—GDP-measured at market prices, current prices, million euro), another as an indicator of the expenses of the people (the “final consumption expenditure” at current prices, million euro), and another related to the policies supporting citizenship (“subsidies”. Current prices, million euro).
Regarding the construct of poverty and social exclusion (, it compiles the information by age sectors, with the aim of catching all possible dissimilarities of prevalence due to the age groups. So, the indicators are: Percentage of people at risk of poverty or social exclusion (from 15 to 19 years), percentage of people at risk of poverty or social exclusion (from 20 to 24 years), and percentage of people at risk of poverty or social exclusion (from 25 to 29 years).
The measurement model explains the relation between the latent and observable variables, which is reflected in Equation (1):
X = Λ ξ+ δ
3.2. The Structural Model
This causal relation can be identified by linear regression modelling, which is established between the two independent variables (the economic environment and the risk of poverty and social exclusion) and the dependent one: The incidence of NEETs, measured as a percentage of people in that range of age (being NEETs from “i” to “j” years as the percentage of people from “i” to “j” years who are neither in employment nor in education and training). The different incidences of the phenomenon of NEET for the different groups of ages suggest that a latent variable should be created that is constructed with the information of these groups. So, the data of the percentage of NEETs for each age groups are the observed variables, whilst all together they construct the variable NEETs of the proposed model, with the advantage of catching all the information in one single variable (see Table 3).
The causal relationships are reflected with structural equations, that is, with regression equations in the context of a causal model (structural equation), where the coefficients are known as structural parameters [30]. On the other hand, all these variables are not a simple measure of a single item. In fact, they are constructed by some different indicators. The measurement model contained in this methodology determined these variables based on the adequate indicators. The indicators for the unobservable variable are shown in Table 3.
The economic environment has been approached by means of the subsidies as the indicator for the social protection expansion in the country; the gross domestic product at market prices, defined as the final result of the production activity of resident producer units, as the measurement of economic activity; and the final consumption as an indicator of prosperity or spending capacity.
The poverty and social exclusion and the NEETs’ latent variables were constructed by considering the different age groups, since the incidence and behavior is quite different depending on age [5,31,32]. In fact, it has been proved that the NEET phenomenon involves mainly older age classes [5,32].
On the other hand, the possible differences among countries were also analyzed. Since the last economic crisis had such different impacts on the countries belonging to the Euro area (particularly those on the south of Europe), it could be expected that a dissimilar impact on youth discouragement and their educational and labor engagement as well as in their interest in joining the labor market and/or training or education differed also. For this reason, a t-test for a means’ comparison analysis was undertaken. Two groups of countries were considered: Those belonging to the Euro area and the other European Union Members (with current composition). The main reason for studying these two blocks of countries is the possibility (or not) of using the monetary policy to face the crisis effects, because, for the countries immerse in the Euro Area, this possibility does not exist, since it is only on the hands of the European Central Bank. On the contrary, the other European countries are free to modify their exchange rate and it is a really important tool, which could make a strong difference in the economic environment and in the public policies designed in this context.
4. Results
The reliability and internal consistency of the measurement model was tested by means of the, Cronbach’s alpha [33], rates of composite reliability [34], and variance extracted values [35]. The results are shown in Table 4.
It is accepted that alpha should be higher than 0.7 [36,37], and composite reliability (CR) should produce scores at least equal to 0.5 [38] to confirm the internal consistency of constructs; another ratio to test the of the latent variable’s strength is the average variance extracted (AVE), which should achieve values over 0.5 [37]. All the variables in the model were within these values. All indicators were significant (p-value < 0.05). The fit of the model was tested by means of the comparative fit index (CFI) [30], and the minimum discrepancy rate (CMIN/DF = = Chi-Squared/degrees of freedom) [39], whose values are 0.932 and 0.171, respectively, and are within the suggested values for an acceptable fit.
The equations for the measurement model are:
The structural model results are summarized in Table 5, where the casual relations are assessed.
Taking into account the results of the structural model, it is shown that the risk of poverty and social exclusion is an explanatory variable of the incidence of NEETs among young people in the European Union, while economic factors are not significant.
In Equation (11 the structural model is described, and in Equation (12), there are the specific values of standardized estimators for this model.
The fitted R-squared was 0.657, what means that the model can explain more than 65% of the variability of the NEETs.
The analysis for identifying differences among countries was conducted to search for some evidence on this issue. A t-test for mean differences for independent samples was applied (with the SPSS IBM Statistics Program, 20th version). The results indicated that there were no differences for the whole number of NEETs for the consideration of the different age groups. Similarly, the results do not indicate statistically significant differences in the risk of poverty and social exclusion of young people as a whole, neither in data disaggregated by age groups.
5. Discussion
The results of this analysis indicate that the measurement model was adequate because the values for the indicators shown in Section 4 were in accordance with the standards. Therefore, the latent variables considered here are well constructed and accurately reflect the construction of the latent or unobservable variable.
Once the unobservable variables were identified, the causal relationships among them were analyzed by conducting a linear regression analysis. The results indicate that one of the independent variables was not statistically significant in explaining the dependent one: The economic environment, p-value = 0.466), so H1 was not supported by this model. On the contrary, H2 was supported, because the variable risk of poverty and exclusion was statistically significant (p-value = 0.001).
By means of structural equation modelling, it was identified that the main determining factor for young people to become part of the NEET group is the vulnerability or risk of poverty and social exclusion. These results are consistent with many of those obtained by previous research [5,11,17,19,40], because the risk of social inclusion is shown as a key point for avoiding discouragement and being more involved in society, and, consequently, avoiding being a NEET.
The distribution of the NEETs in the different countries in the European Union was analyzed in this work, however, due to this not being the key issue here, an overview is provided. Considering the descriptive statistics from data provided in Table 1, it is clear that deeper analysis is required. The focus on the differences among countries due to belonging to the Euro area showed no statistical significance differences, which indicates that the economic environment (in terms of economic policies available) are not key to explaining the incidence of the NEETs number. On the other hand, if there are no differences for the number of NEETs in the member states due to their economic status (monetary policy), the results obtained by the structural model remain consistent and reinforced.
6. Conclusions
The structural model shows that there was a causal relationship between the analyzed variables. The independent variables explained the incidence of the risk of becoming a NEET; nevertheless, the causal relationship with the specific variable poverty or social exclusion was definite, however, the aspects related to the economic environment show weaknesses in explaining the condition of NEETs, as it was not statistically significant. Thus, in relation to the hypotheses raised, we must confirm the second, but reject the first, which remarks on the importance of avoiding the risk of exclusion and poverty in any country and economic environment to dissuade discouraged youth from becoming a NEET. The response to the research question about the influence of the economic environment and risk of vulnerability on the incidence of NEETs problem in the context of the EU and its magnitude was partially affirmative, but identifies the different incidence of both dependent variables, since the one related to social issues is essential, whilst the economic issues has a subordinate importance.
These results, underlining the importance of social environment for NEETs in the context of the European Union, are in accordance with the ones shown by previous researches [5,17,19,40] in several different frameworks.
The main conclusions point out to the reinforcement of social protection as a key factor for the avoidance of youth becoming discouraged, thus diminishing their probability of becoming a NEET. This social protection measure should be understood in a wide sense, that is to say, covering a wide range of public policies, both economic and social, including health and education [41], which are fundamental for youth development without inequalities [13]. In summary, some measures driven to boost social cohesion and social sustainability could help to avoid an increase of NEETs. Our results are in concordance with the literature [11,12], and goes one step ahead by proving that the risk of exclusion and poverty is more relevant for becoming a NEET than an adverse economic environment. The strength and relevance of the results achieved in this work relay mainly on demonstrating this point by means of the SEM’s model, which concluded that by avoiding the risk of poverty and exclusion of youth, the percentage of NEETs in the EU will probably result in a decrease of NEETs. Nevertheless, some limitations should be pointed out. On the one hand the cross-sectional nature of this analysis needs to be completed from a dynamic perspective, and, on the other hand, the study of the main reasons for explaining differences among countries should be undertaken, from the point of view for each single country, since the analysis presented here only justified that there are no differences for belonging or not to the Euro area.
Future research should analyze the dynamics of this issue, focusing on a wider range of years, as well as on some specific policies’ influence on youth concerns to promote their engagement in society and to create a more inclusive and equitable society, compatible with whole sustainable development. On the other hand, extending research regarding the differences among countries and the influence of their specific social policies for including the NEETs is also needed.
Author Contributions
Conceptualization, S.M.R.-B., F.G.-L. and X.P.; methodology, X.P.; software, S.M.R.-B., F.G.-L. and X.P.; validation, S.M.R.-B., F.G.-L. and X.P.; formal analysis, S.M.R.-B., F.G.-L.; investigation, S.M.R.-B., F.G.-L. and X.P.; resources, S.M.R.-B., F.G.-L.; data curation, X.P.; Writing—original draft preparation, X.P.; Writing—review and editing, S.M.R.-B., F.G.-L. and X.P.; visualization, S.M.R.-B., F.G.-L. and X.P.; supervision, S.M.R.-B. and F.G.-L.; project administration, n/a.; funding acquisition, n/a.
Funding
This research received no external funding.
Conflicts of Interest
The authors declare no conflict of interest.
References
- Armeanu, D.Ş.; Vintilă, G.; Gherghina, Ş.C. Empirical Study towards the Drivers of Sustainable Economic Growth in EU-28 Countries. Sustainability 2017, 10, 1–22. [Google Scholar]
- Chen, Y. Once a NEET always a NEET? Experiences of employment and unemployment among youth in a job training programme in Taiwan. Int. J. Soc. Welf. 2011, 20, 33–42. [Google Scholar] [CrossRef]
- ILO—International Labour Office. Global Employment Trends for Youth 2017: Paths to a Better Working Future; International Labour Office: Geneva, Switzerland, 2017. [Google Scholar]
- Ruesga, B.S.M.; Pérez Ortiz, L.; da Silva Bichara, J. Política laboral y funcionamiento del mercado de trabajo en la Unión Europea. Rev. ABET 2003, 3, 133–162. [Google Scholar]
- Quintano, C.; Mazzocchi, P.; Rocca, A. The determinants of Italian NEETs and the effects of the economic crisis. Genus 2018, 74, 5. [Google Scholar] [CrossRef] [PubMed] [Green Version]
- Standing, G. The Precariat: The New Dangerous Class; Bloomsbury Academic: London, UK; New York, NY, USA, 2011. [Google Scholar]
- Aceleanu, M.I.; Serban, A.C.; Burghelea, C. “Greening” the Youth Employment—A Chance for Sustainable Development. Sustainability 2015, 7, 2623–2643. [Google Scholar] [CrossRef] [Green Version]
- Nestic, D.; Tomic, I. Jobless Population and Employment Flows in Recession. J. Balk. Near East. Stud. 2018, 20, 273–292. [Google Scholar] [CrossRef]
- Sergi, V.; Cefalo, R.; Kazepov, Y. Young people’s disadvantages on the labour market in Italy: Reframing the NEET category. J. Mod. Ital. Stud. 2018, 23, 41–60. [Google Scholar] [CrossRef]
- Bäckman, O.; Nilsson, A. Long-term consequences of being not in employment, education or training as a young adult. Stability and change in three Swedish birth cohorts. Eur. Soc. 2016, 18, 136–157. [Google Scholar] [CrossRef]
- Manuel Robles, J.; Funes Rivas, M.; Robles, J. Civic Participation as Means of Empowerment. Preventing Social Exclusion of Youth in Precarious Life Conditions in Spain. Papers 2016, 101, 315–337. [Google Scholar]
- Jarvinen, T.; Rinne, R. The ‘losers’ in education, work and life chances—the case of Finland. Z. Pädagog. 2010, 56, 512–530. [Google Scholar]
- Torsheim, T.; Nygren, J.M.; Rasmussen, M.; Arnarsson, A.M.; Bendtsen, P.; Schnohr, C.W.; Nielsen, L.; Nyholm, M. Social inequalities in self-rated health: A comparative cross-national study among 32,560 Nordic adolescents. Scand. J. Public Health 2018, 46, 150–156. [Google Scholar] [CrossRef] [PubMed]
- Hamalainen, J.; Hämäläinen, J.; Matikainen, P. Mechanisms and Pedagogical Counterforces of Young People’s Social Exclusion: Some Remarks on the Requisites of Social Sustainability. Sustainability 2018, 10, 2166. [Google Scholar] [CrossRef]
- Ellison, M. Through the Looking Glass: Young People, Work and the Transition between Education and Employment in a post-Brexit UK. J. Soc. Policy 2017, 46, 675–698. [Google Scholar] [CrossRef] [Green Version]
- Vancea, M.; Utzet, M. School-to-work transition: The case of Spanish NEETs. J. Youth Stud. 2018, 21, 869–887. [Google Scholar] [CrossRef]
- De Souza Paulino, D.; Bendassolli, P.F. Meaning of Work and Job Searching for Young NEETS. Av. Psicol. Latinoamer. 2018, 36, 373–388. [Google Scholar]
- Zudina, A. The Pathways That Lead Youth in NEET: The Case of Russia. HSE Econ. J. 2018, 22, 197–227. [Google Scholar] [CrossRef]
- Kieselbach, T. Long-term unemployment among young people: The risk of social exclusion. Am. J. Commun. Psychol. 2003, 32, 69–76. [Google Scholar] [CrossRef]
- Gangl, M. Welfare states and the scar effects of unemployment: A comparative analysis of the United States and West Germany. Am. J. Sociol. 2004, 109, 1319–1364. [Google Scholar] [CrossRef]
- Ruesga Benito, S.M.; Sell, F.; Pérez Ortiz, L.; Pérez Trujillo, M. Desequilibrios en el mercado de trabajo e inflación durante la Gran Recesión (2007–2014) en España. Rev. Derecho Segur. Soc. 2018, 15, 271–280. [Google Scholar]
- Ruesga Benito, S.M.; Lasierra, J.M.; Pérez Ortiz, L.; Pérez Trujillo, M.; Silva Bichara, J. Economía del Trabajo y Política Laboral, 2nd ed.; Ruesga Benito, S.M., Ed.; Madrid: Pirámide, Spain, 2014. [Google Scholar]
- Picatoste, J.; Ruesga-Benito, S.M.; González-Laxe, F. Economic environment and health care coverage: Analysis of social acceptance of access restrictive policies applied in Spain in the context of economic crisis. J. Clean. Prod. 2018, 172, 3600–3608. [Google Scholar] [CrossRef]
- Novo-Corti, I.; Badea, L.; Tirca, D.M.; Aceleanu, M.I. A pilot study on education for sustainable development in the Romanian economic higher education. Int. J. Sustain. High Educ. 2018, 19, 817–838. [Google Scholar] [CrossRef]
- Wright, S. The method of path coefficients. Ann. Math. Stat. 1934, 5, 161–215. [Google Scholar] [CrossRef]
- Wright, S. Path coefficients and path regressions: Alternative or complementary concepts? Biometrics 1936, 16, 189–202. [Google Scholar] [CrossRef]
- Jöreskog, K.G. A general approach to confirmatory maximum likelihood factor analysis. ETS Res. Bull. Ser. 1967, 1967, 183–202. [Google Scholar] [CrossRef]
- Jöreskog, K.G. A general method for estimating a linear structural equation system. In Structural Equation Models in the Social Sciences; Goldberger, A.S., Duncan, O.D., Eds.; Academic Press: New York, NY, USA, 1973; pp. 85–112. [Google Scholar]
- Jöreskog, K.G.; Sörbom, D. LISREL 8: Structural Equation Modeling with the SIMPLIS Command Language; Scientific Software International: Chicago, IL, USA, 1993. [Google Scholar]
- Bentler, P.M. Multivariate analysis with latent variables: Causal modeling. Annu. Rev. Psychol. 1980, 31, 419–456. [Google Scholar] [CrossRef]
- Thornham, H.; Gómez Cruz, E. Not just a number? NEETs, data and datalogical systems. Inf. Commun. Soc. 2018, 21, 306–321. [Google Scholar] [CrossRef]
- Roberts, K. Education to work transitions: How the old middle went missing and why the new middle remains elusive. Sociol. Res. Online 2013, 18, 1–11. [Google Scholar] [CrossRef]
- Cronbach, L.J. Coefficient alpha and the internal structure of tests. Psychometrika 1951, 16, 297–334. [Google Scholar] [CrossRef] [Green Version]
- Bacon, D.R.; Sauer, P.L.; Young, M. Composite reliability in structural equations modeling. Educ. Psychol. Meas. 1995, 55, 394–406. [Google Scholar] [CrossRef]
- Fornell, C.; Larcker, D.F. Evaluating structural equation models with unobservable variables and measurement error. J. Mark. Res. 1981, 18, 39–50. [Google Scholar] [CrossRef]
- Anderson, J.C.; Gerbing, D.W. Structural equation modeling in practice: A review and recommended two-step approach. Psychol. Bull. 1988, 103, 411. [Google Scholar] [CrossRef]
- Hair, J.; Anderson, R.; Tatham, R.; Black, W.C. Análisis multivariante, 5th ed; Prentice Hall: Upper Saddle River, NJ, USA, 1999. [Google Scholar]
- Bagozzi, R.P.; Yi, Y. On the evaluation of structural equation models. J. Acad. Mark. Sci. 1988, 16, 74–94. [Google Scholar] [CrossRef]
- Browne, M.W.; Cudeck, R. Alternative ways of assessing model fit. In Testing Structural Equation Models; Bollen, K.A., Long, J.S., Eds.; SAGE: Thousand Oaks, CA, USA, 1993; pp. 136–162. [Google Scholar]
- Walther, A. ‘Disadvantaged young people’: Contradictions of a socio-political concept. Reflections from a comparative European perspective. Soziale Welt-Zeitschrift fur Sozialwissenschaftliche Forschung und Praxis 2002, 53, 87. [Google Scholar]
- Varela-Candamio, L.; Novo-Corti, I.; García-Álvarez, M.T. The importance of environmental education in the determinants of green behavior: A meta-analysis approach. J. Clean Prod. 2018, 170, 1565–1578. [Google Scholar] [CrossRef]
Figure 1.
NEETs in the European Union. Own elaboration from Statistical Office of the European Communities (EUROSTAT) data [yth_empl_160].
Figure 1.
NEETs in the European Union. Own elaboration from Statistical Office of the European Communities (EUROSTAT) data [yth_empl_160].

Figure 2.
Youth unemployment in the European Union. Own elaboration from EUROSTAT data [yth_empl_140].
Figure 2.
Youth unemployment in the European Union. Own elaboration from EUROSTAT data [yth_empl_140].

Figure 3.
People at risk of exclusion. Own elaboration from data of EUROSTAT [ilc_peps01].

Figure 4.
The risk of poverty and social exclusion in the European Union in 2016. [ilc_peps01].

Figure 5.
NEETs in the European Union. Own elaboration from EUROSTAT data [yth_empl_160].

Figure 6.
Young people neither in employment nor in education and training in the European Union in 2016. Source: Own elaboration from EUROSTAT data [ilc_peps01].
Figure 6.
Young people neither in employment nor in education and training in the European Union in 2016. Source: Own elaboration from EUROSTAT data [ilc_peps01].

Figure 7.
The variables in the model.


Table 1.
% of NEETs in countries of the EU.
| GEO/TIME | 2008 | 2009 | 2010 | 2011 | 2012 | 2013 | 2014 | 2015 | 2016 | 2017 |
|---|---|---|---|---|---|---|---|---|---|---|
| Belgium | 12 | 12.8 | 13 | 13.8 | 14.4 | 14.9 | 14.1 | 14.4 | 13 | 12.6 |
| Bulgaria | 18.5 | 20.8 | 23.5 | 24.7 | 24.7 | 25.7 | 24 | 22.2 | 22.4 | 18.9 |
| Czechia | 10.7 | 12.7 | 12.9 | 12.1 | 12.9 | 12.8 | 12.1 | 11.8 | 11.1 | 10 |
| Denmark | 5 | 6.5 | 7.3 | 7.6 | 8.2 | 7.5 | 7.3 | 7.7 | 7.4 | 9.1 |
| Germany | 11 | 11.4 | 10.8 | 9.7 | 9.3 | 8.7 | 8.7 | 8.5 | 8.9 | 8.5 |
| Estonia | 11.4 | 18.3 | 18.1 | 14.7 | 15.1 | 14.3 | 13.8 | 12.5 | 13.8 | 11 |
| Ireland | 15.5 | 20.2 | 21.7 | 22.4 | 21.6 | 18.8 | 18 | 16.7 | 14.7 | 12.9 |
| Greece | 14.8 | 15.9 | 18.6 | 23 | 26.8 | 28.5 | 26.7 | 24.1 | 22.2 | 21.3 |
| Spain | 15.3 | 19.9 | 20 | 20.6 | 22.2 | 22.5 | 20.7 | 19.4 | 18.1 | 16.4 |
| France | 12.6 | 14.7 | 14.8 | 14.7 | 15.1 | 13.8 | 14.1 | 14.7 | 14.4 | 13.9 |
| Croatia | 13 | 14.9 | 17.6 | 19.1 | 19.7 | 22.3 | 21.8 | 19.9 | 19.5 | 17.9 |
| Italy | 19.3 | 20.5 | 22 | 22.5 | 23.8 | 26 | 26.2 | 25.7 | 24.3 | 24.1 |
| Cyprus | 10.9 | 11.5 | 12.9 | 14.8 | 17.3 | 20.4 | 19.5 | 18.5 | 18 | 17.6 |
| Latvia | 13.6 | 20.8 | 20.7 | 19.1 | 17.2 | 15.6 | 15.2 | 13.8 | 13.3 | 12.3 |
| Lithuania | 11.9 | 15 | 17 | 14.7 | 13.9 | 13.7 | 12.9 | 11.8 | 10.7 | 10.2 |
| Luxembourg | 9.2 | 7.5 | 6.1 | 6.6 | 7.6 | 7.2 | 6.5 | 7.6 | 6.8 | 6.6 |
| Hungary | 15.9 | 17.9 | 17.7 | 17.6 | 18.7 | 18.4 | 16.4 | 15.1 | 14.1 | 13.3 |
| Malta | 11.4 | 12.6 | 12.2 | 12.1 | 12 | 10.9 | 11.6 | 11.8 | 9.4 | 8.8 |
| Netherlands | 4.6 | 5.3 | 5.7 | 5.9 | 6.5 | 7.5 | 7.6 | 6.7 | 6.3 | 5.9 |
| Austria | 8.9 | 9.6 | 9.1 | 8.5 | 8.2 | 8.6 | 9.3 | 8.7 | 8.9 | 8.4 |
| Poland | 12.7 | 14 | 14.8 | 15.2 | 15.7 | 16.2 | 15.5 | 14.6 | 13.8 | 12.9 |
| Portugal | 11.9 | 12.5 | 13.6 | 13.9 | 15.6 | 16.4 | 14.6 | 13.2 | 12.8 | 10.6 |
| Romania | 13.2 | 15.7 | 18.9 | 19.5 | 19.3 | 19.6 | 19.9 | 20.9 | 20.2 | 17.8 |
| Slovenia | 7.5 | 9.3 | 9.4 | 9.4 | 11.8 | 12.9 | 12.9 | 12.3 | 10.9 | 9.3 |
| Slovakia | 15.3 | 17.3 | 19 | 18.7 | 18.8 | 19 | 18.2 | 17.2 | 15.9 | 16 |
| Finland | 8.9 | 11.3 | 10.5 | 10 | 10.4 | 10.9 | 11.8 | 12.4 | 11.7 | 10.9 |
| Sweden | 8 | 9.9 | 8.3 | 7.9 | 8.4 | 7.9 | 7.8 | 7.4 | 7.1 | 6.8 |
| United Kingdom | 13.1 | 14.4 | 14.6 | 15.4 | 15.3 | 14.6 | 13.4 | 12.7 | 12.3 | 11.4 |
Note: Highlighted are those countries belonging to the Euro area; Source: EUROSTAT-Young people neither in employment nor in education and training by sex, age, and labour status (NEET rates) [edat_lfse_20].
Table 2.
Main hypothesis.
| Hypotheses |
|---|
| H1: Economic environment influences NEETs incidence in the European Union |
| H2: Poverty and social exclusion influences NEETs incidence in the European Union |
Hypotheses to be tested in this work.
Table 3.
Latent variables and indicators.
| Latent Variable | Indicator | Content |
|---|---|---|
| Economic Environment | Subsidies | Subsidies. Current prices, million euro. Data from EUROSTAT: GDP and main components (output, expenditure, and income) [nama_10_gdp]. |
| Gross Domestic Product (GDP) | Gross domestic product at market prices. Current prices, million euro. Data from EUROSTAT: GDP and main components (output, expenditure, and income) [nama_10_gdp]. | |
| Final Consumption | Final consumption expenditure at current prices, million euro. Data from EUROSTAT: GDP and main components (output, expenditure, and income) [nama_10_gdp] | |
| Poverty and Social Exclusion | Risk of Poverty and Social Exclusion of people from 15 to 19 years | % of people at risk of poverty or social exclusion (from 15 to 19 years). Data from EUROSTAT: People at risk of poverty or social exclusion by age and sex [ilc_peps01] |
| Risk of Poverty and Social Exclusion of people from 20 to 24 years | % of people at risk of poverty or social exclusion (from 20 to 24 years). Data from EUROSTAT: People at risk of poverty or social exclusion by age and sex [ilc_peps01] | |
| Risk of Poverty and Social Exclusion of people from 25 to 29 years | % of people at risk of poverty or social exclusion (from 25 to 29 years). Data from EUROSTAT: People at risk of poverty or social exclusion by age and sex [ilc_peps01] | |
| NEETs | NEETs from 15 to 19 years | % of people at risk of poverty or social exclusion. Not employed persons. Neither formal nor non-formal education nor training. All ISCED 2011 levels (from 15 to 19 years). Data from EUROSTAT: Young people neither in employment nor in education and training by sex, age, and educational attainment level (NEET rates) [yth_empl_160] |
| NEETs from 20 to 24 years | % of people at risk of poverty or social exclusion. Not employed persons. Neither formal nor non-formal education nor training. All ISCED 2011 levels (from 20 to 24 years). Data from EUROSTAT: Young people neither in employment nor in education and training by sex, age, and educational attainment level (NEET rates) [yth_empl_160] | |
| NEETs from 25 to 29 years | % of people at risk of poverty or social exclusion. Not employed persons. Neither formal nor non-formal education nor training. All ISCED 2011 levels (from 25 to 29 years). Data from EUROSTAT: Young people neither in employment nor in education and training by sex, age, and educational attainment level (NEET rates) [yth_empl_160] |
Latent variables and indicators are the observable values related to the constructs.
Table 4.
Results for the measurement model.
| Latent Variable | Observable Variable | Squared Multiple Correlations (λ2) | Alpha Cronbach |
|---|---|---|---|
| Economic Environment ( | Subsidies ( | 0.694 | 0.750 |
| Gross Domestic Product (GDP) | 0.998 | ||
| Final Consumption . | 0.995 | ||
| Poverty and Social Exclusion | Risk of Poverty and Social Exclusion of people from 15 to 19 years . | 0.790 | 0.795 |
| Risk of Poverty and Social Exclusion of people from 20 to 24 years | 0.324 | ||
| Risk of Poverty and Social Exclusion of people from 25 to 29 years | 0.340 | ||
| NEETs | NEETs from 15 to 19 years | 0.515 | 0.881 |
| NEETs from 20 to 24 years | 0.932 | ||
| NEETs from 25 to 29 years . | 0.876 |
Main indicators for testing the accuracy of the measurement model.
Table 5.
Results for the structural model.
| Dependent Variable | Independent Variable | Standardized Estimator | S.E. | C.R. | P | R2 (Fitted) |
|---|---|---|---|---|---|---|
| NEETs | Economic Environment | 0.104 | 1.711 | 0.728 | 0.466 | 0.657 |
| Poverty and Social Exclusion ) | 0.816 | 0.234 | 3.181 | 0.001 |
© 2018 by the authors. Licensee MDPI, Basel, Switzerland. This article is an open access article distributed under the terms and conditions of the Creative Commons Attribution (CC BY) license (http://creativecommons.org/licenses/by/4.0/).
Share and Cite
MDPI and ACS Style
Ruesga-Benito, S.M.; González-Laxe, F.; Picatoste, X. Sustainable Development, Poverty, and Risk of Exclusion for Young People in the European Union: The Case of NEETs. Sustainability 2018, 10, 4708. https://doi.org/10.3390/su10124708
AMA Style
Ruesga-Benito SM, González-Laxe F, Picatoste X. Sustainable Development, Poverty, and Risk of Exclusion for Young People in the European Union: The Case of NEETs. Sustainability. 2018; 10(12):4708. https://doi.org/10.3390/su10124708
Chicago/Turabian StyleRuesga-Benito, Santos Miguel, Fernando González-Laxe, and Xose Picatoste. 2018. "Sustainable Development, Poverty, and Risk of Exclusion for Young People in the European Union: The Case of NEETs" Sustainability 10, no. 12: 4708. https://doi.org/10.3390/su10124708
Note that from the first issue of 2016, this journal uses article numbers instead of page numbers. See further details here.