Land Spatial Development Based on Carrying Capacity, Land Development Potential, and Efficiency of Urban Agglomerations in China


Key Laboratory of Regional Sustainable Development Modeling, Institute of Geographic Sciences and Natural Resources Research, Chinese Academy of Sciences, Beijing 100101, China
Sustainability 2018, 10(12), 4701; https://doi.org/10.3390/su10124701
Submission received: 15 November 2018
/
Revised: 5 December 2018
/
Accepted: 6 December 2018
/
Published: 10 December 2018
(This article belongs to the Special Issue Urban Land Use Form in China)
Abstract
:The Chinese government is undergoing a major reform. The current core task of new Ministry of Natural Resources (MNR) is to establish a national territorial spatial planning system (NTSPS). Urban agglomeration has become a main body in NTSPS. China’s new urbanization strategy identified 19 key development areas of urban agglomerations (UA), but the land development path is not clear. Due to the lack of research on the land development intensity evaluation (LDIE) of urban agglomerations, this study applied a GIS-based, multi-criteria method for LDIE to the Shandong Peninsular urban agglomeration (SPUA). Evaluation indices were determined for three factors (development intensity, supporting capacity, and utilization efficiency) that comprise the discriminant model of the three-dimensional matrix method, which was used to establish the method for this topic and demonstrate the accuracy of the land spatial development intensity. This empirical study on the SPUA indicated that, overall, the average indices for development intensity, supporting capacity, and utilization efficiency in the study area are 0.40, 0.34, and 0.55, respectively. Using the three-dimensional matrix discrimination model, three zones of development intensity were identified: key, stable, and restricted development zones. The threshold values for construction land growth in the eight cities of the SPUA were obtained. The findings provide a theoretical reference and guide for the practical application of LDIE as well as a scientific basis for sustainable land development and utilization.
1. Introduction
As more and more rural people choose to enter the city, many cities around the world are expanding rapidly. 2018 Revision of World Urbanization Prospects of United Nations [1] shows that the urban area has gathered more than half of the world’s population and is also the core area for future population growth. It is estimated that by 2050, about 70% of the world’s population will live in cities. Since the reform and opening up, China’s urbanization process has been accelerating, and the urbanization rate has increased from 17.90% in 1978 to 58.52% in 2017 [2]. The urban agglomeration is the product of the industrialization and urbanization transformation to the advanced stage [3]. Since the beginning of the 21st century, the UA has become a new regional unit for countries around the world to participate in global competition and international division of labor, and also the main body of China’s new urbanization process. China’s rapid urbanization and industrialization have led to severe pressures on resources and ecological environment, resulting in urban agglomeration diseases such as environmental pollution, traffic congestion, and degraded energy shortages in ecosystems. In order to completely resolve the contradiction between economic construction and ecological, social, and cultural construction, the central government decided to implement party and state institutional reforms, and merge, classify, and reorganize the Party Central Committee and the State Council departments with similar responsibilities to improve the efficiency of functional allocation. The main function of the newly established MNR is to uniformly exercise the duties of all-natural resource asset owners on behalf of the state and to uniformly exercise all land space use control and ecological protection and restoration duties. The current core task of MNR is to establish a national territorial spatial planning system (NTSPS), and to focus on promoting spatial governance and spatial structure optimization in urban agglomerations by judging the quality and potential of land space development. However, how to scientifically determine the intensity and potential of land spatial development is related to the quality and implementation effect of NTSPS. It is a major scientific problem that needs to be solved.
As early as 2006, the Chinese government proposed urban agglomerations as a key strategy to promote urbanization, in line with China’s attempts to enhance resource carrying capacity and environmental preservation. After 10 years of rapid development, urban agglomerations have become the main body of ‘new urbanization’ (people-oriented urbanization) in China [4]. To further optimize growth and urbanization, the 13th Five-Year Plan, released in March 2016, clearly highlighted the need for the reasonable and strategic distribution of cities to achieve harmonious development.
China plans to build 19 urban agglomerations, including 5 national-level urban agglomerations (Yangtze river delta UA, Pearl River Delta UA, Beijing–Tianjin–Hebei UA, the middle reaches of the Yangtze River UA, Chengdu-Chongqing UA), 8 regional-level urban agglomerations (Shandong Peninsula UA, Harbin-Changchun UA, Mid-southern Liaoning UA, West Taiwan Strait UA, Guanzhong UA, the Central Henan UA, Beibu Gulf UA), and 6 local-level urban agglomerations (Hubao Eyu UA, Jinzhong UA, Along the Yellow River in Ningxia UA, Lanzhou-Xining UA, Central Yunnan UA and Central Guizhou UA). Meanwhile, 19 urban agglomerations were created to support urbanization, and the development and construction of urban agglomerations have become one of the most significant strategies for national development. The national-level urban agglomerations have matured and limited space for improvement. SPUA is the fourth largest urban agglomeration in coastal area of China and located on the banks of the Yellow Sea and the Bohai Sea [5]. As the primary area of regional economic development in China, SPUA was listed as the frontier of open competition in the report of the 19th National Congress. SPUA is still in its early stages of development. Despite the strong development momentum in Qingdao, Jinan, and other node cities, there are widespread phenomena such as disordered and inefficient land use, unbalanced potential of development, and pollution of ecological environment. As the link between the Yangtze River Delta urban agglomeration and the Beijing–Tianjin–Hebei urban agglomeration, the development of SPUA is related to the overall rise of the entire eastern coastal region of China. It is imperative to establish a scientific and healthy development path to ensure the coordinated development of the urban agglomeration. At the same time, it could provide experience for the healthy development of other UAs in China.
Since the reform and opening up in 1978, urbanization and industrialization in China have sped up, and the development and utilization patterns of the nation’s lands have experienced great changes. These changes are mainly embodied by the strengthening of land development intensity (LDI) [6,7,8], the rapid expansion of construction land, and the continuous decrease in natural eco-spaces [9,10,11,12,13]. The strengthening of LDI has led to conflicts between economic and social development and environmental protection, resulting in severe challenges for sustainable development [14]. In recent years, as global environmental problems have intensified, countries around the world have made a target of green, healthy, and sustainable development to adjust their development models. China has also introduced a new urbanization development strategy, and the core idea behind the strategy is the green, healthy, and sustainable development of the nation’s land resources. The path for development has thus become a hot topic, and how to scientifically regulate and control the LDI has become the essential problem for realizing the development goals [15].
The land development intensity evaluation (LDIE) is conducive to optimizing land development and utilization. This complicated and systematic method has attracted attention from many scholars. Existing research is mainly focused on the current development scale, the identification of factors driving development [16], temporal-spatial differentiation and patterns of urban land expansion [17,18,19,20], the productivity and efficiency of construction land use [21,22], and the evaluation of development potential [23]. Three above conditions (i.e., scale, efficiency, and potential) should be simultaneously taken into consideration to achieve the goal of sustainable development. Development scale is described as the extent to which urban agglomeration land space is exploited, which means the mass of land development. Utilization efficiency reflects the efficiency of the developed urban agglomeration space, and potential reflects the area that could be further used for construction purposes. Although these three elements should be regarded as a unified whole, little research has considered all three elements. In a study on space exploitation and the division of a drainage basin, Wang (2012) established a three-dimensional distinguishing matrix model deals with the relationship of the spatial development constraint indexes, space development intensity indexes, and space development guidance indexes [24]. This method gives us a good idea, and we attempt to extend its research from the basin to the urban agglomeration in this paper.
The evaluation of technology and methodology is the core of research in this area. In 1969, the American landscape architect McHarg proposed an evaluation method for the ecological suitability of land use from the perspective of superposition [25]. This evaluation method has become the basis for initial studies on modern land use and development intensity. In the past 40 years, LDIE has gradually become a significant method in urban and regional planning along with ecological and environmental planning. The main methods used can be categorized into two types [26,27,28]: (1) the element superposition method, which is rooted in the hand-drawn overlay techniques created by McHarg, Steinitz, and others [29]; and (2) the multi-criteria evaluation method based on GIS (MCE-GIS), which is applied in this study [30,31,32]. MCE-GIS includes methods such as interval multi-objective linear programming model [17], technique for order preference by similarity to an ideal solution (TOPSIS) [33], concordance analysis [34], analytic hierarchy process [35], fuzzy evaluation method [36], and a new identification method of priority landscapes and spatial conflicts with new investment area [37]. The second method is artificial intelligence, for which the main applications include fuzzy mathematics methods [38,39,40], artificial neural networks [41], matter-element models [42], cellular automata [43], and genetic algorithms [44]. In addition to the two types of methods mentioned above, an ecological niche-based method for assessing the suitability of land [45] along with a comprehensive evaluation of land based on public participation [46] (Shearera & Xiang, 2003) have appeared in recent years. Although the assignment of weights to index elements involves uncertainty [26], weighting methods are still the most widely used within LDIE research due to their simplicity and compatibility with GIS [47]. Landscape capacity assessment method become more and more popular in land spatial planning intensity. The base for assessing the possibility of new investment areas is an evaluation of landscape features which influence on possibility to hide new building area in landscape. This method is useful for planning development of suburban areas, especially those parts with high-value landscape [48]. However, based on the relationships among mass, efficiency, and potential, regulating and controlling the path and object of LDIE is regarded as a three-dimensional supporting relationship, it cannot be simply expressed by a weighted stack. So, we learn from the three-dimensional distinguishing matrix model to deal with the relationship of scale, efficiency, and potential in LDIE.
Although LDIE has been frequently used in research and in practice, it has rarely been applied to urban agglomerations. The application of LDIE to urban agglomerations has important theoretical significance related to China’s new urbanization development strategy, the sustainable development of urban agglomerations, and the development and utilization patterns of land in China. Using existing research findings, this study applied LDIE and MCE-GIS to study SPUA and obtain the zoning categories of land spatial development intensity. The purpose of this study was to provide a new method for LDIE in China’s urban agglomerations and provide a basis for decision making regarding land spatial development.
2. Materials and Methods
2.1. Study Area and Data Sources
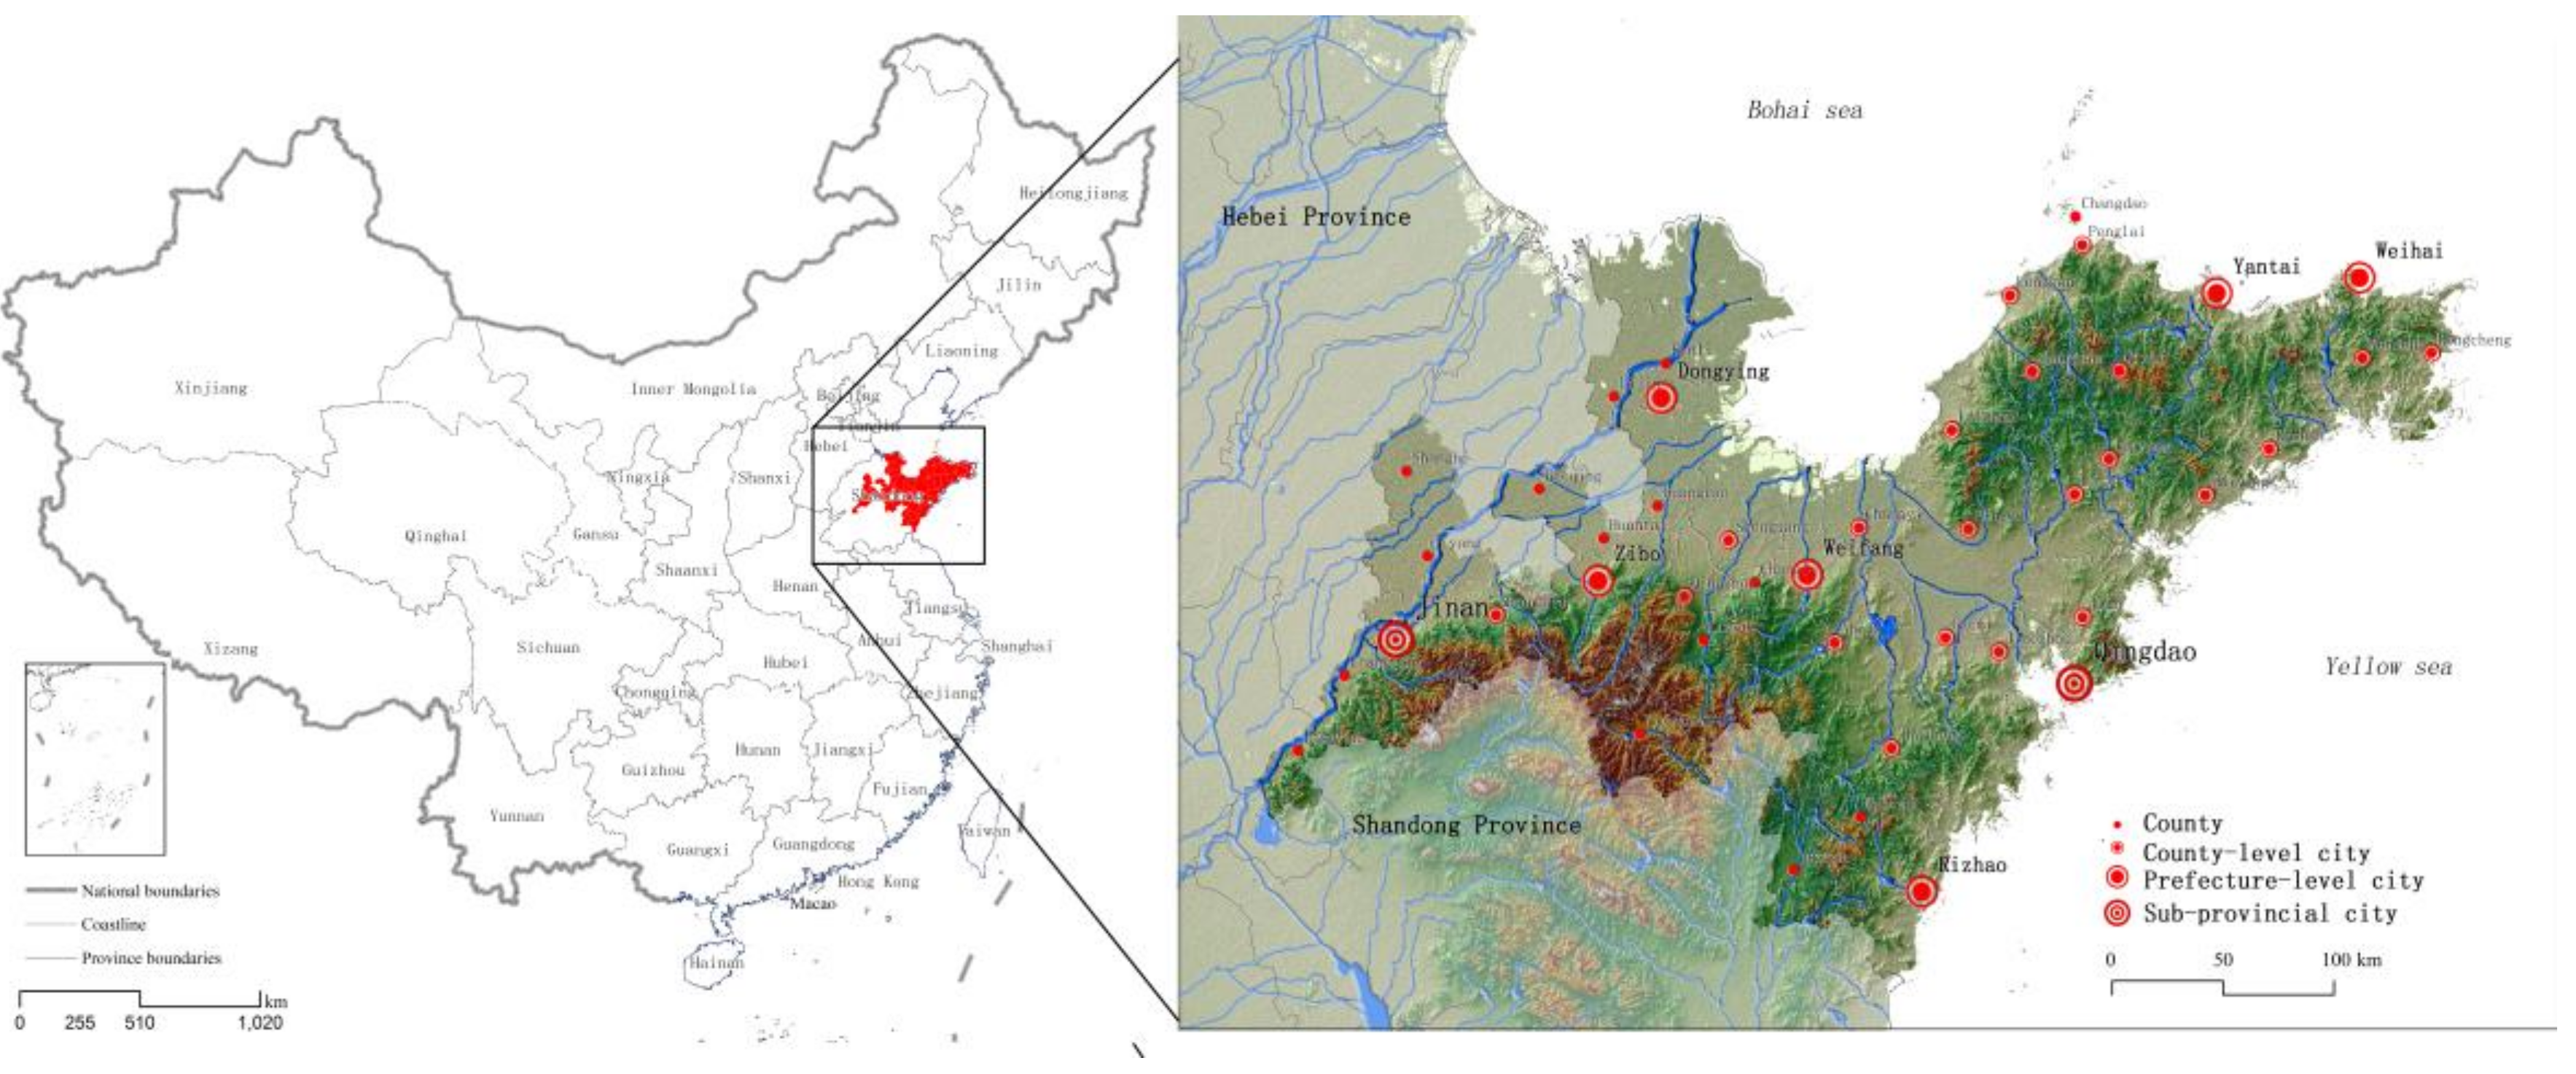
SPUA is located in the coastal area of eastern China, which contains eight cities (Jinan, Qingdao, Yantai, Zibo, Weihai, Weifang, Dongying, and Rizhao; Figure 1). The eastern and southern part of SPUA is a hilly landform, and the Yellow River delta plain in the middle. The rivers are densely, and the Yellow River, the second largest river in China, passes through the region and flows into the Bohai Sea from southwest to northeast. SPUA close to the Bohai and Huanghai seas, and has an area of 7.47 × 10⁴ km2. To the south of the peninsula is the Yangtze River Delta UA, and to the north are the Beijing–Tianjin–Hebei UA and Liaodong Peninsula UA. The Korean Peninsula and Japan lie to the east of SPUA. As China’s frontier area involved in regional cooperation in Northeast Asia, the SPUA has a relatively high level of economic development based on industrial development. In 2017, the study area had a total population of 41 million. Meanwhile, according to the spatial distribution of economic activity, the research area has formed three centers of economic growth: Qingdao, Jinan-Zibo, and Yantai. SPUA is the important urban agglomerations in National 13th Five-Year Plan. Thus, strong emphasis should be placed on its optimization and improvement. Faced with typical problems related to LDIE, including relatively high intensity and low efficiency, the SPUA is a representative study area for urban agglomerations in China.
The research data include physical geography data and socioeconomic data. The data sources show in Table 1. The data were standardized using the range-standardized method, and the weights were determined using the Delphi method in the ArcGIS 10.2 platform. The Delphi method is a structured communication technique, originally developed as a systematic, interactive forecasting method which relies on a panel of experts [49]. Delphi is based on the principle that forecasts (or decisions) from a structured group of individuals are more accurate than those from unstructured groups. The protected lands and landscapes of SPUA include the nature conservation area and the basic farmland area, which were shown in the map of Main Functional Area Planning of Shandong Province. When evaluating the natural potential for land development, the influence of elevation could be ignored because the majority of the SPUA is occupied by plains.
2.2. Methods
In February 2017, the State Council issued the “National Land Planning Outline (2016–2030)”, stating that many serious problems exist in the process of urbanization, including inconsistence between economy; population and resource distributions; structural contradictions in urban, agricultural, and ecological spaces; mismatch between land development intensities and resource and environmental carrying capacity; and low-quality urbanization. The planning requires significant improvement of land development quality and efficiency. By 2030, the land development rate should not exceed 4.62%. Thus, in this study, the index system for assessing the quality of land development is constructed, taking into account the requirements of the national land planning outline. Only when the comprehensive model of urban agglomeration LDIE is scientific, complete, and systematic can it accurately determine the zoning of land development and utilization, which could establish a foundation to decide upon a pattern of land utilization and development (Figure 2).
2.2.1. Evaluation System for Land Development Intensity in the SPUA
This study built a concrete measurement index based on the evaluation extent index, development supporting ability index, and development and utilization efficiency index of land in the SPUA. A four-grade (target, standard, criterion, and index layers) evaluation system was thus developed (Table 2).
2.2.2. Method for Evaluating the Land Development Extent in the SPUA
The LDI of land space could be comprehensively evaluated based on the percentage of construction land area in each administrative unit out of the total area of the units (%) and the average rate of increase in the percentage of construction land. Construction land consists of cities and towns, independent mines, rural residential area, transportation land, water conservation facilities (excluding reservoirs), and other construction space. The formula for LDI is
LDI reflects the land development extent, where x1 is the proportion of construction land out of the total administrative area with weight w1, and x2 is the annual rate of increase in the proportion of construction land with weight w2. The weight is scored by a number of experts.
2.2.3. Method for Evaluating Land Use Efficiency in the SPUA
Land use efficiency (LUE) was determined based on the strength and output of construction land bearing strength, which represents the amount of development and utilization activities, directly determines the efficiency of urban development and is usually expressed by a single or composite index (e.g., population and economic input). In this study, we selected the permanent resident population and fixed investment in construction land per km2 to illustrate bearing strength and the GDP of construction land per unit (100 million) to show the output efficiency of land development. These two elements comprehensively represent the urban development and utilization efficiency. The formula for LUE is
LUE reflects the land use efficiency, where is the standardized index of permanent resident population density for construction land with weight ; is the standardized index of fixed-investment density for construction land with weight ; is the standardized index of GDP for construction land; W12 is the weight of the bearing strength index; and W3 is the weight of the output efficiency index. The weight is scored by a number of experts.
2.2.4. Method for Evaluating Land Development Supporting Ability in the SPUA
Land development support (LDS) is the basis for the development of land in urban agglomerations and includes natural potential, locational condition, and economic development. A greater supporting ability of land development corresponds to a larger bearing development intensity and persistence.
Natural potential comprehensively evaluates the effects that restrictive factors such as geologic disasters; slope, water, and soil losses; and the preservation of water resources and basic farmland have on the development and construction of lands. The spatial scale of lands adopted in this study was determined by the negative planning concept as
where x is the suitability value of the spatial index, which represents the natural potential, and NP is the natural potential index. The lower the grade of the evaluation unit, the less appropriate it is for development and construction, and thus the smaller the natural potential. To maximize ecological benefit, the natural potential grade in the formula is calculated by the minimum-value method in GIS layers.
Five constraint forces (geologic disasters; slope, water, and soil losses; and the preservation of water resources and basic farmland) were graded according to their significance in land development. The index weights were set by the Delphi method as follows: unrestricted area, −1; low restricted area, −3; medium restricted area, −5; relatively high restricted area, −7; and restricted area, −9. These weights further confirm the restricted areas (Ar) in spatial development, including those areas restricted by geologic conditions (Agr), slope and topographic conditions (Asr), water resources (Awr), water and soil loss (Apr), and basic farmland (Acr)
In Equation (4), Agr includes disaster areas related to geologic processes such as avalanches, landslides, debris flows, surface collapses, ground fractures, and surface subsidence. Based on the Geological Disaster Prevention and Control Program, the urban agglomeration in this study is divided into four areas, the key prevention area, second key prevention area, medium prevention area, and non-disaster area, with respective weights of 9, 5, 1, and 0. Asr belongs to the slope-restricted area. According to the urban land site engineering specification (CJJ8-99), the maximum slope should be no more than 25°. Thus, areas with slopes exceeding 25° are defined as non-construction areas and are weighted with 9, while areas with slopes less than 25° defined as construction areas and weighted with 0. Awr is the water resources-restricted area. Based on the zoning of groundwater overexploitation (2006.12) as well as the extent of environmental deterioration of the overdraft division of shallow underground, Awr is categorized into three types, severe overdraft area, medium overdraft area, and dynamic monitoring area, with respective weights of 9, 5, and 3. Apr is the area restricted by water and soil loss. In accordance with the map of the key prevention area of water and soil loss in Shandong Province and the classification and gradation standards for soil erosion in China, the SPUA is divided into the extreme loss area, strong loss area, moderate loss area, slight loss area, and tiny loss area, with respective weights of 9, 7, 5, 3, and 1. Acr is the basic farmland preservation area and has a weight of 9 due to a policy that prohibits its exploitation.
Using the overlay analysis of GIS, this study overlayed the above types of layers based on the maximum method. Finally, Ar is divided into five types of restricted areas: Ar1, Ar3, Ar5, Ar7, and Ar9.
Construction potential varies from restricted area to area. A non-restricted area is suitable for construction, while no construction is allowed in a restricted area. After engineering and prevention measures in low-, moderate-, and high-restricted areas and non-restricted areas, these areas are multi-functional. For example, a low-restricted area could be developed with public facilities, a moderate-restricted area could be used as residential land, and a high-restricted area could be regarded as an ecological landscape. Therefore, a correlational study (Wang et al., 2015) set the utilization potential indices k for different types of areas. Ac, which represents land potential, is obtained by summing all land types as
where Ac is the potential of construction land, Ae is the current construction land area, and k are the potential indices of land utilization for different types of restricted areas (k1 = 1, k3 = 0.8, k5 = 0.6, k7 = 0.4 and k9 = 0), which means that land in non-restricted areas can be fully used. The utilization rates of available lands are 0.8 in low-restricted areas, 0.6 in moderate-restricted areas, 0.4 in high-restricted areas, and 0 in restricted areas.
The location condition is based on two factors, the distance to the city center and road density, and is given by summing the linear weights of these two factors. The urban development index (UD) is represented by GDP per capita. Hence, the development and supporting ability LDS is calculated as
where W1 is the weight of the natural potential index, W2 is the weight of the location condition index, and W4 is the weight of the UD. The weight of the indexes come from the Delphi method.
2.2.5. Zoning Method of Healthy Development in the SPUA
The three-dimensional discrimination method is widely applied in land development research. In this study, development and supporting ability was plotted on the x-axis, utilization efficiency was plotted on the y-axis, and development intensity was plotted on the z-axis. This results in a three-dimensional coordinate system for the evaluation of LDI. Three points at the same distance from the origin are selected to represent the levels of the three dimensions (high, moderate, and low). Vertical lines are created from these points to the three axes, forming a 3 × 3 × 3 isometric chart and 27 matrix units, among which each unit (x, y, z) stands for the combination of development intensity, guidance, and constraint (Figure 3).
According to the natural potential law in land development, when x = 1, the development and supporting ability is relatively low; thus, development is prohibited in this area. In other words, such an area is defined as a non-development area. When x = y = z = 5, the area is optimum for development and is called a priority development area. L is regarded as the development suitability degree and is given by
where L is the development suitability degree index, x is the land development supporting capacity index, y is the land use efficiency index, and z is the land development.
Geometric manipulation gives the Euclidean distance between the area A(x, y, z) and the optimum development area (3, 3, 3). The purpose illustrates the extent to which the area is suitable for development. Calculating the L values of all areas while temporarily ignoring vector direction, ordering the values, and dividing them into three groups, we divided the study area into three types of areas (key, stable, and restricted development area) according to the development intensity and propose a concrete project (Table 3). The natural potential and environmental carrying capacity are the basic conditions for land development in an urban agglomeration. For this reason, in this paper, we define the areas with low development and supporting abilities as restricted development areas.
3. Results
3.1. Land Development Extent
In 2014, the area of urban construction land in the SPUA was approximately 14,255.08 km2, accounting for 19.08% of the urban agglomeration. From 2001 to 2017, the annual average rate of increase in the area of construction land was 3.41%. The current development extent index B1 is obtained by weighting and combining the proportion index and the annual average rate of increase in construction land area. In 2017, B1 of the study area was 0.4. From the perspective of space, the area along the Jiaoji Railway connecting Jinan and Qingdao as well as downtown Weifang showed the highest levels of development, followed by the Jiaozhou and Qingdao downtown areas. However, the extents of development in the south-central and northern coastal areas were relatively low.
3.2. Land Use Efficiency
The land use efficiency (LUE) index is obtained by weighting and combining the bearing strength index and output efficiency index. In 2017, the average LUE index was 0.55. From the perspective of location, the development and supporting abilities were relatively high in the southern and eastern parts of the study area, which is primarily attributed to the high LUE indices of the Qingdao-Rizhao coastal area, Jinan-Zibo connecting area, and Yantai-Weihai coastal area. The downtown areas of Qingdao, Jinan, and Zibo along the Jiaoji Railway had the highest LUE indices (>0.9). Meanwhile, the LUE index of downtown Dongying in the northern coastal part of the study area did not exceed 0.21.
3.3. Land Development Supporting Ability
The land development and supporting ability index (B2) of the SPUA is obtained by weighting and combining the natural potential index, locational conditions index, and UD of national land development. In 2017, the average B2 of national land was 0.34. In terms of location, the northern and eastern parts of the study area had relatively high values of B2, with that of Kenli County in the Yellow River Delta being the highest (0.60) followed by the downtown areas of Qingdao and Dongying (0.59 and 0.56, respectively). The indices of the south-central and west-central parts were relatively low, with that of downtown Weifang being the lowest (0.11). The B2 values of Changle, Juxian, and Shanghe counties were no more than 0.2.
3.4. Zoning Based on LDIE
According to the development extent index, development and supporting ability index, and development and utilization efficiency index, this study also used a three-dimensional matrix model (Figure 3) and matrix table (Table 3) of LDIE to evaluate zoning in the SPUA. The land of Shandong Peninsula was partitioned into three types of areas: key development areas, stable development areas, and restricted development areas (Table 4 and Figure 4).
Based on the partitions, we compared the indices of development extent, development efficiency, and supporting ability of SPUA with those of other urban agglomerations. The maximum and minimum values were used to measure the threshold values of land development intensity for areas with different functions in the study area; thus, the results can be used to develop a regulation and control scheme.
In 2017, the average proportion of Shandong Province’s administrative district occupied by construction land was approximately 19%. The maximum current development extent is 25%. Thus, the national space is classified according to the range of 19–25%. Taking the increase speed of different types area and proportion of construction land into consideration, the higher the proportion of construction land, the lower the average annual rate of increase (AARI) construction land in future. The AARI in the proportion of construction land in the SPUA was 3.4% from 2000 to 2017, while the supply increase rate of construction land in China from 2006 to 2017 was 4.30%. Since 2000, the AARI in construction land in the Pearl River Delta was 7.57%, while those for the Yangtze River Delta and Beijing–Tianjin–Hebei region were 6.25% and 5.82%, respectively. The maximum AARI in construction land in the SPUA could be based on the average value of 6.54%, ranking it second out of the three urban agglomerations in China. Therefore, the threshold values for the rate of increase in construction land in the study area were defined as 3.40% (key development area), 4.30% (stable development area), and 6.54% (restricted development area) (Table 5).
Based on the threshold values given in Table 5, the area types of the eight prefecture-level cities in the SPUA are provided in Table 6. These values provide a scientific basis for accurately regulating and controlling the development intensity. Taking Jinan City as an example, the key development area with construction land is no more than 19% of the total area. Meanwhile, as can be seen in Table 6, if the annual average rate of increase is less than 6.54%, the future increase in the area of construction land will be no more than 57.06 km2.
4. Conclusions and Discussion
As stated by Stieglitz, urbanization in China and the development of new technology in the United States will be the two engines driving human development in the 21st century [50]. For more than 30 years, urbanization in China has promoted the rapid development of the economy and society in China. Five major UAs (the Yangtze River Delta, Pearl River Delta, Beijing–Tianjin–Hebei, Chengdu-Chongqing, and Middle Reach of the Yangtze River UA) account for 9.06% of China’s area, 45% of the urban population, 50% of its GDP, 60% of fixed-asset investment, and 65% of the foreign direct investment in China. Therefore, urban agglomerations represent the core of China’s strategy for economic development. Meanwhile, China must deal with the pressures of a growing population, strain on resources, and environmental degradation, which are also faced by other developing counties. It is possible to formulate a scientific plan for the sustainable development of urban agglomerations if the environmental carrying capacity, the status quo, and the future development potential of urban agglomeration areas are considered. At the beginning of 2017, the State Council issued the “Several Opinions on Delineating and Strictly Protecting the Red Line of Ecological Protection” to upgrade ecological security to the institutional and legal levels. One of the key tasks of the newly MNR is to improve the quality of land use in urban agglomerations, that is, to optimize the land use structure and improve land use efficiency of urban agglomerations without reducing ecological security land.
The traditional LDIE technique methods [10,51] with MCE-GIS pay more attention to the evaluation of land use intensity and development potential, but insufficient research on the current development efficiency. Therefore, we utilize a discriminant model of a three-dimensional matrix method composed of development intensity, supporting capacity, and utilization efficiency. The purpose of this method is to more scientifically and precisely identify problems related to land spatial development in urban agglomerations in order propose specific plans to improve land use quality. Then, based on the three-dimensional model, we obtained the zoning of national spatial development strength in the SPUA, China. The zones include key zones, stable zones, and restricted zones for development. The precise value of available construction land was calculated for each city in the SPUA. This method and evaluation result are highly consistent with the development needs of SPUA, and have been highly recognized by the Ministry of Natural Resources and the land administration department of SPUA. The research team was invited to give an academic report to the first National Symposium on Land Space Optimization Theory, Methods, and Practice organized by the Wuhan University and MNR in 25 November 2018 [52].
Urban sprawl is a non-compact, low-density development urban form, often exhibiting scattered, leapfrog, strip, or ribbon structure, resulting in poor travel patterns and irreversible environmental threat. Spatial planning framework have important influence on leading the urban growth. Sprawl is acknowledged to have several negative impacts in European Unions’ territory, and smart and compact growth will be the future direction of urbanization [53]. Tsilimigkas et al. considered that integrated spatial planning framework is very important for regulating the complex territorial issues raised in medium-sized cities [54]. The urbanization model of self-promoted housing strategies could exploit loopholes and/or only partial application of the spatial planning framework and the very strict building regulations [55]. This is also the case in China’s urbanization process. In order to explore the reform of the spatial planning system and build a national spatial planning system that is unified, interconnected, and hierarchically managed, the Central Office of the CPC Central Committee and the General Office of the State Council issued the “Provincial Space Planning Pilot Program” in January 2017, selecting Hainan and Ningxia. Jilin, Zhejiang, Fujian, Jiangxi, Henan, Guangxi, and Guizhou carried out provincial spatial planning pilots, coordinated various spatial planning, and prepared a unified provincial spatial planning. In April 2017, the Ministry of Land and Resources initiated the preparation of provincial land planning at the national level.
The state has officially approved nine urban agglomerations in the middle reaches of the Yangtze River, Harbin-Changchun, Chengdu-Chongqing, Yangtze River Delta, Central Plains, Beibu Gulf, Guanzhong Plain, Huhhot-Baotou-Erdos, Lanzhou-Xining, etc. The planning of the other 10 urban groups is being reported to the State Council according to procedures, and are awaiting replies. Coordinating provincial land planning and urban agglomeration planning, scientifically evaluating the quality of land use in urban agglomerations, is the basis for establishing the spatial planning system of “master plan-special plan-action plan”, and improving “national-provincial-urban-county-village”. This paper proposes development goals and paths based on the resource and environmental carrying capacity, land development potential, and efficiency of urban agglomeration. This method helps to break the balance of various spatial planning and can effectively link provincial and prefecture-level land space planning, realizing urban group space control from single-objective, rigid, static, to multi-objective, flexible, and dynamic development. We hope that this study will provide a reference for China’s urban agglomeration strategy and ideas for urban agglomeration policy makers in developing countries.
The article still has problems such as possible indicators for the multi-attribute evaluation system and uncertainty in the index weights is needed. In contrast, the identification method of spatial conflicts of new investment area [37] and the method of landscape capacity assessment [48] used in the same high-value landscape can better exploit the value of land. This method can complement our lack of research.
Different UAs have different development foundations, characteristics, and directions. The research method only discusses the land use quality evaluation of a coastal economic development type SPUA, which provides a reference for the evaluation of UA land use. The selection of evaluation indicators and weights is uncertain and cannot be directly used. Although insufficiencies remain, this study represents an exploration of the theory, method, and application of LDIE for urban agglomerations. As research continues, the theory and method will be gradually improved, and this paper will serve as a guide for the comprehensive, balanced, and sustainable development of urban agglomerations.
Funding
This research was funded by the Major Program of the Natural Science Foundation of China grant number [41590842], National Key R&D Program of China [2017YFC0505702], and National Natural Science Foundation of China [41771181].
Acknowledgments
I would like to thank professor Fang Chuanglin, Li Guangdong, Ma Haitao, and my students Liang Longwu, Wang Xinming, Li Jiaxin, who gave me some advices or analyzed some data and checked the language of manuscript.
Conflicts of Interest
The authors declare no conflict of interest.
References
- United Nations. 2018 Revision of World Urbanization Prospects. 2017. Available online: http://esa.un.org/unpd/wup/ (accessed on 1 February 2018).
- The State Statistical Bureau. Statistical Yearbook of China 2018; China Statistics Press: Beijing, China, 2018.
- Fang, C.L. Progress and the future direction of research into urban agglomeration in China. Acta Geogr. Sin. 2014, 69, 1130–1144. [Google Scholar]
- The State Council. National New Urbanization Planning 2014–2020. 2014. Available online: http://www.gov.cn/zhengce/2014-03/16/content_2640075.htm (accessed on 16 March 2014).
- The State Council. The 13th Five-Year Plan for Economic and Social Development of the People’s Republic of China 2016–2020. 2016. Available online: http://www.china.com.cn/lianghui/news/2016-03/17/content_38053101_2.htm (accessed on 17 March 2016).
- Liu, Y.; Yu, H.; Liu, D.; Zhu, L. Spatial differentiation mechanisms of the pattern evolution of construction land development intensity in Northeast China. Acta Geogr. Sin. 2018, 73, 818–831. [Google Scholar]
- Ma, L.; Cheng, W.; Jie, B.; Li, X.; Gu, Y. Spatio-Temporal Variation of Land-Use Intensity from a Multi-Perspective—Taking the Middle and Lower Reaches of Shule River Basin in China as an Example. Sustainability 2018, 10, 771. [Google Scholar] [CrossRef]
- Zhang, P.; Zhang, X.; Liu, Y.; Ye, Y.; Hu, Y.; Wu, C. Diversity of Urban Spatial Efficiency Based on the Land Development Intensity in Changchun City. Sci. Geogr. Sin. 2018, 38, 895–902. [Google Scholar]
- Chen, C.; Chen, W.; Lv, W.G. Allocation of urban construction land based on the regionalization of spatial development suitability: A case study of Haian County. Prog. Geogr. 2009, 28, 775–781. [Google Scholar]
- Liu, J.; Kuang, W.; Zhang, Z.; Xu, X.; Qin, Y.; Ning, J.; Zhou, W.; Zhang, S.; Li, R.; Yan, C.; et al. Spatiotemporal characteristics, patterns, and causes of land-use changes in china since the late 1980s. J. Geogr. Sci. 2014, 24, 195–210. [Google Scholar] [CrossRef]
- Zhang, X.R.; Wang, Z.B.; Fang, C.L. Comprehensive Measurement and Control of Urban Vulnerability; Southeast University Press: Beijing, China, 2016. [Google Scholar]
- Liu, Y.; Song, W.; Deng, X. Understanding the spatiotemporal variation of urban land expansion in oasis cities by integrating remote sensing and multi-dimensional DPSIR-based indicators. Ecol. Indic. 2019, 96, 23–27. [Google Scholar] [CrossRef]
- Rimal, B.; Zhang, L.; Keshtkar, H.; Haack, B.N.; Rijal, S. Land Use/Land Cover Dynamics and Modeling of Urban Land Expansion by the Integration of Cellular Automata and Markov Chain. Int. J. Geo-Inf. 2018, 7, 154. [Google Scholar] [CrossRef]
- Yu, Z.L.; Zhang, W.X.; Liang, J.S.; Zhuang, L. Progress in evaluating suitability of spatial development and construction land. Prog. Geogr. 2015, 34, 1107–1122. [Google Scholar]
- Olmedo, M.T.; Camacho, M.; Paegelow, M.; Mas, J.F. Interest in intermediate soft-classified maps in land change model validation: Suitability versus transition potential. Int. J. Geogr. Inf. Sci. 2013, 27, 2343–2361. [Google Scholar] [CrossRef]
- Tzanopoulos, J.; Vogiatzakis, I.N. Processes and patterns of landscape change on a small Aegean island: The case of Sifnos, Greece. Landsc. Urban Plan. 2011, 99, 58–64. [Google Scholar] [CrossRef]
- Wang, H.; Gao, Y.; Liu, Q.; Song, J. Land use allocation based on interval multi-objective linear programming model: A case study of pi county in sichuan province. Chin. Geogr. Sci. 2010, 20, 176–183. [Google Scholar] [CrossRef]
- Jia, Z.; Ma, B.; Zhang, J.; Zeng, W. Simulating Spatial-Temporal Changes of Land-Use Based on Ecological Redline Restrictions and Landscape Driving Factors: A Case Study in Beijing. Sustainability 2018, 10, 1299. [Google Scholar] [CrossRef]
- Ju, F.; Ma, T.; Gu, X.; Cai, H.; Wu, Y. Analysis of Land-use Spatio-temporal Change in a Karst Region by Dynamic Method. Environ. Sci. Technol. 2018, 41, 160–169. [Google Scholar]
- Kuang, W.; Yang, T.; Yan, F. Regional urban land-cover characteristics and ecological regulation during the construction of Xiong’an New District, Hebei Province, China. J. Geogr. Sci. 2018, 28, 109–123. [Google Scholar] [CrossRef]
- Yeh, A.G.O.; Li, X. Sustainable land development model for rapid growth areas using GIS. Int. J. Geogr. Inf. Sci. 1998, 12, 169–189. [Google Scholar] [CrossRef]
- Lee, C.L.; Huang, S.L.; Chan, S.L. Biophysical and system approaches for simulating land-use change. Landsc. Urban Plan. 2008, 86, 187–203. [Google Scholar] [CrossRef]
- Xu, Y.; Tang, Q.; Fan, J.; Bennett, S.J.; Li, Y. Assessing construction land potential and its spatial pattern in China. Landsc. Urban Plan. 2011, 103, 207–216. [Google Scholar] [CrossRef] [Green Version]
- Wang, Z.B.; Fang, C.L.; Cheng, S.; Wang, J. Evolution of coordination degree of eco-economic system and early-warning in rapid urbanization region of Yangtze River Delta. J. Geogr. Sci. 2012, 23, 1–16. [Google Scholar]
- McHarg, I.L. Design with Nature; Natural History Press: New York, NY, USA, 1969. [Google Scholar]
- Collins, M.G.; Steiner, F.R.; Rushman, M.J. Land-use suitability analysis in the United States: Historical development and promising technological achievements. Environ. Manag. 2001, 28, 611–621. [Google Scholar] [CrossRef]
- Malczewski, J. GIS-based land-use suitability analysis: A critical overview. Prog. Plan. 2004, 62, 3–65. [Google Scholar] [CrossRef]
- Warner, M. Integration of regional land use planning with environmental impact assessment: A practical land suitability assessment approach. Impact Assess. 1996, 14, 155–189. [Google Scholar] [CrossRef]
- Steinitz, C.; Parker, P.; Jordan, L. Hand-drawn overlays: Their history and prospective uses. Landsc. Architect. 1976, 66, 444–454. [Google Scholar]
- Hopkins, L.D. Methods for generating land suitability maps: A comparative evaluation. J. Am. Inst. Plan. 1977, 43, 386–400. [Google Scholar] [CrossRef]
- Chow, T.E.; Sadler, R. The consensus of local stakeholders and outside experts in suitability modeling for future camp development. Landsc. Urban Plan. 2010, 94, 9–19. [Google Scholar] [CrossRef]
- Ferretti, V.; Pomarico, S. Ecological land suitability analysis through spatial indicators: An application of the analytic network process technique and ordered weighted average approach. Ecol. Indic. 2013, 34, 507–519. [Google Scholar] [CrossRef]
- Jankowski, P. Integrating Geographical information system and multi-criteria decision making methods. Int. J. Geogr. Inf. Sci. 1995, 9, 251–273. [Google Scholar] [CrossRef]
- Joerin, F.; Theriault, M.; Musy, A. Using GIS and outranking multi-criteria analysis for land use suitability assessment. Int. J. Geogr. Inf. Sci. 2001, 15, 153–174. [Google Scholar] [CrossRef]
- Zong, Y.G.; Wang, R.; Wang, C.G.; Zhang, L. Ecological suitability assessment on landuse based on potential-constrain approach: The case of urbanized areas in Dalian City, China. Geogr. Res. 2007, 26, 1117–1126. [Google Scholar]
- Jiang, H.; Eastman, J.R. Application of fuzzy measures in multi-criteria evaluation in GIS. Int. J. Geogr. Inf. Sci. 2000, 14, 173–184. [Google Scholar] [CrossRef] [Green Version]
- Solecka, I.; Raszka, B.; Krajewski, P. Landscape analysis for sustainable land use policy: A case study in the municipality of Popielów, Poland. Land Use Policy 2018, 75, 116–126. [Google Scholar] [CrossRef]
- Fisher, P. Fuzzy modeling. In Geo-Computation; Openshaw, S., Abrahart, R.J., Eds.; Taylor and Francis: London, UK, 2000; pp. 161–186. [Google Scholar]
- Delgado, O.B.; Mendoza, M.; Granados, E.L.; Geneletti, D. Analysis of land suitability for the siting of inter- municipal landfills in the Cuitzeo Lake Basin, Mexico. Waste Manag. 2008, 28, 1137–1146. [Google Scholar] [CrossRef] [PubMed]
- Zhang, X.R.; Fang, C.L.; Wang, Z.B.; Ma, H. Urban construction land suitability evaluation based on improved multi-criteria evaluation based on GIS (MCE-GIS): Case of new Hefei City, China. Chin. Geogr. Sci. 2013, 23, 740–753. [Google Scholar] [CrossRef]
- Wang, Y.; Song, Z.B.; Wu, P.L. Land suitability evaluation of high and new technology industry based on BP network. Res. Soil Water Conserv. 2008, 15, 248–250. [Google Scholar]
- Gong, J.Z.; Liu, Y.S.; Chen, W.L. Land suitability evaluation for development using a matter-element model: A case study in Zengcheng, Guangzhou, China. Land Use Policy 2012, 29, 464–472. [Google Scholar] [CrossRef]
- Li, X.; Yeh, A.G. Modeling sustainable urban development by the integration of constrained cellular automata and GIS. Int. J. Geogr. Inf. Sci. 2000, 14, 131–152. [Google Scholar] [CrossRef]
- Stewart, T.J.; Janssen, R.; Van, H.M. A genetic algorithm approach to multi objective land use planning. Comput. Oper. Res. 2003, 31, 2293–2313. [Google Scholar] [CrossRef]
- Qin, T.T.; Qi, W.; Li, Y.Q. Suitability evaluation of rural residential land based on niche theory in mountainous area. Acta Ecol. Sin. 2012, 32, 5175–5183. [Google Scholar]
- Shearera, K.S.; Xiang, W.N. Representing multiple voices in landscape planning: A land suitability assessment study for a park land-banking program in Concord, North Carolina, USA. Landsc. Urban Plan. 2009, 93, 111–122. [Google Scholar] [CrossRef]
- Xu, K.; Kong, C.F.; Li, J.F.; Zhang, L.; Wu, C. Suitability evaluation of urban construction land based on geo-environmental factors of Hangzhou, China. Comput. Geosci. 2011, 37, 992–1002. [Google Scholar] [CrossRef]
- Krajewski, P. Assessing change in a high-value landscape: Case study of the municipality of Sobotka, Poland. Pol. J. Environ. Stud. 2017, 26, 2603–2610. [Google Scholar] [CrossRef]
- Rowe, G.; Wright, G. Expert Opinions in Forecasting. Role of the Delphi Technique. In Principles of Forecasting: A Handbook of Researchers and Practitioners; Armstrong, J.S., Ed.; Kluwer Academic Publishers: Boston, MA, USA, 2001. [Google Scholar]
- Stiglitz, J.E. The Roaring Nineties: A New History of the World’s Most Prosperous Decade; W.W. Norton & Company: New York, NY, USA, 2003. [Google Scholar]
- Liu, Y.; Fang, F.; Yuheng, L. Key issues of land use in China and implications for policy making. Land Use Policy 2014, 40, 6–12. [Google Scholar] [CrossRef]
- Wuhan University. The First National Symposium on Theory and Practice of Land and Space Optimization Was Successfully Held. Available online: http://sres.whu.edu.cn/info/1038/14334.htm (accessed on 26 November 2018).
- Stathakis, D.; Tsilimigkas, G. Measuring the compactness of European medium-sized cities by spatial metrics based on fused data sets. Int. J. Image Data Fusion 2015, 6, 42–64. [Google Scholar] [CrossRef]
- Tsilimigkas, G.; Stathakis, D.; Pafi, M. Εvaluating the land use patterns of medium-sized Hellenic cities. Urban Res. Pract. 2015, 9, 181–203. [Google Scholar] [CrossRef]
- Kizos, T.; Tsilimigkas, G.; Karampela, S. What Drives Built-Up Area Expansion on Islands? Using Soil Sealing Indicators to Estimate Built-Up Area Patterns on Aegean Islands, Greece. Tijdschrift voor Economische en Sociale Geografie 2017, 12, 35–52. [Google Scholar] [CrossRef]
Figure 1.
Location and range of the SPUA.

Figure 2.
Flowchart of the methodological approach.

Figure 3.
Three-dimensional matrix model of LDI in the SPUA.

Figure 4.
Divisions of the SPUA based on land development intensity evaluation.


Table 1.
Research data source
| Data | Kind | Data Source | |
|---|---|---|---|
| Physical geography data | Land-use data from 2001 to 2017 | Statistical data | Government of cities in the SPUA |
| Digital elevation model data 1:10,000 | Vector data | Shandong Mapping and Surveying Bureau | |
| Water and soil loss data | Raster data | The map of the key areas for the prevention of water and soil loss in Shandong Province | |
| Groundwater data | Raster data | Main Functional Area Planning of Shandong Province | |
| Geologic disasters data (landslides, collapses, debris flows, and earthquakes) | Raster data | Shandong Province Prevention and Control Program of Geological Disaster (2003 to 2020) | |
| Socioeconomic data | Road density, population, GDP, investment from 2001 to 2017 | Statistical data | Statistical yearbooks of Shandong Province |
Table 2.
LDIE indicator system for the SPUA
| Target Layer | Standard Layer | Criterion Layer/Weight | Index Layer | Units |
|---|---|---|---|---|
| A1 The evaluation of land spatial development intensity in SPUA | B1 Current development level index | C1 Ratio index of construction land/0.5 | D1 Area of construction land/area of administrative region | % |
| C2 Proportion index of the average annual growth rate of construction land/0.5 | D2 Annual rate of construction land/area increase from 2001 to 2017 | % | ||
| B2 Development supporting ability index | C3 Natural potential index of land development/0.4 | D3 Appropriate slope (<25°) | Degrees | |
| D4 Extent of water and soil loss | Grade | |||
| D5 Occurrence level of geological disasters | Grade | |||
| D6 Development intensity of underground water | Grade | |||
| D7 Area of basic farmland | km2 | |||
| D8 Scale of available space of land | km2 | |||
| C4 Geographical condition index/0.3 | D9 Distance to city center/0.45 | km | ||
| D10 Road density/0.55 | km/km2 | |||
| C5 Urban development index (UD)/0.3 | D11 Gross domestic product (GDP) per capita | Renminbi (RMB) | ||
| B3 Development and utilization efficiency index | C6 Strength bearing index/0.45 | D12 Resident population density of construction land/0.5 | Individuals/km2 | |
| D13 Density of investment in fixed assets of construction land/0.5 | 100 million/km2 | |||
| C7 Output efficiency index/0.55 | D14 GDP of construction land | 100 million/km2 |
Table 3.
Division of LDI in the SPUA
| Functional Division | Matrix Units |
|---|---|
| Key development area | (2,2,3), (2,3,2), (3,2,2), (2,3,3), (3,2,2), (3,2,3), (3,3,2), (3,3,3) |
| Stable development area | (2,1,1), (2,1,2), (2,1,3), (2,2,1), (2,2,2), (2,3,1), (3,1,1), (3,1,2), (3,1,3), (3,2,1), (3,3,1) |
| Restricted development area | (1,1,1), (1,1,2), (1,1,3), (1,2,1), (1,2,2), (1,2,3), (1,3,1), (1,3,2), (1,3,3) |
Table 4.
Zoning of SPUA based on land development intensity evaluation
| LDIE Partition | Name of Area |
|---|---|
| Key development areas | Jinan Downtown, Longkou City, Qingdao Downtown, Changdao County, Zibo Downtown, Guangrao County, Huantai County, Jimo City, Jiaozhou City, Laixi City, Penglai City, Rizhao Downtown, Rushan City, Weihai Downtown, Wendeng City, Yantai Downtown, Zhaoyuan City |
| Stable development areas | Gaomi City, Haiyang City, Laizhou City, Pingdu City, Qingzhou City, Rongcheng City, Zhangqiu City, Changle County, Dongying Downtown, Gaoqing County, Jiyang County, Juxian County, Laiyang City, Pingyin City, Xixia City, Shanghe County, Yiyuan County, Zhucheng City |
| Restricted development areas | Anqiu City, Changyi City, Kenli County, Lijin County, Linqu County, Shouguang City, Weifang Downtown, Wulian County |
Table 5.
Regulation and partition for national LDI in the SPUA
| Area Type | Key Development Area | Stable Development Area | Restricted Development Area | ||||||
|---|---|---|---|---|---|---|---|---|---|
| Proportion of construction land (%) | <19 | 19 to 25 | >25 | <19 | 19 to 25 | >25 | <19 | 19 to 25 | >25 |
| Annual rate of increase (%) | <6.54 | 4.30 to 6.54 | <4.30 | <4.30 | 3.40 to 4.30 | <3.40 | <3.40 | <3.40 | <3.40 |
Table 6.
Annual rate of increase and increase in area of construction land in the SPUA
| Name of City or County | Type of Area | Rate of Increase (%) | Area of Increase (km2) |
|---|---|---|---|
| Key development area | <6.54 | Weihai Downtown | <13.64 |
| Rizhao Downtown | <27.45 | ||
| Yantai Downtown | <35.93 | ||
| Jinan Downtown | <57.06 | ||
| Qingdao Downtown | <64.72 | ||
| 4.30–6.54 | Zibo Downtown | 34.02–51.74 | |
| Restricted development area | <3.40 | Weifang Downtown | <31.06 |
| Stable development area | <4.30 | Dongying Downtown | <24.35 |
© 2018 by the author. Licensee MDPI, Basel, Switzerland. This article is an open access article distributed under the terms and conditions of the Creative Commons Attribution (CC BY) license (http://creativecommons.org/licenses/by/4.0/).
Share and Cite
MDPI and ACS Style
Wang, Z. Land Spatial Development Based on Carrying Capacity, Land Development Potential, and Efficiency of Urban Agglomerations in China. Sustainability 2018, 10, 4701. https://doi.org/10.3390/su10124701
AMA Style
Wang Z. Land Spatial Development Based on Carrying Capacity, Land Development Potential, and Efficiency of Urban Agglomerations in China. Sustainability. 2018; 10(12):4701. https://doi.org/10.3390/su10124701
Chicago/Turabian StyleWang, Zhenbo. 2018. "Land Spatial Development Based on Carrying Capacity, Land Development Potential, and Efficiency of Urban Agglomerations in China" Sustainability 10, no. 12: 4701. https://doi.org/10.3390/su10124701
Note that from the first issue of 2016, this journal uses article numbers instead of page numbers. See further details here.