Role of Local Action Groups in Improving the Sense of Belonging of Local Communities with Their Territories


Department of Agricultural, Food and Environmental Sciences DSA3, University of Perugia, 06100 Perugia, Italy
*
Author to whom correspondence should be addressed.
Sustainability 2018, 10(12), 4681; https://doi.org/10.3390/su10124681
Submission received: 18 October 2018
/
Revised: 4 December 2018
/
Accepted: 5 December 2018
/
Published: 8 December 2018
(This article belongs to the Special Issue Rural Population and Social Sustainability)
Abstract
:The perception of the landscape by the population is one of the themes introduced by the European Landscape Convention. Perception is the key to the integration between human and territorial activities, and between economic development and sustainability. Local Action Groups (LAGs) are groups with territorial boundaries, established by the European Common Agricultural Policy for implementing local development strategies by awarding grants to local projects. The aim of this work is the development of a method for evaluating the ability of the LAGs to enhance the sense of belonging of the population with their territories. The developed method includes identification of those natural, agricultural, historical, and cultural resources for which people feel a sense of belonging, and evaluation of the same through a comprehensive multivariate statistical analysis. This paper reports the results of the statistical analysis of the rankings of local landscapes made by 330 residents of an Italian LAG on the basis of their sense of belonging with them. People showed that the community of the studied LAG does not recognize itself in the typical crops of the entire area, and the attachment to minor historical centres scattered in the territory remains the prerogative of the individual municipalities. The results of this method could be used as a performance indicator for a local plan, in respect to the creation of a shared perception of the local area.
1. Introduction
1.1. Rural Areas and Participation of Local Communities in European Policies
In the recent history of European policies, the involvement of local communities in decision-making has had a growing degree of importance. Generally, the milestones in this regard are the Aarhus Convention [1], the European Landscape Convention [2], and Directive 2003/35/EC [3].
European statistics say that 57% of its regions are predominantly rural, and that the main activity in these areas is agriculture [4]. The main European policy for rural areas is the Common Agricultural Policy (CAP). The CAP, from 2007 to 2013 and from 2014 to 2020, asked farmers to change the scale at which they operate, widening their focus from the individual farm to the whole rural territory. This important new perspective involves a change of objective, as well, from the maximization and optimization of productions (first pillar of CAP) to the rural development policy (second pillar of CAP). Regarding the involvement of local communities, the CAP offers the LEADER Program for the promotion of a community-led local development strategy, supporting development projects initiated at the local level [5,6,7,8]. Esparcia et al. [9] identified two main innovations of the LEADER initiative: “First, the territorial approach “by and for” the local population has been a factor in the empowerment of local society and a means by which to design and implement strategies and actions in rural areas from a bottom-up perspective. Second, LEADER provides a tool for performing such tasks: [T]he Local Action Group” (p. 29). A Local Action Group (LAG) is a non-profit group, made up of representatives of the local community (such as trade unions, business associations, and municipalities of the territory managed by the LAG), that manages LEADER projects in European rural areas [10]. Through the European Agricultural Fund for Rural Development, a LAG can apply for financial assistance in the form of grants to implement the Local Development Strategy of its territory. The main objective of the local development strategies is to deliver support to their respective rural areas, especially through the implementation of small-scale projects. Through this approach, LAGs can better target the particular needs and priorities of their territory, since they are part of the territory themselves. The literature shows that Europe is characterized by a high degree of diversity in the implementation of the LEADER program [11,12,13,14,15]. Despite their differences, the European LAGs are the principal actors in the rural development of Europe [16]. Generally, the development strategies of the LAG implement an internal decision-making process with the members of the LAG. The local farmers are involved successively and separately, to implement the interventions. However, in European contexts, the residents of the rural areas are not just the farmers, especially since in the last fifty years we have witnessed a tendency to build scattered dwellings. Even if the studies about local rural communities are mainly focused on farmers [15,16,17,18,19], real local development is possible only if the entire community is involved [20]. With the CAP 2007–2013, direct and inclusive involvement of the entire local community occurred only sporadically. With the CAP 2014–2020, the European Commission is trying to make it a structural element in the processes of local rural development. In this paper, the main results of a study in an Italian LAG, called “In Teverina”, are reported. For the selection of a representative sample of the local community, the developed method involves farmers and non-farmers, both born and resident in the studied area.
1.2. Parameters for the Assessment of People’s Perception: The Sense of Belonging with a Place
The strategies of LAGs are designed for the building of social, environmental, and economic strengths or “assets” in the rural community, rather than simply to compensate for its problems. In rural development, the key to the integration between human and territorial activities, and between economic development and sustainability, is the local community’s perception of their territory [21]. For this reason, there is an increasing need to better understand the relationships between local communities and the rural landscape, and the sense of belonging that people have with the territories in which they live [17,22,23].
The sense of belonging is a parameter of perception that originates from the combination of features that a community recognizes in the place in which it lives [24,25]. The sense of belonging is dynamic, develops together with human identity [26], and has a time horizon that goes from the past (memories) to the future (dreams, desires, concerns) [27,28]. The sense of belonging is central to the identity and everyday life of people [29,30]. Various factors contribute to the construction of the sense of belonging with a place, such as: The physical dimensions [31,32,33,34]; the geographic distance from home [35,36]; the period of residence [37,38]; the individuals’ gender [39,40]; the activities that take place in it [41]; the individuals’ age [42]; the events that happen over a lifetime [43]; the individuals’ sensibility for the environmental values [44,45]; and the sense of security [46].
Neal and Walters [47] assert that the place attachment of the people in rural communities tends to particularly focus on, and “be framed by their senses of the locationality, neighbourliness (sic), and friendship” (p. 285).
Often “belonging (...) is used in a way that implies a common understanding of what belonging is and why belonging is important. Needless to say, no such common understanding exists” [48], (p. 772). Jorgenson and Stedman [49] assert that place attachment is an emotional bond between people and their environments; Lin and Lockwood [50] distinguish emotional or symbolic attachments to a place from functional or physical attachments. In this study, as in Scannell and Gifford’s [51], the sense of belonging is defined as “a bond between an individual or group and a place that can vary in terms of spatial level, degree of specificity, and social or physical features of the place, and is manifested through affective, cognitive, and behavioral psychological processes” (p. 5). In this emotional concept of place attachment, the belonging is not a natural occurrence, but is an affective acting on the feelings of being in place [48,52]. This paper uses this emotional concept to frame the relationships between the residents and the territory of the LAG.
Furthermore, this paper analyses the spatial dimension of this concept. As affirmed by Mee and Wright [48], “the belonging is an inherently geographical concept” (p. 772), but what is the correct scale to define this geographical concept? There are many studies scattered across the world focalizing on “boundaries and belonging”, including in Australia [53,54], Europe [55], and North America [56,57]. In accordance with Blunt and Dowling [58], along with Morley [59], it is important to build a multiscale understanding of belonging to delineate the perceived boundaries. This paper uses two scales of analysis by comparing the sense of belonging of a rural community with the whole territory managed by the LAG, and with the different municipalities of the LAG.
1.3. Objective of the Paper
The aim of the paper is the development of a method to evaluate the sense of belonging of rural communities with the natural, historical, and agricultural resources of their territories, using visual tools and simple questionnaires.
This paper suggests the use of the sense of belonging of local communities with their territories as a performance indicator of the participatory processes in the rural areas, particularly to evaluate the choices of the LAGs. Indeed, well-managed involvement pathways should enable the residents of LAGs to feel part of a single community that together makes choices to improve their quality of life [9]. It is important to move in this direction, because many positive outcomes for individuals are associated with the sense of belonging [23].
The main research questions are: (i) Does the local community of a LAG have a sense of belonging with the entire territory of the LAG? (ii) Does the sense of belonging with a place vary on the basis of the typologies of its resources?
The method is applied to the LAG “In Teverina” (http://www.galinteverina.it), which includes six municipalities of central Italy (Lazio Region). In this first contribution, the statistical analysis is focused on understanding how the municipality of residence influences the perception of a place with respect to the LAG competence. The results of the empirical study conducted in the LAG give a baseline value of an indicator to evaluate new strategies in order to enhance the sense of belonging of rural communities with the whole territory of the LAG. This indicator could be calculated before and after the implementation of an inclusive strategy for the development of the sense of community, allowing comparison of the resulting values.
2. Materials and Methods
Figure 1 shows the phases of the method: A “phase of identification” of the local landscapes for which residents have a strong sense of place, and a “phase of evaluation” of these landscapes performed by the residents. The method is called IESOB (Identification and Evaluation of the Sense of Belonging).
2.1. Case Study: The LAG “In Teverina” (Italy)
2.1.1. Geographical Context of the Study Area
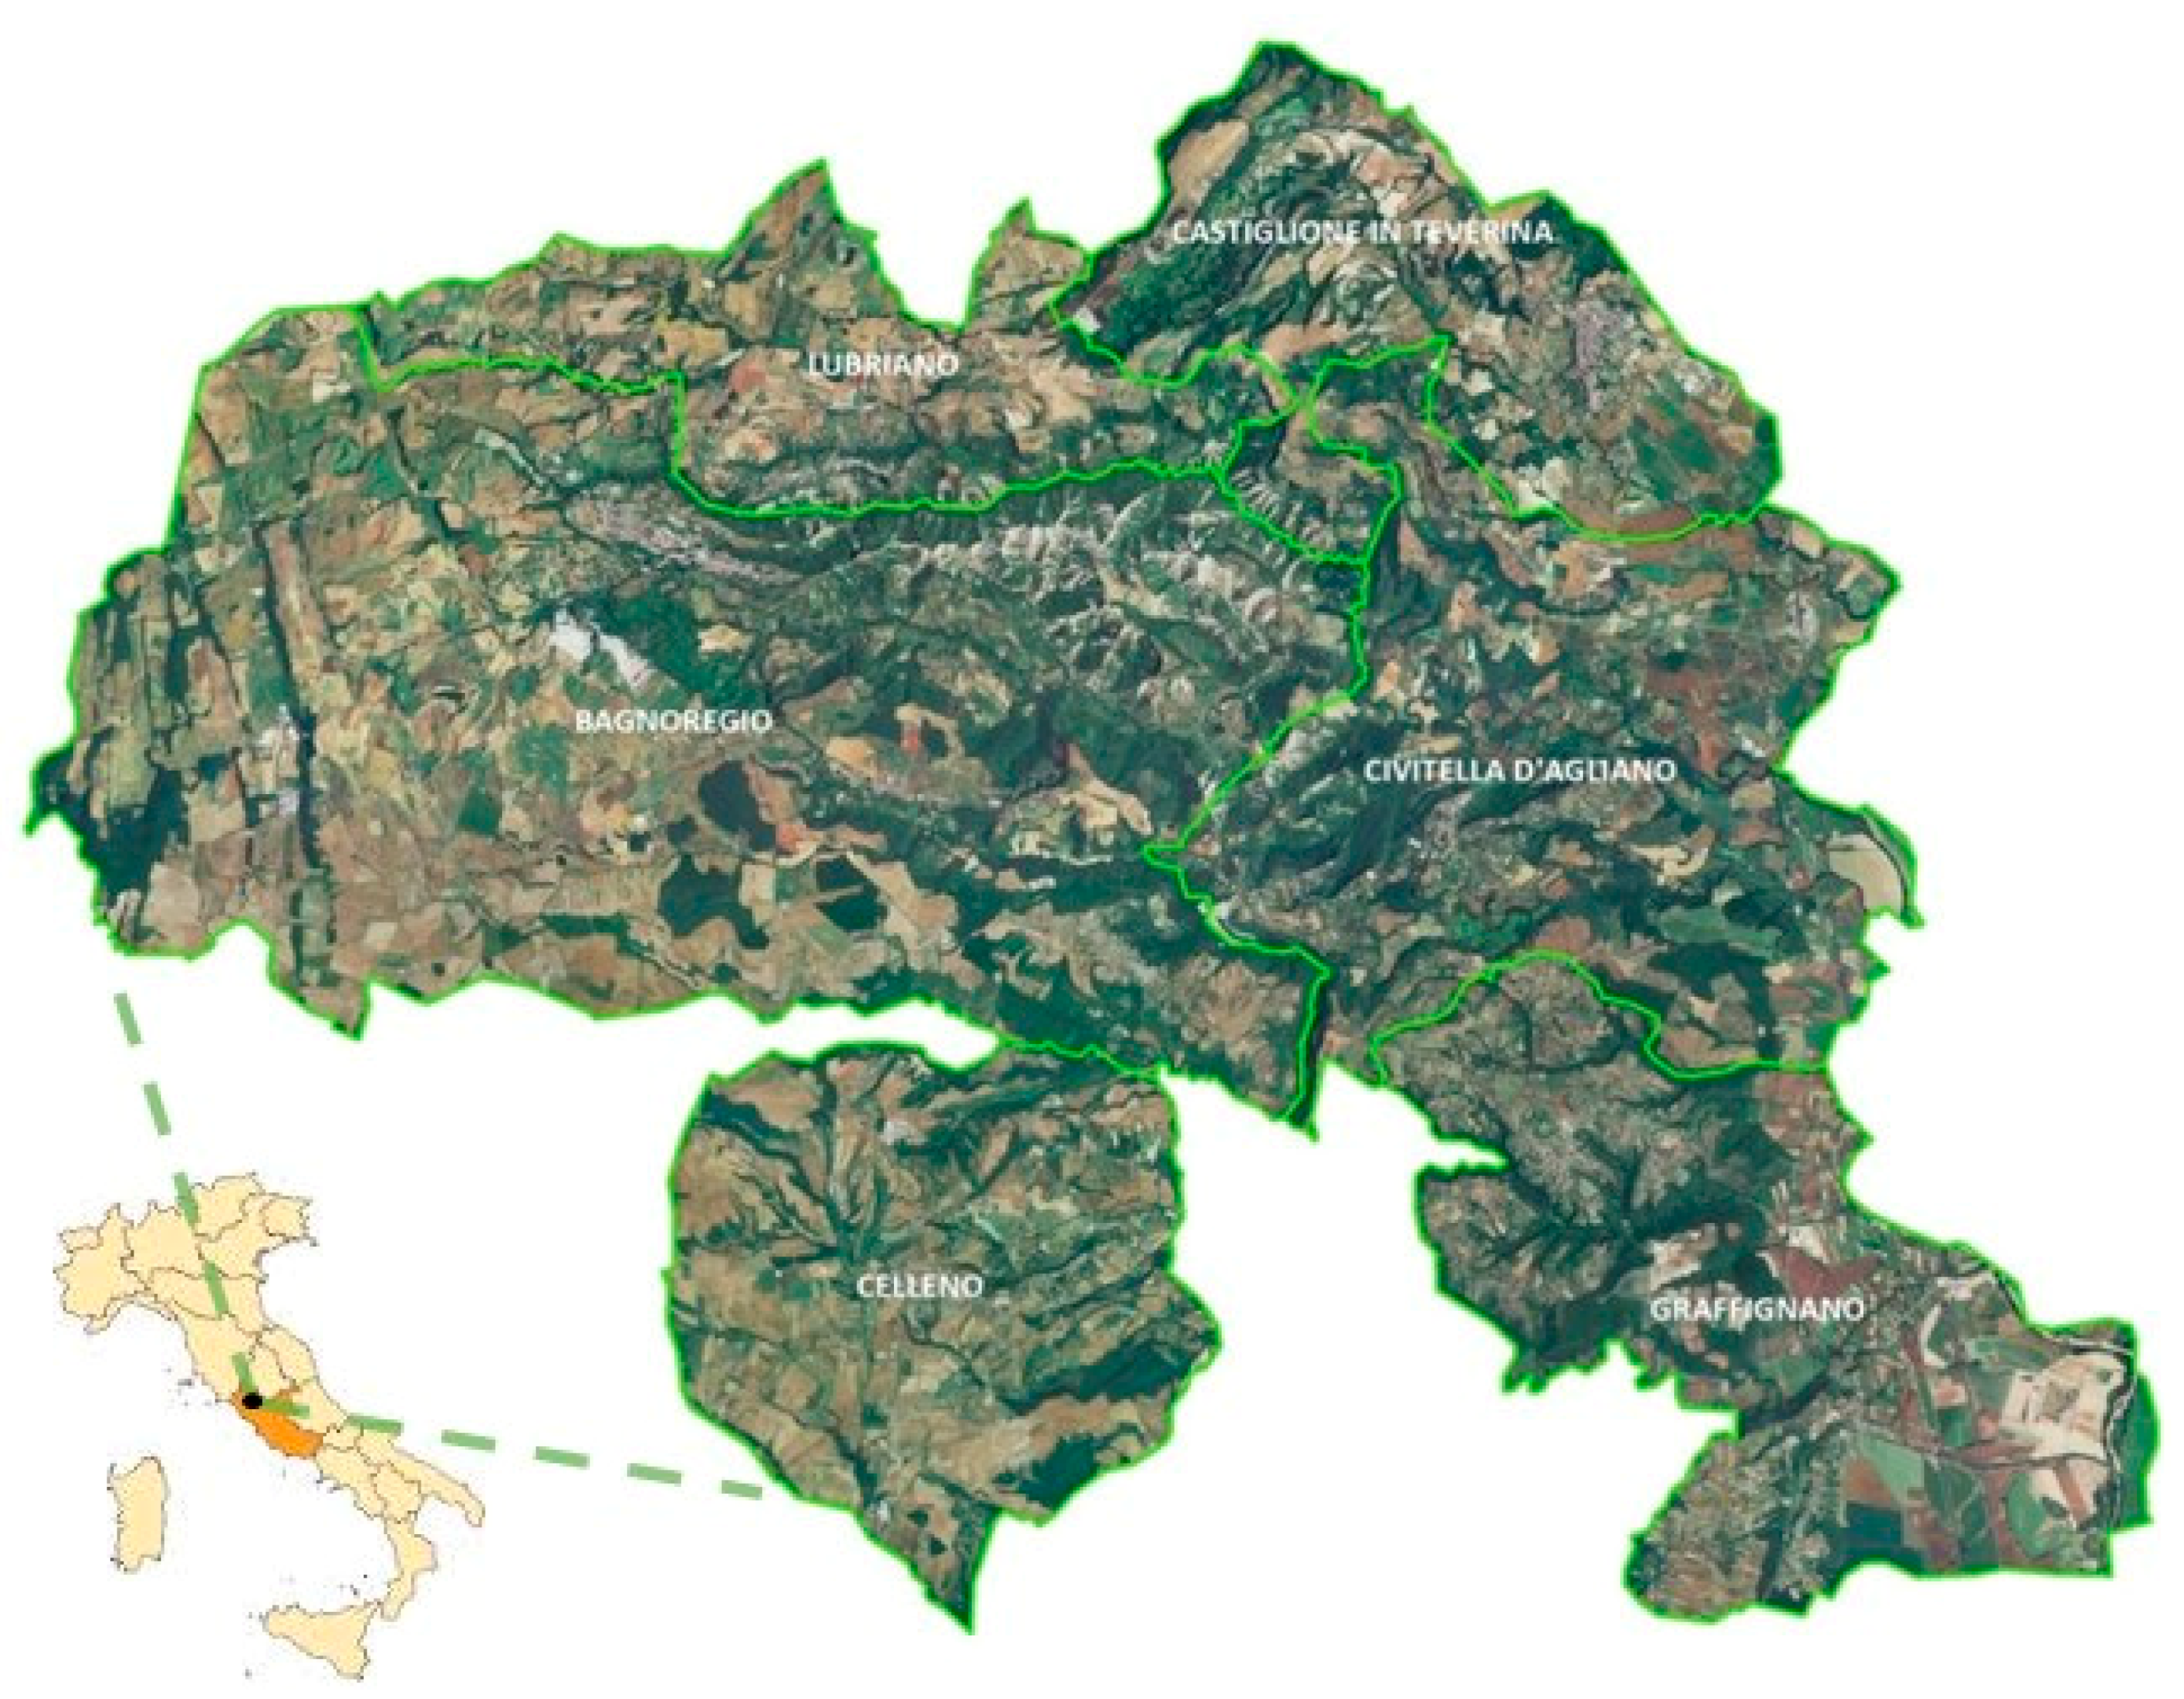
The study area is the LAG “In Teverina”. This area is located in central Italy, in the region of Lazio. The municipalities of the LAG are Lubriano, Castiglione in Teverina, Civitella d’Agliano, Graffignano, Celleno, and Bagnoregio (Figure 2). This area covers about 200 km2 and it has a homogeneous territory from many points of view: The settlements, the widespread polycentric built fabric, the cultural and historical elements due to the medieval origin of the centers, the wine and the food, and the variety and uniqueness of the products that it offers. The economy of the whole area is strongly linked to agricultural activities, crafts, and tourism.
The strategic objectives of the Local Development Plans 2007–2013 and 2014–2020 of the LAG “In Teverina” concern the development of participatory processes for the enhancement of the quality of the local productions and the distribution of the benefits to the entire territory of the LAG [60].
2.1.2. Individuation of the Sample of Respondents
In order to have a good representation of the local community and perform a statistical treatment of the data, is necessary to have a high number of respondents evenly distributed across the municipalities of residence.
The interviews were carried out in public places of the different municipalities (squares and shopping centers), one respondent at a time, in order to reduce possible disturbances in the answers.
The interviewer was always the same: A student aged 25, born and raised in the territory of the LAG. In order to obtain a homogeneous distribution between age, gender, and municipality of residence, before the beginning of the interview he asked everyone his/her age group (6–17 years; 18–29 years; 30–45 years; 46–65 years; or over 65 years) and his/her place of residence. To generate the sample, he selected only people born and currently resident in a municipality of the LAG.
There were 348 respondents (58 residents for every municipality; 168 males and 180 females), aged from 11 to 86 (66 respondents for the age group 6–17; 79 for 18–29; 59 for 30–45; 66 for 46–65, and 78 over 65 years old).
Farmers constituted 30% of the survey’s respondents. The other respondents were managers, public or private employees, teaching professionals, artisans/artists, clerks, workers, students, retired, and unemployed. The educational level varied from primary school to doctoral degree.
2.2. Phase of Identification
This phase uses a simple survey (survey A in Figure 1) with two questions:
- Do you know the whole territory of the LAG “In Teverina”?
- Within the LAG, which are the places where you feel a strong sense of belonging?
The first is a yes-no question, to select only the respondents who know the whole study area. The 348 respondents were all persons who answered yes to the first question of survey A, and that left an address (telephone, e-mail) in order to be contacted for the second phase.
The second phase is an open-ended question designed to generate a list of local places that are considered representative of the identity of the area. Each respondent could list up to two places. To select from the listed places the Local Representative Landscapes (LRLs) for the second phase, the method uses the following criteria: Frequency with which the respondents appointed them, homogeneous distribution among the municipalities, and homogeneous distribution among three typologies of resources (physical/natural, historical /cultural, and agricultural/productive).
2.3. Phase of Evaluation
This is the main phase of IESOP. Section 2.3.1. describes the used tools, Section 2.3.2. the multivariate statistic, and Section 2.3.3. the meaning and role of the “control group”.
2.3.1. Tools to Evaluate the Sense of Place
This phase uses a short survey of three questions, and photos of the selected LRLs during the phase of identification.
First, the people of the sample are contacted by phone or email, asking them to answer three closed-ended questions (Survey B in Figure 1), giving a value with a Likert scale ranging from strongly agree, agree, no opinion, disagree and strongly disagree. The questions were:
- Generally, do you appreciate the physical and natural resources of a territory?
- Generally, do you appreciate the historical and cultural resources of a territory?
- Generally, do you appreciate the agricultural and productive resources of a territory?
This survey was used to select from the sample only the respondents who answer “agree” or “strongly agree” to all three questions.
Regarding the photos of the LRLs, the remaining respondents were asked to rank the images in order of the sense of belonging aroused from them. Survey B was useful for decreasing the possibility that the choices made in the ranking were not influenced by a personal appreciation towards a resource’s type, but instead toward the specific place represented. It was possible to choose between seeing the photos as files attached to an email, using WhatsApp, or meeting the interviewer face to face.
2.3.2. Multivariate Analysis
The method uses the multivariate statistical approach to analyze the results of the ranking of the photos.
This step aimed to answer the two research questions: (i) Does the local community of a LAG have a sense of belonging with the entire territory of the LAG? (ii) Does the sense of belonging vary on the basis of the typologies of resources?
To answer the first question, the method compared the statistical results of the whole sample with the results by the six municipalities of residence of the respondents. To answer the second question the method compared the statistical results by typology of resources represented in the photos.
The method used the software R [61] for developing all of the statistical data analysis, including an exploratory data analysis and a multivariate analysis.
The exploratory data analysis was useful for understanding the structure of the dataset and for producing the correlation matrices and the box plots (library “corrplot” in R).
Generally, the multivariate analysis is a set of statistical techniques with which it is possible to understand the correlation between multiple variables studied in different subjects.
The method uses the libraries of the R software “FactoMineR”, “factoextra”, and “cluster” for performing a principal component analysis and a cluster analysis [62,63,64,65].
To evaluate if the dataset was clusterable, the method used the Hopkins’ statistic and a visual approach [64]. Cluster analysis was useful for identifying inherent patterns within the dataset. This analysis gathered the respondents who made similar rankings of the photos into the same cluster. The method uses a hierarchical clustering, which does not require specifying in advance the number of clusters to be generated. Initially, each observation is considered as a cluster of its own. Then, the most similar clusters are merged iteratively until there is just one single big cluster. The method used the “daisy” function to calculate the dissimilarity matrix between variables and, as the clustering method, the “agnes” hierarchical agglomerative method, which operates by merging two variables with the smallest dissimilarities into one cluster, and then proceeds to find pairs with similar features. The agglomerative coefficient of 0 indicates that a clear structure is missing, while the value of 1 implies that a perfect structure is present in the data set. To minimize the total variance of each group the method used the linking method “ward”, so for each step the cluster couples with the minimum clustering distance were grouped together [66].
2.3.3. The “Control Group”
During the evaluation of the photos of the LRLs (the step described in Section 2.3.1.), the quality of the photos and the beauty of the images could influence the respondent’s judgement, because it is easier to affirm a strong sense of belonging with a beautiful photo compared with one with less appeal.
For this reason, the evaluation of the photos was repeated using a “control group.”
In epidemiology [67] “ideally, the control group and the experimental groups are identical in every way except that the experimental groups are subjected to treatments or interventions believed to have an effect on the outcome of interest, while the control group is not” (p. 232).
This method considers the sample of respondents as the experimental group and repeated the phase of evaluation of the photos using a “control group”. The “control group” was a group of respondents closely resembling the sample of the experimental group in many variables (the same number of respondents with the same distribution with respect to age, gender, and educational level). The method, instead of using “treatments or interventions”, differentiated the two groups (sample and control) by the municipality of birth and residence (inside and outside the LAG, respectively). “The effect on the outcome of interest” was the difference in the rankings by the respondents of the two groups. The people of the control group were Italian tourists in the LAG, who the interviewer met during the interviews along with the sample of respondents.
The method asks the respondents of the sample to rank the photos by place attachment, while the control group was asked to rank by the beauty of the images. The method used this control group to reinforce the statistical results of the sample. Indeed, a strong sense of belonging of the local community with photos that are not appreciated by the control group reinforces the results, while a strong sense of belonging of the local community with photos strongly appreciated by the control group creates doubts about the influence of the beauty of the photos on the judgment of sense of belonging.
3. Results
3.1. Phase of Identification
Resources of varied typologies scattered across the whole territory characterize the investigated landscapes of the LAG “In Teverina”. A center of attraction that overall identifies the area of the study does not exist. The local community showed a strong sense of belonging with physical and natural resources (the most frequently mentioned were badlands, countryside, and woods); with agricultural resources (vineyards, olive groves, and cherry orchards); and with historical and cultural resources (the historical centers of the six municipalities of the LAG, scattered churches, and castles).
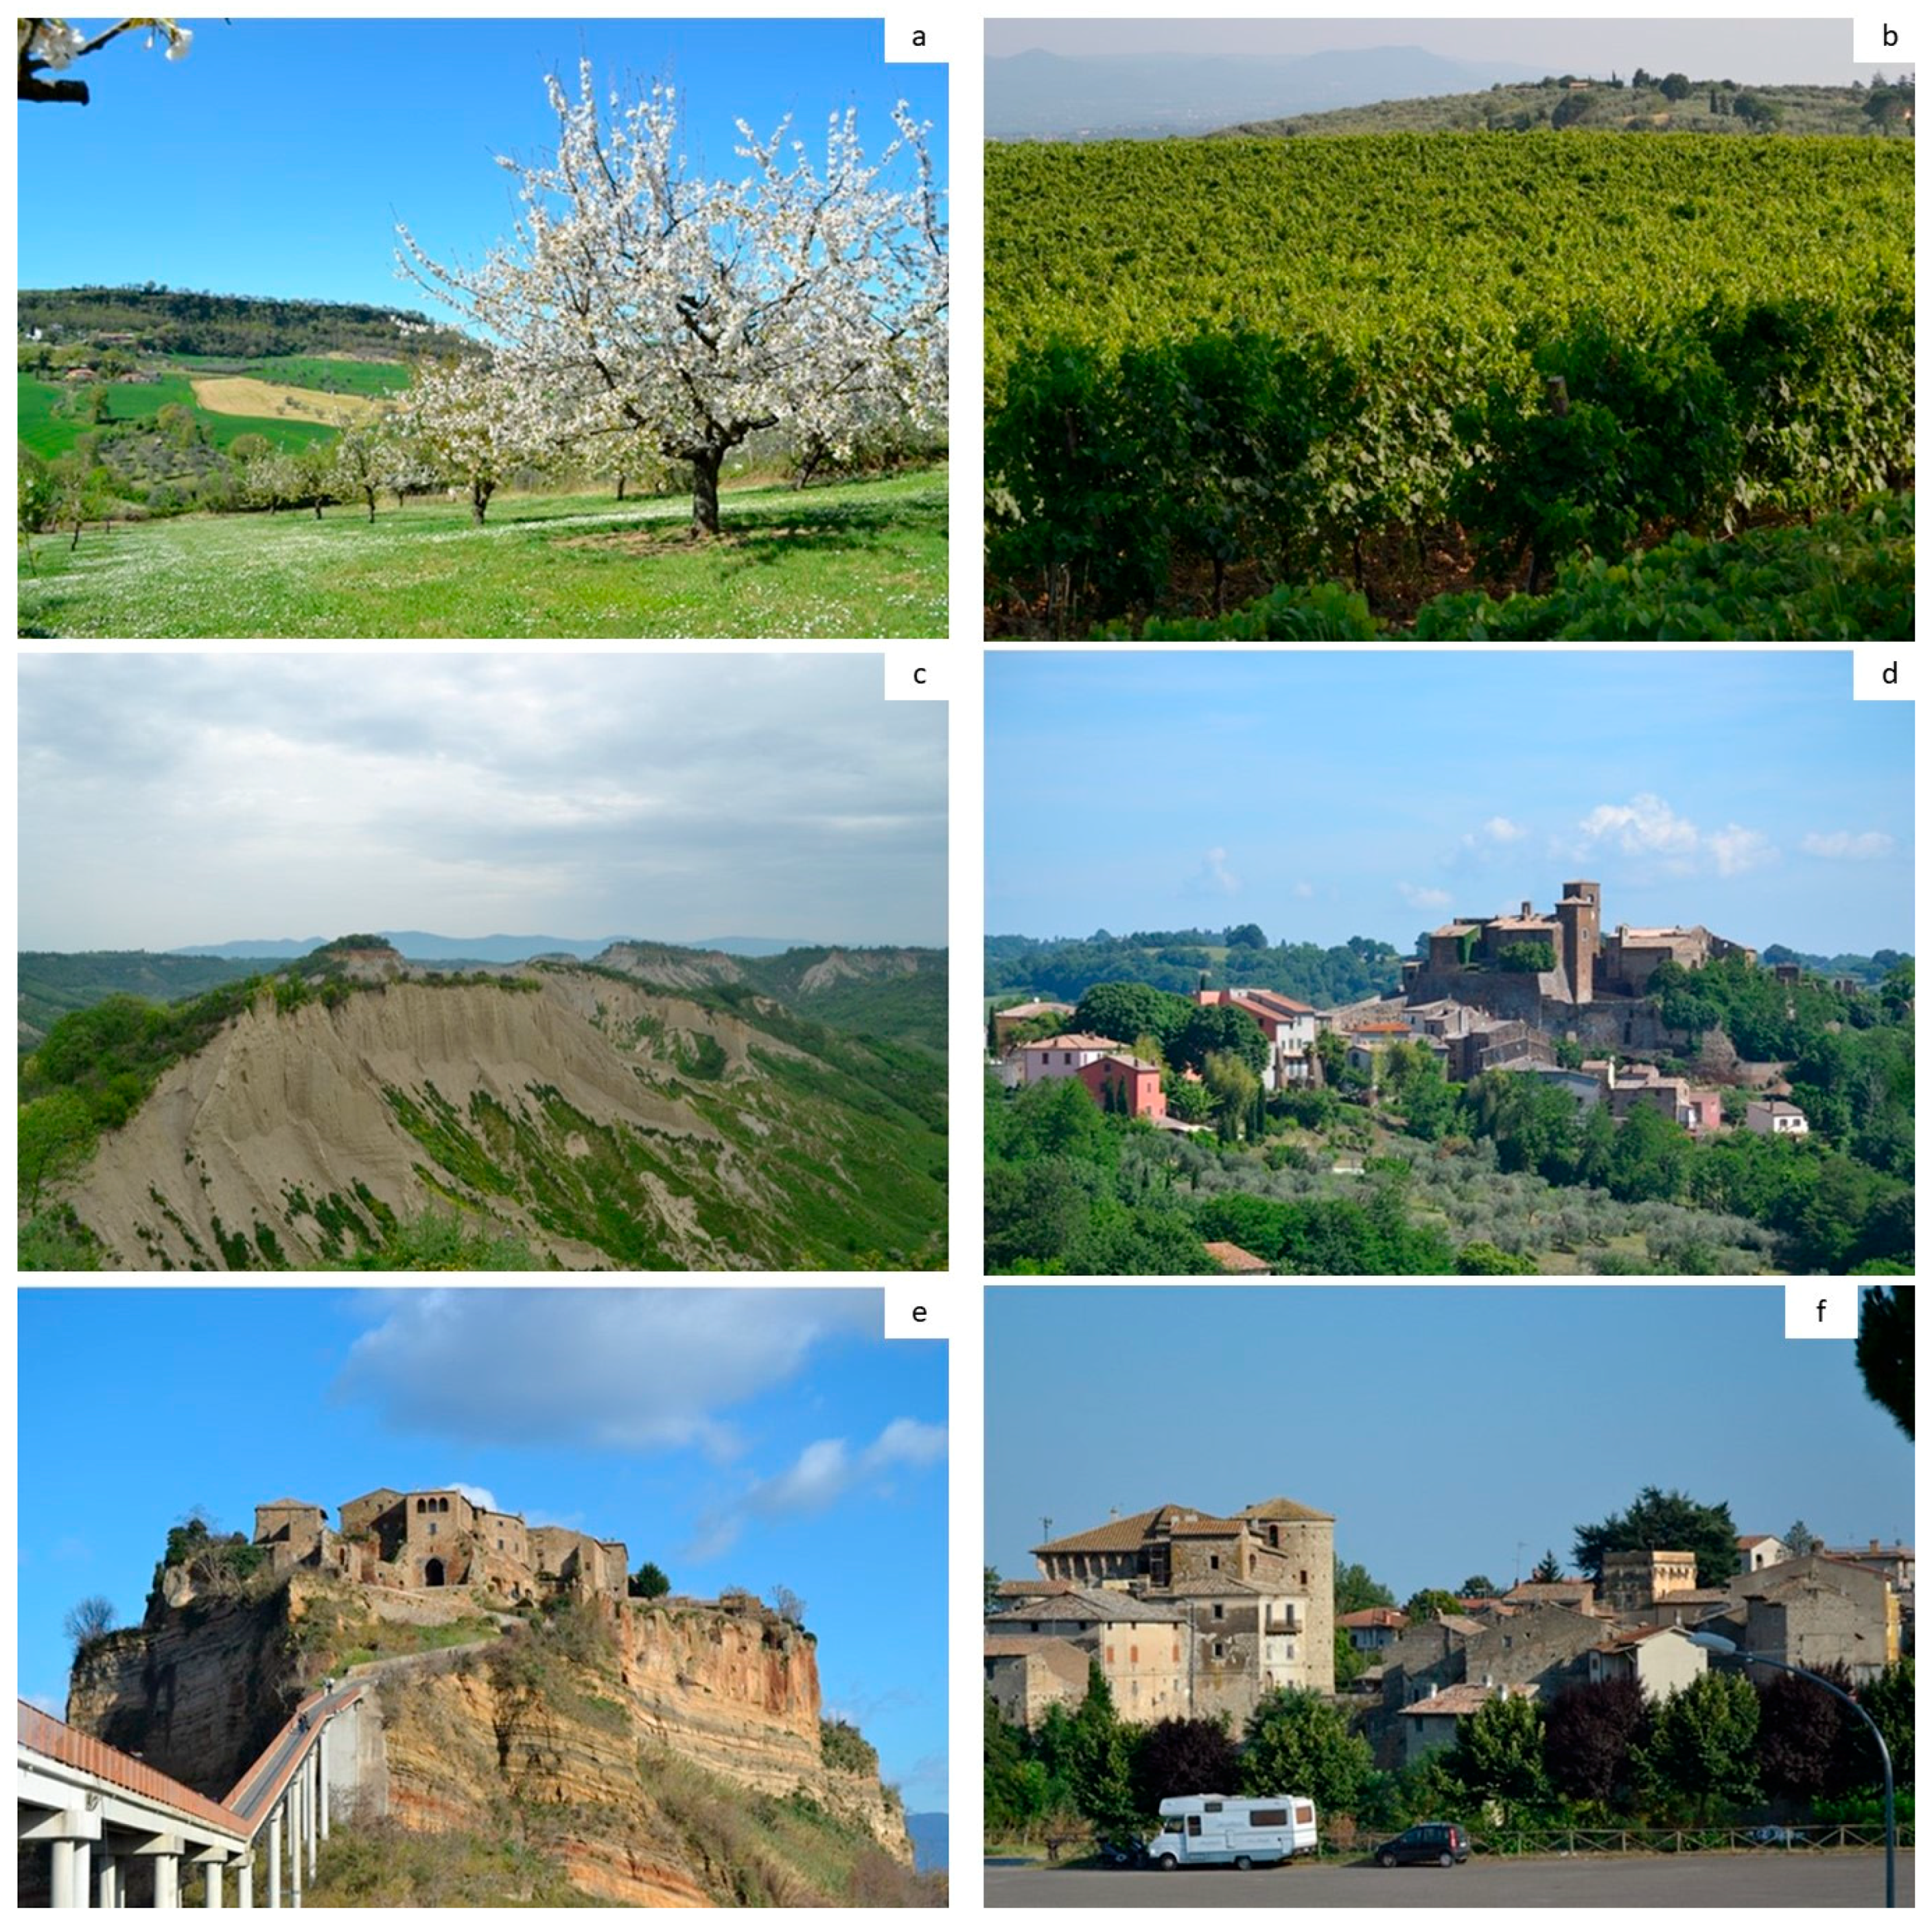
The most frequent landscapes listed by respondents in Survey A are the following LRLs (Figure 3):
- CN1 countryside with olive and cherry trees (representative of the natural and agricultural resources of the municipality of Celleno) (Figure 3a).
- C2 countryside with olives and grapevines (representative of the agricultural resources of the municipalities of Castiglione in Teverina, Civitella d’Agliano, and Graffignano) (Figure 3b).
- N3 valley of badlands (This is the European Site of Community Importance called SIC IT6010009. The valley is a representative of the natural resource of the municipalities of Bagnoregio, Castiglione in Teverina, Civitella d’Agliano, and Lubriano.) (Figure 3c).
- H4 historic center of Celleno (representative of the historic resources of the municipality of Celleno) (Figure 3d).
- HH5 Civita di Bagnoregio (Civita is a town founded by Etruscans more than 2500 years ago. “Civita is located on a tuff cliff subjected for centuries to landslide phenomena that resulted in the progressive retreat of the slopes and today jeopardizes the very existence of the town, so much so that Civita is widely known as the “dying town” ([68] p. 647). Civita is the major touristic resource of the municipality of Bagnoregio [69] (Figure 3e).
- H6 historic center of Graffignano (representative of the historic resources of the municipality of Graffignano) (Figure 3f).
3.2. Phase of Evaluation
After Survey B, 5% of the sample described in Section 2.1.2. was discarded and the photos were shown to the remaining 330 respondents.
To perform a statistical analysis of the ranking between LRLs done by respondents, a table was built with the six LRLs as columns and the 330 respondents as rows. For every respondent, the value “1” was assigned to the LRL that aroused the strongest sense of belonging, the value “2” for the second LRL in the rank, through until value “6” for the last one. The value of 6 corresponds to the LRL that aroused the weakest sense of belonging, because there were a total of six LRLs analyzed and the method requires a complete ranking of the LRLs. An analogous table of 330*6 was built for the “control group” (the 180 records of the control group are represented by Italian tourists that live outside the Lazio region, while 150 are tourists that live in Lazio, but in a different municipality with respect to those of the LAG “In Teverina”).
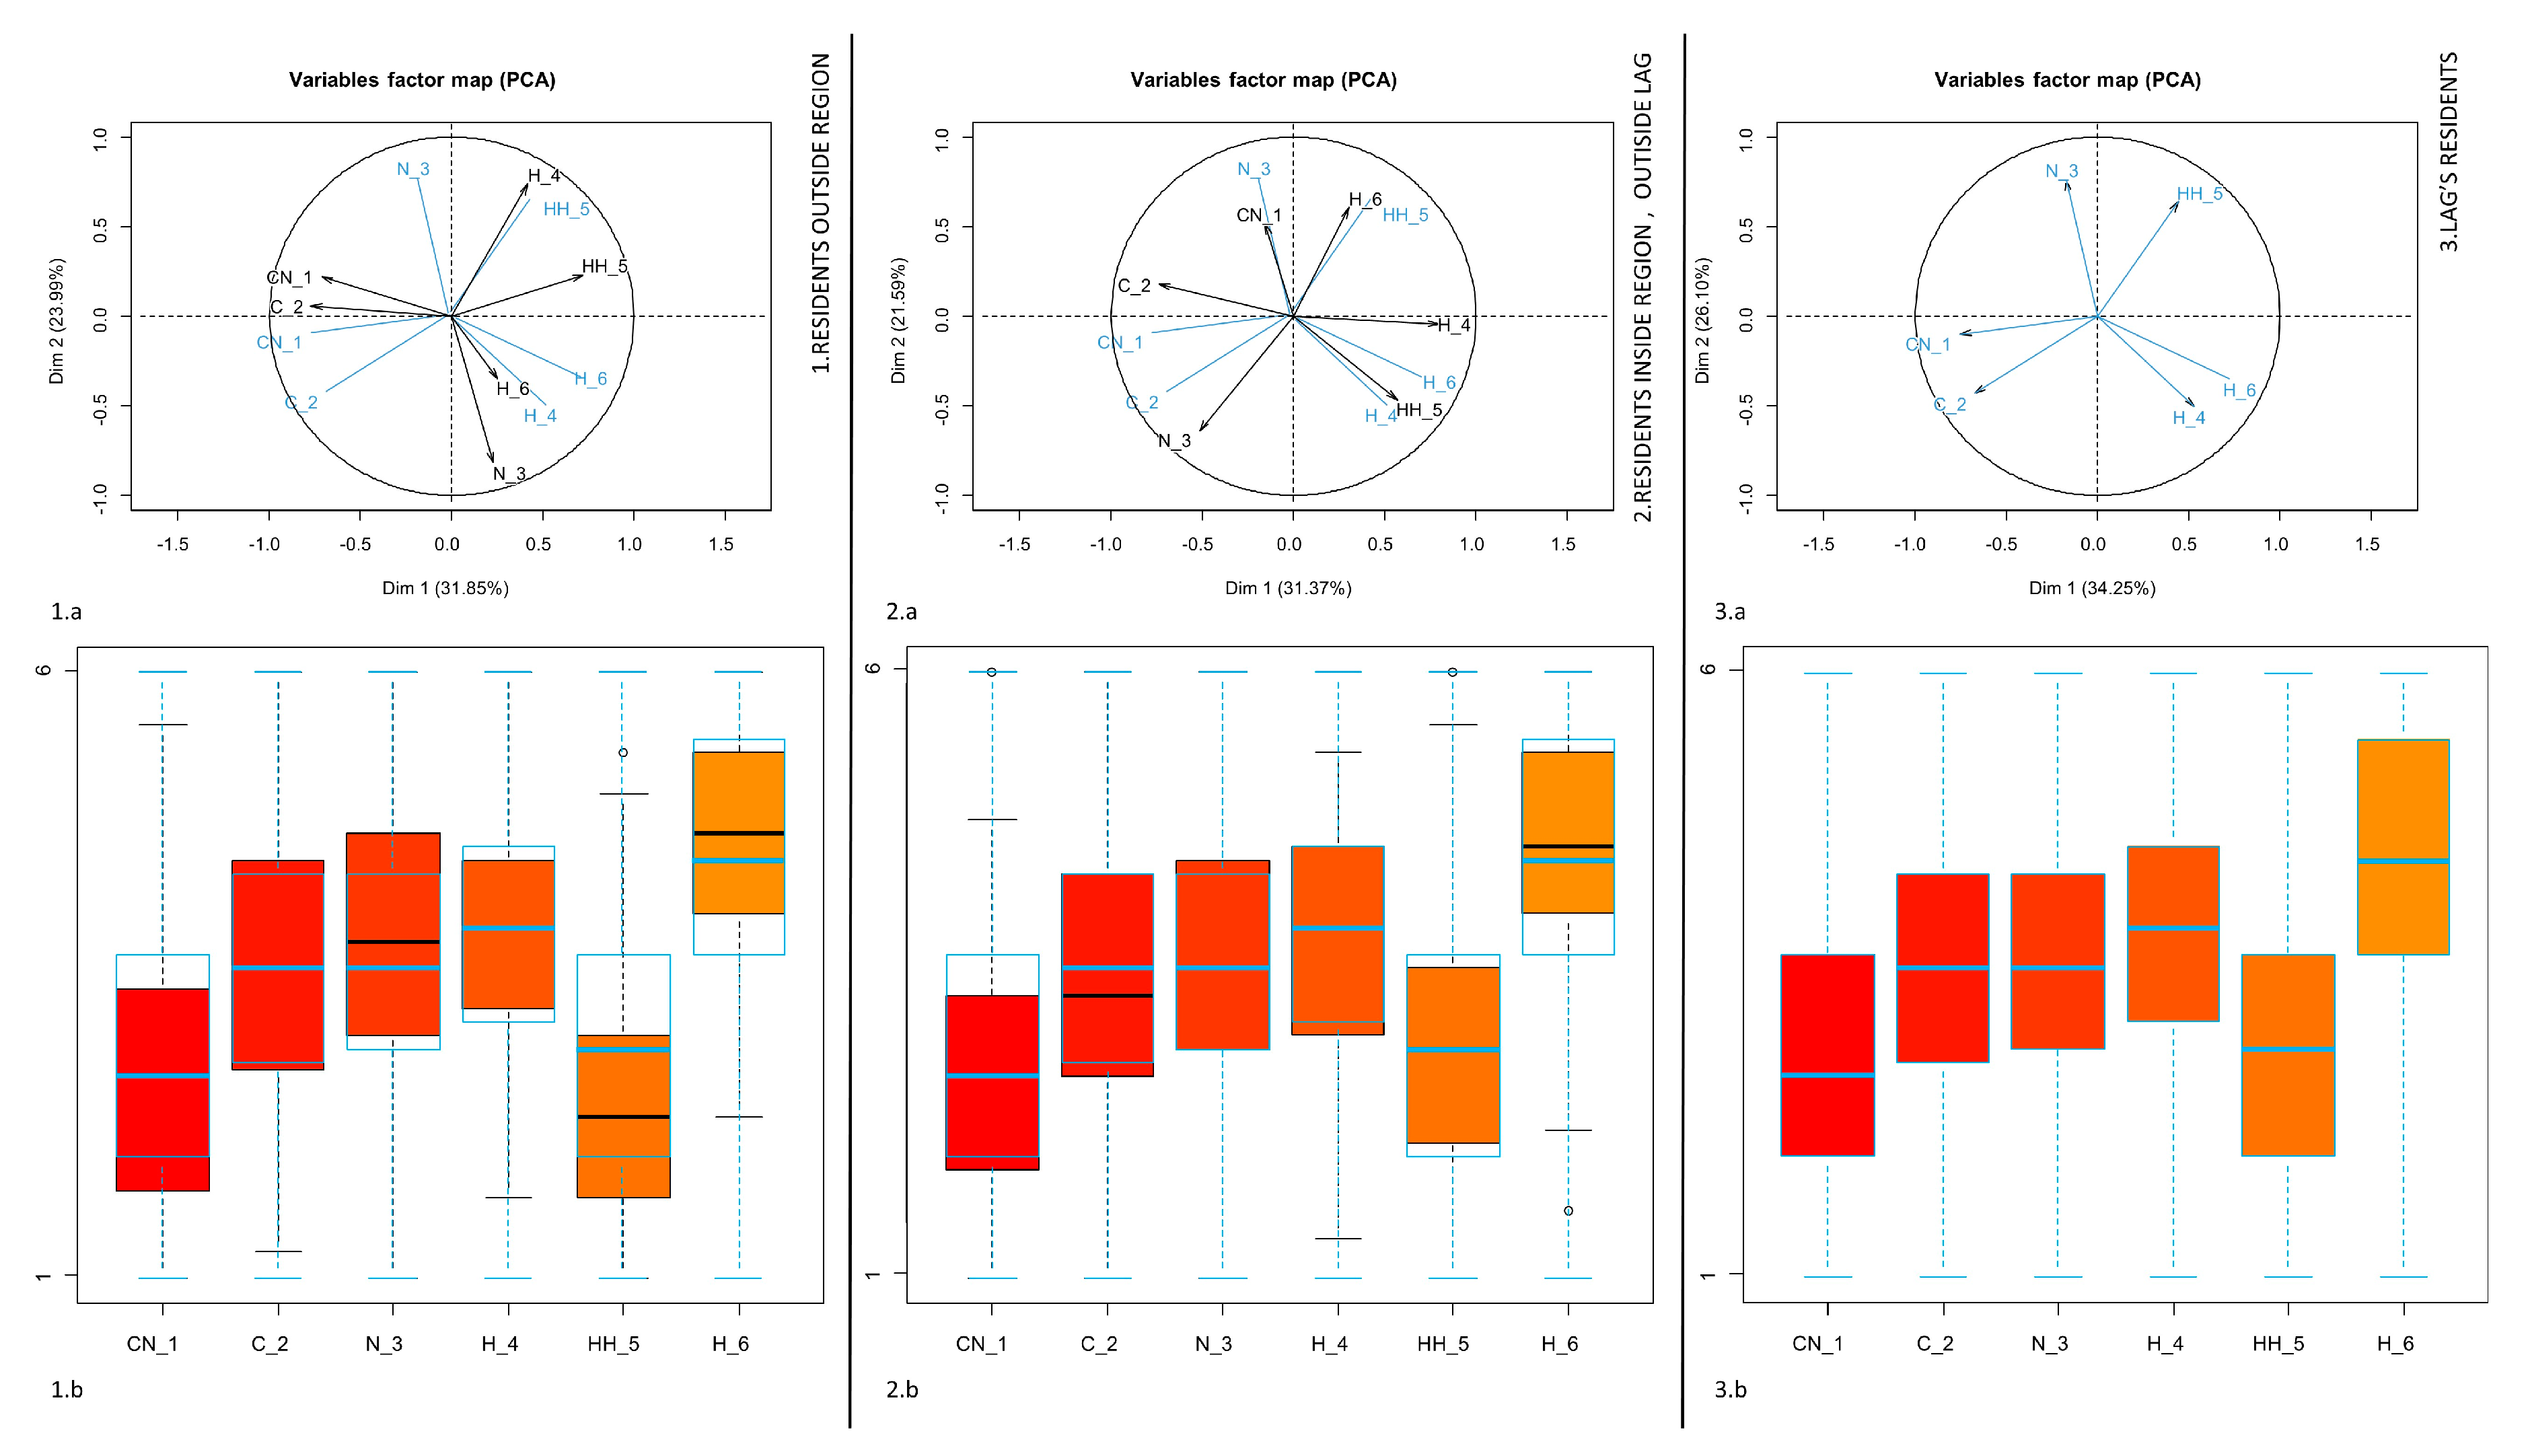
The first step of the analysis compares the overall results of the sample with the results of the “control group”. The exploratory analysis shows that, for the residents within the LAG and residents within the region, but outside the study area, the ordering of the LRLs is the same: CN1, HH5, C2, N3, H4, and H6. Observing the box plots in Figure 4(b1,b2,b3), it can be observed that for the residents inside the LAG (Figure 4(b3)) compared to the others (Figure 4(b1,b2)), the assessment of LRL C2 is slightly decreased, while the assessment of LRL H6 shows a slight improvement and has an increase in the discordance between respondents (amplitude of the box plot). Concerning the tourists who reside outside the region, the main change in the evaluations of the photos compared to the others is for the photo of Civita (HH5), which is the more appreciated LRL, confirming that visiting this city is the most frequent reason for coming to this area among people that live outside the Lazio region.
The geometric representation of the ranking distribution along the first two axes disclosed by the principal components analysis is shown in Figure 4(a1,a2,a3). The first dimension (Dim1) is linked to the respondents that have a strong sense of belonging with historical resources and a low sense of belonging with natural and agricultural resources, and vice versa. This follows from the LRLs HH5, H4 and H6 being given high values for the horizontal axis, compared with low values for the LRLs CN1, C2 and N3.
For residents inside the Lazio region the second dimension (Dim2) seems to be related to the dying town and the badlands’ valley, where the city of Civita is located. The link between Civita and the badlands’ valley is lost with those residents outside the region. This follows from the LRLs HH5 and N3, given opposite values for the vertical axis. This result shows that the residents of the region view the city of Civita and the badland’s valley where the city is located as a single landscape.
Overall, the comparison between the sample of respondents and the “control group” suggests doubts about the sense of belonging of the sample with the entire area of the LAG, because the two groups report the same rankings between photos.
Regarding whether the sense of belonging varies on the basis of the typologies of resources, the results show that the respondents of the sample and the “control group” appreciate the agricultural and natural resources more than the small historic towns, which were given the last position in the ranking (H4 and H6). However, obtaining the same results between the two groups gives rise to doubt regarding whether the respondents of the sample have chosen the most beautiful photos rather than those for which they have the strongest sense of place.
The second step of the analysis is focused on the sample of respondents and its internal structure.
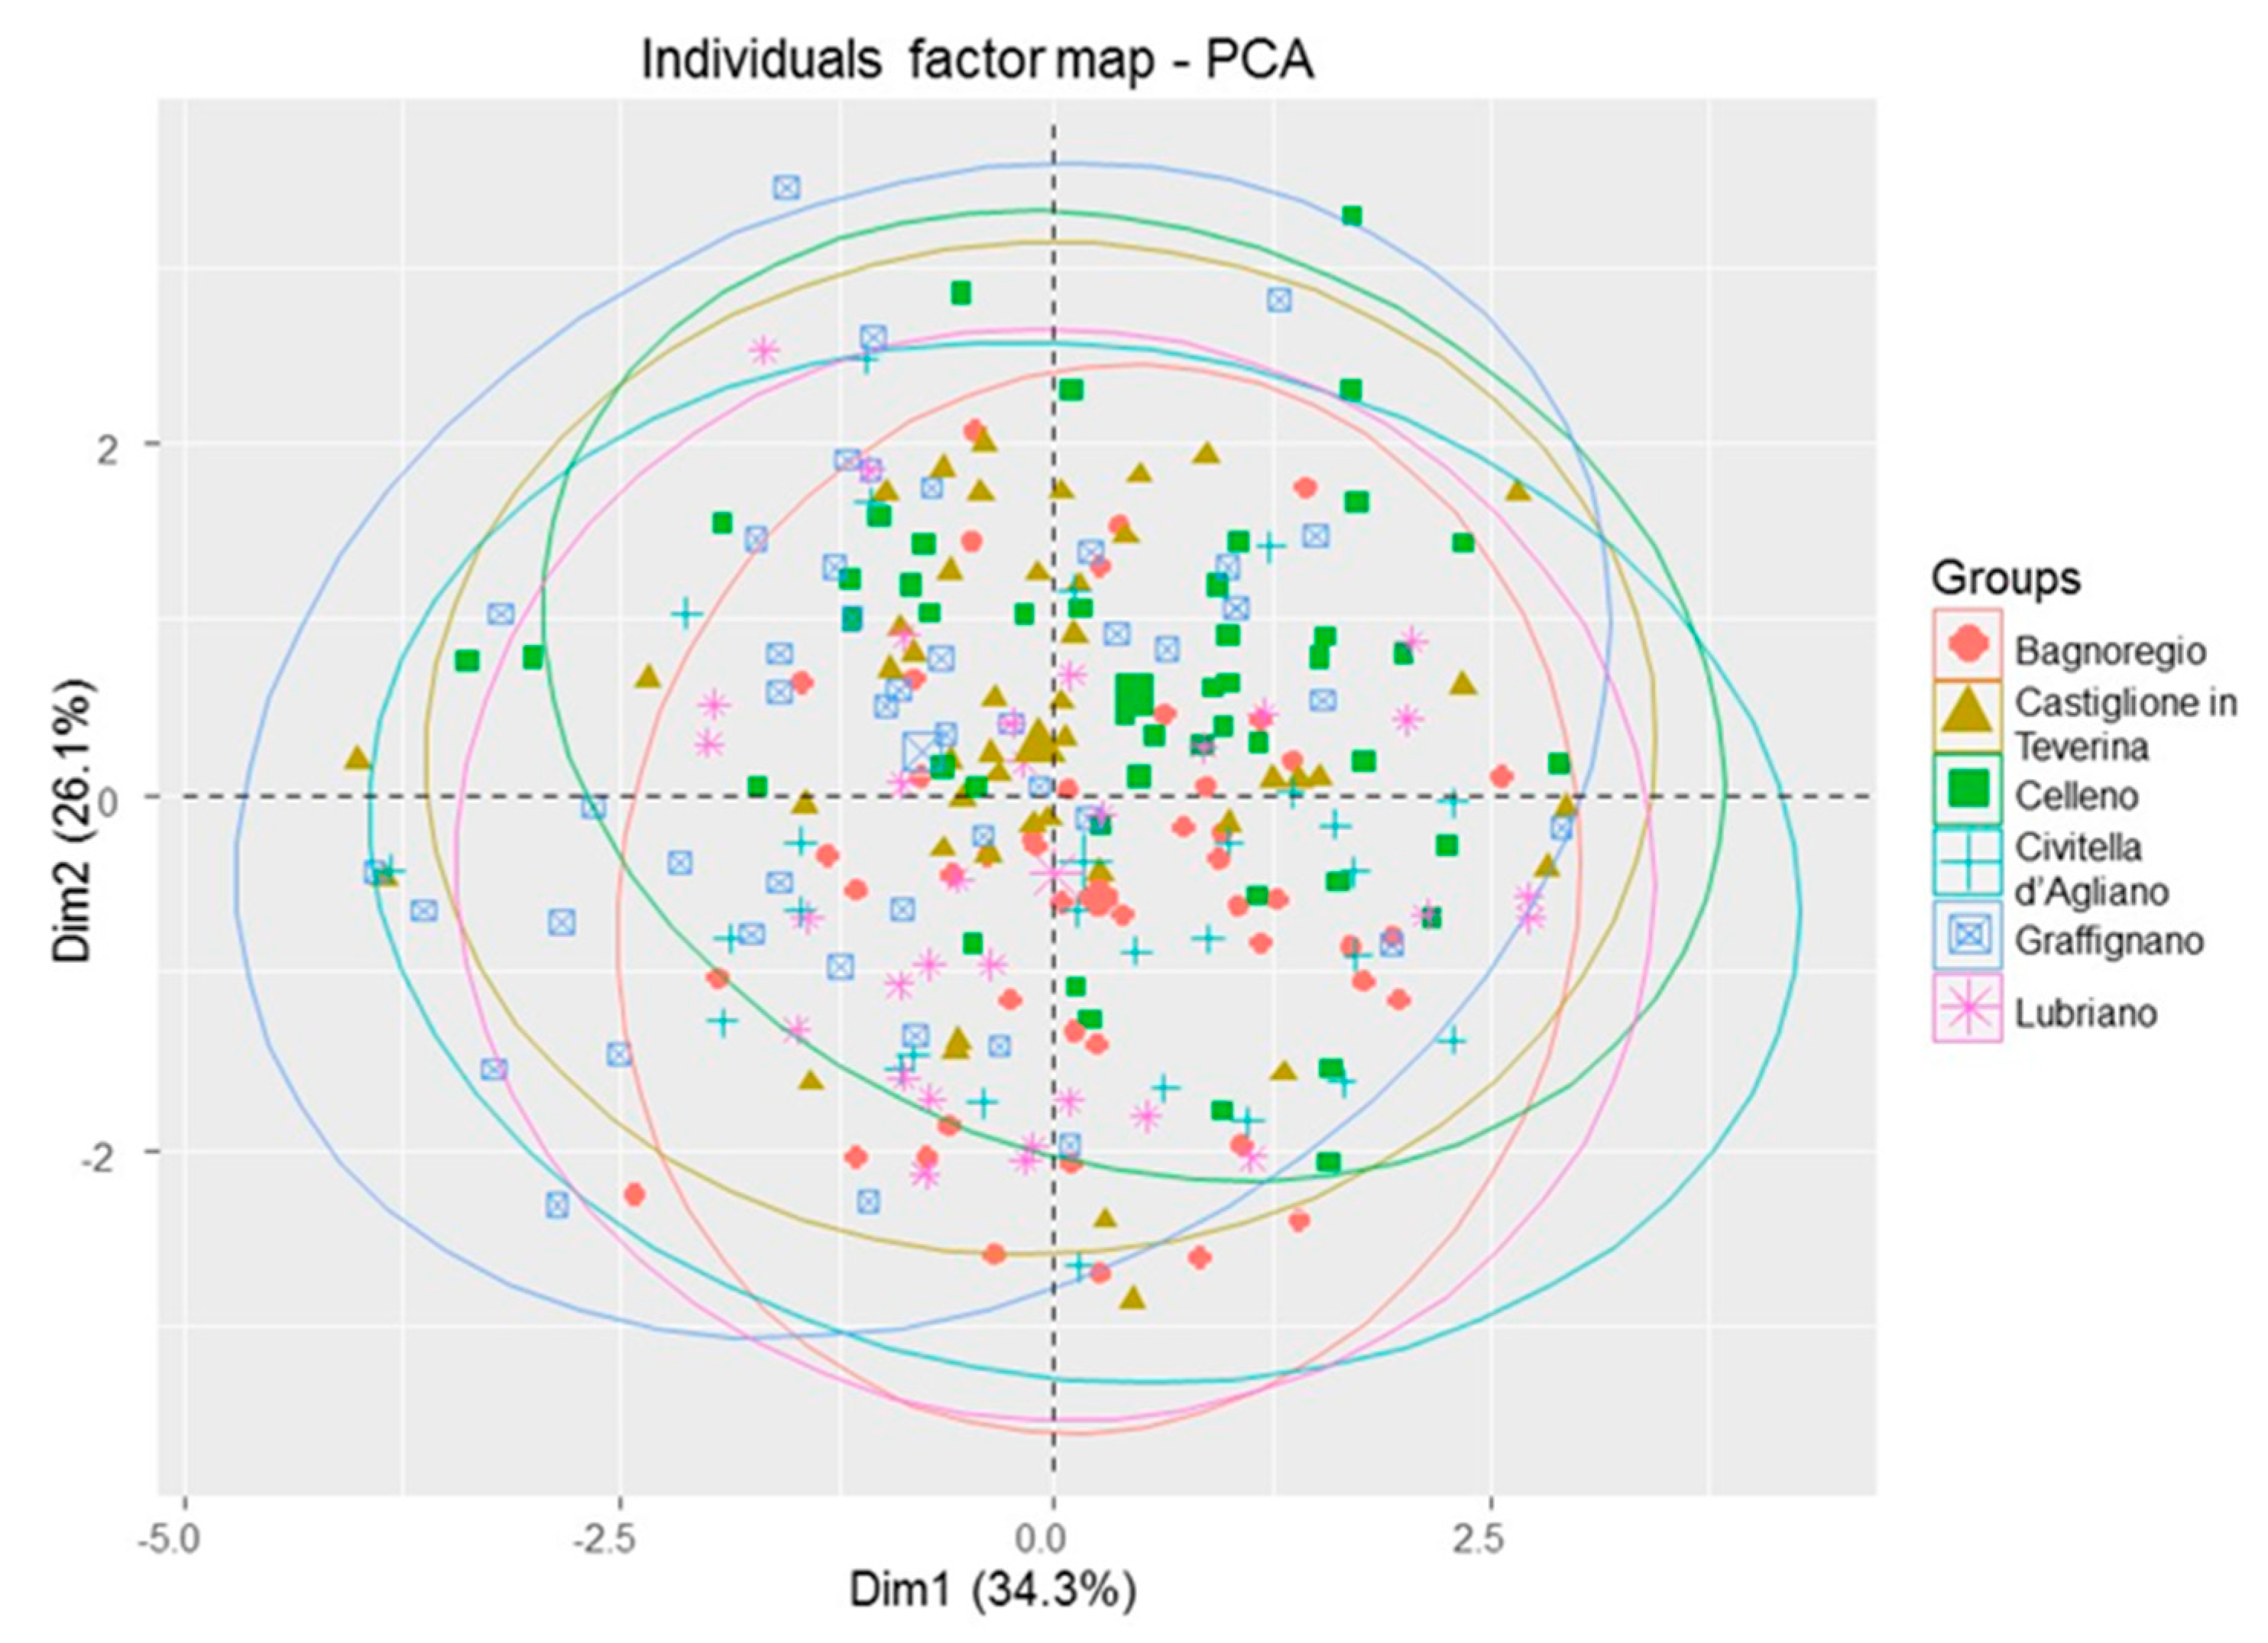
Figure 5 allows us to analyze whether the two main components related to the totality of the LAG are correlated with the municipalities of residence of the investigated resources. This figure shows the placement of respondents according to the supplementary variable “municipality of residency”. Figure 5 shows a very weak link between the “municipality of residency” and the rankings.
Although the first two principal components do not appear correlated with the municipalities, using cluster analysis we tried to see if there are clusters linked to them.
To assess whether the data contains any inherent grouping structure we examined the clustering tendency with a statistical and a visual method. Since the value of the Hopkin’s statistic is 0.37, we can conclude that the dataset is significantly clusterable, because that value is below 0.5 [64,70]. The Visual Assessment of the cluster tendency detects the clustering tendency in a visual form by counting the number of square shaped green blocks along the diagonal in Figure 6. We are looking for blocks which could refer to the six municipalities, and in the figure it is possible to identify six green blocks.
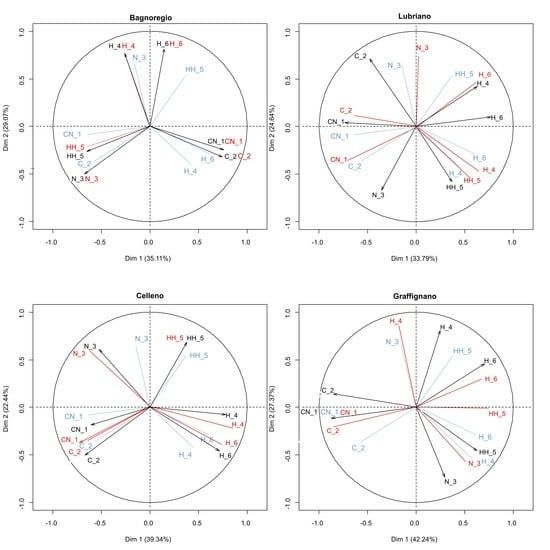
The cluster analysis produced the dendrogram represented in Figure 7. The agglomerative coefficient (0.95) indicates an optimal dataset structure. To obtain six clusters we cut the dendrogram at 1.7 (dotted line in the figure). We studied the distribution of the residents of the municipalities inside them to understand if the six clusters could be explained using the "municipality of residency". The first and the sixth identified clusters are not related to a specific municipality, however the others offer very interesting results. Indeed, the clusters 2, 3, 4 and 5 include only respondents that are residents in Lubriano, Bagnoregio, Celleno, and Graffignano, respectively. Cluster 3 includes 87% of respondents of the total residents of Bagnoregio in the sample, cluster 5 includes 75% of Graffignano, cluster 2 includes the 70% of Lubriano, and cluster 4 includes 65% of Celleno. Figure A1 in Appendix A displays the PCA for the four municipalities.
The comparison between the results for these four municipalities with the totality of the LAG is shown in Table 1.
Table 1 shows the differences between the medians and amplitudes of the box plots (in the table called "agreement") between a single municipality and the LAG. Positive values for the differences between the medians imply an increase in the sense of belonging to the investigated municipality rather than the LAG, and positive values of the "agreement" indicate an increase of agreement among the residents around the evaluation.
4. Discussion
4.1. Answers to the Questions of the Research
(i) Does the local community of a LAG have a sense of belonging with the entire territory of the LAG? The comparison between the sample of respondents and the “control group” suggests that residents of the LAG have developed a doubtful sense of belonging to the entire area of the LAG. The control group ranked the landscapes based on the beauty of the photos, while the sample based on the sense of belonging with the places. The same ranking was obtained by both the residents within the LAG and residents within the region but outside the study area, giving rise to doubt as to whether the quality of the photos and the beauty of the images influenced the respondents. Generally, it is easier to affirm a strong sense of belonging with a beautiful photo than one that is less appealing.
(ii) Does the sense of belonging vary based on the typologies of resources?
The results seem to show that the respondents of the sample have a sense of belonging with the agricultural and natural resources more than the small historic towns that occupy the last positions in the ranking (H4 and H6). At the same time, the control group gave the same ranking based on the beauty of the images. For this reason, the value of this result is doubtful.
Instead, the results regarding the internal structure of the sample are interesting. Indeed, considering each respondent as a cluster of their own (330 clusters), and merging iteratively the most similar clusters until there is just one single big cluster, the results show clusters strongly linked with the municipality of residence. This means that between municipalities there are differences in the declared sense of belonging with the photos.
Observing the different results obtained by municipalities in Table 1, it can be concluded that the sense of belonging of the local community is mainly linked to the cultural historical resources of the municipalities of residence. Indeed, the photos of the historical centers (H4; H6) had a clear increase in their position on the ranking for the municipalities where they are located.
With regards to agricultural resources, there are no meaningful results related to the sense of belonging.
With regards to natural resources, it is interesting to observe the results in the badlands (N3). The badlands are a type of dry terrain extensively eroded by wind and water. Canyons, mesas, hoodoos, and other such geologic forms are common in the badlands. This is a natural resource scattered across the whole area of study, and is fascinating in its appearance but problematic for the production of crops. The paper shows that only those municipalities that have protected these badlands by creating a Site of Community Importance (SCI area; the municipalities are Lubriano and Bagnoregio) feel a sense of belonging with them. These protected areas are defined in the European Commission Habitats Directive (92/43/EEC) as sites which contribute significantly to the enhancement or restoration of a good conservation status of a natural habitat type, and may contribute significantly to the maintenance of the biological diversity within the biogeographic region or regions concerned.
This result raises an interesting new question for further research regarding the role of SCI areas in the development of the sense of place.
Although the Local Development Plans of the LAG “In Teverina” developed various participatory processes involving the whole local community, the results of the paper are not performance indicators for these processes, because there is no baseline to compare the sense of belonging with the whole area of study before the adoption of the plans of the LAG. Our results could be a starting point to evaluate future Local Development Plans of this LAG.
4.2. Potential for Applying IESOP to Other LAGs
Many researchers have shown that the involvement of local communities in Local Development Plans plays a crucial role in the enhancement of the territory [9,19,71,72,73,74,75,76,77]. Stojcheska et al. [18] observed that the rural policy “should be tailor made, based on the beneficiaries’ needs and perceptions, and not just a ‘copy-paste’ solution designed for other circumstances” (p. 80).
This paper suggests the use of the sense of belonging of the local communities with their territories as a performance indicator of the participatory processes in rural territories.
This indicator is particularly suitable to evaluate the plans of the European LAGs for these reasons:
- Although there is a high degree of diversity in the Local Development Plans of the European LAGs [11,12,13,14,15], every LAG produces a Local Development Plan to achieve community led local development. The priority themes of the plans are set by the European Commission and are considered to be of special interest at the community level. The participatory processes play a central role in them;
- The ongoing construction and maintenance of the structures of community feeling require an everyday effort [47]. A strategy to reinforce in the rural community the sense of belonging with the territory is a “slow process”, occurring over a long duration of time. In Europe, the participatory strategies of the LAGs could help in these processes, because their Plans of Local Development change every six years;
- European programming requires performance indicators for funded projects. The IESOP proposes a performance indicator relating to the valorization of the sense of belonging with places.
The study of the local community and the study of their sense of belonging to the territories of the LAG would help to make more effective the different Rural Development Programs in the successive period of programming for the 28 European States.
4.3. Weaknesses of the Method
The two phases of IESOP require meeting the same people twice. This results in significant difficulties in being able to complete the interviews, as the respondents are asked about their willingness to be contacted again. At the same time, the evaluation of the perception of each participatory process that includes the involvement of a community takes time. For the meaningful engagement of the respondents, they need time to reflect on their choices and to change their minds if necessary [75].
The second phase of IESOP involves the comparison between photos of LRLs. The picture quality should be the same to limit its influence on people’s choices. As for the present work, the photo of the historical center of Graffignano (Figure 3f) is too close up, and there is a parked camper in the foreground. It was not possible to find a more distant shot, because the vegetation and the topography of the place prevented the view of the historic center from a greater distance. Furthermore, the camper remained there for the whole time of the reliefs. To have an objectively worse picture than the others made it possible to emphasize the result regarding the attachment of the residents to their town’s historical centers. For this consideration, it is enough to look at the results for the photo of H_6 in Table 1.
Finally, IESOP needs local experts with knowledge of the territories to manage the participatory process, for checking the landscapes shown in the identification phase and indicating how to classify them typologically, for evaluating the municipalities that have a relationship with them, and for understanding the local peculiarity linked to the statistic results. The typological classification of resources proposed in Section 2.2. (physical/natural, historical /cultural, and agricultural/productive) is based on the knowledge of the LAG “In Teverina”. The classifications may vary, such as Clementi [78] and Antognelli and Vizzari [79], in works related to the evaluation of the quality of the landscape where the proposed types are physical-natural, historical-cultural, and socio-symbolic.
5. Conclusions
This study offers a method for evaluating the sense of belonging of local communities with the places where they live. This method has two innovative peculiarities:
- The evaluations are organized by the typology of resources for understanding the relationships between people’s place attachment and the resources that are in the place.
- The evaluations are completed in a multiscale manner, for identifying the spatial relationships between people, resources, and sense of belonging with the resources (boundaries of the municipalities and boundary of the whole LAG).
Regarding the case under study, the paper shows that the people who live in the territory of the LAG “In Teverina” do not recognize themselves in the typical crops of the entire area, and attachment to the minor historical centers scattered in the territory remains the prerogative of individual municipalities. This shows that the LAG did not succeed yet in building a shared perception of the typical agricultural landscape of the area, and has not managed to go beyond the typical parochialism of rural communities of central Italy. These results confirm the reflections of Neal and Walters [47] and Mee and Wright [48], about the place attachment of the people in rural communities. Indeed, the sense of belonging is closely linked to the boundaries of the rural municipalities. An important aim of the LAGs should be the developing of the sense of belonging at a different scale.
Generally, the LAGs manage considerable European funds and have a primary role in rural development. Currently, the policy of the LAGs allows organic rural development, coordinating the decisions of individual farmers, but the objective of sustainable rural development requires that decisions must be taken together with the farmers and the entire local community living in the territory. The traditional practices of planning and land management for many years have entrusted the Public Administration with the responsibility for protection and territorial transformation, resulting in a gradual estrangement of communities from the places where they live [80]. The sense of belonging with a place affects the ability of the same to trigger sustainable development paths. The practice of participation can be a way to reconnect the community with the territory. In participatory processes, the involvement of a local community with a strong sense of belonging with their territories not only facilitates its empowerment and the implementation of interventions, but the local community also becomes the first to try to manage better [19,81].
The method offers a performance indicator that could be calculated by repeating the process before and after an inclusive strategy for the development of the sense of community, and by comparing the resulting values. This indicator could help to evaluate the local plans in rural areas, particularly for the 893 European LAGs of the LEADER Community Initiative. The method offers them an indicator of the impact of their strategies on the whole community that lives in their territory.
Author Contributions
Conceptualization, M.E.M.; Data curation, S.A. and D.G.; Formal analysis, M.E.M. and D.G.; Investigation, S.A.; Methodology, M.E.M. and D.G.; Project administration, M.E.M. and P.B.; Software, M.E.M.; Supervision, M.E.M., P.B. and D.G.; Validation, M.E.M. and D.G.; Visualization, M.E.M. and D.G.; Writing–original draft, M.E.M.; Writing–review and editing, D.G.
Acknowledgments
The authors thank Federica Gobattoni (Univerity of Tuscia) for her revision of the paper as local expert of the LAG, and Caterina Boccioli (University of Perugia) for her technical support for checking the dataset.
Conflicts of Interest
The authors declare no conflict of interest.
Appendix A
The first two components of the principal component analysis for the municipalities that are represented by the clusters of Figure 7. LAG residents are colored in blue, municipality residents in black, and the corresponding cluster in red.
Figure A1.
Principal Component Analysis for residents of municipalities of Bagnoregio, Lubriano, Celleno and Graffignano (black vectors of the graphs). In every graph the LAG residents are colored in blue, municipality residents in black, and the corresponding cluster in red.
Figure A1.
Principal Component Analysis for residents of municipalities of Bagnoregio, Lubriano, Celleno and Graffignano (black vectors of the graphs). In every graph the LAG residents are colored in blue, municipality residents in black, and the corresponding cluster in red.

References
- United Nations Economic Commission for Europe (UNECE). Convention on Access to Information, Public Participation in Decision-Making and Access to Justice in Environmental Matters; UNECE: Brussel, Belgium, 1998. [Google Scholar]
- Council of Europe. European Landscape Convention. 2000. Available online: http://www.coe.int/en/web/conventions/full-list/-/conventions/treaty/176 (accessed on 18 October 2018).
- European Parliament Directive 2003/35/EC. Providing for public participation in respect of the drawing up of certain plans and programmes relating to the environment and amending with regard to public participation and access to justice Council Directives 85/337/EEC and 96/61/EC. Off. J. Eur. Union 2003, 156, 17–25. [Google Scholar]
- Eurostat. Statistic Explained. Land Cover, Land Use and Landscape. Available online: http://ec.europa.eu/eurostat/web/lucas/overview (accessed on 18 October 2018).
- Ray, C. The EU LEADER Programme: Rural Development Laboratory. Sociol. Rural. 2000, 40, 163–171. [Google Scholar] [CrossRef]
- Shucksmith, M. Endogenous development, social capital and social inclusion: perspectives from LEADER in the UK. Sociol. Rural. 2000, 40, 208–218. [Google Scholar] [CrossRef]
- Dargan, L.; Shucksmith, M. LEADER and innovation. Sociol. Rural. 2008, 48, 274–291. [Google Scholar] [CrossRef]
- Shortall, S. Are rural development programs socially inclusive? Social inclusion, civic engagement, participation and social capital: exploring the differences. J. Rural Stud. 2008, 24, 450–457. [Google Scholar] [CrossRef]
- Esparcia, J.; Escribano, J.; Serrano, J. From development to power relations and territorial governance: Increasing the leadership role of LEADER Local Action Groups in Spain. J. Rural Stud. 2015, 42, 29–42. [Google Scholar] [CrossRef]
- European Commission. Leader+. 2016. Available online: https://ec.europa.eu/agriculture/rur/leaderplus/index_en.html (accessed on 18 October 2018).
- European Network for Rural Development (ENRD). The Implementation of the Bottom-Up Approach. Extended Report; European Network for Rural Development: Brussels, Belgium, 2010. [Google Scholar]
- European Network for Rural Development (ENRD). Supplementary Report on Specific Aspects of LEADER Approach Implementation; European Network for Rural Development: Brussels, Belgium, 2011. [Google Scholar]
- Nardone, G.; Sisto, R.; Lopolito, A. Social Capital in the LEADER Initiative: a methodological approach. J. Rural Stud. 2010, 26, 63–72. [Google Scholar] [CrossRef]
- Falkowski, J. Political accountability and governance in rural areas: Some evidence from the Pilot Programme LEADER+ in Poland. J. Rural Stud. 2013, 32, 70–79. [Google Scholar] [CrossRef]
- Palmisano, G.O.; Govindan, K.; Boggia, A.; Loisi, R.V.; De Boni, A.; Roama, R. Local Action Groups and Rural Sustainable Development. A spatial multiple criteria approach for efficient territorial planning. Land Use Policy 2016, 59, 12–26. [Google Scholar] [CrossRef]
- European Parliament. Regulation 1303/2013. Available online: http://eur-lex.europa.eu/legal-content/EN/TXT/PDF/?uri=CELEX:32013R1303andfrom=en (accessed on 18 October 2018).
- Marzban, S.; Allahyari, M.S.; Damalasb, C.A. Exploring farmers’ orientation towards multifunctional agriculture: Insights from northern Iran. Land Use Policy 2016, 59, 121–129. [Google Scholar] [CrossRef]
- Stojcheskaa, A.M.; Kotevskaa, A.; Bogdanov, N.; Nikolic, A. How do farmers respond to rural development policy challenges? Evidence from Macedonia, Serbia and Bosnia and Herzegovina. Land Use Policy 2016, 59, 71–83. [Google Scholar] [CrossRef]
- Menconi, M.E.; Grohmann, D.; Mancinelli, C. European farmers and participatory rural appraisal: A systematic literature review on experiences to optimize rural development. Land Use Policy 2017, 60, 1–11. [Google Scholar] [CrossRef]
- Bernués, A.; Tello-García, E.; Rodríguez-Ortega, T.; Ripoll-Boschc, R.; Casasús, I. Agricultural practices, ecosystem services and sustainability in High Nature Value farmland: Unraveling the perceptions of farmers and nonfarmers. Land Use Policy 2016, 59, 130–142. [Google Scholar] [CrossRef]
- Stenseke, M. Local Participation in Cultural Landscape Maintenance: Lessons from Sweden. Land Use Policy 2009, 26, 214–223. [Google Scholar] [CrossRef]
- Ruiz, J.; Domon, G. Relationships between Rural Inhabitants and their Landscapes in Areas of Intensive Agricultural Use: A Case Study in Quebec (Canada). J. Rural Stud. 2012, 28, 590–602. [Google Scholar] [CrossRef]
- Trell, E.M.; van Hoven, B.; Huigen, P. ‘It’s good to live in Järva-Jaani but we can’t stay here’: Youth and belonging in rural Estonia. J. Rural Stud. 2012, 28, 139–148. [Google Scholar] [CrossRef]
- Paasi, A. Region and place: Regional identity in question. Prog. Hum. Geogr. 2003, 27, 475–485. [Google Scholar] [CrossRef]
- Brown, G.; Raymond, C. The relationship between place attachment and landscape values: Toward mapping place attachment. Appl. Geogr. 2007, 27, 89–111. [Google Scholar] [CrossRef]
- Manzo, L.C. Beyond house and have: Towards a revisioning of emotional relationships with places. J. Environ. Psychol. 2003, 23, 47–61. [Google Scholar] [CrossRef]
- Butz, J.; Eyles, J. Reconceptualizing senses of place: Social relations, ideology and ecology. Geogr. Ann. 1997, 79, 1–25. [Google Scholar] [CrossRef]
- Kruger, L.E.; Shannon, M.A. Getting to know ourselves and our places through participation in civic social assessment. Soc. Nat. Resour. 2000, 13, 461–478. [Google Scholar]
- Bennett, J. Gifted places: The inalienable nature of belonging in place. Environ. Plan. D Soc. Space 2014, 32, 658–671. [Google Scholar] [CrossRef]
- Peters, K.; Stodolska, M.; Horolets, A. The role of natural environments in developing a sense of belonging: A comparative study of immigrants in the U.S., Poland, the Netherlands and Germany. Urban For. Urban Green. 2016, 17, 63–70. [Google Scholar] [CrossRef]
- Dale, A.; Ling, C.; Newman, L. Does place matter? Sustainable community development in three Canadian communities. Ethics Place Environ. 2008, 11, 267–281. [Google Scholar] [CrossRef]
- Shamai, S. Sense of place: An empirical measurement. Geoforum 1991, 22, 347–358. [Google Scholar] [CrossRef]
- Stedman, R. Is it really just a social construction? The contribution of the physical environment to sense of place. Soc. Nat. Resour. 2003, 16, 671–685. [Google Scholar] [CrossRef]
- Vogt, C.A.; Marans, R.W. Natural resources and open space in the residential decision process: A study of recent movers to fringe counties in southeast Michigan. Landsc. Urban Plan. 2004, 69, 255–269. [Google Scholar] [CrossRef]
- Brown, G.G.; Reed, P.; Harris, C.C. Testing a place-based theory for environmental evaluation: An Alaska case study. Appl. Geogr. 2002, 22, 49–76. [Google Scholar] [CrossRef]
- Norton, B.G.; Hannon, B. Environmental values: A place-based theory. Environ. Ethics 1997, 19, 227–245. [Google Scholar] [CrossRef]
- Relph, E. Place and Placelessness; Pion: London, UK, 1976. [Google Scholar]
- Tuan, Y.F. Sense of Place: The Perspective of Experience; University of Minnesota: Minneapolis, MN, USA, 1977. [Google Scholar]
- Hidalgo, M.C.; Hernandez, B. Place attachment: Conceptual and empirical questions. J. Environ. Psychol. 2001, 21, 273–281. [Google Scholar] [CrossRef]
- Hillayard, S.; Bagley, C. Community strikes back? Belonging and exclusion in rural English villages in networked times. Int. J. Incl. Educ. 2015, 19, 748–758. [Google Scholar] [CrossRef]
- Eisenhauer, B.W.; Krannich, R.S.; Blahna, D.J. Attachments to special places on public lands: An analysis of activities, reason for attachments and community connections. Soc. Nat. Resour. 2000, 13, 421–441. [Google Scholar]
- Pretty, G.H.; Chipuer, H.M.; Bramston, P. Sense of place amongst adolescents and adults in two rural Australian towns: The discriminating features of place attachment, sense of community and place dependence in relation to place identity. J. Environ. Psychol. 2003, 23, 273–287. [Google Scholar] [CrossRef] [Green Version]
- Cuba, L.; Hummon, D. A place to call home: Identification with dwelling, community and region. Sociol. Q. 1993, 34, 111–131. [Google Scholar] [CrossRef]
- Vorkinn, M.; Riese, H. Environmental concern in a local context. The significance of place attachment. Environ. Behav. 2001, 33, 249–263. [Google Scholar] [CrossRef]
- Kaltenborn, B.P.; Bjerke, T. Associations between environmental value orientations and landscape preferences. Landsc. Urban Plan. 2002, 59, 1–11. [Google Scholar] [CrossRef]
- Venables, D.; Pidgeon, N.F.; Parkhill, K.A.; Henwood, K.L.; Simmons, P. Living with nuclear power: sense of place, proximity, and risk perceptions in local host communities. J. Environ. Psychol. 2012, 32, 371–383. [Google Scholar] [CrossRef]
- Neal, S.; Walters, S. Rural Be/longing and Rural Social Organizations: Conviviality and Community-Making in the English Countryside. Sociology 2008, 42, 279–297. [Google Scholar] [CrossRef]
- Mee, K.; Wright, S. Geographies of Belonging. Environ. Plan. A 2009, 41, 772–779. [Google Scholar] [CrossRef]
- Jorgenson, B.S.; Stedman, R.C. Sense of place as an attitude: Lakeshore owners attitude towards their properties. J. Environ. Psychol. 2001, 21, 233–248. [Google Scholar] [CrossRef]
- Lin, C.; Lockwood, M. Forms and sources of place attachment: Evidence from two protected areas. Geoforum 2014, 53, 74–81. [Google Scholar] [CrossRef]
- Scannell, L.; Gifford, R. Defining place attachment: a tripartite organizing framework. J. Environ. Psychol. 2010, 30, 1–10. [Google Scholar] [CrossRef]
- Wood, N.; Waite, L. Scales of belonging. Emot. Space Soc. 2011, 4, 201–202. [Google Scholar] [CrossRef]
- Muller, S.; Power, E.R.; Suchet-Pearson, S.; Wright, S.; Lloyd, K. ‘Quarantine matters!’: Quotidian relationships around quarantine in Australia’s northern borderlands. Environ. Plan. A 2009, 41, 780–795. [Google Scholar] [CrossRef]
- Instone, L. Northern belongings: frontiers, fences, and identities in Australia’s urban north. Environ. Plan. A 2009, 41, 827–841. [Google Scholar] [CrossRef]
- Carter, D.; Merrill, H. Bordering humanism: life and death on the margins of Europe. Geopolitics 2007, 12, 248–264. [Google Scholar] [CrossRef]
- Gilbert, E. Money, citizenship, territoriality and the proposals for North American Monetary Union. Political Geogr. 2007, 26, 141–158. [Google Scholar] [CrossRef]
- Phillips, M. Changing Class Complexions on and in the British Countryside. J. Rural Stud. 2007, 23, 283–304. [Google Scholar] [CrossRef]
- Blunt, A.; Dowling, R. Home; Routledge: London, UK, 2006. [Google Scholar]
- Morley, D. Belongings: Place, space and identity in a mediated world. Eur. J. Cult. Stud. 2001, 4, 425–448. [Google Scholar] [CrossRef]
- GAL (Gruppo di Azione Locale—Local Action Group) In Teverina Plan of Local Development (Piano di Sviluppo Locale). Available online: http://www.galinteverina.it/ (accessed on 18 October 2018). (In Italian).
- R Development Core Team. R: A Language and Environment for Statistical Computing; R Foundation for Statistical Computing: Vienna, Austria, 2018; Available online: https://cran.r-project.org (accessed on 18 October 2018).
- Husson, F.; Le, S.; Pages, J. Exploratory Multivariate Analysis by Example Using R; CRC Press: Boca Raton, FL, USA, 2010. [Google Scholar]
- Crawley, M. The R Book; John Wiley and Sons: Chichester, UK, 2007. [Google Scholar]
- Kassambara, A. Unsupervised Machine Learning by Example in R; STHDA: Montpellier, France, 2016. [Google Scholar]
- MacQueen, J. Some methods for classification and analysis of multivariate observations. In Proceedings of the Fifth Berkeley Symposium on Mathematical Statistics and Probability, Berkely, CA, USA, 7 January 1966; University of California Press: Berkeley, CA, USA, 1967; pp. 281–297. [Google Scholar]
- Fraley, C.; Raftery, A.E. How Many Clusters? Which Clustering Method? Answers via Model-Based Cluster Analysis. Comput. J. 1998, 41, 578–588. [Google Scholar] [CrossRef]
- Boslaugh, S. Encyclopedia of Epidemology; SAGE Publication: Los Angeles, CA, USA, 2008. [Google Scholar]
- Margottini, C. Low environmental impact consolidation works in the rock cliff of Civita di Bagnoregio (Central Italy). In Landslide Science in Practice: Risk Assessment and Mitigation; Margottini, C., Canuti, P., Sassa, K., Eds.; Springer: Heidelberg/Berlin, Germany; New York, NY, USA, 2013. [Google Scholar]
- Delmonaco, G.; Margottini, C.; Spizzichino, D. Geomorphologic Evolution of Civita di Bagnoregio in the Last Thousand Years. In Proceedings of the International Symposium on Conservation and Sustainable Development of the Tuff Towns—An Exploration of Pitigliano, Civita di Bagnoregio, Italy, 14–17 May 2008. [Google Scholar]
- De Maesschalck, R.; Estienne, F.; Verdu-Andres, J.; Candolfi, A.; Centner, V.; Despagne, F.; Jouan-Rimbaud, D.; Walczak, B.; Massart, D.L.; de Jong, S.; et al. The development of calibration models for spectroscopic data using principal component regression. Int. J. Chem. 1999, 2, 1. [Google Scholar]
- Dougill, A.J.; Fraser, E.D.; Holden, J.; Hubacek, K.; Prell, C.; Reed, M.S.; Stagl, S.; Stringer, L.C. Learning from doing participatory rural research: Lessons from the Peak District. National Park. J. Agric. Econ. 2006, 57, 259–275. [Google Scholar] [CrossRef]
- Santos, R.; Antunes, P.; Baptista, G.; Mateus, P.; Madruga, L. Stakeholder participation in the design of environmental policy mixes. Ecol. Econ. 2006, 60, 100–110. [Google Scholar] [CrossRef]
- Prager, K.; Freese, J. Stakeholder involvement in agri-environmental policy making-learning from a local- and a state-level approach in Germany. J. Environ. Manag. 2009, 90, 1154–1167. [Google Scholar] [CrossRef] [PubMed]
- Guzmán, G.I.; López, D.; Román, L.; Alonso, A.M. Participatory Action Research in Agroecology: Building local organic food networks in Spain. Agroecol. Sustain. Food Syst. 2013, 37, 127–146. [Google Scholar] [CrossRef]
- McManus, P.; Walmsley, J.; Argent, N.; Baum, S.; Bourke, L.; Martin, J.; Pritchard, B.; Sorensen, T. Rural Community and Rural Resilience: What is Important to Farmers in Keeping their Country Towns Alive? J. Rural Stud. 2012, 28, 20–29. [Google Scholar] [CrossRef]
- Vaske, J.J.; Kobrin, K.C. Place attachment and environmentally responsible behavior. J. Environ. Psychol. 2001, 32, 116–121. [Google Scholar] [CrossRef]
- Osterman, K.F. Students’ need for belonging in the school community. Rev. Educ. Res. 2000, 70, 323–367. [Google Scholar] [CrossRef]
- Clementi, A. Interpretations of Landscape, European Convention and Methodological Innovations (Interpretazioni di Paesaggio, Convenzione Europea e Innovazioni di Metodo); Meltemi: Rome, Italy, 2002. (In Italian) [Google Scholar]
- Antognelli, S.; Vizzari, M. Ecosystem and urban services for landscape liveability: A model for quantification of stakeholders’ perceived importance. Land Use Policy 2016, 50, 277–292. [Google Scholar] [CrossRef]
- Magnaghi, A. Il Progetto Locale. Verso la Coscienza di Luogo (Local Planning. Towards the Consciousness of a Place); Bollati Boringhieri: Torino, Italy, 2000. (In Italian) [Google Scholar]
- Jolley, G. Evaluating complex community-based health promotion: Addressing the challenges. Eval. Program Plan. 2014, 45, 71–81. [Google Scholar] [CrossRef] [Green Version]
Figure 1.
Flowchart of the IESOB (Identification and Evaluation of the Sense of Belonging) method.

Figure 2.
Study area: The Local Action Groups (LAG) “In Teverina”.

Figure 3.
Local Representative Landscapes (LRLs) of LAG “In Teverina”. (a) countryside with olive and cherry trees, (b) countryside with olives and grapevines, (c) valley of badlands, (d) historic center of Celleno, (e) Civita di Bagnoregio, (f) historic center of Graffignano.
Figure 3.
Local Representative Landscapes (LRLs) of LAG “In Teverina”. (a) countryside with olive and cherry trees, (b) countryside with olives and grapevines, (c) valley of badlands, (d) historic center of Celleno, (e) Civita di Bagnoregio, (f) historic center of Graffignano.

Figure 4.
The first two components of the principal component analysis (a) and box plots of LRLs (b) for: Residents outside the region (1), residents inside the region, but outside the LAG (2), and residents of the LAG (3). (a1) and (b1) show the principal component analysis and the box plots for residents outside region, (a2) and (b2) show the principal component analysis and the box plots for resident outside the LAG, (a3) and (b3) show the principal component analysis and the box plots for residents of the LAG. To help in the comparison, the results of the residents of the LAG are duplicated using a blue color in every graph.

Figure 5.
Representation of the first two components of the principal component analysis for the LAG’s residents, colored by the municipality of residence with probability ellipses (normal probability level of 0.95).
Figure 5.
Representation of the first two components of the principal component analysis for the LAG’s residents, colored by the municipality of residence with probability ellipses (normal probability level of 0.95).

Figure 6.
Visual Assessment of the cluster tendency.

Figure 7.
Dendrogram resulting from the cluster analysis.


Table 1.
Numeric assessment of the change in the sense of belonging between single municipalities and the LAG. The row “cluster” reports the number of the corresponding cluster of Figure 7, and the percentage of the residents of the municipality included inside the cluster. The records “diff_median” and “agreement” report the difference between the medians and between the widths of the box plots for a single municipality and the LAG.
| Municipalities | Bagnoregio | Celleno | Graffignano | Lubriano | |
|---|---|---|---|---|---|
| cluster | n (%) | 3 (87) | 4 (65) | 5 (75) | 2 (70) |
| LRLs | |||||
| CN_1 | diff_median | 0.67 | 1.33 | –2.67 | –0.33 |
| agreement | 1.08 | 2.00 | 0.83 | 0.00 | |
| C_2 | diff_median | −0.83 | 1.00 | −0.67 | 0.00 |
| agreement | 0.50 | 0.00 | 0.00 | −1.33 | |
| N_3 | diff_median | 1.18 | −1.66 | −0.32 | 1.68 |
| agreement | 0.00 | −0.50 | 0.17 | −1.33 | |
| H_4 | diff_median | −0.50 | 1.67 | 0.33 | −1.00 |
| agreement | 0.33 | 0.67 | 1.17 | 1.00 | |
| HH_5 | diff_median | 0.33 | −1.33 | −0.33 | 1.33 |
| agreement | 1.67 | 1.50 | 0.17 | 0.00 | |
| H_6 | diff_median | −1.67 | −1.00 | 3.,00 | 0.33 |
| agreement | 0.67 | 1.00 | 0.67 | 1.00 | |
© 2018 by the authors. Licensee MDPI, Basel, Switzerland. This article is an open access article distributed under the terms and conditions of the Creative Commons Attribution (CC BY) license (http://creativecommons.org/licenses/by/4.0/).
Share and Cite
MDPI and ACS Style
Menconi, M.E.; Artemi, S.; Borghi, P.; Grohmann, D. Role of Local Action Groups in Improving the Sense of Belonging of Local Communities with Their Territories. Sustainability 2018, 10, 4681. https://doi.org/10.3390/su10124681
AMA Style
Menconi ME, Artemi S, Borghi P, Grohmann D. Role of Local Action Groups in Improving the Sense of Belonging of Local Communities with Their Territories. Sustainability. 2018; 10(12):4681. https://doi.org/10.3390/su10124681
Chicago/Turabian StyleMenconi, Maria Elena, Sara Artemi, Piero Borghi, and David Grohmann. 2018. "Role of Local Action Groups in Improving the Sense of Belonging of Local Communities with Their Territories" Sustainability 10, no. 12: 4681. https://doi.org/10.3390/su10124681
Note that from the first issue of 2016, this journal uses article numbers instead of page numbers. See further details here.