User Willingness toward Knowledge Sharing in Social Networks

1
School of Business, Anhui University, Hefei 230601, China
2
School of Mathematics Science, Anhui University, Hefei 230601, China
*
Author to whom correspondence should be addressed.
Sustainability 2018, 10(12), 4680; https://doi.org/10.3390/su10124680
Submission received: 24 October 2018
/
Revised: 5 December 2018
/
Accepted: 6 December 2018
/
Published: 8 December 2018
(This article belongs to the Special Issue Social Network Analysis and Social Networks in Education for Sustainable Development)
Abstract
:Social networks introduce new potential for people to share knowledge with others. However, it is not clear what factors influence user willingness toward knowledge sharing in social networks. Aiming to answer these questions, in this paper we analyze the major factors influencing user willingness toward knowledge sharing in social networks and propose a new research model that is inspired by the technology acceptance model (TAM). In particular, we introduce a new independent variable called perceived value which is described by four aspects: social value, entertainment value, emotion value, and information value. In addition, we introduce a new mediating variable, trust, to reflect the intermediating relationship between perceived value and knowledge-sharing willingness. We conduct an empirical analysis on questionnaire data and present comprehensive results on reliability and validity, factor analysis, correlation analysis, and mediating effects analysis. The results show that perceived value has a significant impact on knowledge-sharing willingness, and trust plays a partial intermediate role between perceived value and knowledge-sharing willingness. Further, we present some research implications for knowledge sharing and learning innovation in social networks, as well as some suggestions for organizations to advance knowledge sharing and learning innovation in the social-network age.
Keywords:
social network; knowledge sharing; user willingness; perceived value; trust; data analysis1. Introduction
In the current time, social networks have become popular in people’s daily life due to the rapid development of Web 2.0 and mobile Internet applications. According to a recent survey [1], over 90% of Europeans are using social-network sites. Owing to the advantages of social networks, many companies have integrated social networks into innovation of business modes [2]. For instance, Coca-Cola developed “Lyrics Bottle” [3], which is a social-network application. A lyrics bottle contains a two-dimensional code which represents a sample of lyrics from a pop song. Users in social-network platforms can scan the code of the lyrics to listen to the song and share the bottle with their friends. This new application, which attracts many young people who love music and songs, has been regarded as a successful marketing activity in social networks. As a consequence, more and more organizations have realized that social networks have potential value in information communications, learning innovation, and online communities [4].
However, the business values of social networks are impacted by the knowledge-sharing behavior of users. For example, the Lyrics Bottle program of Coca-Cola may have limited influence in Coca-Cola’s businesses if very few users are willing to share their lyrics bottles. To this end, we have to considered a key issue in social networks, i.e., how to quantify and improve user willingness toward knowledge sharing in social networks. In order to deal with this issue, we first need to answer the following questions:
(1) What factors influence user willingness toward knowledge sharing in social networks?
(2) How do these factors impact user willingness toward knowledge sharing in social networks?
Knowledge sharing is helpful for organizations and enterprises to improve their knowledge management and learning innovation. In the social-network era, analyzing user willingness toward knowledge sharing is critical for the future development of social-network-based learning tools and products. For example, organizations can take necessary actions to stimulate user willingness toward knowledge sharing in social networks, so that more users may share their knowledge in social networks, which is helpful for other users to learn new knowledge and therefore improve their professional skills.
In this paper, we focus on the influential relationships between users’ knowledge-sharing behavior and organizational services, and particularly study the factors impacting user willingness toward knowledge sharing in social networks. Specially, we propose a new research model that is inspired by the technology acceptance model (TAM) model [5]. In particular, we introduce a new independent variable, called perceived value, which is described by four aspects: social value, entertainment value, emotion value, and information value. In addition, we introduce a new mediating variable, trust, to reflect the intermediating relationship between perceived value and knowledge-sharing willingness. Based on this model, we conducted a questionnaire on the Internet and made a comprehensive data analysis.
Briefly, we make the following contributions in this paper:
(1) We propose a new research model that is inspired by the TAM model. New variables, including perceived value and trust, are proposed to analyze user willingness toward knowledge sharing in social networks. The differences between our model and TAM include three aspects. First, we replace the independent variables in the TAM model, which are perceived usefulness and perceived ease of use, with perceived value. Second, we define four sub-variables for perceived value. And third, we introduce trust as the mediating variable.
(2) We evaluate user willingness toward knowledge sharing in social networks based on the proposed research model and questionnaire data, and present a number of results in terms of factor analysis, correlation analysis, and mediating effect analysis. The results show that perceived value has a significant impact on user willingness of knowledge sharing in social networks. In addition, trust plays a partial intermediate role between perceived value and knowledge-sharing willingness in social networks.
The study of this paper is helpful for organizations and enterprises to realize the importance of developing knowledge-sharing systems towards social networks. It also reveals and quantifies the major factors that influence user willingness toward knowledge sharing in social networks. Thus, this study can provide valuable management ideas for developing knowledge sharing and learning innovation frameworks in social networks. The study of this paper can also advance the relevant theories of knowledge sharing and learning innovation in social networks.
The remainder of this paper is structured as follows. Section 2 describes the related work and the differences between previous studies and this paper. Section 3 presents the research model as well as the hypotheses. Section 4 describes the details of data collection. In Section 5, we discuss the results of data analysis. Section 6 presents the research implications and suggestions of this study. And, finally, in Section 7 we conclude the paper.
2. Related Work
2.1. Knowledge Sharing in Social Networks
The concept of social network stems from the theory of six degrees of separation [6], which is also known as the small world theory. According to this theory, one person can be connected to a stranger through at most six other persons. Thus, people can expand their network in society and finally form a big social network. Generally, social networks can provide a number of new applications and services, such as news feature exploration [7], event monitoring [8,9], and sentiment analysis of reviews [10].
Social networks offer people a convenient way to post and share knowledge or ideas on the Internet. Thus, we can say that sharing is the core idea of social networks. On the other hand, if people are not willing to share knowledge or ideas in social networks, a social network will have little value for organizations and individuals. Therefore, it is important to model and quantify user willingness toward knowledge sharing in social networks, based on which we are able to carry out effective steps to stimulate user behavior of knowledge sharing.
Thus far, there have been a number of studies focusing on user willingness toward knowledge sharing in social networks. Kwahk and Park [11] pointed out that user willingness toward knowledge sharing in social networks was influenced by the freshness of information in the network. That means if information in the social network is not up-to-date, expectations of information value will not be satisfied, which will lower the willingness of users to share knowledge. Lee at al. studied user willingness toward knowledge sharing in term of user attributes [12]. They found that some attributes of users, including social position, entertainment needs, and occupations, had impacts on the willingness of users in share knowledge in social network. Dwyer, Hiltz, and Passerini [13] studied user willingness of information communication based on an external view from society. They revealed that user willingness of information communication was impacted by the activeness of users in social activities. There are also some similar works that studied user willingness toward knowledge sharing based on users’ social relationships in a social network. For example, Brown and Reingen [14] showed that weak relationships were important for connecting different communities in social networks and strong relationships were more important for micro-grained user behavior such as product recommendations. Thus, people need to pay more attention to weak relationships when they aim to influence different communities. On the contrary, people should focus on strong relationships when they want to impact others within a closely-related group.
In research on brands and marketing, it is widely accepted that users will share a positive rating when they are satisfied with products or services provided by a company. When they are not satisfied, negative ratings will be raised and spread over social networks. However, Balaji, Khong, and Chong [15] showed that negative information spreads much faster than positive information. Thus, it is important for enterprises to conduct marketing behavior in social networks. In other words, enterprises need to seriously consider negative information appearing in social networks.
There are also a number of studies on social network-based learning innovation. In 2015, Lytras et al. [16] provided an overview on the New Generation Collaborative Learning Systems, focusing on new philosophical paradigms for learning innovation in social networks, as well as the requirements for next-generation learning systems. Marques et al. [17] studied the use of social networks in the context of formal learning and presented an investigation on the structure of messages on blogs and microblogs, as well as their importance in collaborative learning. Their results showed the importance of using both categories of social networks in learning activities and also provided interesting results on message structuring. Liao et al. [18] explored the behavioral models associated with using social network websites in a U-learning context, where a modified TAM model was proposed with external factors, including collective efficacy and personal innovativeness in information technology. Their empirical results on a data set of 321 questionnaires showed that personal innovativeness in information technology and collective efficacy affected learner attitudes through perceived playfulness, perceived usefulness, and perceived ease of use, and in turn affected dimensions, such as satisfaction, self-perceived usage effects, and continued usage intention. Following the idea of Liao et al. [18], in this paper we also choose the TAM model as the basic research model, but extend the model with new factors reflecting the properties of knowledge sharing in social networks.
2.2. Perceived Value and Trust
The concept of perceived value stems from the 1980s. In Michael E. Porter’s book “Competitive Advantages” [19], he proposed the concept of customer-perceived value, which refers to the value perceived by the customers of a company because of the competitive advantages of the company over its competitors. Subsequently, many people introduced customer-perceived value into different research areas, such as electronic commerce, online shopping, and market promotion.
Zeithaml [20] studied perceived value from the view of psychology. This study proposed that perceived value was the overall rating of customers in getting services or buying products from a specific company. The key idea is to connect perceived value with rating. As rating is subjective, perceived value is also subjective according to this study. Woodruff [21] pointed out that perceived value was the effect of users on services they received, which depended on the subjective judgement from users. They also noted that perceived value changed with the environment where users received services. Butz et al. [22] claimed that perceived value was the emotional connection between customers and enterprises, while Chen and Dubinsky [23] simply regarded perceived value as the difference between the gaining of customers and the cost they paid for services or products. Chang and Wan [24] investigated user behavior on the Internet and claimed that perceived value was an integrated evaluation of subjective and objective perception of services provided by vendors. Thus, it is a critical factor for vendors in the network era to satisfy the emotional needs of users.
In social network related areas, Laux, Luse, and Mennecke [25] studied a virtual community and analyzed the influential factors of virtual communities. They reported that entertainment value, social value, and functional value are the main factors that influence user willingness of joining virtual communities. Nistor et al. [26] conducted a study in social network platforms using the TAM model, and pointed out that the intrinsic motivation for users to join social networks is to get useful information and a good feeling of perceived value. Thus, good social network platforms can encourage users to share their knowledge on the platforms. Sheth, Newman, and Gross [27] proposed an integrated index system for evaluating the influential factors that impact user behavior in social networks. They utilized the value theory to exploit user behavior in social networks and concluded that the major factors influencing user behavior in social networks included four dimensions, i.e., functional value, social value, information value, and emotional value. Functional value refers to the functions that services or products provide for users. Social value refers to the external appearance or attitude of users when they accept specific services or products. Information value is defined as the requirement and anxiety of users before they accept specific services or products. Emotional value represents the emotional feeling of users when they accept some services or are using certain products. In particular, emotional value has been emphasized by many researchers, and many enterprises have recognized that emotional value is highly important for marketing and sales. Other researchers presented alternate factors for user behavior in social networks. For instance, Yen [28] proposed a three-dimensional model to quantify user-perceived value in social networks, which contains three factors, namely, information value, social value, and entertainment value. Jaemin and Brush [29] proposed to use information value and social value to model perceived value in social networks.
Another factor that has been widely studied in social networks is trust [30,31,32]. Catherine [30] studied the influence of trust in virtual communities. Results showed that trust was influenced by personal privacy, perceived response, and sentiment polarity. In addition, members in a virtual community were more willing to participate in activities if the virtual community was well trusted. This indicated that there existed a bi-directional interactive relationship between trust and user acceptance of virtual communities. Liang et al. [31] studied the trust impact on virtual communities for brands, which pointed out that trust in virtual communities was based on people’s belief in kindness and honesty to others. Sledgianowski and Kulviwat [32] demonstrated the importance of trust through a study on social network-based services. They also demonstrated that some untrusted users in social networks might damage the trust of users on social network-based services. Thus, trust has a significant impact on user behavior in social networks.
Based on the analysis on existing studies of perceived value and trust, we can conclude that user willingness toward knowledge sharing in social networks is based on the perception of users on knowledge sharing as well as on the trust in social networks. Thus, it is reasonable to consider perceived value and trust to study user willingness toward knowledge sharing in social networks. However, differing from previous works, this study focuses on knowledge sharing in social networks but not on marketing or services like before. Due to the special properties of knowledge sharing, we believe that perceived value under the setting of knowledge sharing should not only reflect the final effect of user behavior, but also reflect the procedural values of user behavior. The final effect of user behavior is easy to understand; it stands for whether users have conducted behavior of knowledge sharing. The procedural values of user behavior are newly proposed in this study, which represent the cognitive values of users during knowledge sharing.
2.3. Behavior Intention and TAM
Behavior intention is an important concept in the attitude theory [33]. According to the attitude theory, attitude is composed of three elements, namely, cognition, emotion, and intention. Here, cognition refers to the knowledge and belief of individuals; emotion is the feeling of individuals; and intention represents the subjective intention of conducting some activities. Basically, we can evaluate user behavior by quantifying the intention of users in conducting behavior. In other words, behavior intention has a dominant role in user behavior. Thus, it is more reasonable to study user’s behavior intentions to explain user behavior, compared with using other factors, such as attitude, belief, and feeling. Quantifying behavior intention is to measure the strength of user intentions in performing certain behavior. Generally, high behavior intentions will lead to high possibilities for users to conduct real activities.
There are some related studies on behavior intention in social networks. Some theoretical models have been proposed to model behavior intentions. In 1975, Fishbein and Ajzen [33] proposed the TRA (Theory of Reasoned Action) and first claimed that user behavior was dominated by behavior intention. Following the TRA, Chow and Chan [34] investigated knowledge-sharing intentions in social networks and pointed out that social networks had a positive impact on users’ subjective intention of knowledge sharing. On the other hand, standardization and normalization of knowledge sharing also had a positive impact on users’ intention of knowledge sharing. Muhammad, Leng and Lada [35] conducted a study of social networks and showed that perceived ease of use positively impacted perceived usefulness, and perceived usefulness had a positive impact on behavior intention.
However, the TRA model assumes that each individual is entirely rational and can completely manage their behavior. This assumption is not valid in many situations, where people cannot fully decide their behavior.
In 1985, in order to enhance the TRA, Ajzen [36] proposed the TRB (Theory of Planned Behavior). The TRB enhances the TRA with an additional variable that stands for the control of user behavior. It claimed that user behavior is not only controlled by users themselves but also impacted by other factors such as attitude and subjective normalization. Attitude is the emotion of users on conducting behavior [37], and subjective normalization refers to the ideas of users on certain people or events. Following the TRB, Chang and Zhu [38] pointed out that social networks contained more entertainment applications than others, and users usually had different attitudes towards entertainment applications. Thus, attitude should be the most important factor that determines user behavior in social networks.
In 1989, Davis et al. [5] proposed the TAM model, which was first used to explain and predict user acceptance of computer technologies. The TAM model considers whether people accept an information system or not. Basically, if an information system can help people do their jobs better, it is perceived as useful. On the other hand, if an information system is easy to use, it is perceived to be easy to use. Most of the behavioral factors in the TAM model focus on describing user behavior to accept or reject the use of new technologies. Accordingly, the TAM model defines two variables, namely, perceived usefulness and perceived ease of use, to quantify user attitude to information technology, which in turn can be used to measure user acceptance of information technologies.
Although the TAM model is initially designed to explain and predict behavior of individuals on the use of information systems, it has been used in many studies, especially in e-commerce related studies [39]. That is mainly because e-commerce is a technology-driven area that is based on new information technologies, such as webs, mobile computing, and recommendations. Ha and Stoel [40] and Zeba and Ganguli [41] used the TAM model to predict the acceptance and use of consumer online shopping. Gefen, Karahanna, and Straub [42] studied the MBA and senior students’ willingness of buying books from Amazon. Vijayasarathy et al. also used this model to study the acceptance of online shopping by investigating 281 young people in the U.S.A [43]. There are other works concentrated on the online shopping behavior of network consumers. For example, Rigopoulou et al. used the TAM model to study consumer adoption of smartphones in Greece [44]. Xie and Lee [45] pointed out that in the TAM model, perceived usefulness and perceived ease of use affect users’ attitude and willingness to accept information technologies, and technologies that are easy to understand and use will be more attractive to people. Many scholars have used the TAM model to predict the acceptance and use of consumer online shopping [46,47,48]. Some researchers pointed out that trust has an impact on consumer acceptance intentions [49,50].
Previous studies have demonstrated the applicability of the TAM model in electronic businesses, especially in Internet-based online shopping [40,41]. In this paper, we focus on knowledge sharing in social networks. The users in this study are mainly supposed to like living on the Internet and to actively participate in social network activities. Thus, the modeling structure of the TAM model is of referential value to our study, because social networks in the context of this paper are also based on the Internet. However, the TAM model was proposed for the adoption of information systems. It is not appropriate to simply regard knowledge sharing as an information system. Knowledge is not a system for use, but is more like a source of valuable information. Thus, we replace the original independent variables of TAM with a new independent variable called perceived value. Basically, the differences between our research model and TAM include three aspects. First, we replace the independent variables in the TAM model, which are perceived usefulness and perceived ease of use, with perceived value. Second, we define four dimensions of sub-variables for perceived value to represent the influential factors of user willingness toward knowledge sharing in social networks. Finally, we introduce trust as the mediating variable.
3. Research Model and Hypotheses
3.1. Research Model
The TAM model has been widely used for predicting and explaining user behavior and the usage of information technology (IT) [5]. According to the TAM model, individual behavior of an information system is determined by the use of the system and behavior intentions. Behavior intentions are affected by perceived usefulness and attitude. Here, attitude refers to the individual evaluation (positive or negative) on an information system.
Figure 1 shows the proposed research model. As shown in the figure, perceived value includes four sub-variables, namely, social value, entertainment value, emotion value, and information value. These dimensions are mostly based on previous studies [24,27,28,29] and the special properties of social networks and knowledge sharing. Recently, Sheth, Newman, and Gross [27] proposed a framework for perceived value, which consists of four factors, namely, functional value, social value, information value, and emotional value. Yen [28] proposed a three-dimensional model to quantify perceived value in social networks, which contains three factors, namely, information value, social value, and entertainment value. Jaemin and Brush [29] proposed to use information value and social value to model perceived value in social networks. The four dimensions of perceived value shown in Figure 1 are integrations of these previous studies. More specifically, we replace the functional value in [27] with the emotional value proposed in [28]. This is because knowledge sharing is not a product or service that has some kinds of function. At present, gaining emotional value is one of the major motivations for users to participate in knowledge sharing in social networks.
Table 1 summarizes the variables of the research model in this study. Social value refers to the enhanced value that users obtain through knowledge-sharing behavior in social networks. As there are many users with similar interests in social networks, users are likely to get positive responses when they share knowledge. Such positive responses are valuable for users to further participate in social network activities. Entertainment value is introduced to reflect the entertainment attribute of social networks. It stands for the value add-ons of entertainment aspects when users participate in knowledge sharing in social networks. Emotion value represents the sentimental feeling of users when they conduct knowledge-sharing behavior in social networks. A previous study [28] has shown that positive emotion will lead to value increasing in social networks. However, users’ emotion is influenced by many factors, such as user interests, individual experiences, and new technology adoption. Regarding the setting of knowledge sharing in social networks, emotion value refers to the values generated from positive sentiment when users conduct knowledge-sharing behavior in social networks. Information value refers to the value of information in social networks, which has influences on user willingness toward knowledge sharing in social networks. One example is that when fresh information is frequently posted in social network platforms, users are much more likely to view and post responses to other messages.
3.2. Research Hypothesis
User willingness toward knowledge sharing has a big impact on the development of social networks. Thus, organizations need to take account of the factors that may influence user behavior about knowledge sharing in social networks. It has been previously studied that participating in knowledge sharing can bring benefits to users. At the same time, the development of social networks needs to consider the difficulty for users to participate in knowledge sharing. Some companies may build network-based information systems to assist users for sharing knowledge in social networks.
In order to reveal the relationships between the independent variables (social value, emotion value, entertainment value, and information value) and the dependent variable (knowledge-sharing willingness) in the proposed research model, as well as to reveal the role of the mediating variable (trust), we first raise three research questions, as listed in the left-most column of Table 2. The right column in Table 2 shows the corresponding hypotheses that are proposed to answer the research questions. The Q1 question is to determine the influential relationship between independent variables and the mediating variable. The Q2 question is to determine the influential relationship between the mediating variable and the dependent variable. Finally, the Q3 question aims to determine the intermediate relationship among all the factors in the research model.
The details of each hypothesis are presented as follows. The objective of each hypothesis can be found in Table 2.
First, we attempt to measure the impact of each independent variable in the research model on the mediating variable. Therefore, we make the following hypotheses (Hypothesis 1–4).
Hypothesis 1 (H1).
Users’ perceived social value in social networks positively affects their trust of knowledge sharing in social networks.
Hypothesis 2 (H3).
Users’ perceived entertainment value in social networks positively affects their trust of knowledge sharing in social networks.
Hypothesis 3 (H4).
Users’ perceived emotion value in social networks positively affects their trust of knowledge sharing in social networks.
Hypothesis 4 (H4).
Users’ perceived information value in social networks positively affects their trust of knowledge sharing in social networks.
Next, we consider the influence of trust in the research model. In recent years, trust has been widely studied in electronic commerce and other areas. Previous studies [51,52] showed that trust was strongly associated with attitude to products and services, as well as attitude to purchasing behaviors. Gefen et al. [42] pointed out that trust was very important for network merchants, and trust was not only a key factor influencing users’ acceptance of information technologies, but also a key factor attracting consumers. Heijden [50] studied the trust variables of consumers in Holland. They found that trust had an impact on the use intention of electronic websites. Che and Yang [53] showed that trust not only had a positive impact on users’ willingness to use microblogging services, and concluded that trust can be used as an important indicator of consumer behavior in the Internet environment. In social networks, users’ trust of the entire network, as well as the members in the network, is very important for users to decide whether to share knowledge in social networks. Therefore, we attempt to reveal whether trust has a significant impact on user willingness of sharing knowledge in social networks. As a result, we make the following hypotheses (H5~H9).
Hypothesis 5 (H5).
Users’ trust of social networks positively affects their willingness toward knowledge sharing in social networks.
Hypothesis 6 (H6).
Users’ trust of social networks plays an intermediary role between users’ perceived social value and their knowledge-sharing willingness in social networks.
Hypothesis 7 (H7).
Users’ trust of social networks plays an intermediary role between users’ perceived entertainment value and their knowledge-sharing willingness in social networks.
Hypothesis 8 (H8).
Users’ trust of social networks plays an intermediary role between users’ perceived emotion value and their knowledge-sharing willingness in social networks.
Hypothesis 9 (H9).
Users’ trust of social networks plays an intermediary role between users’ perceived information value and their knowledge-sharing willingness in social networks.
4. Questionnaire and Data Collection
4.1. Questionnaire Design
The questionnaire is the foundation of the further studies in this paper. In order to ensure the validity and reliability of the questionnaire, we conducted a survey of previous work and took into account the special properties of social networks to finalize 21 questions, which are shown in Table 3. The questionnaire table consists of three parts, which are discussed as follows.
(1) The usage of social networks. This part of the questionnaire focuses on the general information about users’ usage of social networks. Questions in this part include type of social network platforms, duration of using social networks, average daily time spent on social networks, number of friends in social networks, and frequency of using social networks.
(2) Basic information about users. This part of the questionnaire includes the gender, age, and educational background of the surveyed users.
(3) Questionnaire on independent variables, mediating variable, and dependent variable. This part of the questionnaire is the core of the whole questionnaire. This study contains four independent variables (social value, entertainment value, emotion value, and information value), one mediating variable (trust), and one dependent variable (knowledge-sharing willingness). After a preliminary investigation, we make the formal index of investigation, as shown in Table 3. Most questions can be found in previous studies to ensure the validity and reliability of the questionnaire. Each item of the questionnaire is assessed using a 5-point Likert scale from the bottom value ‘strongly disagree’ to the top value ‘strongly agree’.
4.2. Data Collection
The data collection stage consisted of two steps. First, we performed a micro-survey to validate the reliability and validity of variables. Then, we performed a formal survey to collect data.
In the micro-survey, we issued a total of 56 questionnaires on social network platforms including WeChat and QQ, and received a total of 56 responses within 1 week. There were 5 questionnaires that contained inconsistent answers or incomplete information, which were removed from the data set. Consequently, 51 valid questionnaires (about 91% of the total questionnaires) were collected.
In the micro-survey data set, the proportions of male and female were 35.3% and 64.7%, respectively. The age of surveyed users ranged from 18 to 24 years old, and 90% of the users were undergraduates and graduates.
In order to measure the effectiveness of the micro-survey data, we use SPSS software to analyze the validity and reliability of the micro-survey data. For validity analysis, we use the KMO (Kaiser-Meyer-Olkin) test and the Bartlett test of sphericity [54]. The KMO test is used to measure the correlations among variables, whose results are between 0 and 1. If the KMO test value is over 0.8, we can ensure the validity of the collected dataset. Generally, the KMO test value should not be less than 0.5, which indicates that the results of data analysis may be not useful. In this situation, the questionnaires are not appropriate and need to be revised. The Bartlett test of sphericity is used to test the hypothesis that the correlation matrix is an identity matrix, which would indicate that the variables are unrelated and therefore unsuitable for structure detection. Basically, if the significance value of the Bartlett test is less than 0.05, the variables are suitable for performing factor analysis.
Table 4 shows the pre-analysis results of the reliability and validity of the micro-survey data. We can see that the KMO values of the variables except information value and entertainment value are all over 0.7, showing that the questionnaires are suitable for factor analysis. The significance values with respect to the Bartlett test of sphericity are all below 0.001, indicating that the factor analysis method is applicable for the questionnaires.
After the pre-analysis of the micro-survey data set, we performed a formal survey to collect data. The formal questionnaires were conducted on Questionnaire Star [55], which is a popular free tool for questionnaires. We prepared the electronic version of the questionnaires and sent invitations through several social network platforms in China, including WeChat, QQ, and Sina Weibo. WeChat and QQ are usually regarded as instant-messaging tools, which are similar to MSN Message. Sina Weibo, which is the largest microblogging platform in China, provides microblogging services like Twitter. In addition, we also sent paper questionnaires to several universities. The entire questionnaire period lasted for half a month and resulted in 280 questionnaire responses. After removing some invalid questionnaires, 245 valid responses remained (about 87.5% of the total questionnaires).
4.3. Properties of Data
Table 5 shows the basic statistics of the surveyed users. We can see that the ratio between male and female users is 43.7:56.3, and the ages of most users ranges from 19 to 24 years old. Table 6 shows the statistics of the users in using social networks. It shows that Wechat is the most widely used social network tool. In addition, current Wechat users are mostly between 20 and 29 years old. This also indicates that the sample of this study is consistent with the real world, implying that the surveyed users are representative and of high reliability.
4.4. Reliability and Validity
After collecting the data, we used the SPSS tool to validate the reliability and validity of the data. The internal-consistency reliability reflects the stability of individual measurement items across replications from the same information source. This kind of reliability is assessed by computing Cronbach’s α. The validity test is used to examine the authenticity of the subjects. The analysis results of the reliability and validity of the collected data are shown in Table 7. It shows that most of the Cronbach’s α measures for variables are over 0.8, and the overall Cronbach’s α is 0.940, indicating that the scale system is highly reliable. All the KMO test values of the variables are greater than 0.7, except that for information value. The significance value of the Bartlett’s test of sphericity is less than 0.001, which shows that the factor analysis method is applicable to the questionnaire.
4.5. Common-Method Bias Test
As we collected questionnaires on both the independent and dependent variables from the same respondents at one point in time, potential common-method bias (CMB) as a false internal consistency might be present in the data [56,57]. In order to examine whether CMB is a concern in the study, we employ Harmon’s single-factor method [56] to test CMB. We used the SPSS software and conducted an exploratory factor analysis on all factors (the eight items shown in Table 5 and Table 6). The total variance explained by all factors is 75.36% and the highest variance explained by one factor is 39.20%, which is less than 50%, indicating that CMB is not a concern in the data set.
5. Data Analysis
In this section, we perform data analysis on the collected data to verify the hypotheses. In Section 5.1, we use principal component analysis and the maximum likelihood method to carry out factor analysis to ensure the design rationality of model variables. In Section 5.2, we make correlation analysis to find out the correlations among the independent variables, the mediator variable, and the dependent variable. Correlation analysis refers to the analysis of two or more correlated variable elements to measure the closeness of the variable factors. In Section 5.3, we measure the mediating effects of trust in the research model. And finally Section 5.4 summarizes the results of hypotheses validation.
5.1. Factor Analysis
Factor analysis aims to find out the number of factors that affect the observed variables, as well as the correlations between each factor and each observed variable to reveal the inherent structure of a relatively large set of variables. In this section, we use SPSS software to perform factor analysis on the collected data set. In particular, we use the maximum likelihood method and principal component analysis method to analyze the exploratory factors.
5.1.1. Independent Variables
Exploratory factor analysis of independent variables is shown in Table 8. The cumulative contribution rate of the first four factors is over 70%, indicating that the content of the questionnaire can be well explained by the first four factors. The orthogonal rotation is performed by using the maximum variance rotation method. The results are shown in Table 9.
5.1.2. Mediating Variable
The mediating variable is explored by factorial analysis to explain the total variance of the mediating variable. The results are shown in Table 10. The cumulative contribution rate of one factor is 73.488%, which can well explain the contents of the original questionnaire.
From the load matrix of the mediating variable, as shown in Table 11, we can see that the factor scores are greater than 0.8. This means that these factors can be classified into one class, which is the mediating variable trust in our research model.
5.1.3. Dependent Variable
The main variance of the dependent variables is explained by the factor analysis on the dependent variables. As shown in Table 12, the cumulative contribution rate of one factor is 72.000%, which can well explain the contents of the original questionnaire.
The results of the variable factor load are shown in Table 13, which shows that the factor scores are greater than 0.8. Thus, they can be classified into one class, and this class is named as knowledge-sharing willingness according to the characteristics of the question.
5.2. Correlation Analysis
Correlation analysis is a statistical method that aims to reveal whether there is a relationship between variables. If there is a relationship, we need to quantify the relationship. As correlation analysis generally employs the Pearson coefficient to express the linear relationship among variables, in this paper we also use the Pearson correlation analysis method to analyze the correlation between social value, entertainment value, emotion value, information value, trust, and knowledge-sharing willingness. In particular, we use r to represent the Pearson correlation coefficient. A positive value of r indicates that the two variables tested are positively correlated, while a negative value of r means the two variables have a negative correlation. When −1 < r < 1, the greater the absolute value of r, the greater the correlation between the two variables. Table 14 shows the mean value of each variable according to the Pearson analysis.
As shown in Table 14, the mean value of knowledge-sharing willingness is 3.525, which shows high tendency of user willingness to share knowledge in social networks. The mean value of information value is 3.612, which is the highest value among all the values, indicating that information value is more sensitive to the perception of users compared with other factors.
Table 15 shows the correlation analysis results between the four independent variables and the mediator variable (trust). In Table 15, a value less than 0.001 means that the actual value is too small to be correctly shown in the SPSS software. For such values, SPSS always outputs 0.000 by default. Table 15 shows that the correlation coefficients of social value, entertainment value, emotion value, information value towards trust are 0.417, 0.440, 0.559, and 0.422, respectively. The Pearson correlation coefficients of the four independent variables are all positive. The significance value is at the 0.001 level, meaning that the correlation between the independent variables and trust is positive. The correlation between social value and trust is not higher than others, indicating that the social value of social networks is not highly influential to the trust of users on social networks. On the other hand, we can see the emotion value has a high impact on the trust, meaning that trust is basically a subjective attitude of users. In summary, we can conclude that Hypotheses 1–4 are validated.
The correlation analysis between trust and knowledge-sharing willingness is shown in Table 16. The correlation coefficient of trust towards knowledge-sharing willingness is 0.473. The significance probability of trust and knowledge-sharing willingness is less than 0.001, which is significant at the 0.001 level. We can see from the table that trust and knowledge-sharing willingness is positively correlated. The high value of the correlation coefficient of trust towards knowledge-sharing willingness shows that trust has a high impact on knowledge-sharing willingness. Thus, we can see that users’ trust of social networks directly affects user willingness on knowledge sharing in social networks. In summary, we can conclude that Hypothesis 5 is validated.
5.3. Mediating Effects Analysis
In this section, we use the hierarchical regression method to verify the mediating effect of attitude between different factors. We first present the mediating effect analysis of social value and knowledge-sharing willingness in Section 5.3.1. Then, we discuss the mediating effect analysis of entertainment value and knowledge-sharing willingness in Section 5.3.2. Section 5.3.3 presents the mediating effect analysis of emotion value and knowledge-sharing willingness. And finally, Section 5.3.4 discusses the mediating effect of information value and knowledge-sharing willingness.
The procedure of mediating effect analysis is based on the steps recommended by Baron and Kenny [58]. In particular, in order to check the mediating effect of the mediating variable B between the independent variable A and the dependent variable C, we first perform regression analysis from A to C, then perform regression analysis from A to B, and finally perform regression analysis from A and B to C.
5.3.1. Trust on Social Value and Knowledge-Sharing Willingness
We take social value as the independent variable and knowledge-sharing willingness as the dependent variable. Then, we conduct regression analysis on social value and knowledge-sharing willingness. The results are shown in Table 17. As shown in the table, the adjusted R2 is 0.300, meaning that the explanatory power of social value to knowledge-sharing willingness is 30.0%. This is also validated by the F test.
Next, we perform regression analysis on social value and trust. The results are shown in Table 18, which shows that the standardized regression coefficient of social value is 0.417. The F value is 51.056, showing that the F test is passed. Table 18 shows that the regression effect is significant and the regression coefficient is positive. It indicates that the social value for social networks has a significant positive impact on trust when other factors remain unchanged, meaning that the original Hypothesis 1 is validated. The value of the adjusted R2 is 0.170, which shows that the explanatory power of social value to trust is 17.0%. This means that social value has a significant positive effect on the trust of users to share knowledge in social networks. When social value has a high value, users are much likely to have positive trust in participating in knowledge sharing in social networks.
Finally, we take social value and trust as the independent variables and knowledge-sharing willingness as the dependent variable. The results of the regression analysis on social value, trust, and knowledge-sharing willingness are shown in Table 19. Here, the adjusted R2 is 0.370, which is validated by the F test. Compared with Table 17, we can see that the adjusted R2 in Table 19 increases by 23.3%. In addition, the standardized regression coefficient β of social value is changed from 0.550 in Table 17 to 0.427 in Table 19. The fact that 0.427 < 0.550 indicates that the effect of social value on knowledge-sharing willingness decreases, indicating that trust plays a partial mediating role between social value and knowledge-sharing willingness; thus Hypothesis 6 is established.
According to the results, we can see that users first have a stage of trust before they participate in knowledge sharing in social networks. That is, social value first stimulates users’ trust towards knowledge sharing in social networks. Positive trust will lead to high willingness to participate in knowledge sharing. The results of analysis also show that social value can directly affect users’ willingness to participate in knowledge sharing in social networks.
5.3.2. Trust on Entertainment Value and Knowledge-Sharing Willingness
The regression analysis on entertainment value and knowledge-sharing willingness is carried out by setting entertainment value as the independent variable and knowledge-sharing willingness as the dependent variable. The results are shown in Table 20. In this regression analysis, the adjusted R2 is 0.375, indicating that the explanatory power of entertainment value to knowledge-sharing willingness is 37.5%, which is validated by the F test.
Next, we report the results of regression analysis on entertainment value and trust. The results are shown in Table 21. We can conclude from the results that entertainment value has a positive effect on trust. The standardized regression coefficient of entertainment value is 0.440. The F value is 58.432, showing that the F test is passed. Table 21 shows that the regression effect is significant and the regression coefficient is positive. It shows that users’ perceived entertainment value for social networks has a significant positive impact on trust. The value of the adjusted R2 is 0.191, which shows that the explanatory power of entertainment value to trust is 19.1%. In summary, Hypothesis 2 is validated.
Finally, we use entertainment value and trust as independent variables. Knowledge-sharing willingness is used as the dependent variable. The results of the regression analysis of entertainment value, trust and knowledge-sharing willingness are shown in Table 22. The adjusted R2 is 0.424, which is validated by the F test. We can see that the adjusted R2 in Table 22 increases by 13.1% compared with that in Table 20. In addition, the standardized regression coefficient β of entertainment value is changed from 0.614 in Table 20 to 0.504 in Table 22. As 0.504 < 0.614, we can see that the effect of entertainment value on knowledge-sharing willingness is weakened, showing that trust plays a partial mediating role between entertainment value and knowledge-sharing willingness, which shows that Hypothesis 7 is established.
The above results show that users have a stage of behavior trust before they start to share knowledge in social networks. Entertainment value first motivates users’ trust towards knowledge sharing in social networks, and high and positive trust can make users increase their knowledge-sharing willingness. Trust plays a partly intermediary role, indicating that entertainment value can directly affect users’ knowledge-sharing willingness in social networks. When social networks are trusted, users are much more likely to accept social networks, which will lower the cost of users to participate in knowledge-sharing activities. To this end, the mediating effect of users’ trust on knowledge sharing in social networks is weakened.
5.3.3. Trust on Emotion Value and Knowledge-Sharing Willingness
The regression analysis on the mediating effects of trust on emotion value and knowledge-sharing willingness is carried out by setting knowledge-sharing willingness as the dependent variable and emotion value as the independent variable. The results are shown in Table 23. In this regression analysis, the adjusted R2 is 0.486. This means that emotion value’s interpretative power on knowledge-sharing willingness is 48.6%, which is validated by the F test.
Next, we perform regression analysis on emotion value and trust. The results are shown in Table 24. In Table 24, we can conclude that emotion value has a positive influence on trust. The standardized regression coefficient of emotion value is 0.559. The F value is 110.670, showing that the F test is passed. Table 24 shows that the regression effect is significant and the regression coefficient is positive. It shows that users’ perceived emotion value in social networks has a significant positive impact on trust in the absence of other factors. The value of the adjusted R2 is 0.310, showing that the explanatory power of emotion value to trust is 31.0%. From this, we can see that Hypothesis 3 is validated.
Finally, we use emotion value and attitude as the independent variables and conduct regression analysis on emotion value, trust, and knowledge-sharing willingness. The results are shown in Table 25. The adjusted R2 is 0.494, which is validated by the F test. We can see that the adjusted R2 in Table 25 increases by 2.0% compared with that in Table 23. Meanwhile, the standardized regression coefficient β of emotion value is changed from 0.699 in Table 23 to 0.631 in Table 25. Both values of β are statistically significant at the 0.001 level, but as 0.631 < 0.699, we can infer that the effect of emotion value on knowledge-sharing willingness decreases. As a result, trust plays a partial mediating role between emotion value and knowledge-sharing willingness, indicating that Hypothesis 8 is established.
Due to psychological similarity, emotion value in social networks is closely connected with users’ subjective trust on social networks. Therefore, emotion value is highly likely to affect users’ knowledge-sharing willingness through users’ trust on social networks. The analysis results show that trust plays a partial mediating role. A possible reason is that users’ positive emotion regarding social networks is helpful to increase users’ trust of social networks, which in turn can urge users to participate in knowledge sharing in social networks.
5.3.4. Trust on Information Value and Knowledge-Sharing Willingness
First, we perform the regression analysis on information value and knowledge-sharing willingness by setting knowledge-sharing willingness as the dependent variable and information value as the independent variable. The analysis results are shown in Table 26. The adjusted R2 is 0.288, that is, the information value interpretation of knowledge-sharing willingness is 28.8%, which is validated by the F test.
Next, we perform regression analysis on information value and trust. The results are shown in Table 27, which are highly consistent with the analysis of the previous three factors. Similarly, we can conclude that information value has a positive influence on trust and Hypothesis 4 is validated.
Finally, we set trust and information value as independent variables to measure their mediating effects of trust on information value to knowledge-sharing willingness. The results of regression analysis are shown in Table 28. The adjusted R2 is 0.359, which is validated by the F test. We can see that the adjusted R2 in Table 28 increased by 24.7% compared with the adjusted R2 in Table 26. Meanwhile, the standardized regression coefficient β of information value is changed from 0.540 in Table 26 to 0.413 in Table 28. Both values of the standardized regression coefficient β are statistically significant at the 0.001 level. However, the fact that 0.413 < 0.540 indicates that the effect of information value on knowledge-sharing willingness has been weakened. As a result, trust plays a partial mediating role between information value and knowledge-sharing willingness, assuming that Hypothesis 9 is established.
The results show that trust has partial mediating effects for information value and knowledge-sharing willingness. When social networks are highly informative to users, users can be stimulated to participate in social network activities, leading to positive knowledge-sharing willingness in social networks. However, if social networks do not provide expected information for users, users will not have high knowledge-sharing willingness. One example is when a social network platform is not updated frequently, users will not login onto the platform because they are not willing to see out-of-date information.
5.4. Summary of Hypothesis Validation
Based on the results described in Section 5.1, Section 5.2 and Section 5.3, we present the summary of the hypothesis validation in Table 29.
The validation result column in Table 29 shows the final validation results of each hypothesis, from which we can see that H1–H5 are well established. These hypotheses correspond with the research questions Q1 and Q2 presented in Table 2. This implies that the independent variables of the research model we propose in Section 3.1 are influential on user willingness toward knowledge sharing in social networks. Among all factors, social value, entertainment value, emotion value, and information value are four that reflect the advantages of social networks. It is understandable that a socialized, entertaining, joyful, and informative social network is highly likely to attract users and finally lead to users’ participation behavior of knowledge sharing. The role of trust depends on both the properties of social networks and specific user attributes, but we can see that trust has a positive impact on knowledge-sharing willingness in social networks. That is, if users trust a specific social network platform such as Facebook or Twitter, they are very likely to participate in knowledge sharing on the platform.
Regarding the hypotheses of H6–H9, which aim to answer the research question of Q3, we can see that the mediating factor, i.e., trust, has a partial intermediary effect on user willingness toward knowledge sharing in social networks. Partial intermediary effect means that the mediating factor does have effect on the target factor, but the final behavior of user acceptance of knowledge sharing is also influenced by other factors. Thus, organizations need to pay more attention to the positive effect of mediating factors and build a framework to make all factors work together for advancing knowledge sharing in social networks.
6. Discussions
6.1. Research Implications
(1) We propose a new research model inspired by the TAM model. This model augments the application of the widely used TAM model and offers referential values for other related research. In addition, we present empirical results on user willingness toward participating in knowledge sharing in social networks. These results can provide new research insights for advancing knowledge sharing in social networks, e.g., designing new marketing mechanisms on social networks and developing new learning tools on social networks.
(2) This paper reveals that user willingness toward knowledge sharing in social networks can be stimulated by setting up necessary mechanisms towards users’ social value, entertainment value, emotion value, information value, and trust. This is valuable for organizations to realize the importance of knowledge sharing in social networks.
(3) We introduce trust as the mediating factor that influences user willingness toward knowledge sharing in social networks. The empirical research in this paper shows that trust has a partial intermediate effect on perceived value and knowledge-sharing willingness. Therefore, a sound trust mechanism is needed for advancing knowledge sharing in social networks. To attract more users to share their knowledge and information in social networks, one key issue is to eliminate user concerns about social networks, e.g., security issues and privacy issues. On the one hand, organizations can strive to improve their businesses in social networks to provide better services for interested users. On the other hand, enterprises should establish a technological framework to ensure the security of social network platforms.
(4) Currently, many people suffer from seeking knowledge and information when they are learning a new subject. It is not appropriate to offer all users the same contents like traditional books, as different people have different needs and knowledge backgrounds. Social network offers a new opportunity to provide a learning platform that can help users better share their knowledge and information on the Internet. Efficient techniques can also be developed to help users retrieve knowledge fast and accurately. Based on the learning platform on social networks, when someone posts a question, the system can quickly find similar questions raised by others and return relevant answers. There is one example of such learning innovation in China, namely Baidu Zhidao [59]. However, the problem of Baidu Zhidao is that it does not distinguish the specific properties of users, or the different semantics of application domains. Combined with the research outputs of this study, it is possible to develop more effective frameworks to improve platforms like Baidu Zhidao, leading to the further development of learning innovation.
6.2. Suggestions
Based on the empirical analysis in this study, we make the following suggestions for organizations to better develop and utilize knowledge sharing in social networks.
First, organizations need to increase users’ perceived value to improve user willingness toward knowledge sharing in social networks. Our study shows that more the values social networks provide, the higher the users’ willingness on knowledge sharing. Thus, it is very important for organizations to pay attention to users’ perceived value. For increasing social value, as sharing is the intrinsic feature of social networks, organizations should construct connections with some famous stars in social networks and enhance the influence of organizations through interactions with these stars, e.g., promoting sales, recommending new products, and offering free services. Note that stars in social networks are different from those in the real world. For increasing entertainment value, organizations can add more entertainment features in social networks so as to attract more users and find out potential user needs. Some organizations may construct their own social network platforms. For example, many banks in China have established their own social networks. Other organization can directly use existing social network platforms to set up their own portal in social networks. For example, they can create an organization account in microblogging platforms such as Sina Weibo. For increasing emotion value, organizations should pay more attention to the use of services, because emotion mainly comes from using products or services. Thus, the key issue is to improve the experiences of users when they are using services or products in social networks. For instance, many organizations have developed online customer services in social networks. However, due to a number of reasons, some only use robot tools to answer user questions. Due to the inefficiency and low intelligence of robots, users usually cannot receive satisfied experiences through robot-based online customer services. According to the study of this paper, this will decrease the emotion value of users towards knowledge sharing in social networks, and finally hurt the development of knowledge sharing and innovation. For increasing information value, it is appropriate for organizations to enrich the information in social networks. More useful and fresh information will result in more users in social networks. On the other hand, if more users are willing to share knowledge and information in social networks, the information value of social networks will also be improved. However, it is also necessary to develop mechanisms for measuring the quality of shared knowledge, because knowledge with low quality will also worsen the effects of knowledge sharing.
Second, organizations need to pay more attention to users’ trust in social networks. Trust has been an important factor for the fast development of social networks. Our study shows that it is helpful for increasing user willingness toward knowledge sharing by improving the information communication and trust relationship between users and organizations. Therefore, in order to advance the development of businesses in social networks, organizations should take necessary actions to strengthen system credibility and reliability, maintain the high quality of products and services, and provide security systems for information and users.
Finally, we suggest organizations enrich the functions of social network software, so that more users can be attracted by social network platforms. Our study shows that entertainment value and emotion value are influential on user willingness on knowledge sharing. This means that in addition to offering information services, it is also useful for organizations to provide entertainment functions in social networks. Entertainment functions can bring additional values to organizations. In addition, entertainment functions can make users joyful, which can increase the emotion value of social networks. We can see that online games have been popular on the Internet and have even become the dominant source of business income of many Internet companies. Now some social network service providers have provided support for online games and other entertainment services. For example, in the Wechat platform provided by Tencent, which is the dominant social network platform in China, organizations can add so-called “little apps” to the platform, which are mainly designed to offer some entertainment functions such as recording your own trajectories and finding the current locations of your friends.
7. Conclusions
In this paper, we analyze the major factors that influence user willingness toward knowledge sharing in social networks. In particular, we propose a new research model that is inspired by the TAM model and proposes perceived value and trust as new variables to study user willingness toward knowledge sharing in social networks. We design four tailor-made independent variables with respect to a view from perceived value. These variables include social value, entertainment value, emotion value, and information value. We also introduce a mediating factor, i.e., trust, to reflect the influence of independent variables on knowledge-sharing willingness. Based on the research model, we conduct an empirical analysis on questionnaire data from the Internet and present comprehensive results from various aspects, including reliability and validity, factor analysis, correlation analysis, and mediating effects analysis. The results show that perceived value has a significant influence on user willingness toward knowledge sharing in social networks. In addition, trust has a partial intermediate impact on perceived value and knowledge-sharing willingness in social networks.
The contributions of this study in learning innovation can be summarized as follows:
(1) Knowledge sharing in social networks introduces new potential for learning innovation. The empirical results in this paper can provide theoretical support for advancing knowledge sharing and constructing knowledge-sharing-based collaborative learning innovation frameworks in social networks.
(2) The study of this paper demonstrates that knowledge sharing behavior is influenced by perceived value and trust. It indicates that improving perceived value and trust of users can positively improve the effectiveness of knowledge sharing. This conclusion offers new insights for organizations to improve their knowledge-sharing strategies in social networks. On the other hand, the advance of knowledge sharing in social networks can also accelerate knowledge creation and learning, yielding increasing of social values.
One limitation of this study is that we only conducted questionnaires and data analysis on several social network platforms in China. However, due to the difficulties in accessing Facebook and Twitter in China, currently we are not able to perform data collection on Facebook and Twitter. Thus, the current research results of this paper are highly suitable for the knowledge sharing willingness analysis in China. In the future, we will perform collaborative work with USA or Europe universities to extend our study to Facebook and Twitter. We will consider crowd intelligence tools such as Amazon Mechanical Turk [60] to perform a large-scale survey.
Author Contributions
J.Z.: Conceptualization, Project administration, Supervision, and Writing—original draft. C.Z.: Data curation and Formal analysis. Z.P.: Investigation and Software. X.X.: Supervision, and Writing—review & editing. Y.L.: Writing—review & editing.
Funding
This paper is partially supported by the National Science Foundation of China (No. 71273010 & 61672479) and the MOE (Ministry of Education in China) Project on Humanities and Social Sciences (No. 18YJC630082).
Acknowledgments
We would like to thank the editors and anonymous reviewers for their suggestions and comments to improve the quality of the paper.
Conflicts of Interest
The authors declare no conflict of interest.
References
- Bogolyubova, O.; Panicheva, P.; Tikhonov, R.; Ivanov, V.; Ledovaya, Y. Dark personalities on Facebook: Harmful online behaviors and language. Comput. Hum. Behav. 2018, 78, 151–159. [Google Scholar] [CrossRef]
- Zhao, J.; Fang, S.; Jin, P. Modeling and Quantifying User Acceptance of Personalized Business Modes Based on TAM. Trust Attitude Sustain. 2018, 10, 356. [Google Scholar] [CrossRef]
- Bottle, Lyrics. Available online: https://www.lyrics.com/lyrics/Bottle (accessed on 1 October 2018).
- Zhao, J.; Wang, J.; Fang, S.; Jin, P. Towards Sustainable Development of Online Communities in the Big Data Era: A Study of the Causes and Possible Consequence of Voting on User Reviews. Sustainability 2018, 10, 3156. [Google Scholar] [CrossRef]
- Davis, F.D. Perceived Usefulness, Perceived Ease of Use, and User Acceptance of Information Technology. MIS Q. 1989, 13, 319–340. [Google Scholar] [CrossRef]
- Arney, C. Six degrees: The science of the connected age. Math. Comput. Educ. 2010, 44, 260. [Google Scholar]
- Jin, P.; Mu, L.; Zheng, L.; Zhao, J.; Yue, L. News feature extraction for events on social network platforms. In Proceedings of the 26th International Conference on World Wide Web Companion, Perth, Australia, 3–7 April 2017; pp. 69–78. [Google Scholar] [CrossRef]
- Zhao, J.; Wang, X.; Jin, P. Feature selection for event discovery in social media: A comparative study. Comput. Hum. Behav. 2015, 51, 903–909. [Google Scholar] [CrossRef]
- Zheng, L.; Jin, P.; Zhao, J.; Yue, L. A fine-grained approach for extracting events on microblogs. In Proceedings of the International Conference on Database and Expert Systems Applications, Munich, Germany, 1–4 September 2014; pp. 275–283. [Google Scholar]
- Zheng, L.; Jin, P.; Zhao, J.; Yue, L. Multi-dimensional sentiment analysis for large-scale e-commerce reviews. In Proceedings of the International Conference on Database and Expert Systems Applications, Munich, Germany, 1–4 September 2014; pp. 449–463. [Google Scholar]
- Kwahk, K.-Y.; Park, D.-H. The effects of network sharing on knowledge-sharing activities and job performance in enterprise social media environments. Comput. Hum. Behav. 2016, 55, 826–839. [Google Scholar] [CrossRef]
- Lee, C.S.; Ma, L. News sharing in social media: The effect of gratifications and prior experience. Comput. Hum. Behav. 2012, 28, 331–339. [Google Scholar] [CrossRef]
- Dwyer, C.; Hiltz, S.; Passerini, K. Trust and privacy concern within social networking sites: A comparison of Facebook and MySpace. In Proceedings of the AMCIS, Keystone, CO, USA, 10–12 August 2007; Volume 339. [Google Scholar]
- Brown, J.J.; Reingen, P.H. Social Ties and Word-of-Mouth Referral Behavior. J. Consum. Res. 1987, 14, 350. [Google Scholar] [CrossRef]
- Balaji, M.; Khong, K.W.; Chong, A.Y.L.; Balaji, M.; Wei, K.K. Determinants of negative word-of-mouth communication using social networking sites. Inf. Manag. 2016, 53, 528–540. [Google Scholar] [CrossRef] [Green Version]
- Lytras, M.; Mathkour, H.; Abdalla, H.; Al-Halabi, W.; Yanez-Marquez, C.; Matsui Siqueira, S. An emerg-ing—Social and emerging computing enabled philosophical paradigm for collaborative learning systems: Toward high effective next generation learning systems for the knowledge society. Comput. Hum. Behav. 2015, 51, 557–561. [Google Scholar] [CrossRef]
- Marques, A.M.; Krejci, R.; Siqueira, S.W.; Pimentel, M.; Braz, M.H.L. Structuring the discourse on social networks for learning: Case studies on blogs and microblogs. Comput. Hum. Behav. 2013, 29, 395–400. [Google Scholar] [CrossRef]
- Liao, Y.-W.; Huang, Y.-M.; Chen, H.-C.; Huang, S.-H. Exploring the antecedents of collaborative learning performance over social networking sites in a ubiquitous learning context. Comput. Hum. Behav. 2015, 43, 313–323. [Google Scholar] [CrossRef]
- Porter, M. Competitive Advantage; Free Press: New York, NY, USA, 1985. [Google Scholar]
- Zeithaml, V. Consumer perceptions of price, quality, and value: A means-end model and synthesis of evidence. J. Mark. 1988, 52, 2–22. [Google Scholar] [CrossRef]
- Woodruff, R. Customer value: The next source for competitive advantage. J. Acad. Mark. Sci. 1997, 25, 139. [Google Scholar] [CrossRef]
- Butz, H., Jr.; Goodstein, L. Measuring customer value: Gaining the strategic advantage. Organ. Dyn. 1996, 24, 63–77. [Google Scholar] [CrossRef]
- Chen, Z.; Dubinsky, A.J. A conceptual model of perceived customer value in e-commerce: A preliminary investigation. Psychol. Mark. 2003, 20, 323–347. [Google Scholar] [CrossRef]
- Chang, H.; Wang, H. The moderating effect of customer perceived value on online shopping behavior. Online Inf. Rev. 2011, 35, 333–359. [Google Scholar] [CrossRef]
- Laux, D.; Luse, A.; Mennecke, B. Collaboration, connectedness, and community: An examination of the factors influencing student persistence in virtual communities. Comput. Hum. Behav. 2016, 57, 452–464. [Google Scholar] [CrossRef] [Green Version]
- Nistor, N.; Baltes, B.; Dascălu, M.; Mihăilăd, D.; Smeaton, G.; Trăuşan-Matu, Ş. Participation in virtual academic communities of practice under the influence of technology acceptance and community factors. A learning analytics application. Comput. Hum. Behav. 2014, 34, 339–344. [Google Scholar] [CrossRef]
- Sheth, J.; Newman, B.; Gross, B. Why we buy what we buy: A theory of consumption values. J. Bus. Res. 2008, 22, 159–170. [Google Scholar] [CrossRef]
- Yen, Y. The impact of perceived value on continued usage intention in social networking sites. In Proceedings of the 2nd International Conference on Networking and Information Technology, Wuhan, China, 20–22 May 2011; pp. 217–223. [Google Scholar]
- Jaemin, M.; Brush, G. Comparing the perceived value of information and entertainment mobile services. Psychol. Mark. 2012, 25, 732–755. [Google Scholar]
- Catherine, M. Some antecedents and effects of trust in virtual communities. J. Strateg. Inf. Syst. 2002, 11, 271–295. [Google Scholar] [Green Version]
- Liang, C.; Chang, C.C.; Rothwell, W.; Shu, K.M. Influences of organizational culture on knowledge sharing in an online virtual community: Interactive effects of trust, communication and leadership. J. Organ. End User Comput. 2016, 28, 15–32. [Google Scholar] [CrossRef]
- Sledgianowski, D.; Kulviwat, S. Using social network sites: The effects of playfulness, critical mass and trust in a hedonic context. J. Comput. Inf. Syst. 2009, 49, 74–83. [Google Scholar]
- Fishbein, M.; Ajzen, I. Belief, Attitude, Intention and Behavior: An Introduction to Theory and Research; Addison-Wesley Publishing Company: Boston, MA, USA, 1975. [Google Scholar]
- Chow, W.; Chan, L. Social network, social trust and shared goals in organizational knowledge sharing. Inf. Manag. 2008, 45, 458–465. [Google Scholar] [CrossRef]
- Muhammad, M.; Leng, G.; Lada, S. An exploration of Social Networking Sites (SNS) adoption in Malaysia using Technology Acceptance Model (TAM), theory of planned behavior (TPB) and intrinsic motivation. J. Internet Bank. Commer. 2016, 16, 1–27. [Google Scholar]
- Ajzen, I. From intentions to actions: A theory of planned behavior. In Action Control: From Cognition to Behavior; Kuhl, J., Ed.; Springer: Heidelberg, Germany, 1985; pp. 11–39. [Google Scholar]
- Cheung, M.; To, W. The influence of the propensity to trust on mobile users’ attitudes toward in-app advertisements: An extension of the theory of planned behavior. Comput. Hum. Behav. 2017, 76, 102–111. [Google Scholar] [CrossRef]
- Chang, Y.; Zhu, D. Understanding social networking sites adoption in China: A comparison of pre-adoption and post-adoption. Comput. Hum. Behav. 2011, 27, 1840–1848. [Google Scholar] [CrossRef]
- Lai, P. The literature review of technology adoption models and theories for the novelty technology. J. Inf. Syst. Technol. Manag. 2017, 14, 21–38. [Google Scholar] [CrossRef]
- Ha, S.; Stoel, L. Consumer e-shopping acceptance: Antecedents in a technology acceptance model. J. Bus. Res. 2009, 62, 565–571. [Google Scholar] [CrossRef]
- Zeba, F.; Ganguli, S. Word-of-mouth, trust, and perceived risk in online shopping: An extension of the technology acceptance model. Int. J. Inf. Syst. Serv. Sect. 2016, 8, 17–32. [Google Scholar] [CrossRef]
- Gefen, D.; Karahanna, E.; Straub, D. Inexperience and experience with online stores: The importance of TAM and trust. IEEE Trans. Eng. Manag. 2003, 50, 307–321. [Google Scholar] [CrossRef]
- Vijayasarathy, L. Predicting consumer intentions to use on-line shopping: The case for an augmented technology acceptance model. Inf. Manag. 2004, 41, 747–762. [Google Scholar] [CrossRef]
- Rigopoulou, I.; Chaniotakis, I.; Kehagias, J. An extended technology acceptance model for predicting smartphone adoption among young consumers in Greece. Int. J. Mob. Commun. 2017, 15, 372–387. [Google Scholar] [CrossRef]
- Xie, K.; Lee, Y. Social media and brand purchase: Quantifying the effects of exposures to earned and owned social media activities in a two-stage decision making model. J. Manag. Inf. Syst. 2015, 32, 204–238. [Google Scholar] [CrossRef]
- Marakarkandy, B.; Yajnik, N.; Dasgupta, C. Enabling internet banking adoption: An empirical examination with an augmented technology acceptance model (TAM). J. Enterp. Inf. Manag. 2017, 30, 263–294. [Google Scholar] [CrossRef]
- Wallace, L.; Sheetz, S. The adoption of software measures: A technology acceptance model (TAM) perspective. Inf. Manag. 2014, 51, 249–259. [Google Scholar] [CrossRef]
- Yu, J.; Ha, I.; Choi, M.; Rho, J. Extending the TAM for a t-commerce. Inf. Manag. 2005, 42, 965–976. [Google Scholar] [CrossRef]
- Gefen, D.; Karahanna, E.; Straub, D. Trust and TAM in online shopping: An integrated model. MIS Q. 2003, 27, 51–90. [Google Scholar] [CrossRef]
- Heijden, H. Factors influencing the usage of websites: The case of a generic portal in The Netherlands. Inf. Manag. 2003, 40, 541–549. [Google Scholar] [CrossRef]
- Koo, D. An investigation on consumer’s internet shopping behavior explained by the technology acceptance model. Asia Pac. J. Inf. Syst. 2003, 13, 141–170. [Google Scholar]
- Chang, S.; Liu, A.; Shen, W. User trust in social networking services: A comparison of Facebook and LinkedIn. Comput. Hum. Behav. 2017, 69, 207–217. [Google Scholar] [CrossRef]
- Che, H.; Cao, Y. Examining WeChat users’ motivations, trust, attitudes, and positive word-of-mouth: Evidence from China. Comput. Hum. Behav. 2014, 41, 104–111. [Google Scholar]
- Snedecor, G.; Cochran, W. Statistical Methods, 8th ed.; Iowa State University Press: Iowa City, IA, USA, 1989. [Google Scholar]
- Questionnaire Star. Available online: https://www.wjx.cn (accessed on 1 October 2018).
- Podsakoff, P.; Organ, D. Self-reports in organizational research: Problems and prospects. J. Manag. 1986, 12, 69–82. [Google Scholar] [CrossRef]
- Podsakoff, P.; MacKenzie, S.; Lee, J.; Podsakoff, N. Common method biases in behavioral research: A critical review of the literature and recommended remedies. J. Appl. Psychol. 2003, 88, 879–903. [Google Scholar] [CrossRef] [PubMed]
- Baron, R.; Kenny, D. The moderator–mediator variable distinction in social psychological research: Conceptual, strategic, and statistical considerations. J. Pers. Soc. Psychol. 1986, 51, 1173–1182. [Google Scholar] [CrossRef] [PubMed]
- Baidu Zhidao. Available online: https://zhidao.baidu.com (accessed on 1 October 2018).
- Amazon Mechanical Turk. Available online: https://www.mturk.com (accessed on 1 October 2018).
Figure 1.
The research model.


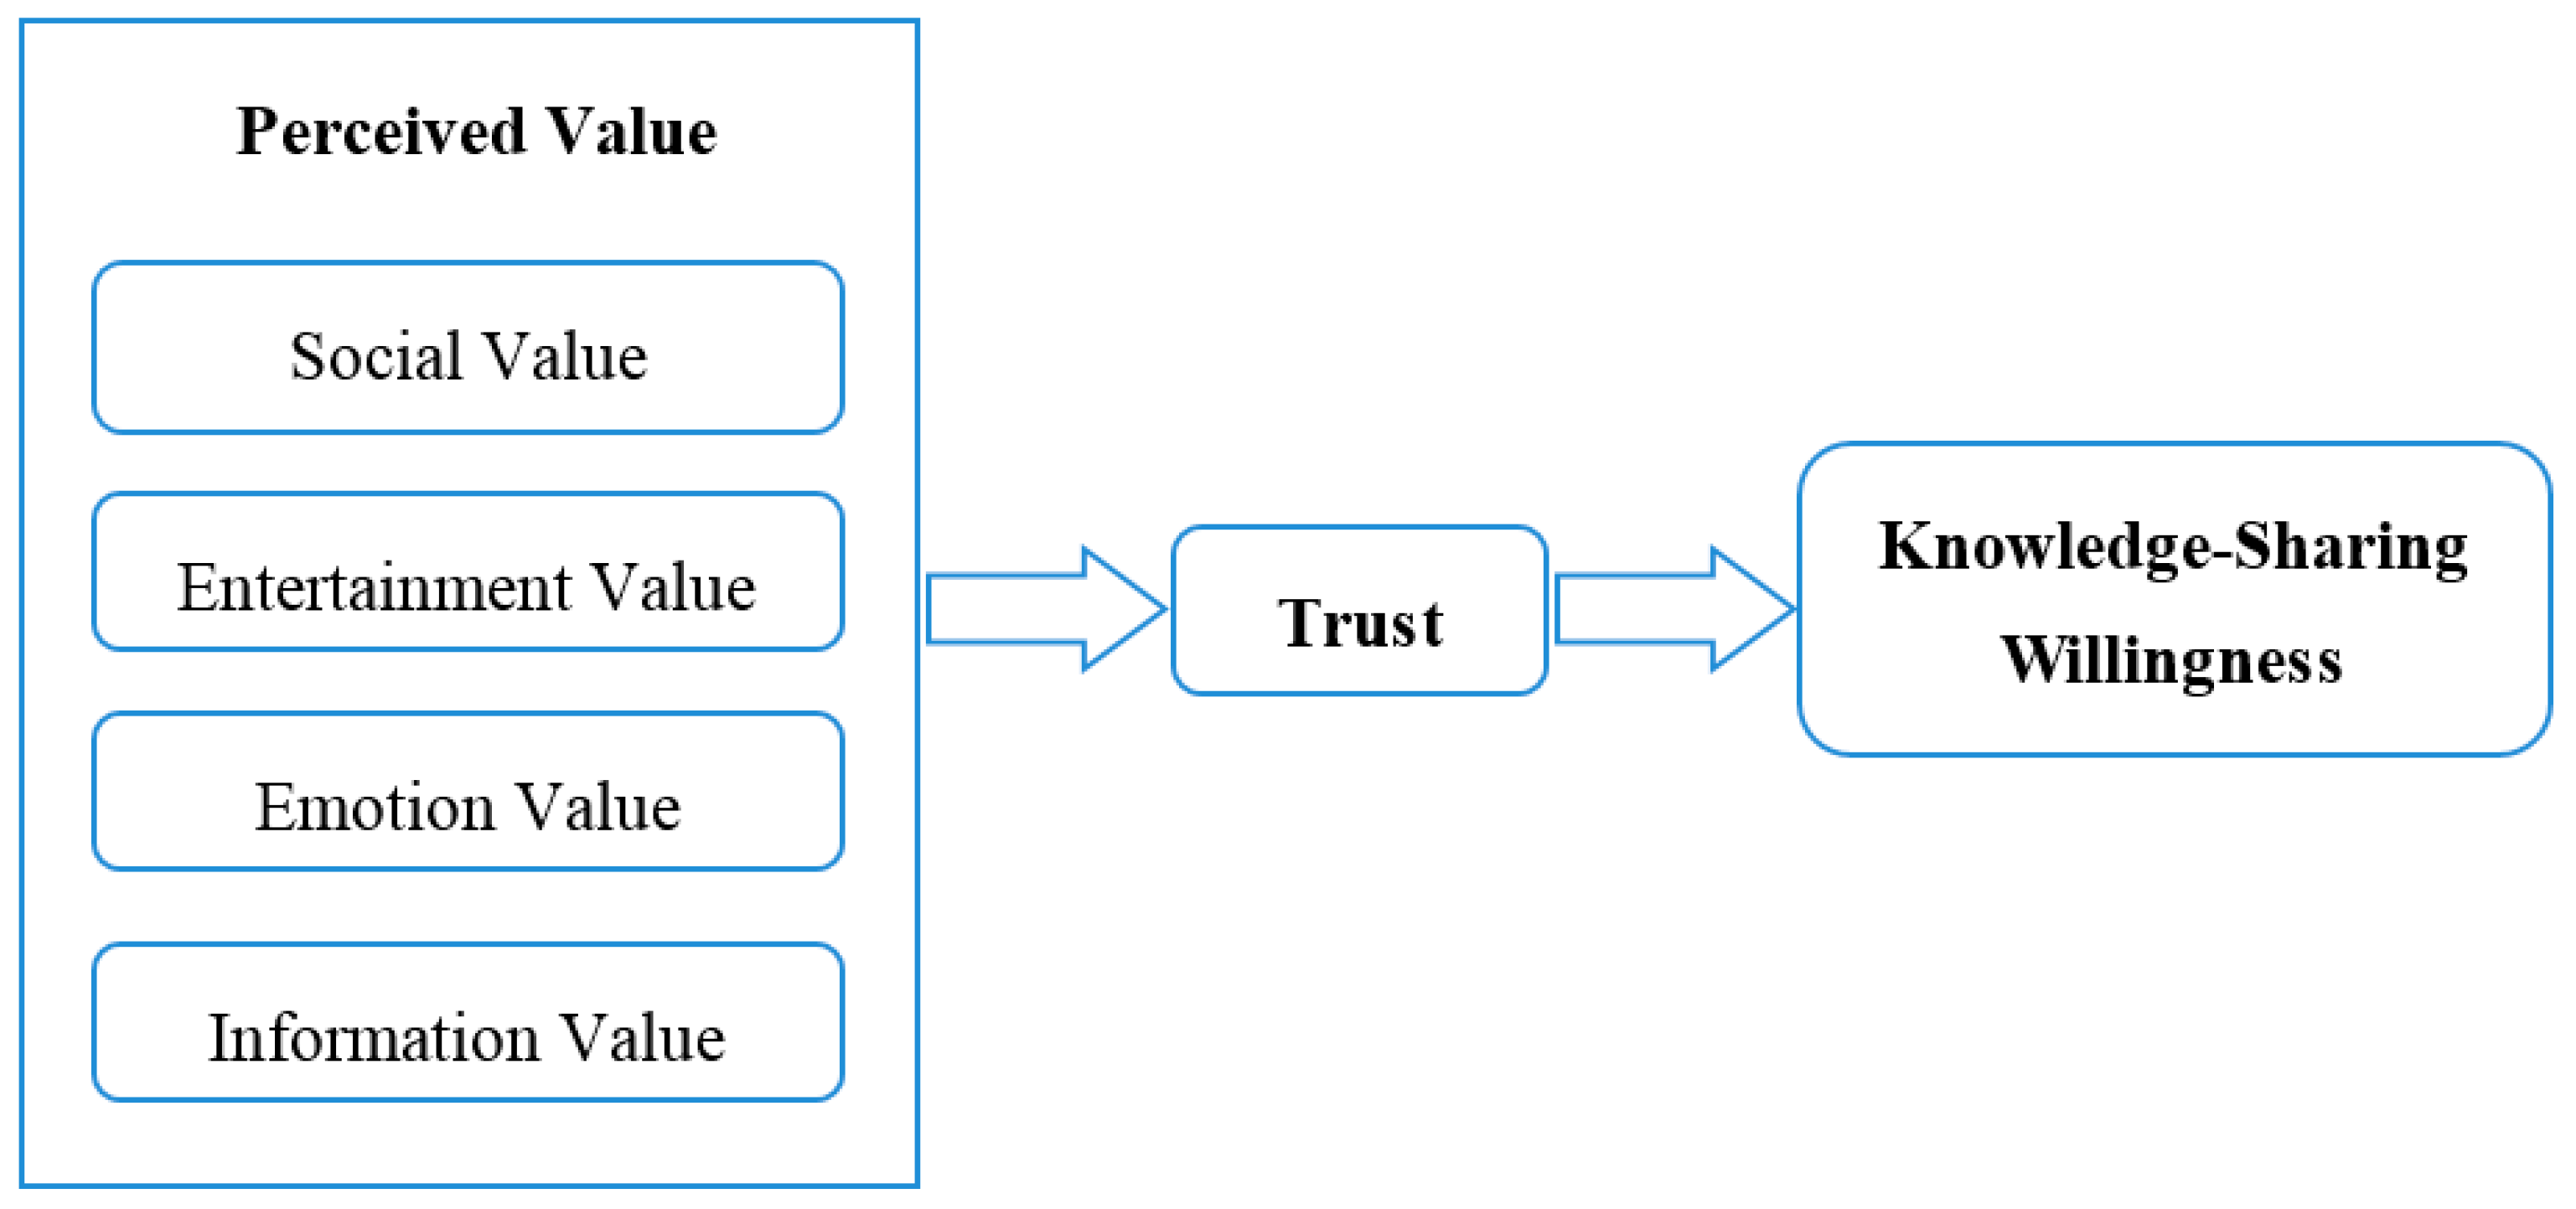
Table 1.
Variables in the research model.
| Role | Variable | Description |
|---|---|---|
| Independent Variables | Social Value [27,28,29] | The enhanced value that users get through knowledge-sharing behavior in social network |
| Entertainment Value [28] | The value add-ons of entertainment aspects when users participate in knowledge sharing in social networks. | |
| Emotion Value [27] | The sentimental feeling of users when they conduct knowledge-sharing behavior in social networks | |
| Information Value [27,28,29] | The value of information in social networks which users get from information exploration, reading, reply, and sharing. | |
| Mediating Variable | Trust [30,31,32] | The belief of users in social networks and other members because of the satisfaction of social networks on user needs. |
| Dependent Variable | Knowledge-Sharing Willingness | The willingness of users in sharing knowledge about services or products to other members in social network platforms. |
Table 2.
Research questions and corresponding hypotheses.
| Question Number | Research Question | Corresponding Hypothesis |
|---|---|---|
| Q1 | What influences exist between independent variables and the mediating variable (trust)? | H1, H2, H3, H4 |
| Q2 | How does the mediating variable (trust) impact the dependent variable (knowledge-sharing willingness)? | H5 |
| Q3 | How does a factor in the research model play intermediate role between other factors? | H6, H7, H8, H9 |
Table 3.
Indicators of the questionnaire.
| Construct | Question Code | Measurement Problem |
|---|---|---|
| Social Value [27,28,29] | Q101 | Social networks enable me to make a number of new friends with similar interests. |
| Q102 | Social networks enrich my social relationships in the real world. | |
| Q103 | The activities in social networks enrich my daily social life. | |
| Entertainment Value [28] | Q201 | Social networks make me happy especially when I am boring. |
| Q202 | I would like to spend time on social networks compared with other things. | |
| Q203 | I feel very funny to post messages, have discussions, and communications in social networks. | |
| Emotion Value [27] | Q301 | I feel satisfied when I share some knowledge with my friends in social network. |
| Q302 | The interesting information in social networks can motivate me to make knowledge sharing in social networks. | |
| Q303 | I am emotionally involved in social networks because of my experiences on participating in social network activities. | |
| Information Value [27,28,29] | Q401 | Social networks are helpful for me to get necessary information from other users or places. |
| Q402 | The comments of my friends in social networks are of referential values to me. | |
| Q403 | Social network has been one of the major ways for me to share knowledge and information with other people. | |
| Trust [30,31,32] | Q501 | Social networks have a trustable technological mechanism in information security and protection. |
| Q502 | Users in social networks are trustable. | |
| Q503 | The information and activities in social networks are trustable. | |
| Q504 | Overall, social network platforms are worth trusting. | |
| Knowledge-Sharing Willingness | Q601 | I would make comments, forward posts, or @my friends in social networks. |
| Q602 | I would share knowledge and information from social networks with my friends or family members. | |
| Q603 | I would share knowledge and information from social networks to my personal information space (such as friend circle in Wechat (http://wx.qq.com)). | |
| Q604 | I would share knowledge and information from social networks to other network platforms. | |
| Q605 | I would share my personal experiences about social networks with other members. |
Table 4.
Pre-analysis of the reliability and validity of variables.
| Variable | Cronbach’s α | KMO Value | Bartlett’s Test of Sphericity | |||
|---|---|---|---|---|---|---|
| Approximate Chi-Square | Freedom | Significance | Cumulative Variance Contribution Rate | |||
| Social Value | 0.867 | 0.731 | 71.736 | 3 | <0.001 | 79.19% |
| Entertainment Value | 0.836 | 0.688 | 63.025 | 3 | <0.001 | 75.94% |
| Emotion Value | 0.800 | 0.703 | 45.743 | 3 | <0.001 | 71.47% |
| Information Value | 0.710 | 0.652 | 29.263 | 3 | <0.001 | 65.84% |
| Trust | 0.859 | 0.763 | 91.752 | 6 | <0.001 | 70.47% |
| Knowledge-Sharing Willingness | 0.872 | 0.786 | 130.974 | 10 | <0.001 | 67.20% |
| Cronbach’s α = 0.924 | ||||||
Table 5.
Basic statistics of the surveyed users.
| Item | Category | Count | Percentage |
|---|---|---|---|
| Gender | Male | 107 | 43.7% |
| Female | 138 | 56.3% | |
| Age | ≤18 | 8 | 3.3% |
| 19–24 | 159 | 64.9% | |
| 25–34 | 73 | 29.8% | |
| 35–44 | 4 | 1.6% | |
| ≥45 | 1 | 0.4% | |
| Education Background | High School | 5 | 2.0% |
| College Education | 6 | 2.4% | |
| Bachelor | 144 | 58.8% | |
| Master and Ph.D. | 90 | 36.7% |
Table 6.
Statistics of using social networks.
| Item | Category | Count | Percentage |
|---|---|---|---|
| Social-Network Tool Used | 108 | 44.1% | |
| 116 | 47.3% | ||
| Microblog | 19 | 7.8% | |
| Others | 2 | 0.8% | |
| Duration of Using Social Networks | Less than 0.5 year | 6 | 2.4% |
| 0.5–1 year | 8 | 3.3% | |
| 1–2 years | 12 | 4.9% | |
| Over 2 years | 219 | 89.4% | |
| Average Daily Time Spent on Social Networks | Less than 1 h | 33 | 13.5% |
| 1–2 h | 84 | 34.3% | |
| 2–3 h | 53 | 21.6% | |
| 3–4 h | 32 | 13.1% | |
| Over 4 h | 43 | 17.6% | |
| Number of Friends in Social Networks | Less than 50 | 39 | 15.9% |
| 50–100 | 60 | 24.5% | |
| 100–200 | 66 | 26.9% | |
| Over 200 | 80 | 32.7% | |
| Frequency of Using Social Networks | 2–3 times/week | 19 | 7.8% |
| 4–6 times/week | 29 | 11.8% | |
| Over 7 times/week | 197 | 80.4% |
Table 7.
Reliability and validity analysis on variables.
| Variable | Cronbach’s α | KMO Value | Bartlett’s Test of Sphericity | |||
|---|---|---|---|---|---|---|
| Approximate Chi-Square | Freedom | Significance | Cumulative Variance Contribution Rate | |||
| Social Value | 0.859 | 0.718 | 346.285 | 3 | <0.001 | 78.10% |
| Entertainment Value | 0.816 | 0.710 | 255.183 | 3 | <0.001 | 73.17% |
| Emotion Value | 0.844 | 0.716 | 309.000 | 3 | <0.001 | 76.29% |
| Information Value | 0.738 | 0.684 | 158.254 | 3 | <0.001 | 65.63% |
| Trust | 0.880 | 0.833 | 505.144 | 6 | <0.001 | 73.49% |
| Knowledge-Sharing Willingness | 0.903 | 0.874 | 729.616 | 10 | <0.001 | 72.00% |
| Cronbach’s α = 0.940 | ||||||
Table 8.
Variance of independent variables.
| Component | Initial Eigenvalue | Sum of Squares of Extracted Load | ||||
|---|---|---|---|---|---|---|
| Total | Percentage Variance | Cumulative Percentage | Total | Percentage Variance | Cumulative Percentage | |
| 1 | 6.077 | 50.638 | 50.638 | 6.077 | 50.638 | 50.638 |
| 2 | 1.157 | 9.641 | 60.279 | 1.157 | 9.641 | 60.279 |
| 3 | 0.973 | 8.110 | 68.389 | 0.973 | 8.110 | 68.389 |
| 4 | 0.735 | 6.125 | 74.514 | 0.735 | 6.125 | 74.514 |
| 5 | 0.597 | 4.978 | 79.492 | |||
| 6 | 0.512 | 4.263 | 83.755 | |||
| 7 | 0.453 | 3.772 | 87.527 | |||
| 8 | 0.395 | 3.293 | 90.819 | |||
| 9 | 0.332 | 2.768 | 93.588 | |||
| 10 | 0.272 | 2.267 | 95.855 | |||
| 11 | 0.264 | 2.199 | 98.053 | |||
| 12 | 0.234 | 1.947 | 100.000 | |||
Table 9.
Factor loading matrix.
| Question | Measurement Problem | Component | |||
|---|---|---|---|---|---|
| Social Value | Entertainment Value | Emotion Value | Information Value | ||
| Q101 | Social networks enable me to make a number of new friends with similar interests. | 0.852 | |||
| Q102 | Social networks enrich my social relationships in the real world. | 0.820 | |||
| Q103 | The activities in social networks enrich my daily social life. | 0.720 | |||
| Q201 | Social networks make me happy especially when I am boring. | 0.826 | |||
| Q202 | I would like to spend time on social networks compared with other things. | 0.763 | |||
| Q203 | I feel very funny to post messages, have discussions, and communications in social networks. | 0.676 | |||
| Q301 | I feel satisfied when I share some knowledge with my friends in social network. | 0.833 | |||
| Q302 | The interesting information in social networks can motivate me to make knowledge sharing in social networks. | 0.784 | |||
| Q303 | I am emotionally involved in social networks because of my experiences on participating in social network activities. | 0.582 | |||
| Q401 | Social networks are helpful for me to get necessary information from other users or places. | 0.825 | |||
| Q402 | The comments of my friends in social networks are of referential values to me. | 0.685 | |||
| Q403 | Social network has been one of the major ways to share knowledge and information with other people. | 0.681 | |||
Table 10.
Variance of the mediating variable.
| Component | Initial Eigenvalue | Sum of Squares of Extracted Load | ||||
|---|---|---|---|---|---|---|
| Total | Percentage Variance | Cumulative Percentage | Total | Percentage Variance | Cumulative Percentage | |
| 1 | 2.940 | 73.488 | 73.488 | 2.940 | 73.488 | 73.488 |
| 2 | 0.431 | 10.782 | 84.270 | |||
| 3 | 0.351 | 8.765 | 93.035 | |||
| 4 | 0.279 | 6.965 | 100.000 | |||
Table 11.
Load matrix of the trust factor.
| Question | Measurement Problem | Component |
|---|---|---|
| Trust | ||
| Q501 | Social networks have a trustable technological mechanism in information security and protection. | 0.892 |
| Q502 | Users in social networks are trustable. | 0.858 |
| Q503 | The information and activities in social networks are trustable. | 0.856 |
| Q504 | Overall, social network platforms are worth trusting. | 0.822 |
Table 12.
Variance of the dependent variable.
| Component | Initial Eigenvalue | Sum of Squares of Extracted Load | ||||
|---|---|---|---|---|---|---|
| Total | Percentage Variance | Cumulative Percentage | Total | Percentage Variance | Cumulative Percentage | |
| 1 | 3.600 | 72.000 | 72.000 | 3.600 | 72.000 | 72.000 |
| 2 | 0.487 | 9.738 | 81.738 | |||
| 3 | 0.343 | 6.857 | 88.594 | |||
| 4 | 0.299 | 5.980 | 94.574 | |||
| 5 | 0.271 | 5.426 | 100.000 | |||
Table 13.
Load matrix of the knowledge-sharing willingness factor.
| Question | Measurement Problem | Component |
|---|---|---|
| Knowledge-Sharing Willingness | ||
| Q601 | I would make comments, forward posts, or @my friends in social networks. | 0.852 |
| Q602 | I would share knowledge and information from social networks with my friends or family members. | 0.850 |
| Q603 | I would share knowledge and information from social networks to my personal information space (such as friend circle in Wechat). | 0.849 |
| Q604 | I would share knowledge and information from social networks to other network platforms. | 0.848 |
| Q605 | I would share my personal experiences about social networks with other members. | 0.844 |
Table 14.
Overall results of the correlation analysis.
| Social Value | Entertainment Value | Emotion Value | Information Value | Trust | Knowledge-Sharing Willingness | |
|---|---|---|---|---|---|---|
| Overall Mean | 3.493 | 3.401 | 3.386 | 3.612 | 2.960 | 3.525 |
| Standard Deviation | 0.828 | 0.804 | 0.823 | 0.736 | 0.770 | 0.707 |
Table 15.
Correlation analysis between independent variables and trust.
| Independent Variable | Index | Mediation Variable (Trust) |
|---|---|---|
| Social Value | Pearson correlation | 0.417 |
| Significant (two-tailed) | <0.001 | |
| Entertainment Value | Pearson correlation | 0.440 |
| Significant (two-tailed) | <0.001 | |
| Emotion Value | Pearson correlation | 0.559 |
| Significant (two-tailed) | <0.001 | |
| Information Value | Pearson correlation | 0.422 |
| Significant (two-tailed) | <0.001 |
Table 16.
Correlation analysis between trust and knowledge-sharing willingness.
| Independent Variable | Index | Dependent Variable (Knowledge-Sharing Willingness) |
|---|---|---|
| Trust | Pearson correlation | 0.473 |
| Significant (two-tailed) | <0.001 |
Table 17.
Regression analysis on social value and knowledge-sharing willingness.
| Independent Variable/Dependent Variable | R2 | Adjusted R2 | F | Sig. | Standardized Coefficient β |
|---|---|---|---|---|---|
| Social Value/Knowledge-Sharing Willingness | 0.303 | 0.300 | 105.545 | <0.001 | 0.550 |
Table 18.
Regression analysis on social value and trust.
| Independent Variable/Dependent Variable | R2 | Adjusted R2 | F | Sig. | Standardized Coefficient β |
|---|---|---|---|---|---|
| Social Value/Trust | 0.174 | 0.170 | 51.056 | <0.001 | 0.417 |
Table 19.
Regression analysis on social value, trust, and knowledge-sharing willingness.
| Independent Variable/Dependent Variable | R2 | Adjusted R2 | F | Sig. | Standardized Coefficient β |
|---|---|---|---|---|---|
| Social Value + Trust/Knowledge-Sharing Willingness | 0.375 | 0.370 | 72.568 | <0.001 | 0.427 0.295 |
Table 20.
Regression analysis on entertainment value and knowledge-sharing willingness.
| Independent Variable/Dependent Variable | R2 | Adjusted R2 | F | Sig. | Standardized Coefficient β |
|---|---|---|---|---|---|
| Entertainment Value/Knowledge-Sharing Willingness | 0.378 | 0.375 | 147.387 | <0.001 | 0.614 |
Table 21.
Regression analysis on entertainment value and trust.
| Independent Variable/Dependent Variable | R2 | Adjusted R2 | F | Sig. | Standardized Coefficient β |
|---|---|---|---|---|---|
| Entertainment Value/Trust | 0.194 | 0.191 | 58.432 | <0.001 | 0.440 |
Table 22.
Regression analysis on entertainment value, trust, and knowledge-sharing willingness.
| Independent Variable/Dependent Variable | R2 | Adjusted R2 | F | Sig. | Standardized Coefficient β |
|---|---|---|---|---|---|
| Entertainment Value + Trust/Knowledge-Sharing Willingness | 0.429 | 0.424 | 90.750 | <0.001 | 0.504 0.252 |
Table 23.
Regression analysis on emotion value and knowledge-sharing willingness.
| Independent Variable/Dependent Variable | R2 | Adjusted R2 | F | Sig. | Standardized Coefficient β |
|---|---|---|---|---|---|
| Emotion Value/Knowledge-Sharing Willingness | 0.488 | 0.486 | 231.706 | <0.001 | 0.699 |
Table 24.
Regression analysis on emotion value and trust.
| Independent Variable/Dependent Variable | R2 | Adjusted R2 | F | Sig. | Standardized Coefficient β |
|---|---|---|---|---|---|
| Emotion Value/Trust | 0.313 | 0.310 | 110.670 | <0.001 | 0.559 |
Table 25.
Regression analysis on emotion value, trust, and knowledge-sharing willingness.
| Independent Variable/Dependent Variable | R2 | Adjusted R2 | F | Sig. | Standardized Coefficient β |
|---|---|---|---|---|---|
| Emotion Value + Trust/Knowledge-Sharing Willingness | 0.498 | 0.494 | 120.045 | <0.001 | 0.631 0.120 |
Table 26.
Regression analysis on information value and knowledge-sharing willingness.
| Independent Variable/Dependent Variable | R2 | Adjusted R2 | F | Sig. | Standardized Coefficient β |
|---|---|---|---|---|---|
| Information Value/Knowledge-Sharing Willingness | 0.291 | 0.288 | 99.809 | <0.001 | 0.540 |
Table 27.
Regression analysis on information value and trust.
| Independent Variable/Dependent Variable | R2 | Adjusted R2 | F | Sig. | Standardized Coefficient β |
|---|---|---|---|---|---|
| Information Value/Trust | 0.178 | 0.175 | 52.668 | < 0.001 | 0.442 |
Table 28.
Regression analysis on information value, trust, and knowledge-sharing willingness.
| Independent Variable/Dependent Variable | R2 | Adjusted R2 | F | Sig. | Standardized Coefficient β |
|---|---|---|---|---|---|
| Information Value + Trust/Knowledge-Sharing Willingness | 0.365 | 0.359 | 69.418 | <0.001 | 0.413 0.299 |
Table 29.
Summary of hypothesis validation.
| Number | Hypothesis | Validation Result |
|---|---|---|
| H1 | Users’ perceived social value in social networks positively affects their trust of knowledge sharing in social networks. | established |
| H2 | Users’ perceived social value in social networks positively affects their trust of knowledge sharing in social networks. | established |
| H3 | Users’ perceived emotion value in social networks positively affects their trust of knowledge sharing in social networks. | established |
| H4 | Users’ perceived information value in social networks positively affects their trust of knowledge sharing in social networks. | established |
| H5 | Users’ trust of social networks positively affects their willingness toward knowledge sharing in social networks. | established |
| H6 | Users’ trust of social networks plays an intermediary role between users’ perceived social value and their knowledge-sharing willingness in social networks. | partial intermediary |
| H7 | Users’ trust of social networks plays an intermediary role between users’ perceived entertainment value and their knowledge-sharing willingness in social networks. | partial intermediary |
| H8 | Users’ trust of social networks plays an intermediary role between users’ perceived emotion value and their knowledge-sharing willingness in social networks. | partial intermediary |
| H9 | Users’ trust of social networks plays an intermediary role between users’ perceived information value and their knowledge-sharing willingness in social networks. | partial intermediary |
© 2018 by the authors. Licensee MDPI, Basel, Switzerland. This article is an open access article distributed under the terms and conditions of the Creative Commons Attribution (CC BY) license (http://creativecommons.org/licenses/by/4.0/).
Share and Cite
MDPI and ACS Style
Zhao, J.; Zhu, C.; Peng, Z.; Xu, X.; Liu, Y. User Willingness toward Knowledge Sharing in Social Networks. Sustainability 2018, 10, 4680. https://doi.org/10.3390/su10124680
AMA Style
Zhao J, Zhu C, Peng Z, Xu X, Liu Y. User Willingness toward Knowledge Sharing in Social Networks. Sustainability. 2018; 10(12):4680. https://doi.org/10.3390/su10124680
Chicago/Turabian StyleZhao, Jie, Chanjuan Zhu, Zhixiang Peng, Xin Xu, and Yan Liu. 2018. "User Willingness toward Knowledge Sharing in Social Networks" Sustainability 10, no. 12: 4680. https://doi.org/10.3390/su10124680
Note that from the first issue of 2016, this journal uses article numbers instead of page numbers. See further details here.