Comprehensive Analysis of Nitrogen Deposition in Urban Ecosystem: A Case Study of Xiamen City, China


1
Key Lab of Urban Environment and Health, Institute of Urban Environment, Chinese Academy of Sciences, Xiamen 361021, China
2
University of Chinese Academy of Sciences, Beijing 100049, China
3
Sino-Japan Friendship Centre for Environmental Protection, Beijing 100029, China
4
Guizhou Academy of Testing and Analysis, 338 Baisha Road, Guiyang, Guizhou 550014, China
5
School of Environmental Science and Engineering, Shanghai Jiao Tong University, Shanghai 200240, China
6
Institute of Industrial Economics, Jiangsu University, Zhenjiang 212013, China
7
Xiamen Key Lab of Urban Metabolism, Xiamen, Fujian 361021, China
*
Authors to whom correspondence should be addressed.
Sustainability 2018, 10(12), 4673; https://doi.org/10.3390/su10124673
Submission received: 27 August 2018
/
Revised: 4 December 2018
/
Accepted: 4 December 2018
/
Published: 7 December 2018
Abstract
:Atmospheric nitrogen deposition can supply nitrogen for ecosystems while posing a serious threat to ecological security. An assessment of the ecological risks caused by atmospheric nitrogen deposition is critical for urban sustainable development. Based on “Ecological Risk Analysis” and the “Driver-Pressure-State-Response (DPSR) framework,” this paper established a comprehensive ecological risk assessment model and assessed the ecological risk of nitrogen deposition in Xiamen City, China. The results showed that the risk from nitrogen deposition to the forest ecosystem is high due to the impact of nitrogen deposition on the residual rate of litter and survival rate of seedlings. The risks to freshwater and marine ecosystems were determined to be high and moderate, respectively, due to the promotion of eutrophication by nitrogen. The risk to farm ecosystems was low due to the impact on weeds. The proportion of high-risk areas in Xiamen City was 37.1%. Among the districts of Xiamen City, Tong’an and Xiang’an had the highest proportion of high-risk areas (48%) and low-risk areas (31.8%), respectively.
1. Introduction
Over the past several decades, China’s urbanization has been characterized by rapid economic and industrial development, resulting in the extensive use of fossil fuels and consequently a rapid, striking and continuous increase in nitrogen oxide (NOX) emissions [1,2]. At present, China is the third largest acid deposition zone in the world, after the United States and Europe [3]. With increasing nitrogen deposition, the structure, processes and functions of ecosystems such as soil, vegetation and aquatic systems are altered. On the one hand, proper nitrogen deposition can benefit ecosystems. For example, in most temperate forest ecosystems, nitrogen competition between vegetation and microorganisms can be buffered, while the ecosystem’s capacity for productivity and carbon sink capacity can be increased; thus, elevated atmospheric carbon dioxide concentrations can be mitigated by nitrogen deposition [4]. In addition, nitrogen deposition is an important way to compensate for soil nitrogen loss [5] and nitrogen deposition can promote the photosynthetic capacity of algae in aquatic ecosystems, which can promote the growth of algae and thereby provide oxygen for fish growth and maintain the stability of aquatic ecosystems [6]. On the other hand, excessive nitrogen deposition can negatively impact ecosystems by decreasing soil pH, increasing the activity of certain toxic and harmful inorganic elements such as mercury and cadmium in the soil [7] and inhibiting the activity of certain enzymes, microorganisms and animals in the soil [8], resulting in a reduced rate of litter degradation in the soil. Increases in nitrogen deposition can disrupt plant nutritional balance, interfere with metabolism and destroy plant tissues [9,10], thereby inhibiting photosynthesis and the uptake of nutrients by plants and ultimately inhibiting plant growth [11] and reducing plant tolerance to environmental stress [12]. Increases in nitrogen deposition can induce water eutrophication [13,14] and the rapid proliferation of algae, which cause turbid water with decreased clarity. At the same time, the chromaticity of the water also changes and the water may become toxic. The resulting low oxygen content can cause severe hypoxia and kill fish, thus reducing biodiversity [15]. These environmental changes may seriously affect the quality of human life and restrict the development of a society and its economy [16] and they will likely become severe challenges in China’s pursuit of sustainable urbanization [17,18,19].
Faced with similar environmental problems, some countries and regions around the world have established networks to monitor nitrogen deposition. However, monitoring networks have not yet been established at the municipal level. Similarly, on the regional scale, Europe, Asia, South America and Africa have constructed networks and projects to monitor acid deposition [20], which include the Acid Deposition Monitoring Network in East Asia (EANET), as well as the European Monitoring and Evaluation Program (EMEP) and Experimental Manipulation of Forest Ecosystems in Europe (EXMAN) [21]. On a national scale, Canada, China and other countries have established acid deposition monitoring networks such as the Canadian Air and Precipitation Monitoring Network (CAPMoN) and the Integrated Monitoring Program on Acidification of Chinese Terrestrial Systems (IMPACTS) [22].
Ecological risk assessment can be used as a basis for future urban ecological risk management and decision-making. It can also provide theoretical and methodological support for sustainable urban development [23,24]. With increasing interest in nitrogen deposition, ecological risk assessments have gradually begun to be applied to study this process. On a global scale, Bobbink et al. [25] assessed the impact of nitrogen deposition on the diversity of terrestrial ecosystems; on the regional scale, Ochoa et al. [26] studied its effects on Mediterranean-type ecosystems. Xu et al. [27] used the Goddard Earth Observing System-Chem (GEOS-Chem) model to assess the relative contribution of nitrogen emitted by different sectors to total dissolved inorganic nitrogen (DIN) deposition in the Yangtze River basin. On the national scale, some research teams assessed the risks posed by nitrogen deposition to alpine ecosystems [28], forest ecosystems [29,30] and various ecosystems in Australia [31]. Yao et al. [32] assessed the effects of nitrogen deposition on the nitrogen uptake and water use efficiency of C3 and C4 plants. In sum, numerous experts and scholars have assessed the risks of nitrogen deposition in different types of natural ecosystems and at different spatial scales. Most existing studies have been aimed at a single ecosystem and have not analyzed the mechanism of nitrogen deposition in an ecosystem quantitatively.
With the increasing attention focused on ecological risk, many ecological risk assessment models have been developed. For aquatic ecosystems, the Comprehensive Aquatic Systems Model (CASM-SUMA) has been used to evaluate the ecological risk of pollutants in lakes [33], whereas the Toxswa+Paddy-Pearl (TOP-RICE) model and AQuATox model are widely used to evaluate the ecological risk posed by different pollutants such as organochlorine pesticides and polycyclic aromatic hydrocarbons to water bodies [34,35]. The Generic Estimated Exposure Concentration (GENEEC) model is used in low-level assessments of aquatic ecological risk [36]. For farmland ecosystem, the Pesticide Root Zone Model-Exposure Analysis Modeling System (PRZM-EXAMS) and the Pesticide in Flooded Application Model (PFAM) are used to assess the ecological risk of farmland pollutants [37,38] and the Relative Risk Model (RRM) is used to assess the ecological risks of various land uses [39]. For the atmospheric ecosystem, the Time Reversed Mirror Model (TRM) is used to assess the ecological risk of harmful air pollutants in multiple media [40]. In sum, existing assessment models were mostly developed for a single ecosystem and the operating costs associated with capturing the required parameters for these models is often high, with a high level of technical proficiency required. Moreover, if these models are applied in other countries, substantial corrections and subsequent developments are required, complicating the use of these models.
In addition to ecological risk assessment models, monitoring networks and research standards, the Driver-Pressure-State-Response (DPSR) framework, has been used to facilitate ecological risk management. This framework evolved from the pressure-state-response (PSR) framework, which was initially developed by the Organization of Economic Cooperation and Development (OECD) in 1993 and was further developed by the European Environmental Agency (EEA) in 1999, which led to the DPSR framework as it is known today [41]. Since then, the DPSR framework has been widely adopted in many environmental management studies. Existing research utilizing the DPSR framework can be divided into three groups of studies addressing water bodies, soil and other systems, respectively [42]. For water bodies, Men and Gebremedhin et al. [43,44] used the PSR framework to assess the vulnerability of water resources and the sustainability of fish and fisheries, respectively. For soil, Lin [45] used the DPSR framework to investigate the environmental impacts of changes in the agricultural production systems, whereas Seydehmet et al. [46] used it to predict light salinization of a soil salinization area in an oasis. For other systems, Sekovski [47] applied the DPSR framework to elaborate on the role of coastal megacities in environmental degradation and their contribution to global climate change, whereas Ingram et al. [48] used the DPSR framework to study complex social-ecological interactions using participatory modeling. Therefore, the DPSR framework has the potential to causally link existing environmental data collected in previous studies with effects and can capture the relationship between humans and the environment; thus, it can be utilized to determine effective management measures and approaches for managers and decision makers.
It is clear that existing monitoring networks and research standards are generally on the global, regional, or national scale and most research on the effects of nitrogen deposition is focused on natural ecosystems. However, only a few studies have accurately assessed the effects of nitrogen deposition on urban ecosystems and at city scale [49]. However, because an urban ecosystem’s resistance against diseases and pests is weak compared with that of natural ecosystems and its status as an ecological shelter is unstable [50,51], the impact of nitrogen deposition on such ecosystems is likely to be more significant. Besides, only a healthy urban ecosystem can support urban development [52] but no internationally recognized ecological risk assessment model for nitrogen deposition has yet been developed. Here, based on the DPSR framework, this paper established a multi-receptor methodology and quantitative method of analysis based on a comprehensive ecological risk assessment model of single-city ecological risk that can be used to develop policy recommendations for the sustainable development of regional ecosystems.
2. Comprehensive Assessment Model for the Ecological Risk of Nitrogen Deposition
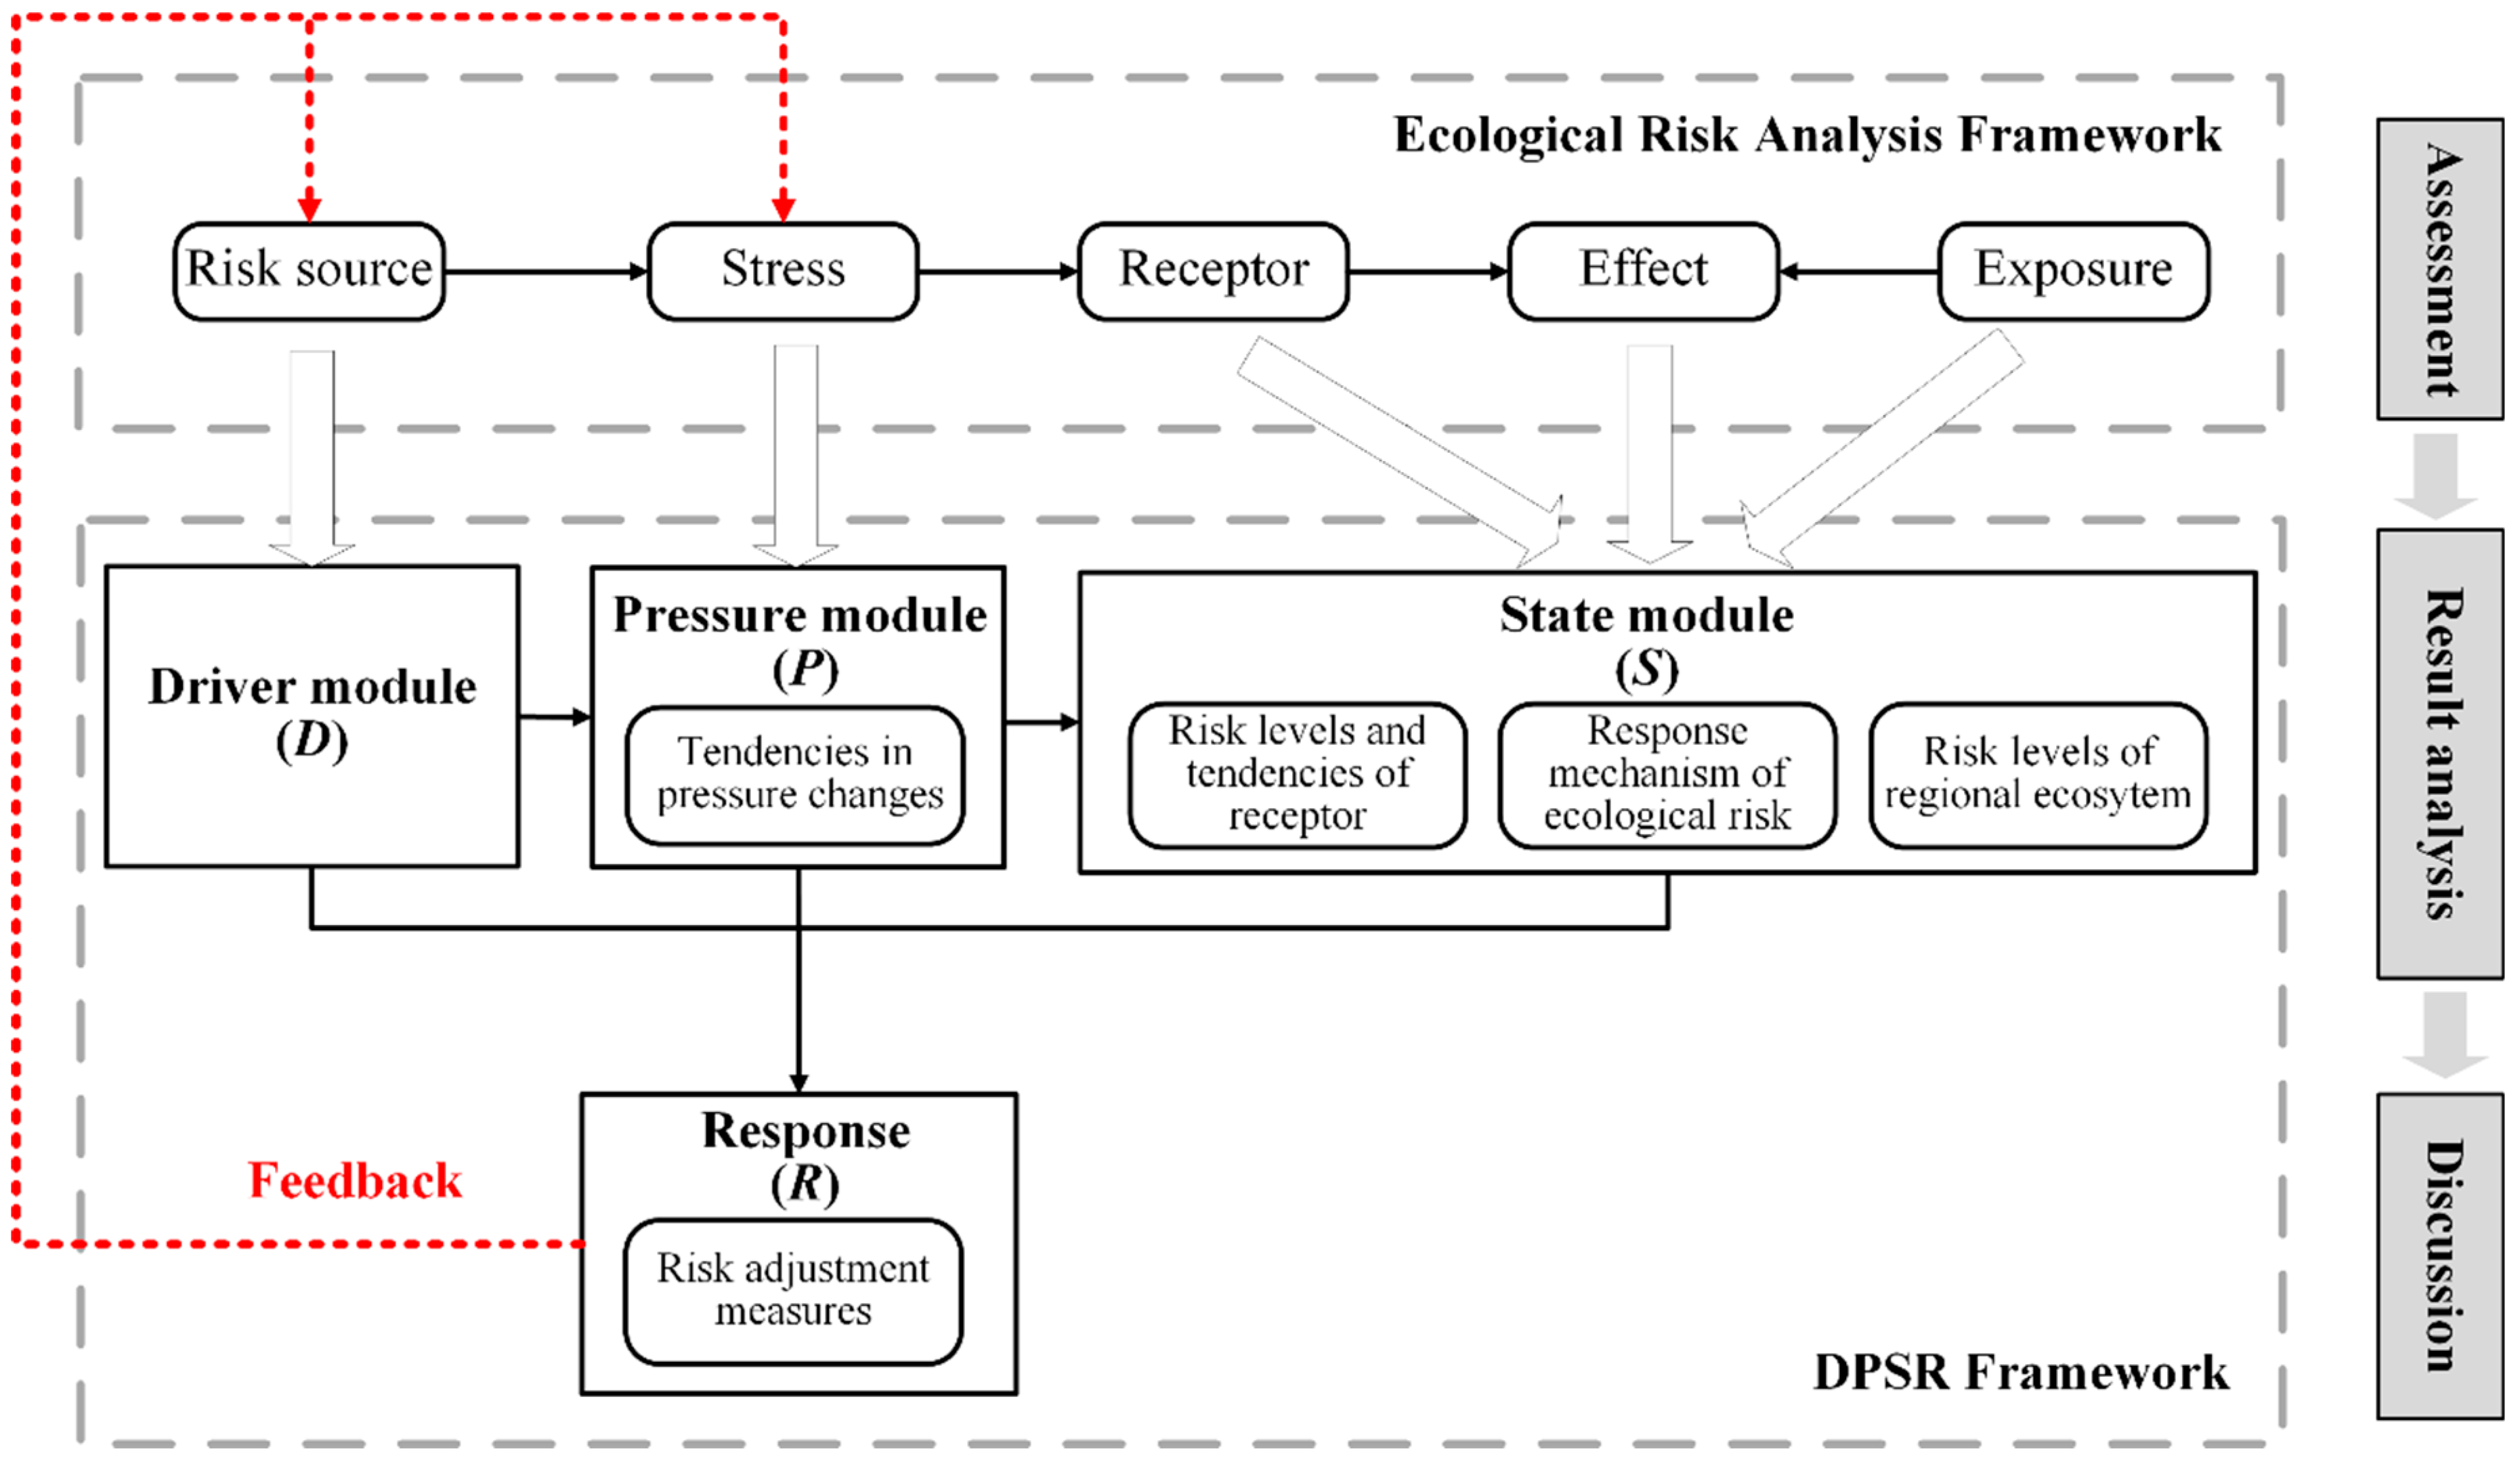
According to Tang’s research based on the urban ecological risk assessment framework [53] and DPSR framework, a comprehensive assessment model to evaluate the ecological risk of nitrogen deposition was developed to systematically conduct a risk assessment and propose management options, as shown in Figure 1. This model includes two parts. First, the ecological risk analysis framework is used to assess risk factors; second, the DPSR framework is used to analyze the assessment results and propose measures to adjust ecological risk.
Identifying the components of ecological risk are critical to risk assessment [53], so the ecological risk analysis framework was used to analyze the various elements of risk so that the input from each module could be utilized in the second part of the process. The framework includes five sub-modules: risk source, stress, receptor, effect and exposure. The risk source refers to the sources of chemical, physical, or biological risks that adversely affect population structure, environmental quality, or ecosystem health [54]. In this study, the risk source is the source of nitrogen deposition. Stress, which is nitrogen deposition in this study, refers to specific factors produced by the risk source that may exert a negative impact [55]. Receptor refers to risk receivers, which may be environmental factors, biological populations, communities, ecosystems, or the structures and functions of ecosystems that can be impacted by risk [56] and that can be identified through research on the impacts of risk. In this study, the receptor refers to the complex ecosystem of a certain region. This complex ecosystem corresponds to different types of land use in the study area, which are determined by regional statistical yearbooks and land use plans. The term effect is used to describe indices about receptors of nitrogen deposition and refers to the response values and the response thresholds of the indices under stress. It is determined based on an empirical exposure-response model that represents the relationship between nitrogen deposition and the response of a specific index in an ecosystem. Exposure refers to the standard used to grade the level of ecological risk and is the standard used in risk assessments and it can be determined using methods such as Delphi method, literature reviews and mathematical simulation. In this study, Delphi method was used to determine the quotients of response values and the response thresholds of indices.
The second part of the model, the DPSR framework, was used to analyze the results from the first part. The driver (D) module can be used to analyze the risk source in the first part of the model. The pressure (P) module can be used to analyze the stress (i.e., nitrogen deposition) in the first part of the model. Thus, this module uses the experimental data of the stress over time and the fitting curve based on the experimental data, which group the discrete points as close as possible, to analyze the change and the tendency of the stress, respectively. The state (S) module uses the entropy method and the exposure-reaction method is used to determine the ecological risk based on three factors in the first part of the model, that is, receptor, effect and exposure. The specific process is as follows. Firstly, the quotients of response values and the response thresholds of indices over time are used to simulate the experimental data and then the fitting curves are constructed based on the experimental data to analyze the tendencies of the indices. Subsequently, in conjunction with the exposure term in the first part of the analysis and based on a risk analysis of different indices of different ecosystems, the highest risk level for a stress factor is selected as the risk level of the ecosystem, followed by a determination of the level of the regional ecosystem. Based on the results from the D, P and S modules, the response (R) module is established to indicate the response of humans to changes in the receptor, that is, countermeasures to address the ecological risks posed by nitrogen deposition [57,58] and finally provide feedback to the risk source and stress to reduce the harm caused by nitrogen deposition.
3. Study Case and Data Use
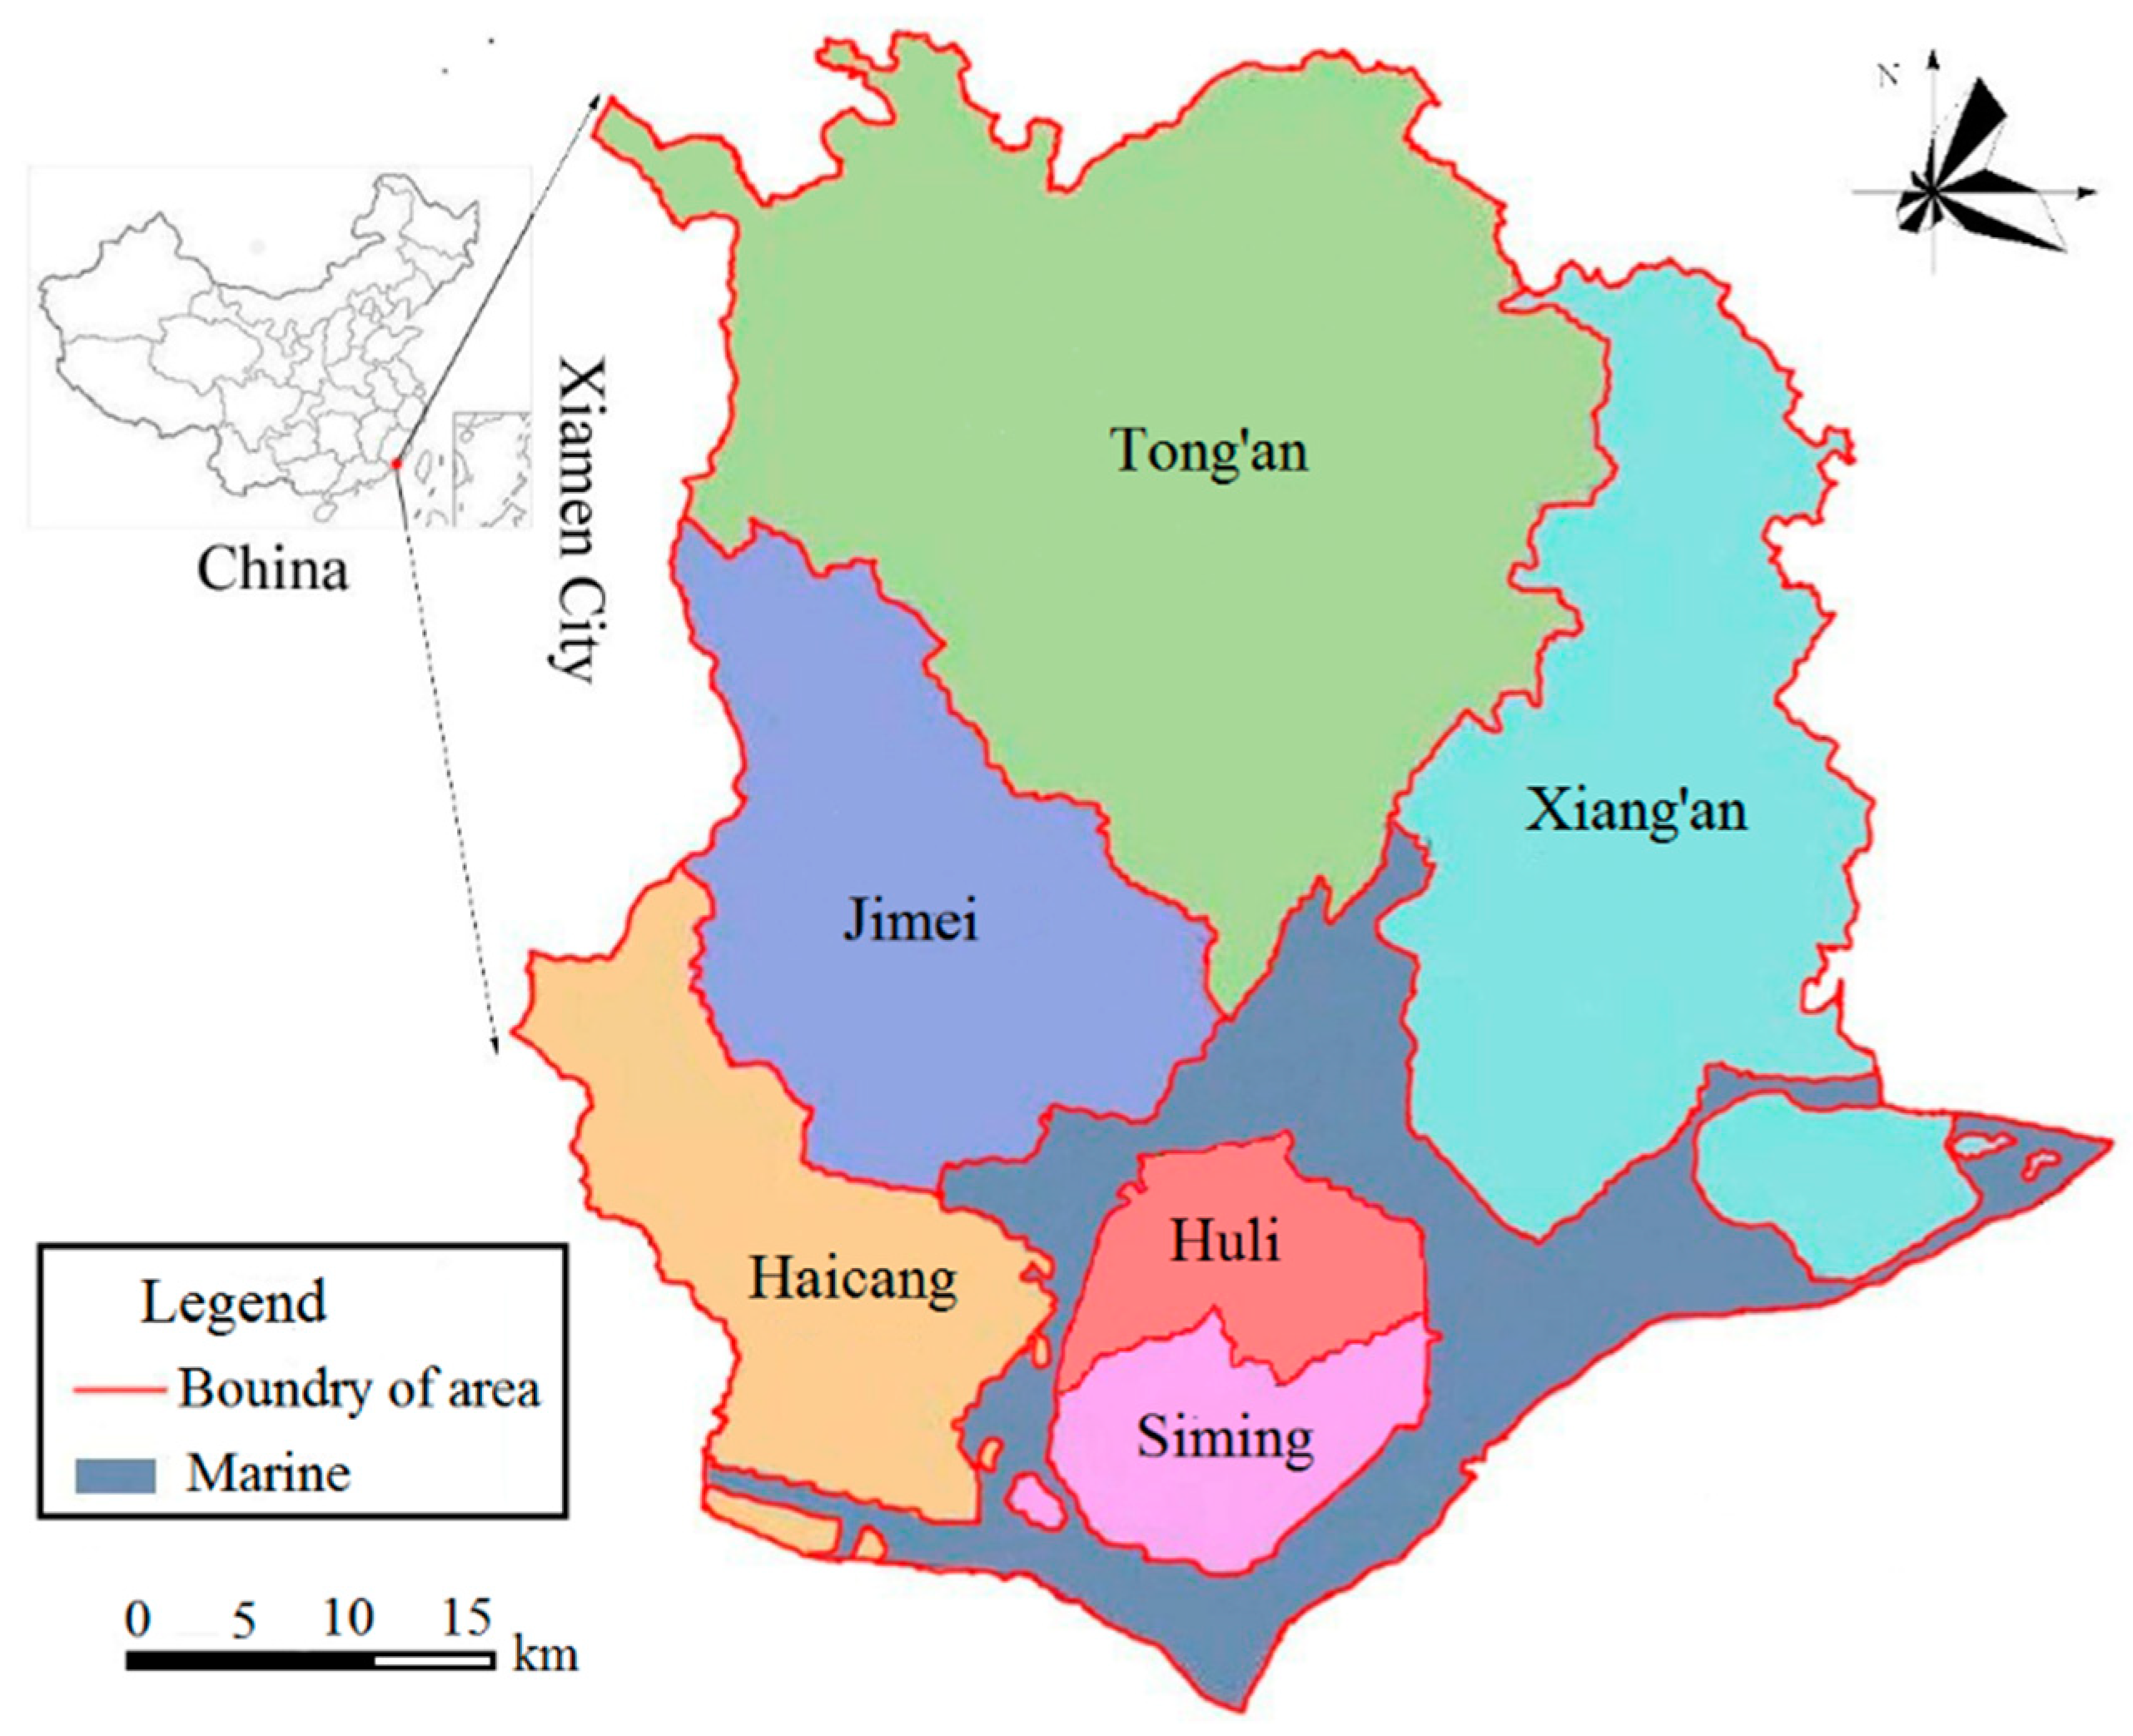
Xiamen City, located in southeast Fujian Province (24°23′–24°54′ N, 117°53′–118°26′ E) in China, is one of the five National Integrated Support Reform Pilot Areas for Development and Opening Up, as well as one of three locations in the China (Fujian) Pilot Free-Trade Zone and a demonstration zone for cross-strait cooperation in emerging industries and modern service industries. Xiamen City is also a hub for international shipping in southeastern China and a regional center for cross-strait financial services and trade. Xiamen City has a subtropical monsoon climate with moderate temperatures and frequent precipitation. In 2016, the average annual rainfall was 2168.2 mm and the average annual temperature was 21.5 °C [59]. Xiamen City, the area investigated in this study, has an area of 1565 km2 [60] and is composed of six districts: Huli, Siming, Jimei, Tong’an, Haicang and Xiang’an, as shown in Figure 2. For convenience, Siming and Huli districts were merged into a single Island district.
The research period ran from 2006–2016. Data used in this study include NO2 concentration, land use, attributes and nitrogen deposition revelation indices. The data for NO2 were obtained from the Environmental Bulletin of Xiamen City in 2011 and 2016 [60,61]. To calculate the ecosystem occupation ratio within Xiamen City, land use attribute data was obtained from Overall Planning of Land Use in Xiamen City (2006–2020) [62]. To analyze the relationship between nitrogen deposition and stress responses, relevant indices were obtained from studies on nitrogen deposition [63,64,65,66,67,68,69,70,71,72].
4. Assessment—Ecological Risk Analysis
Increased atmospheric nitrogen deposition has been observed in many regions which were disturbed by the human, especially densely populated urban areas [73,74]. Therefore, in this study, urbanization was treated as the risk source. Nitrogen deposition induced by urbanization was considered a risk for ecological stress, that is, the stress sub-module. Based on the availability of field studies, urban forest, farm and aquatic ecosystems in Xiamen City were chosen as the receptors. In the effect sub-module, based on relevant literature on the effect of nitrogen deposition in China and other countries, indices of typical species in the three ecosystems were screened and the response relationships between nitrogen deposition and these factors were obtained. Next, MATLAB software (Mathworks, Natick, MA, USA) was used to summarize and extrapolate relevant data and establish exposure-response curves to estimate risk thresholds. Based on the single pollutant index method [75], the response values for nitrogen deposition were divided by the response threshold in the exposure sub-module and the resulting quotients were used as the indices for risk evaluation. Using Delphi method, the assessment indicators were graded to obtain a standard to classify the ecological risk of nitrogen deposition in Xiamen City.
4.1. Stress Sub-Module
In the analysis of ecological risk, the P module corresponded to the risk stress, that is, nitrogen deposition. Due to current research limitations, there are no urban-scale data on nitrogen deposition in the atmosphere above China. However, one of the major constituents of nitrogen deposition is NO2 [2] and NO2 can be used as a proxy for deposited nitrogen in research. Therefore, this research chose the annual average concentration of NO2 as an index to characterize nitrogen deposition. The NO2 data published in the Environmental Bulletin of Xiamen City in 2011 and 2016 [60,61] were used as the concentrations of nitrogen deposition in Xiamen City for this study, as shown in Table 1.
Since the measure of nitrogen deposition was annual accumulation (g/m2), an essential parameter in the subsequent research, the NO2 data between 2006 and 2016 were converted using a box model. The equation for this calculation is as follows:
where x is the annual accumulation of nitrogen deposition (NO2) in Xiamen City (g/m2); is the annual average concentration of nitrogen deposition in Xiamen City (mg/m3·d), as shown in Table 1; H is the maximum height of an atmospheric environmental quality inspection station (20 m); and T is time, that is, 365 days.
4.2. Receptor Sub-Module
In the selection of a receptor for the ecological risk analysis, the ecosystems in Xiamen City were divided into farmland, water (freshwater and seawater) and forest ecosystems. The attributes of land, such as those of farmlands, water bodies and forests in the farm, forest, freshwater and marine ecosystems of Xiamen City corresponded to farm, forest, freshwater and marine land use classifications, respectively. The ecosystem occupation ratio within Xiamen City was obtained from the Overall Planning of Land Use in Xiamen City (2006–2020 years), as shown in Table 2.
4.3. Effect Sub-Module
The use of modeling in ecological risk assessment allows researchers to quantify and systematically evaluate results and modeling can play an important role in the assessment of regional risks [76]. Mathematical modeling, which is used to determine the size of an ecological risk, includes the use of methods such as the single pollutant index method and the exposure-response method. In the single pollutant index method, the concentration of a pollutant is divided by the recommended limit for that pollutant [77]. In the exposure-response method, an exposure-response curve is generated according to the estimated effects of exposure to a specific pollutant to estimate the risk level [78]. These methods have become indispensable in ecological risk assessment. Subsequently, based on a risk analysis of different ecosystems, the highest risk level for stress is selected as the risk level of the ecosystem [79].
4.3.1. Empirical Exposure-Response Model
This research developed an empirical exposure-response model. In this model, the relationship between nitrogen deposition and the response of a specific index in an ecosystem can be represented. And the response threshold, the maximum change of ecosystem indices under nitrogen deposition, also can be obtained. In this study, the urban ecosystem of Xiamen City was divided into three typical ecosystems: forest, farm and aquatic ecosystems. Next, indices were selected to correspond to the different ecosystems. For forestland, nutrients in plants are mainly returned to the soil in the litter and then absorbed by microorganisms, so the litter residual rate determines the soil nutrient supply and scale of the nutrient cycle [63]. Photosynthesis plays an important role in characterizing the effects of nitrogen deposition on plant growth and the mechanisms underlying such effects [64]. Therefore, the litter degradation rate, photosynthesis and plant growth indicators were selected to assess forest ecological risk. For farmland, rice, weeds and soil fauna are essential components. Among them, soil fauna, the carrier of energy flow and material cycling in the ecosystem, can maintain soil structure and fertility [80]. Furthermore, increased nitrogen deposition may change the composition of plant species by influencing competition among plants. Therefore, chlorophyll content, plant height, weed biomass, fresh weight and soil animal diversity were selected for use in this study [67]. For water, chlorophyll, an essential component of algae, plays an important role in eutrophication [81]. Changes in phytoplankton, an important primary producer in water, can affect water quality, energy flow and material flow. Therefore, chlorophyll content and phytoplankton productivity were selected to evaluate the effects of nitrogen deposition on aquatic ecosystems [82]. Next, using the concentrations of nitrogen deposition and relevant index values presented in the literature, an empirical model for this exposure-response relationship in each ecosystem was established using MATLAB software (Mathworks, Natick, MA, USA) and located the threshold points. The x-axis and y-axis display the exposure (concentration) and response (the severity index, evaluation index, or proportion of responses) in Table 3, respectively. For forest and farmland ecosystems, with nitrogen demand, an increase in nitrogen deposition can increase index values. After nitrogen demand is saturated, an increase in nitrogen deposition inhibits changes in these indices and the risk threshold is the saturated point of nitrogen demand [63,64,65,66,67,68]. So the relationships between nitrogen deposition and the selected indices take the shape of an inverted “U” and the response threshold is the vertex on the curve. Whereas, because the data for aquatic ecosystems only represented a single stage (saturation stage or demand stage) [69,70], the relationship between nitrogen deposition and the selected indices is linear. For aquatic ecosystems, the same principles that were used to determine the critical load were applied (i.e., the critical load is the maximum deposition of chemical compounds that do not trigger eutrophication in any part of the ecosystem or in specific receptors) and the response threshold was determined based on the external ecological load capacity.
4.3.2. The Impact of Nitrogen Deposition on Several Indices
The ratio of the pollutant concentration to the recommended concentration limit is the basis of the single pollutant index method [77]. This study used the improved single pollutant index method to assess ecological risk by replacing the pollutant concentration with the response of each index to nitrogen deposition and replacing the recommended concentration limit with the response threshold of each index for nitrogen deposition. The equation for this calculation is as follows:
where is the risk value of nitrogen deposition on index i in t year; is the response of index i to nitrogen deposition, which is calculated by substituting the accumulation of nitrogen deposition (x) into an empirical model (the “Quantitative relationship” column in Table 3); and which is derived from the “Response threshold” column in Table 3, is the response threshold of index i.
4.4. Exposure Sub-Module
Using the Delphi method [83], this research graded different ecological risks and determined the threshold values that corresponded to different risk levels. The specific procedure is that according to the particular requirements of dividing ecological risk levels, assessment items and formulate questionnaires were selected. Subsequently, experts were hired and their opinions on the criteria for classifying ecological risk levels were investigated by repeatedly distributing anonymous questionnaires until they reached an agreement. And the classification of ecological risk levels was obtained. The experts surveyed in this study were from the Research Center for Eco-Environmental Sciences, Chinese Academy of Sciences, Xiamen City Bureau of Environmental Protection and other environmental protection-related institutions. The opinions of the experts were collected, summarized and analyzed, results are shown in Table 4. Among them, with the increase of ecological risk level and the damage of nitrogen deposition to ecosystem structure, ecological process and function would be increased [84].
5. Results Analysis—DPSR Framework Model
Based on the ecological risk analysis described in Section 4, Origin software (Origin software, OriginLab, Northampton, MA, USA) was used to simulate tendencies and processes for each index, assess the ecological risks of various indices and select the highest risk in various ecosystems to determine ecosystem risk. Then, based on an analysis of the effects of nitrogen deposition on the evaluation indices, the mechanisms by which nitrogen deposition impacts multiple receptors were analyzed. Next, based on the proportions of different ecosystems in different administrative districts in Xiamen City, a risk assessment of Xiamen City was performed. Finally, based on the response module, measures to mitigate ecological risks were considered.
5.1. Analysis of Pressure
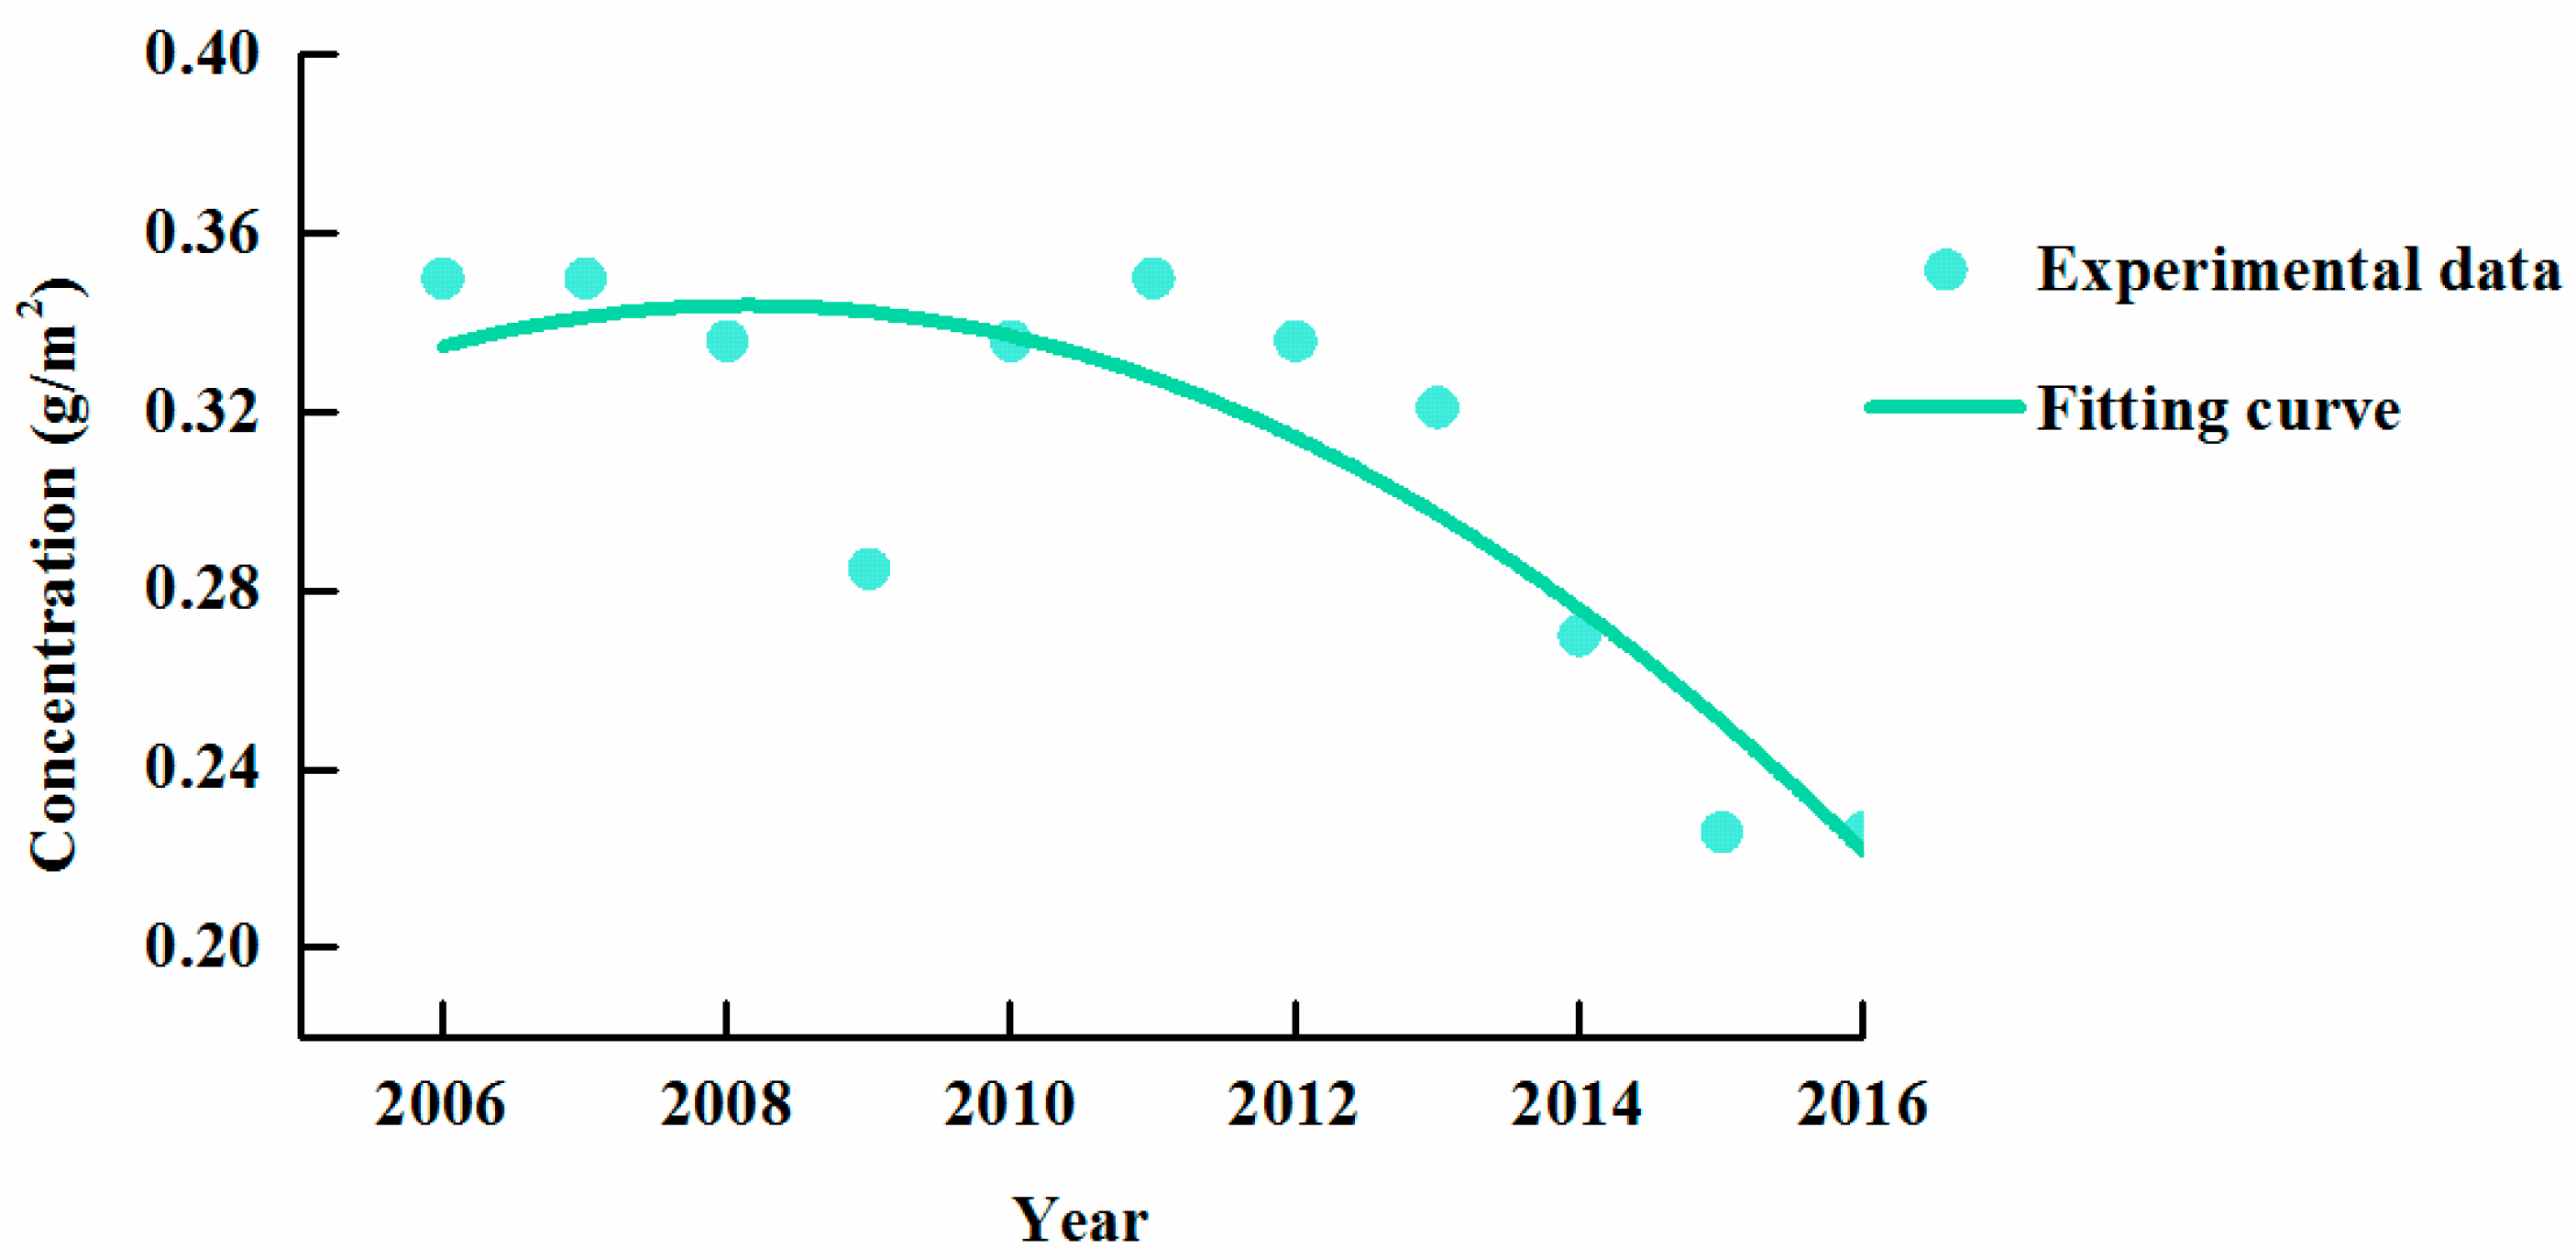
Based on the annual concentrations of nitrogen deposition (x0) between 2006 and 2016, Equation (1) was used to calculate the annual accumulation of nitrogen deposition in Xiamen City (x), as shown in Figure 3. In order to analyze the tendency of nitrogen deposition, Figure 3 shows the fitting curve based on the experimental data. Obviously, the fitting curve (R2 = 0.719) showed the general tendency, that is, a progression from a slow decline to an accelerated decline. The experimental data showed nitrogen deposition underwent large variations during this period. Nitrogen deposition decreased from 2006 to 2009, increased from 2009 to 2011 and decreased again from 2011 to 2016. The likely reason for this tendency is that vehicle exhaust pollution is the main source of nitrogen oxides [74]. In 2007, Xiamen City instituted measures to comprehensively control motor vehicle exhaust, including supervision and inspection of vehicle exhaust pollution by law enforcement, promotion of legislation regarding motor vehicle pollution prevention and control, implementation of new standards for strict emission testing and promotion and testing of new technologies for motor vehicle pollution control [85]. In 2011, nitrogen oxides were added to the constraint indices of pollutant total control by Xiamen City Bureau of Environmental Protection, which further promoted pollution control [61].
5.2. Analysis of State
5.2.1. Risk Grade Analysis for Different Types of Ecosystem in Xiamen City
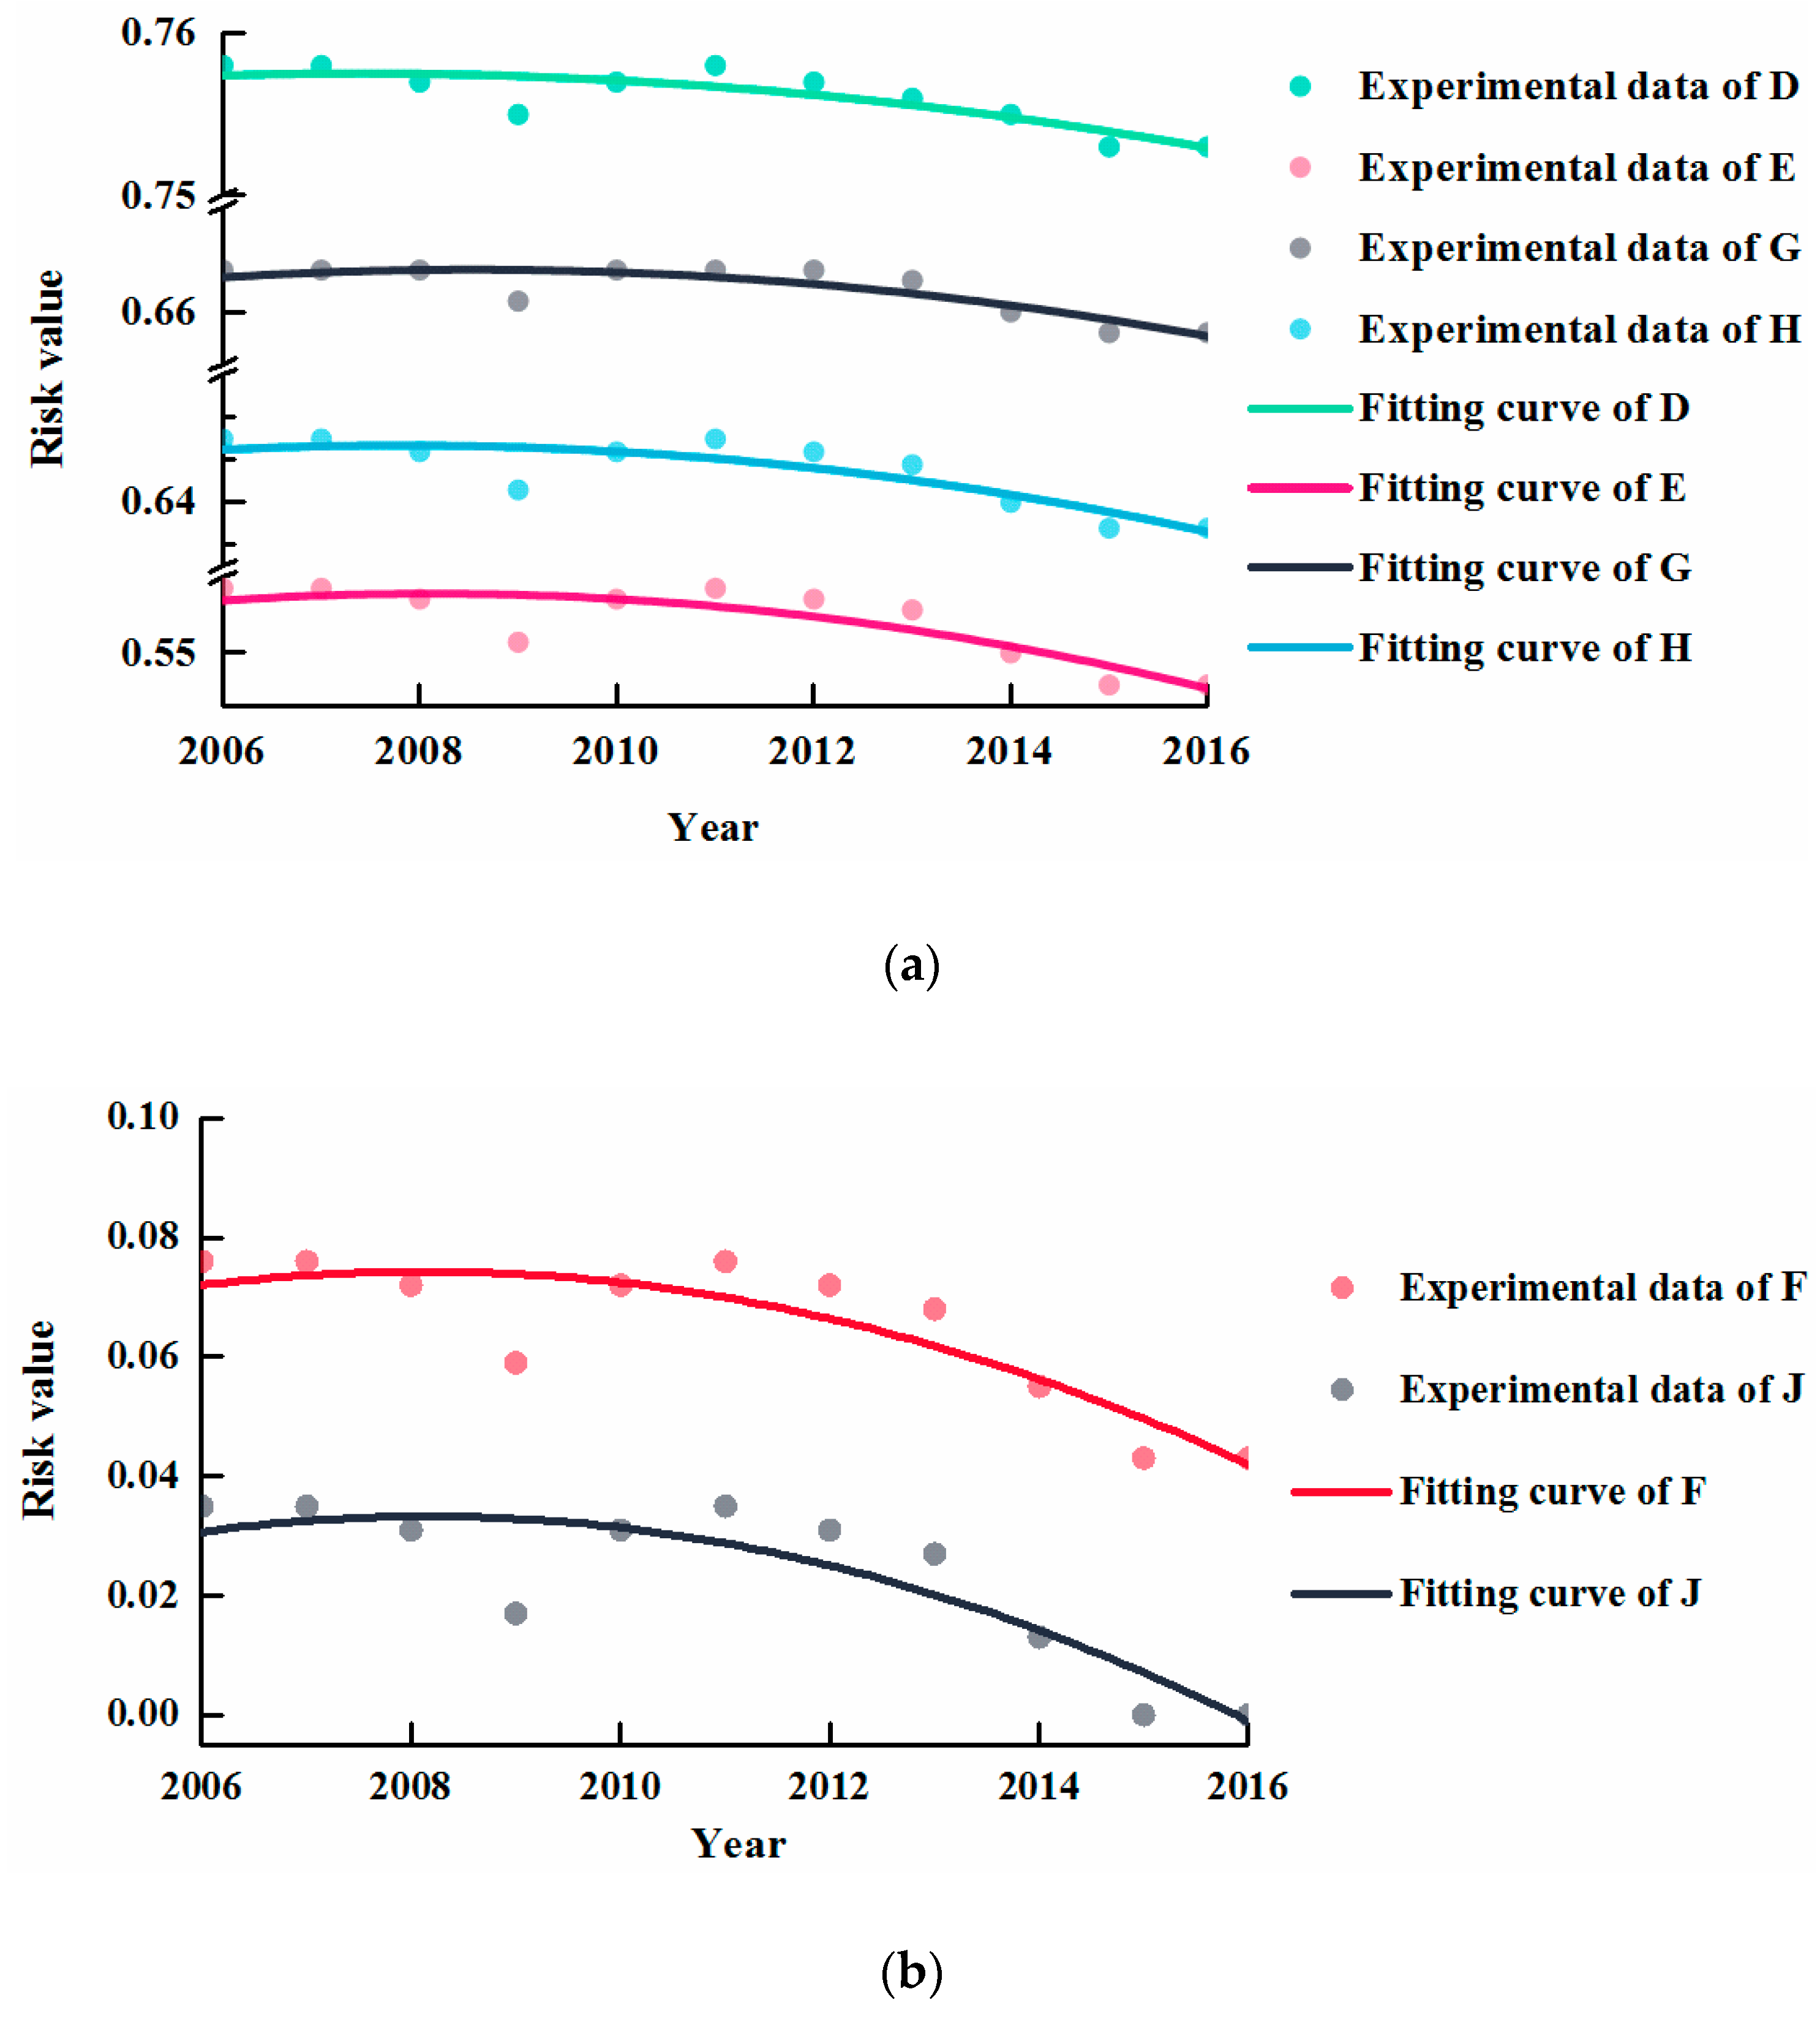
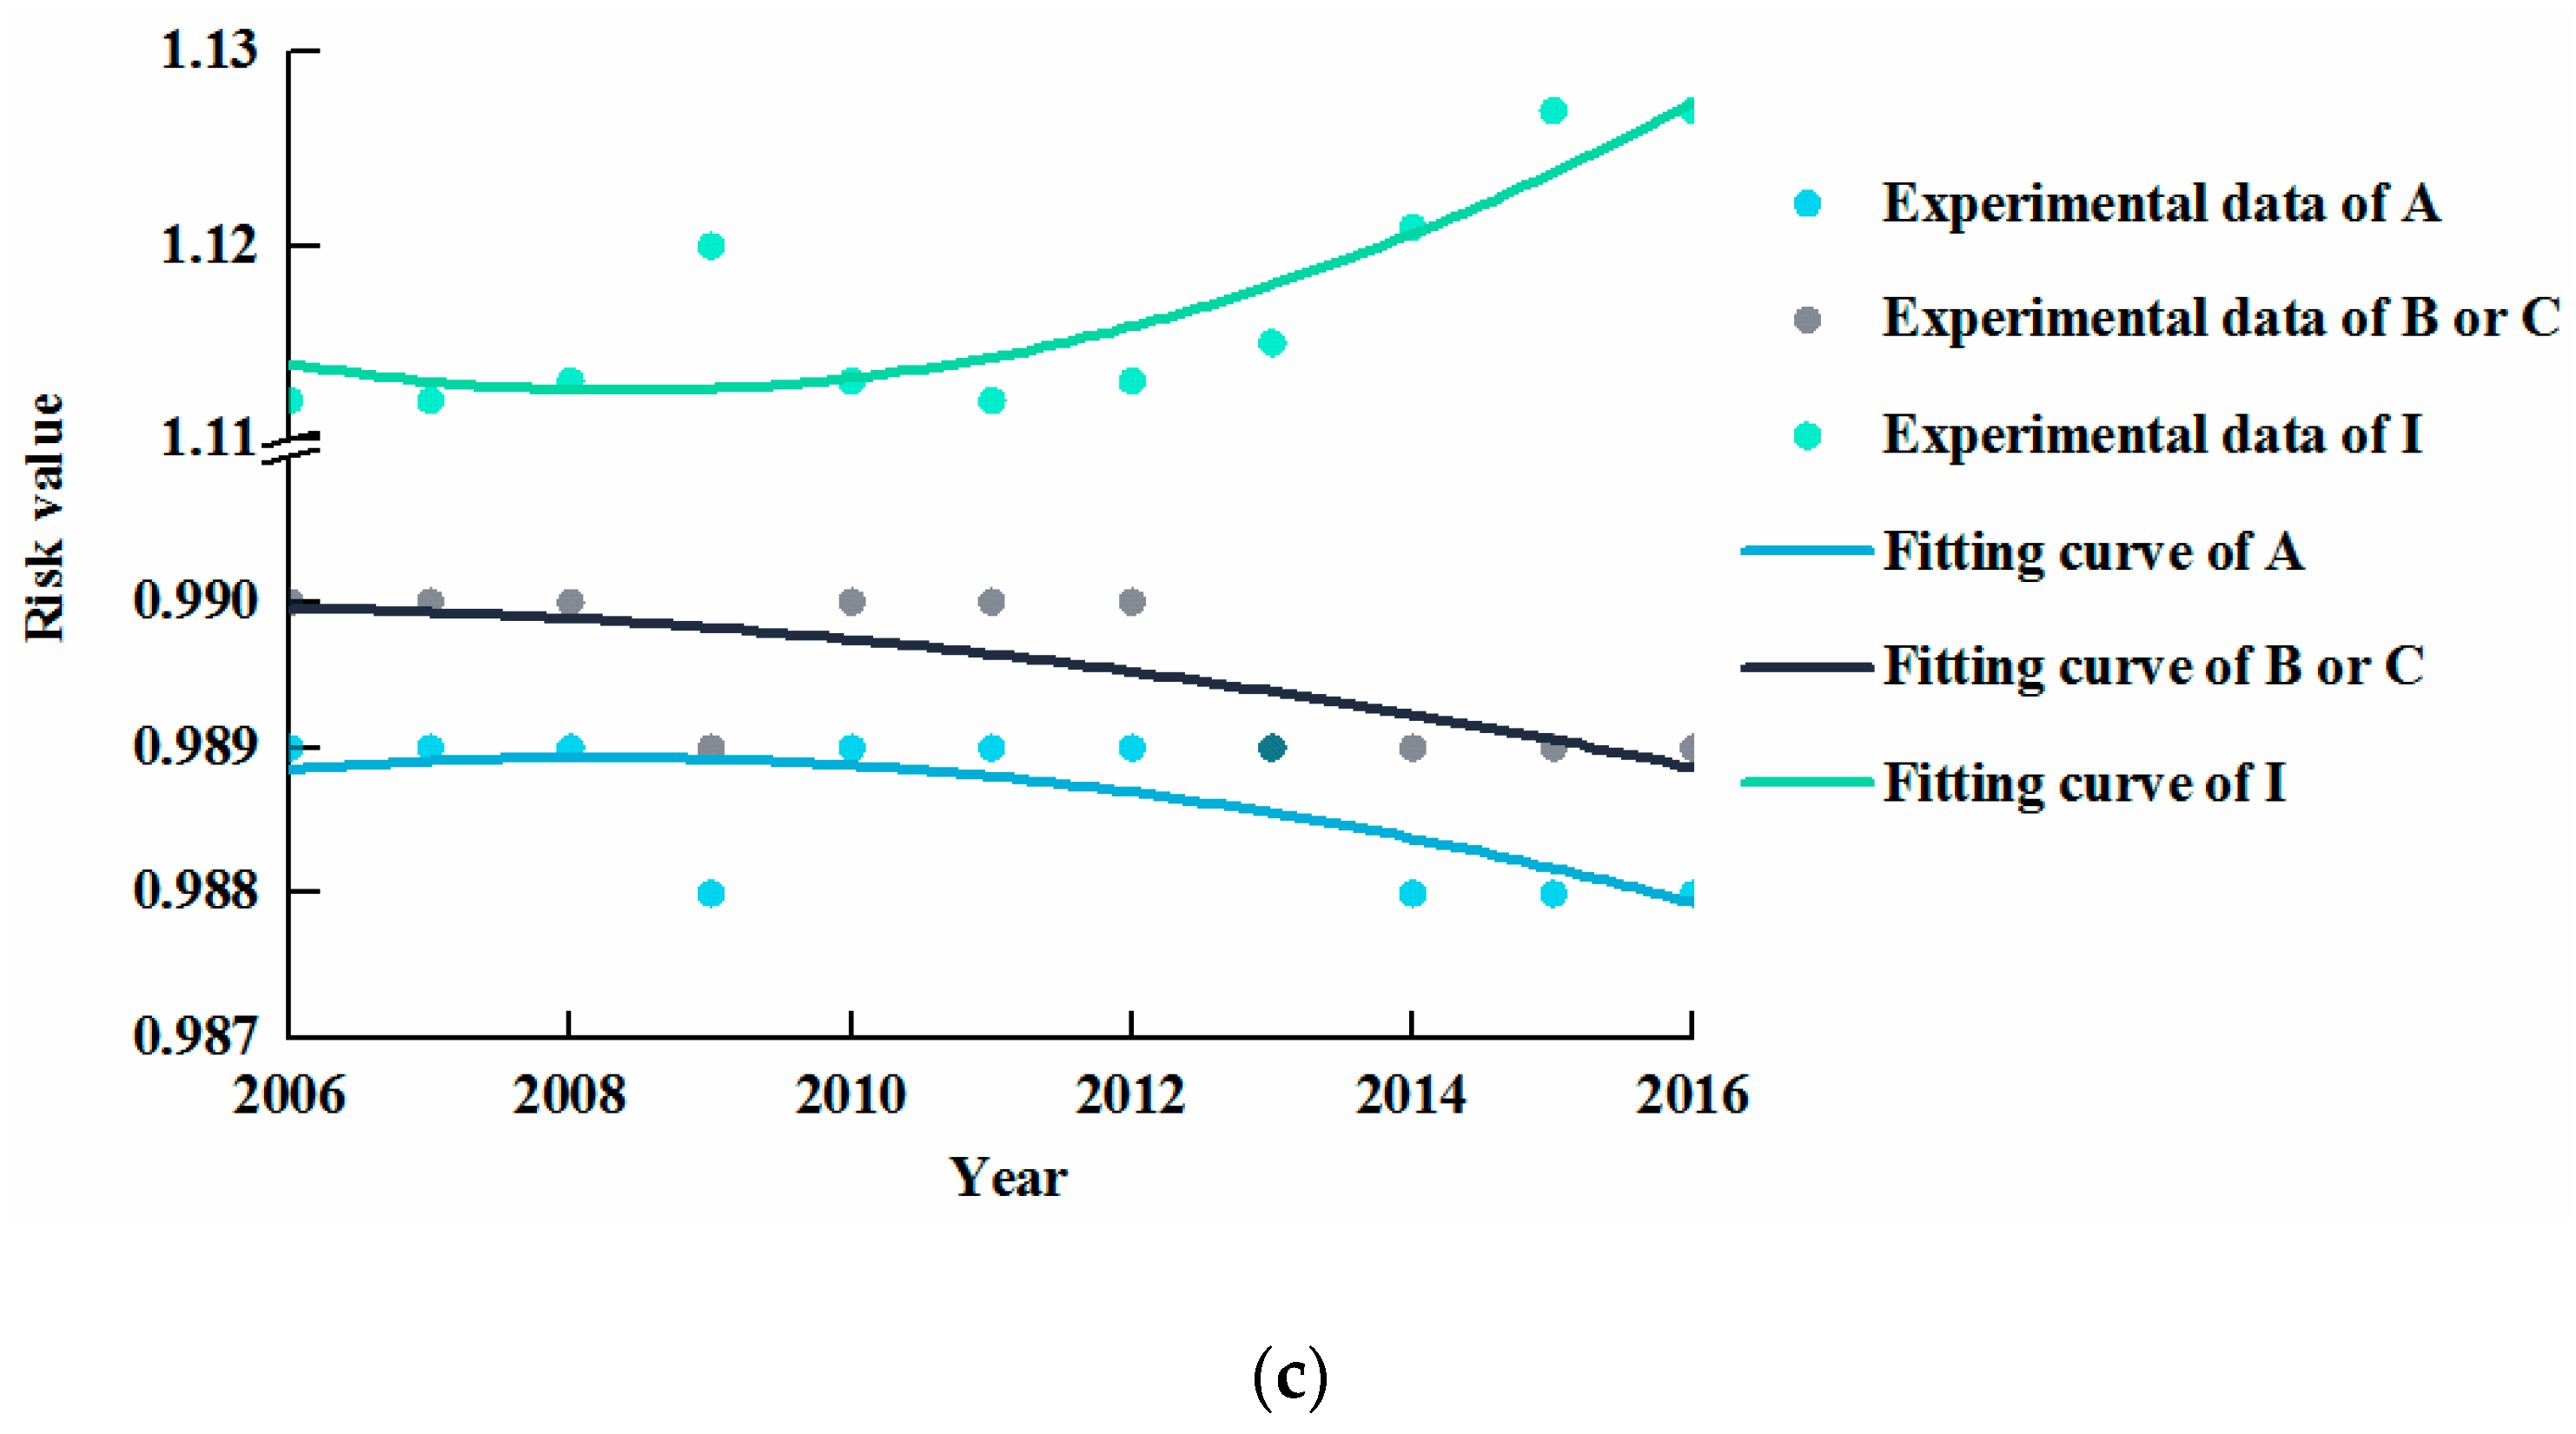
This research carried out a risk assessment using Origin software (OriginLab, Northampton, MA, USA) for each ecosystem based on the results of equation (2). In Figure 4, the effects of nitrogen deposition on different indices of the forest ecosystem are displayed and the fitting curves show the tendencies of risk values. The experimental data and fitting curves showed that the risk values of all but one of the indices fluctuated with in a manner similar to that of nitrogen deposition, indicating that nitrogen deposition exerted an effect on these indices. The tendency of the remaining index, I (the survival rate of Castanopsis chinensis seedlings) was to increase over time. As shown in Figure 4b, for two selected indices related to photosynthesis, F (the net photosynthetic rate of Cryptocarya concinna seedlings) and J (the net photosynthetic rate of Castanopsis chinensis seedlings), the risk values were both less than 0.2, which indicated that these indices were associated with a low ecological risk and that the effect of nitrogen deposition on these indices was minimal (based on data shown in Table 4, which lists the ecological risks regarding nitrogen deposition in Xiamen City). Combined with the research of Yan et al. [4], the effects of nitrogen deposition on chlorophyll can be divided into two stages: promotion and inhibition. In 2006–2016, the effect of atmospheric nitrogen deposition on photosynthesis was in the promotion stage and was relatively weak. Furthermore, the risk value of nitrogen deposition from 2006 to 2016 was higher than 0.5 for indices A, B, C, D, E, G, H and I, which suggested that the ecological risks associated with these indices were high, shown in Figure 4a,c. The impacts of nitrogen deposition on A (the residual rate of litter in the Masson pine forest), B (the residual rate of litter in coniferous forests) and C (the residual rate of litter) were due to litter decomposition. Furthermore, because nitrogen deposition posed a high risk to some forest ecosystem indices, the risk posed by nitrogen deposition to the entire forest ecosystem was also high. The analyses of these indices suggest that such risk was mainly due to the effects of nitrogen deposition on litter decomposition and seedling survival, rather than effects on the net photosynthetic rate and stomatal conductance.
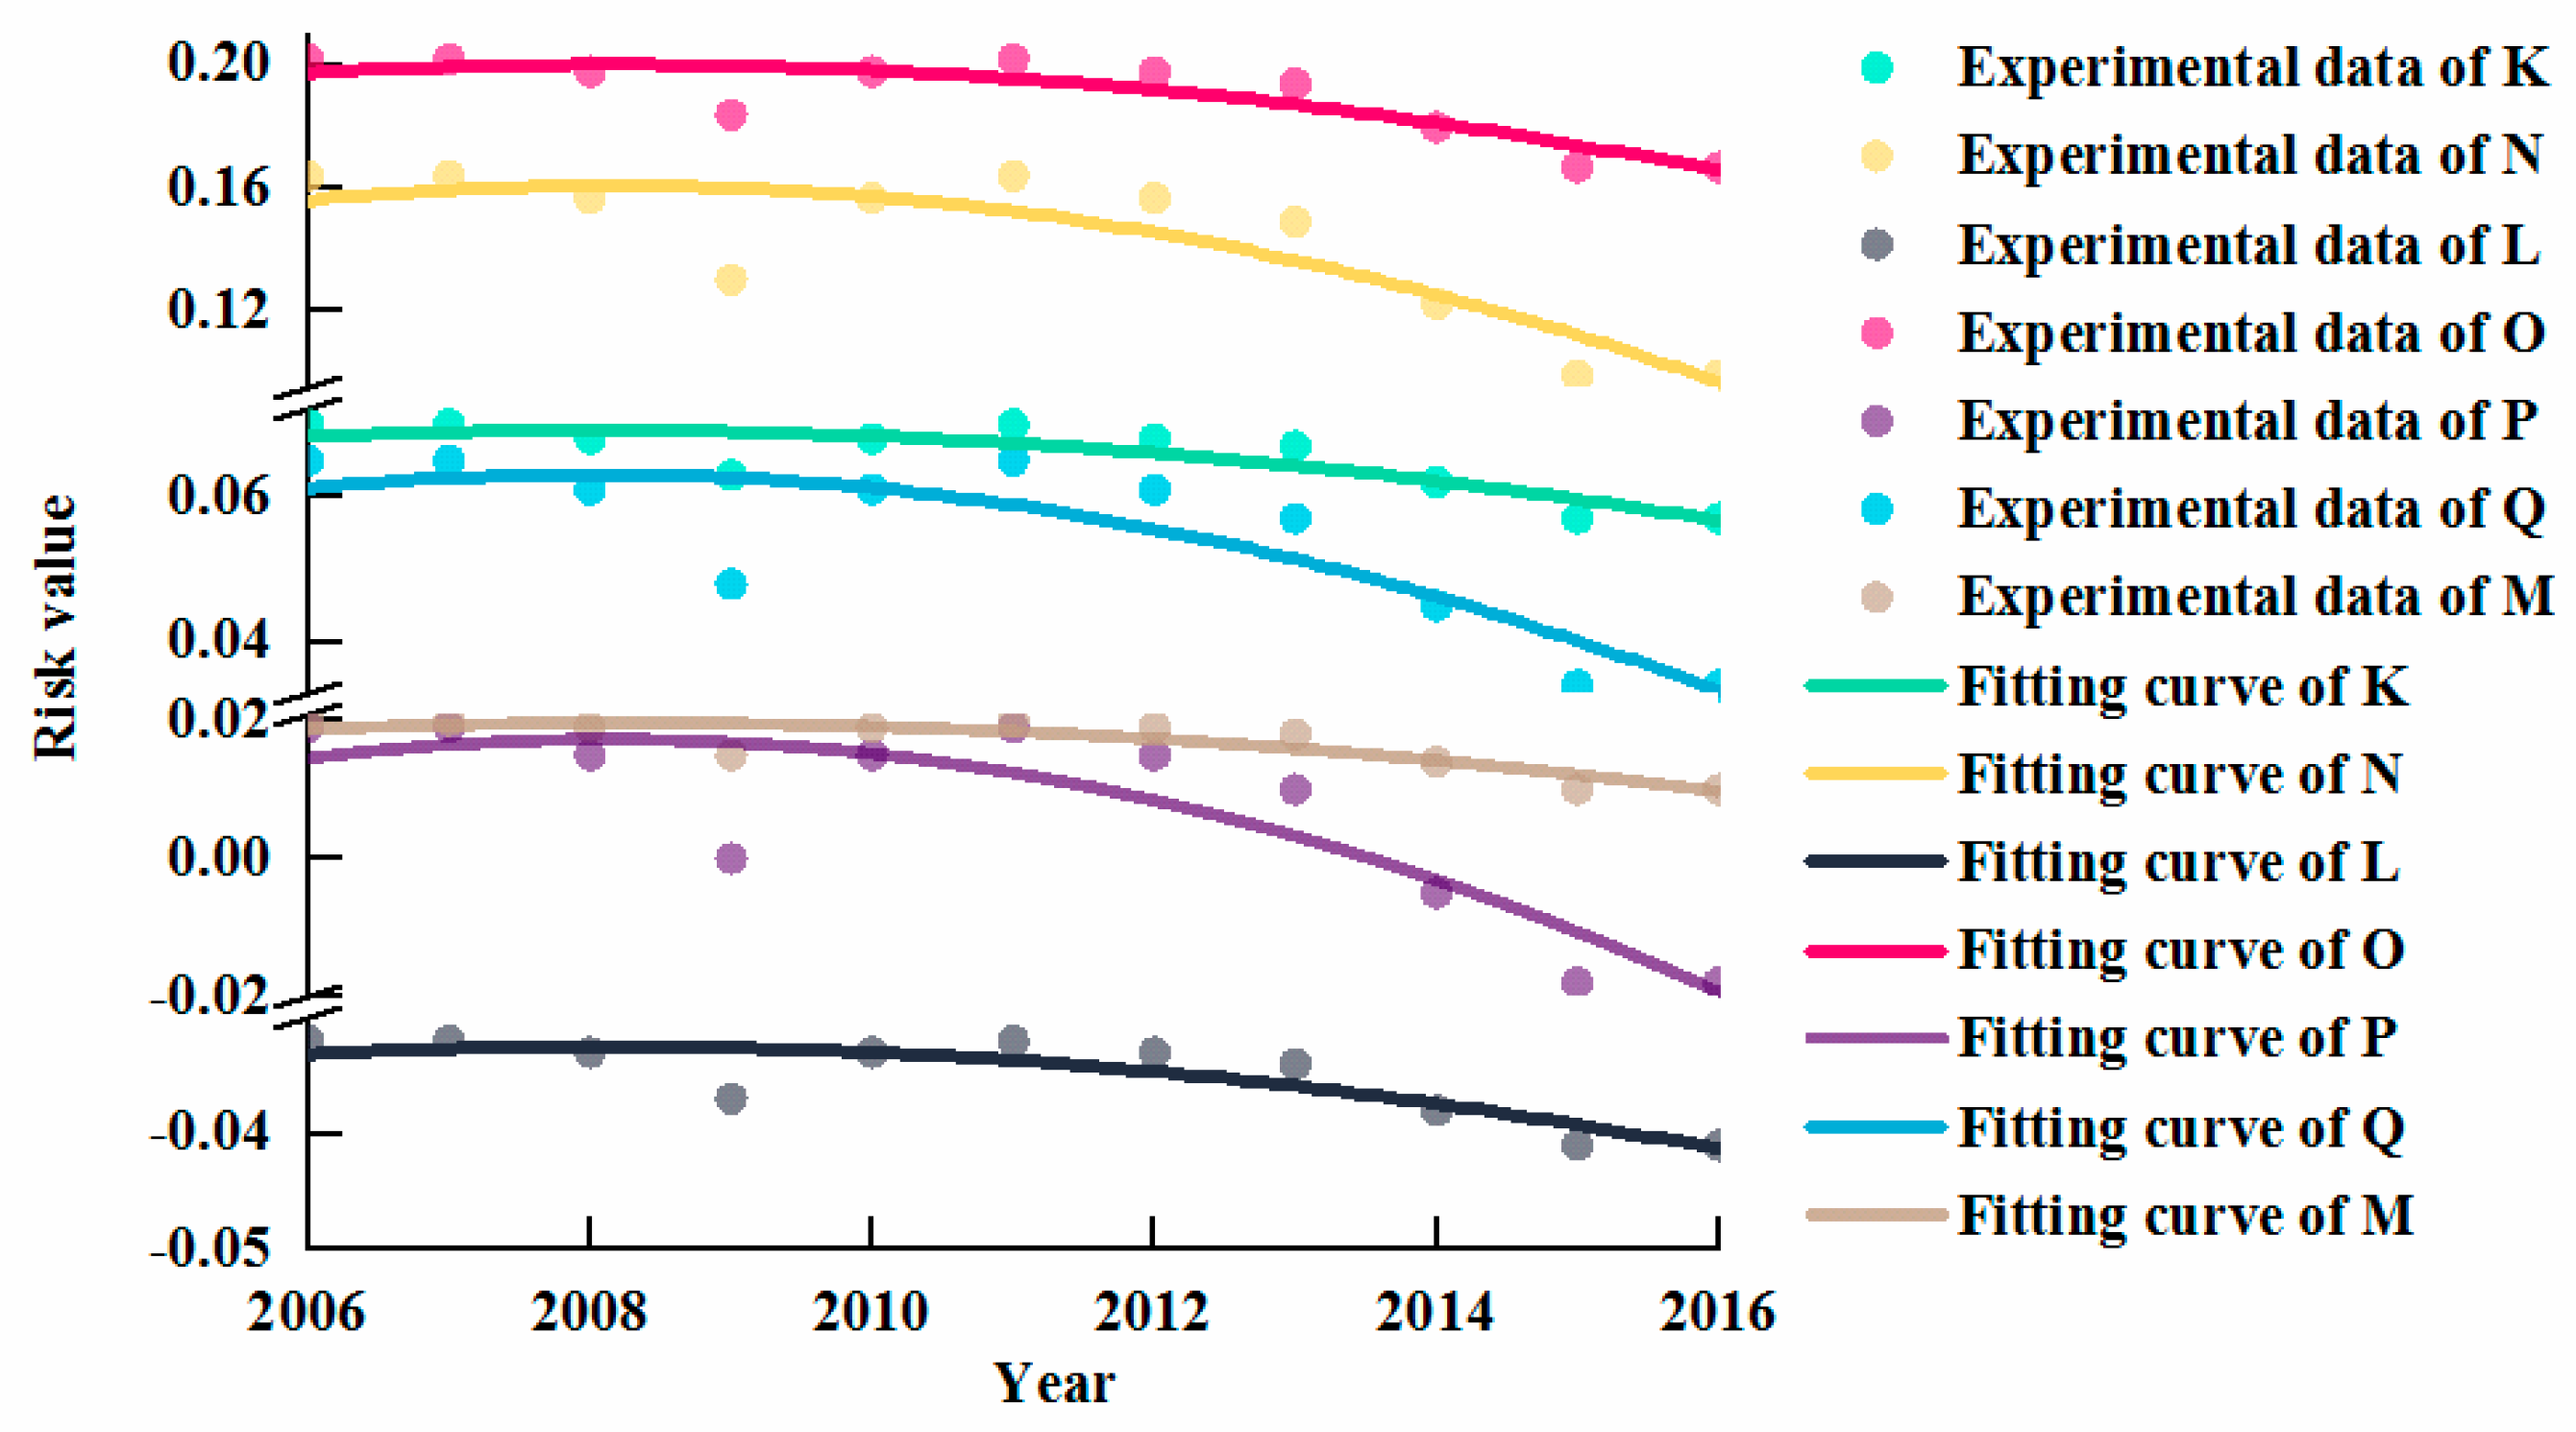
As shown in Figure 5, fitting curves showed that the tendencies of these selected indices were similar to that of nitrogen deposition. The experimental data showed the risk values of various indices in farm ecosystems related to nitrogen deposition were less than 0.2, which indicated a state of low risk. The risk values of nitrogen deposition on indices N (the aboveground biomass of weeds) and O (the fresh weight of weeds) were relatively high (0.1–0.2), whereas the values of the other selected indices were all less than 0.1. Thus, the risk posed by nitrogen deposition to farm ecosystems was low throughout the study period and was mainly due to the influence of nitrogen deposition on weeds. Besides, the impacts of nitrogen deposition on rice and soil animals were also relatively small.
The effects of nitrogen deposition on different indices of aquatic ecosystems are displayed in Figure 6. The risk value of index U (chlorophyll a in freshwater ecosystems) remained greater than 1 and it showed a tendency to increase from 2006 to 2016. Thus, combined with the ecological classification in Table 4, current nitrogen deposition levels pose a high risk to freshwater ecosystems, that is, existing nitrogen deposition has resulted in eutrophication of freshwater ecosystems.
Nitrogen deposition had significantly different effects on the three selected marine ecosystem indices (indices R, S and T), as shown in Figure 6. During the study period, the experimental data showed the risk values corresponding to these indices decreased, increased and decreased again, fitting curves showed an overall tendency to decrease from 2006 to 2016. Specifically, the risk value corresponding to index S (new productivity of marine ecosystems) decreased from greater than 0.2 in 2006–2013 to less than 0.2 in 2014–2016. Therefore, the risk posed by nitrogen deposition to the new productivity of the marine ecosystem gradually dropped from moderate to low. The risk value of index R (primary productivity of marine ecosystems) remained below 0.2 from 2006 to 2016; thus, the corresponding ecological risk was low for these years. The risk value of index T (chlorophyll a in marine ecosystems) ranged from 0.2 to 0.5, which is classified as moderate risk. The highest risk due to nitrogen deposition in the marine ecosystem is the moderate risk of chlorophyll a and this is classified as a moderate risk. Therefore, the main effect of nitrogen deposition on marine ecosystems was exerted upon marine chlorophyll a. The main reason for this risk was an excessive increase in chlorophyll content, which can lead to insufficient levels of oxygen and other substances in the water and cause certain organisms to grow. It may cause a large number of fishes to attempt to escape or die in the water, thus disturbing the original balance of the aquatic ecosystem [82].
Based on the results described above, the risk levels and risk mechanisms associated with atmospheric nitrogen deposition are shown in Table 5. Atmospheric nitrogen deposition currently poses the greatest risks to forest and freshwater ecosystems, whereas the impacts of nitrogen deposition on the farm and marine ecosystems were low and moderate, respectively. In addition, the responses of farm and marine ecosystems to atmospheric nitrogen deposition gradually decreased between 2006 and 2016.
5.2.2. Analysis of the Risk Status of Different Administrative Regions in Xiamen City
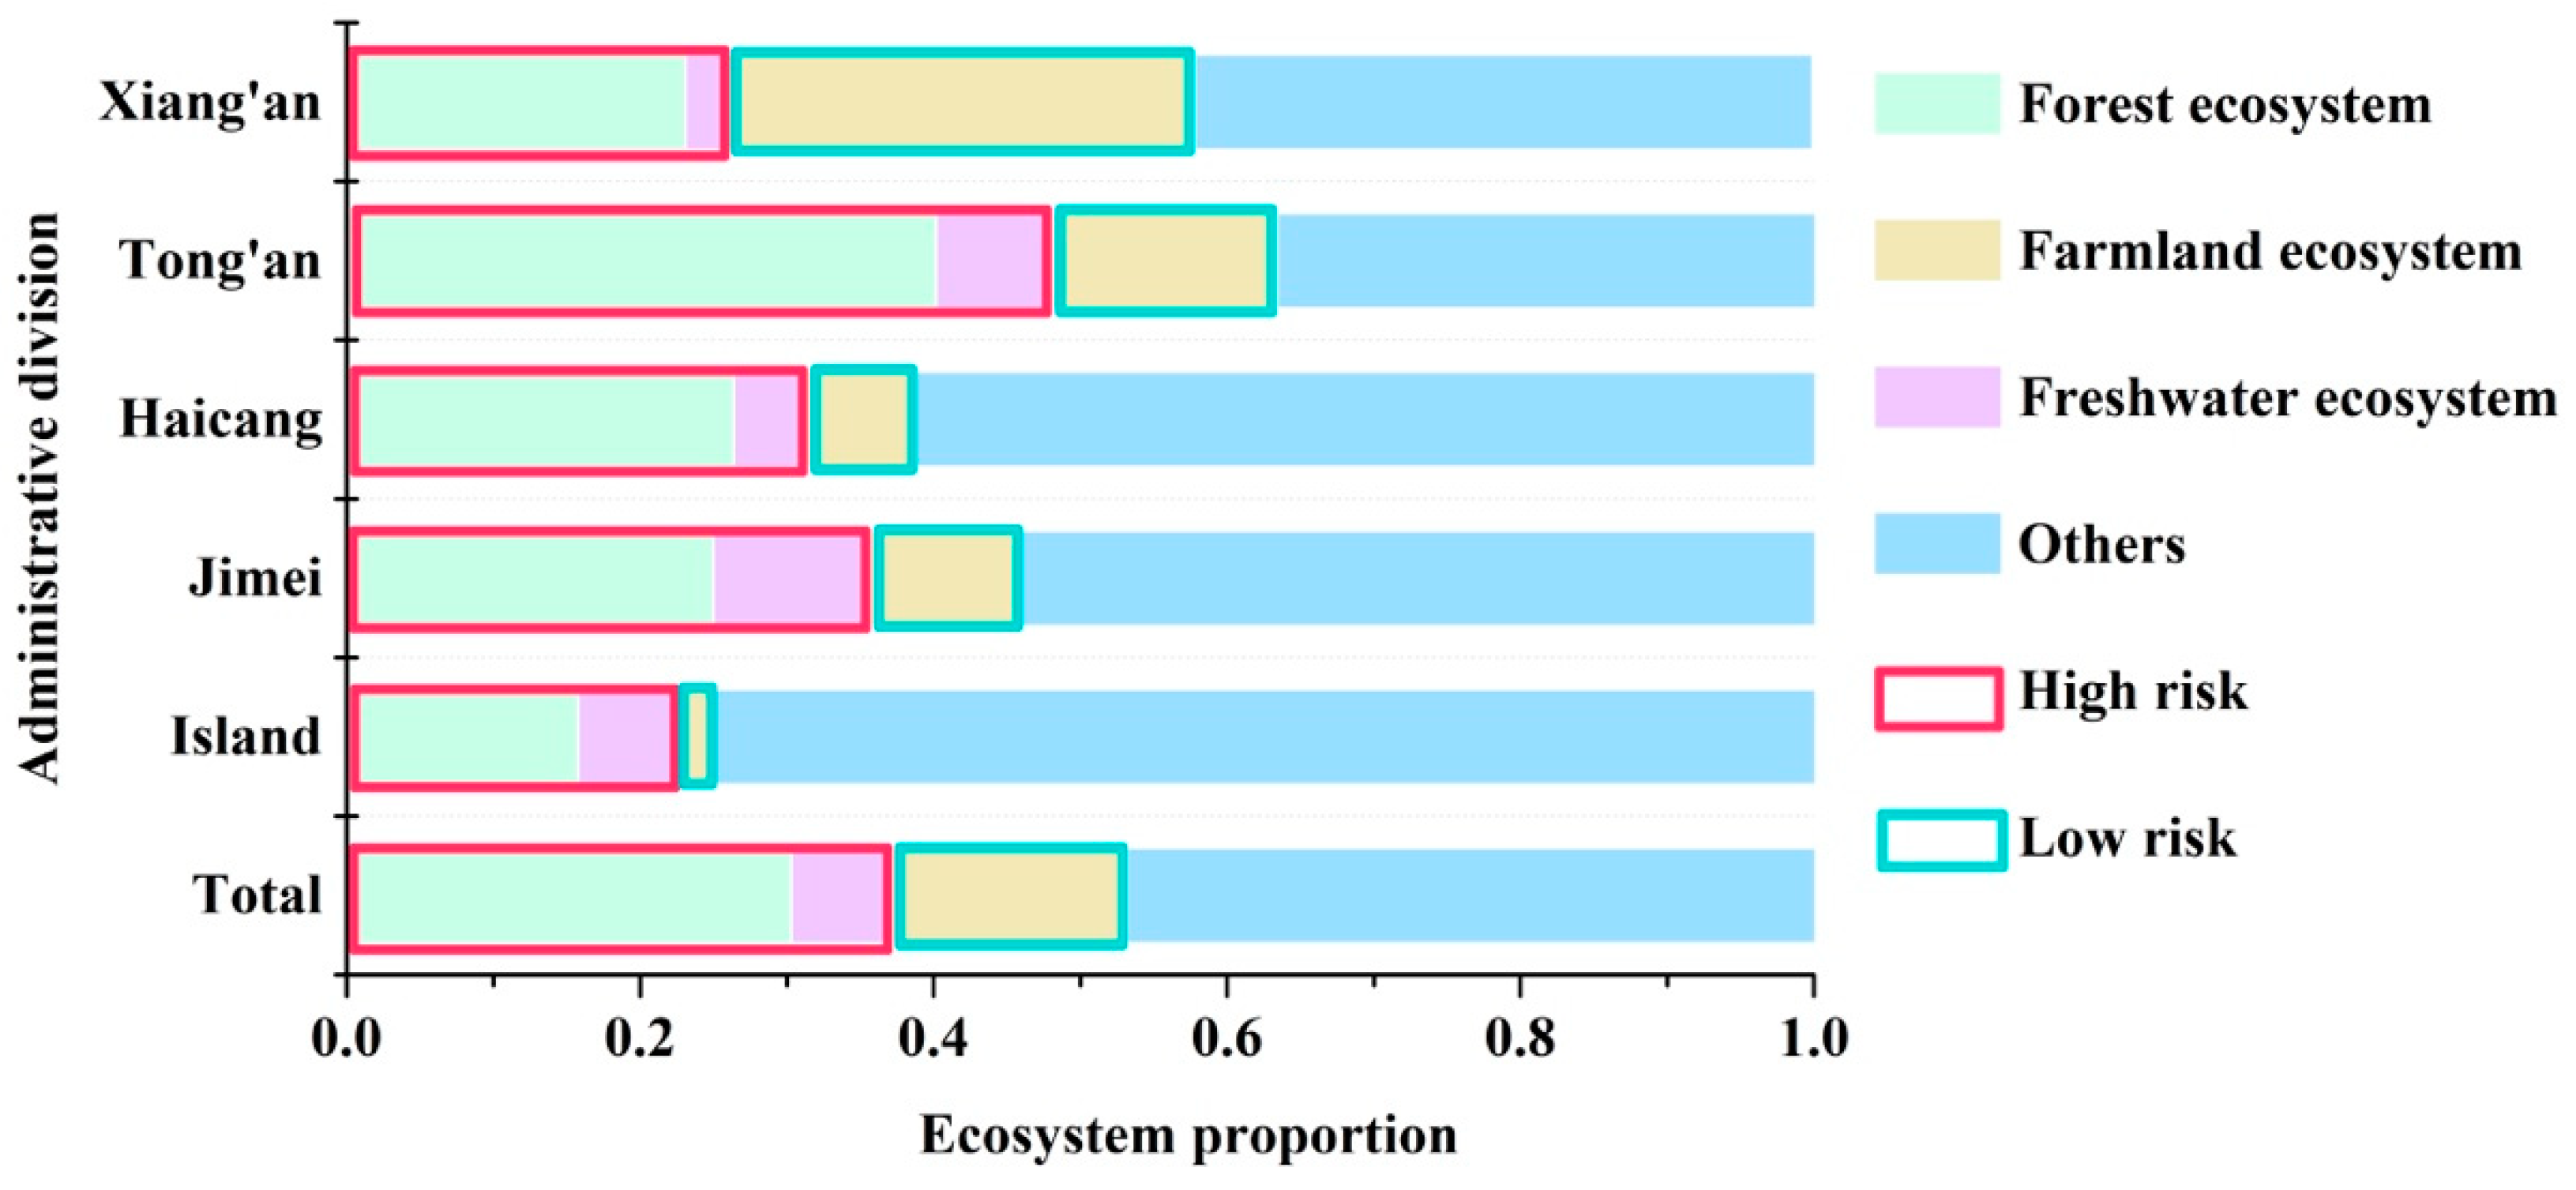
Based on the risk statuses of different types of ecosystems, the ecological risk statuses of different districts in Xiamen City were determined. The data in Table 2 were combined with the risk status results for forest, farm and freshwater ecosystems in Table 5 to quantify the distributions of terrestrial ecological risk statuses within each administrative area in Xiamen City, as shown in Figure 7.
As shown in Figure 7, forest ecosystem and freshwater ecosystems were at a high risk level from atmospheric nitrogen deposition, whereas farmland ecosystems were at a low risk level and the risk levels for other ecosystems were unknown. The analysis indicates that 37.1% of the land in Xiamen City is at a high risk level from atmospheric nitrogen deposition, whereas 16.0% of the land in Xiamen City is at a low risk level and 47.9% of the land in Xiamen City is at an unknown risk level. The district with the highest proportion of high-risk areas was Tong’an, followed by (from high to low) Jimei, Haicang, Xiang’an and Island (a combination of Siming and Huli districts). The proportion of high-risk areas in Tong’an district (48.0%) was far higher than the proportion of high-risk areas in Xiamen City (37.1%). The district with the highest proportion of low-risk areas was Xiang’an, followed by (from high to low) Tong’an, Jimei, Haicang and Island. The proportion of low-risk areas in Xiang’an district (31.8%) was far higher than the proportion of low-risk areas in Xiamen City (16.0%). In addition, marine ecosystems (390 km2) in Xiamen City were classified as at moderate risk from atmospheric nitrogen deposition.
6. Discussion
This research shows that, with changing nitrogen concentrations, the residual rate of litter and the diameter/height of seedlings in forest ecosystems initially changed similarly, that is, with increasing and decreasing nitrogen deposition from 2006 to 2016, these indices also increased and then decreased in a similar manner. The same relationship was true for the selected farm ecosystem indices. These results are similar to those obtained from a previous study by Liu [86], in which the residual rate of litter showed a positive linear correlation with nitrogen deposition. However, the results of studies by Vestgarden [87] and Mo [88] on temperate forests and subtropical plants were different. Comparative analyses showed that, based on the threshold of nitrogen entering ecosystems, nitrogen deposition within certain limits could promote plant growth and litter degradation, thus exerting positive effects on forest ecosystems. On the other hand, when the nitrogen deposition concentration was above a critical threshold value, a further increase in nitrogen deposition decreased the efficiency of the microbial community and delayed litter decomposition. When the nitrogen deposition rate was below this critical value, proper nitrogen deposition increased plant growth and promoted litter degradation, which played a positive role in the ecosystem. Thus, excessive nitrogen deposition can inhibit plant growth and negatively impact forest and farm ecosystems [11]. The high risk posed by nitrogen deposition to forest ecosystems in Xiamen City is mainly due to its effects on litter decomposition and the survival rate of seedlings rather than its effects on the net photosynthetic rate and stomatal conductance of plants [89]. The analysis of impacts on farm ecosystems in Xiamen City indicated low ecological risk, suggesting that the effect of nitrogen deposition on this ecosystem was small.
The results of the freshwater ecosystem analysis showed that nitrogen deposition has caused eutrophication of freshwater in Xiamen City, indicating that freshwater can become eutrophic even if only atmospheric nitrogen deposition is considered [90]. Therefore, controlling atmospheric nitrogen deposition in Xiamen City is important. Nitrogen has an important influence on coastal marine ecosystems and plays major roles in the productivity and stability of such ecosystems. However, only a few studies have been conducted with the goal of understanding the effects of nitrogen deposition on these ecosystems [91]. In this study, the risk posed by nitrogen deposition to marine ecosystems was moderate and was mainly attributable to its impact on chlorophyll a. In contrast, the risk posed by nitrogen deposition to primary and new productivity was low.
Based on the analysis of ecological risk, the proportion of high-risk areas in Tong’an District (48.0%) in Xiamen City is higher than the average risk level of Xiamen City (37.1%). In order to reduce nitrogen deposition and fundamentally improve the risk situation, these results were combined with data from “Overall Planning of Land Use in Xiamen City (2006–2020)” [62] and a report on the present situation in Xiamen City [92] to propose measures for Tong’an District from two aspects. For industry, Tong’an should introduce new and high technology industries vigorously. The traditional industries that support the district’s economy should strictly enforce energy conservation standards, while obsolete technologies and equipment should be eliminated and technology upgrades and energy saving technology should be promoted. Thus, while developing the economy in this district, the proportion of coal consumption and the pollutant emission of industries can be reduced. For traffic, when 324 National Highway and 206 Provincial Highway were diverted from the flooded section of the Lianhua Reservoir, public transport systems, such as bus rapid transit and subway systems, should be constructed to increase the number of bus lines and public transport vehicles. Roads should be managed intelligently to achieve an effective diversion of motor vehicles and ensure smooth traffic. Bicycle lanes should be planned reasonably and the public should be encouraged to use public bicycles for trips over short distances. This district should draw lessons from the Island district, where some road traffic restrictions are implemented based on license number. The government of Tong’an District should cooperate with various departments, such as public security traffic administration departments, environmental protection departments and energy administration departments, to jointly and strictly enforce road traffic control and thus reduce vehicle emissions in the district.
7. Conclusions
In this study, a comprehensive ecological risk assessment model was established. Based on this model, the ecological risk of atmospheric nitrogen deposition in Xiamen City was determined. These results show that atmospheric nitrogen deposition poses a high risk to forest and freshwater ecosystems in Xiamen City, moderate risk to marine ecosystems and a low risk to farmland ecosystems, based on data from 2006 to 2016. The risk to forest ecosystems was the result of the impact of nitrogen deposition on litter decomposition and the seedling survival rate. The risk to aquatic ecosystems was the result of changes in the chlorophyll a level due to eutrophication. The risk to farmland ecosystems was the result of the impact of nitrogen deposition on weeds. Nitrogen deposition produced only small impacts on the other selected indices in these ecosystems, such as the net photosynthetic rate and stomatal conductance in forest ecosystems, rice and soil animals in farmland ecosystems and primary productivity and new productivity in marine ecosystems. In Xiamen City, the proportion of high-risk and low-risk areas were 37.1% and 16.0%, respectively. Among the districts in Xiamen City, the area with the most significant proportion of high-risk was Tong’an (48.0%) and low-risk areas was Xiang’an (31.8%).
The innovation of this study is that a multi-receptor integrated city scale ecological risk assessment model has been established. This model was established based on ecological risk analysis and the DPSR model, the multi-receptor includes forest, farm and aquatic ecosystem and the risk values are represented by the quotients of the response values and thresholds of nitrogen deposition. This framework is universal and simple to use and the requirements for professional and technological proficiency are relatively low. Thus, this research lays a foundation for risk assessment research to be conducted in this field on a small scale. In contrast with traditional qualitative analyses of ecological risk, this study quantitatively analyzed the mechanisms by which nitrogen deposition affects multiple receptors [93]. Exposure-response model for the association between the concentration of nitrogen deposition and indices has been established, which provides a theoretical foundation for subsequent studies and this model can be applied to the southeast coastal area of China, not only just Xiamen City. In the risk assessment, risk values have no unit quantities, which can make the results more intuitive and universal. This study included the ecological risk status of different administrative regions and ecosystems in Xiamen City. Thus, the results can inform the protection of ecosystems and contribute to the construction of an ecologically sensitive manmade environment in Xiamen City.
There are some limitations to this study. Firstly, in the exposure sub-module, the classification of risk into three levels was adopted based on the results of Delphi method analysis, which in turn was based on the professional experience of a panel of experts. The development of technology depends mostly on policy and economic conditions, the experts selected by this method are mostly in a specific technical field and the knowledge of economy and policy may be less [94]. Therefore, the results obtained from Delphi method would be different because of the different degree of understanding of the political and economic situation of the experts [83]. In the future, the exchange and communication between different institutions and experts in different research domain, such as economists, social scientists and even historians to research ecological risk should be strengthened [95]. Secondly, in the pressure module, official atmospheric NO2 concentrations released by the Xiamen municipal people’s government were used to estimate atmospheric nitrogen deposition. In the future, technologies such as a community multiscale air quality (CMAQ) modeling systems, remote sensing (RS) and geographic information systems (GIS) can be used to obtain more accurate and comprehensive nitrogen deposition data for more accurate results. Finally, the number of evaluation factors chosen for this study was limited and additional indices and an urban ecosystem can be included in a more comprehensive and detailed future study.
Author Contributions
L.S., M.Z., T.X. and Y.Z. conceived and designed the methodologies; M.Z., Y.Z. and B.Y. collected and analyzed the data; L.S., M.Z., T.X. and B.Y. wrote the paper; T.X. and H.S. revised the paper.
Funding
This research was supported by the National Natural Science Foundation of China (71874174, 71533003 and 71774071) and the National Key Research and Development Program of China (2018YFC0506901 and 2017YFF0207303).
Conflicts of Interest
The authors declare no conflict of interest.
References
- Galloway, J.N.; Townsend, A.R.; Erisman, J.W.; Bekunda, M.; Cai, Z.; Freney, J.R.; Martinelli, L.A.; Seitzinger, S.P.; Sutton, M.A. Transformation of the nitrogen cycle: Recent trends, questions, and potential solutions. Science 2008, 320, 889–892. [Google Scholar] [CrossRef] [PubMed]
- Vitousek, P.M.; Aber, J.D.; Howarth, R.W.; Likens, G.E.; Matson, P.A.; Schindler, D.W.; Schlesinger, W.H.; Tilman, D.G. Human alteration of the global nitrogen cycle: Sources and consequences. Ecol. Appl. 1997, 7, 737–750. [Google Scholar] [CrossRef]
- Richter, A.; Burrows, J.P.; Nüss, H.; Granier, C.; Niemeier, U. Increase in tropospheric nitrogen dioxide over China observed from space. Natuer 2005, 437, 129–132. [Google Scholar] [CrossRef] [PubMed]
- Yan, G.; Xing, Y.; Wang, J.; Li, Z.; Wang, L.; Wang, Q.; Xu, L.; Zhang, Z.; Zhang, J.; Dong, X.; et al. Sequestration of atmospheric CO2, in boreal forest carbon pools in Northeastern China: Effects of Nitrogen Deposition. Agric. For. Meteorol. 2018, 248, 70–81. [Google Scholar] [CrossRef]
- Liao, Y.C.; Wang, H.M.; Fan, H.B.; Shen, F.F.; Guo, H.B.; Yuan, Y.H.; Liu, W.F.; Yang, F.T. Effects of simulated nitrogen deposition on rice growth, yield and photosynthetic characteristics. J. Jiangxi Agric. Univ. 2012, 34, 10–15. [Google Scholar] [CrossRef]
- Knauer, G.A.; Martin, J.H.; Bruland, K.W. Fluxes of particulate carbon, nitrogen, and phosphorus in the upper water column of the northeast pacific. Deep Sea Res. Part A Oceanogr. Res. Pap. 1979, 26, 97–108. [Google Scholar] [CrossRef]
- Li, Q.Q.; Tang, L. A mini-review on atmospheric nitrogen deposition. J. Yunnan Agric. Univ. 2010, 25, 889–894. [Google Scholar] [CrossRef]
- Agren, G.I.E.; Bosatta, E.; Magill, A.H. Combining theory and experiment to understand effects of inorganic nitrogen on litter decomposition. Oecologia 2001, 128, 94–98. [Google Scholar] [CrossRef] [PubMed]
- Hallbäcken, L.; Zhang, L.H.Q. Effects of experimental acidification, nitrogen addition and liming on ground vegetation in a mature stand of Norway spruce (Picea abies (L.) Karst.) in SE Sweden. For. Ecol. Manag. 1998, 108, 203–215. [Google Scholar] [CrossRef]
- Mo, J.M.; Zhang, W.; Zhu, W.; Gundersen, P.; Fang, Y.; Dejun, L.L.; Wang, H. Nitrogen addition reduces soil respiration in a mature tropical forest in southern China. Glob. Chang. Biol. 2008, 14, 403–412. [Google Scholar] [CrossRef]
- Lu, X.K.; Mo, J.M.; Li, D.J.; Zhang, W.; Fang, Y.T. Effects of simulated N deposition on the photosynthetic and physiologic characteristics of dominant understorey plants in Dinghushan mountain of subtropical China. J. Beijing For. Univ. 2007, 29, 1–9. [Google Scholar] [CrossRef]
- Fangmeier, A.; Hadwigerfangmeier, A.; Van, d.E.L.; Jäger, H.J. Effects of atmospheric ammonia on terrestrial vegetation: A review. Environ. Pollut. 1994, 86, 43–82. [Google Scholar] [CrossRef]
- Huang, J.; Xu, C.C.; Ridoutt, B.G.; Wang, X.C.; Ren, P.A. Nitrogen and phosphorus losses and eutrophication potential associated with fertilizer application to cropland in China. J. Clean. Prod. 2017, 159, 171–179. [Google Scholar] [CrossRef]
- Wang, X.Z.; Zhu, J.G.; Gao, R.; Bao, C. Nitrogen and phosphorus input from web deposition in Taihu Lake region: A case study in Changshu Agro-ecological Experimental Station. Chin. J. Appl. Ecol. 2009, 20, 2487–2492. [Google Scholar] [CrossRef]
- U.S. Department of National Park Service. Assessment of Effects of Acidic Deposition on Forested Ecosystems in Great Smoky Mountains National Park using Critical Loads for Sulfur and Nitrogen; USDA Forest Service: Burlington, NC, USA, 2013; ISBN 9781288667642.
- Zhou, Q.; Yabar, H.; Mizunoya, T.; Higano, Y. Evaluation of integrated air pollution and climate change policies: Case study in the thermal power sector in Chongqing City, China. Sustainability 2017, 9, 1741. [Google Scholar] [CrossRef]
- Li, C.; Li, J.; Rosen, M.A. Assessing Urban Sustainability Using a Multi-Scale, Theme-Based Indicator Framework: A Case Study of the Yangtze River Delta Region, China. Sustainability 2017, 9, 2072. [Google Scholar] [CrossRef]
- Wang, Z.; Deng, X.; Wang, P.; Chen, J. Ecological intercorrelation in urban–rural development: An eco-city of China. J. Clean. Prod. 2017, 163, S28–S41. [Google Scholar] [CrossRef]
- Phillis, Y.A.; Kouikoglou, V.S.; Verdugo, C. Urban sustainability assessment and ranking of cities. Comput. Environ. Urban Syst. 2017, 64, 254–265. [Google Scholar] [CrossRef]
- Yang, D.F.; Yin, C.Z. Defending rapid growing metropolitans from regional ecological hazards: Review of international experiences and reflection on planning regulations. Int. Urban Plan. 2014, 3, 13. [Google Scholar]
- Jiang, Z.P. Recent research on nitrogen cycling in European forest ecosystems. World For. Res. 1997, 55–61. [Google Scholar] [CrossRef]
- Tang, D.; Lydersen, E.; Seip, H.M.; Angell, V.; Eilertsen, O.; Larssen, T.; Liu, X.; Kong, G.; Mulder, J.; Semb, A.; et al. Integrated monitoring program on acidification of Chinese terrestrial systems (IMPACTS)—A Chinese–Norwegian cooperation project. Water Air Soil Pollut. 2001, 130, 1073–1078. [Google Scholar] [CrossRef]
- Zheng, B.H.; Zhi, Y.K.; Zheng, F.D.; Li, Z.C. Study on Ecological Environment Dynamic Change in Dianchi Lake Basin. Res. Environ. Sci. 2002, 15, 16–18. [Google Scholar] [CrossRef]
- Xie, H.L. Spatial characteristic analysis of land use eco-risk based on landscape structure: A case study in the Xingguo County, Jiangxi Province. Chin. Environ. Sci. 2011, 31, 688–695. [Google Scholar]
- Bobbink, R.; Hicks, K.; Galloway, J.; Spranger, T.; Alkemade, R.; Ashmore, M.; Bustamante, M.; Cinderby, S.; Davidson, E.; Dentener, F.; et al. Global assessment of nitrogen deposition effects on terrestrial plant diversity: A synthesis. Ecol. Appl. Publ. Ecol. Soc. Am. 2010, 20, 30–59. [Google Scholar] [CrossRef]
- Ochoa-Hueso, R.; Allen, E.B.; Branquinho, C.; Cruz, C.; Dias, T.; Fenn, M.E.; Manrique, E.; Perez-Corona, M.E.; Sheppard, L.J.; Stock, W.D. Nitrogen deposition effects on Mediterranean-type ecosystems: An ecological assessment. Environ. Pollut. 2011, 159, 2265–2279. [Google Scholar] [CrossRef] [PubMed]
- Xu, W.; Zhao, Y.H.; Liu, X.J.; Dore, A.J.; Zhang, L.; Liu, L.; Cheng, M.M. Atmospheric nitrogen deposition in the Yangtze River basin: Spatial pattern and source attribution. Environ. Pollut. 2017, 232, 546–555. [Google Scholar] [CrossRef] [PubMed]
- Hansen, J. Assessment of atmospheric nitrogen deposition: Possible effects on alpine ecosystems above 9000 feet in grand teton national park. Diss. Theses Gradworks 2012, 13, 13–22. [Google Scholar]
- Erisman, J.W.; Vries, W.D. Nitrogen deposition and effects in European forests. Environ. Rev. 2000, 8, 65–93. [Google Scholar] [CrossRef]
- Wei, X.; Blanco, J.A.; Jiang, H.; Kimmins, J.P.H. Effects of nitrogen deposition on carbon sequestration in Chinese fir forest ecosystems. Sci. Total Environ. 2012, 416, 351–361. [Google Scholar] [CrossRef]
- Hämmerle, I.A. A New Broad-Scale Assessment Method for Combined Effects of Climate Change and Nitrogen Deposition on Habitats. Master’s. Thesis, University of Vienna, Vienna, Austria, 2016; pp. 11–13. [Google Scholar]
- Yao, F.Y.; Wang, G.A.; Liu, X.J.; Song, L. Assessment of effects of the rising atmospheric nitrogen deposition on nitrogen uptake and long-term water-use efficiency of plants using nitrogen and carbon stable isotopes. Rapid Commun. Mass Spectrom. 2011, 25, 1827–1836. [Google Scholar] [CrossRef]
- Naito, W.; Miyamoto, K.; Nakanishi, J.; Masunaga, S.; Bartell, S.M. Evaluation of an ecosystem model in ecological risk assessment of chemicals. Chemosphere 2003, 53, 363–3754. [Google Scholar] [CrossRef]
- Lei, B.L.; Huang, S.B.; Wang, Z.J. Theory and method of ecological risk assessment. Prog. Chem. 2009, 21, 350–358. [Google Scholar]
- Mao, L.G.; Zhou, Y.M.; Zhang, L.; Zhang, Y.N.; Jiang, H.; Yu, H.T.; Jiang, H.Y. Ecological risk of rice field water spill containing 4% oil filming agent of azoxystrobin and thiazolamide on the aquatic ecosystem assessed by a top-rice model. J. Ecotoxicol. 2017, 12, 153–163. [Google Scholar] [CrossRef]
- United States Environmental Protection Agency (USEPA). Office of Pesticide Programs’Label Manual and Code of Federal Regulations 40; Part 1, 56; USEPA: Washington, DC, USA, 2016.
- Young, D. PFAM, a Model for Pesticides, Water and Rice Release Notes for Version 0.65; Office of Pesticide Program, U.S. Environment Protection Agency: Washington, DC, USA, 2011.
- Carsel, R.F.; Mulkey, L.A.; Lorber, M.N.; Baskin, L.B. The Pesticide Root Zone Model (PRZM): A procedure for evaluating pesticide leaching threats to groundwater. Ecol. Modell. 1985, 30, 49–69. [Google Scholar] [CrossRef]
- Sun, H.B.; Yang, G.S.; Su, W.Z.; Wan, R.R. Research progress in ecological risk assessment. J. Ecol. 2009, 28, 335–341. [Google Scholar] [CrossRef]
- Efroymson, R.A.; Murphy, D.L. Ecological risk assessment of multimedia hazardous air pollutants: Estimating exposure and effects. Sci. Total Environ. 2001, 274, 219–230. [Google Scholar] [CrossRef]
- Jago-on, K.A.B.; Kaneko, S.; Fujikura, R.; Fujiwara, A.; Imai, T.; Matsumoto, T.; Zhang, J.; Tanikawa, H.; Tanaka, K.; LeeTaniguchi, B.; et al. Urbanization and subsurface environmental issues: An attempt at DPSIR model application in Asian cities. Sci. Total Environ. 2009, 407, 3089–3104. [Google Scholar] [CrossRef] [PubMed]
- Young, C.D.; Charles, A.; Hjort, A. Human Dimensions of the Ecosystem Approach to Fisheries: An Overview of Context, Concepts, Tools and Methods; FAO, Viale Terme di Caracalla: Rome, Italy, 2008; ISBN 978-92-5-106000-1. [Google Scholar]
- Men, B.H.; Liu, H.Y. Water resource system vulnerability assessment of the Heihe River Basin based on pressure-state-response (PSR) model under the changing environment. Water Sci. Technol. Water Suppl. 2018. [Google Scholar] [CrossRef]
- Gebremedhin, S.; Getahun, A.; Anteneh, W.; Bruneel, S.; Goethals, P.; Rosen, M.A. A Drivers-Pressure-State-Impact-Responses Framework to Support the Sustainability of Fish and Fisheries in Lake Tana, Ethiopia. Sustainability 2018, 10, 2957. [Google Scholar] [CrossRef]
- Lin, Y.C.; Huang, S.L.; Budd, W.W. Assessing the environmental impacts of high-altitude agriculture in Taiwan: A Driver-Pressure-State-Impact-Response (DPSIR) framework and spatial energy synthesis. Ecol. Indic. 2013, 32, 42–50. [Google Scholar] [CrossRef]
- Seydehmet, J.; Lv, G.; Nurmemet, I.; Aishan, T.; Abliz, A.; Sawut, M.; Abliz, A.; Eziz, M. Model Prediction of Secondary Soil Salinization in the Keriya Oasis, Northwest China. Sustainability 2018, 10, 656. [Google Scholar] [CrossRef]
- Sekovski, I. Coastal Megacities: Application of the Driver-Pressure-State-Impact-Response (DPSIR) Framework to Address Environmental, Social and Economic Issues. Master’s Thesis, University of Algarve, Algarve, Portuguesa, 2010. [Google Scholar]
- Ingram, R.J.; Oleson, K.L.L.; Gove, J.M. Revealing complex social-ecological interactions through participatory modeling to support ecosystem-based management in Hawai’i. Mar. Policy 2018, 94, 180–188. [Google Scholar] [CrossRef]
- Wang, S.S. A numerical study of atmospheric nitrogen deposition characteristics in the Pearl River Delta (PRD) region and surrounding cities. Master’s Thesis, South China University of Technology, Guangzhou, China, 2012. [Google Scholar]
- Liang, H.Q. Sustainable Use of Land in Ecological Cities, 2nd ed.; Economic Publishing House: Guangdong, China, 2003; pp. 252–254. ISBN 9787806775639. [Google Scholar]
- Zhang, J.Y. Simulating the Effects of Nitrogen and Sulfur Deposition on Soil Enzyme and Humus Composition of Young Eucalyptus Dunnii Plants. Ph.D. Thesis, University of Agriculture and Forestry in Fujian, Fujian, China, 2011. [Google Scholar]
- Shi, X.; Yang, J. A material flow-based approach for diagnosing urban ecosystem health. J. Clean. Prod. 2014, 64, 437–446. [Google Scholar] [CrossRef] [Green Version]
- Tang, L.N.; Wang, L.; Li, Q.Y.; Zhao, J.Z. A framework designation for the assessment of urban ecological risks. Int. J. Sustain. Dev. World Ecol. 2018, 1–9. [Google Scholar] [CrossRef]
- United States Environmental Protection Agency (USEPA). Guidelines for Ecological Risk Assessment; Federal Register 63(93); Office of Research and Development: Washington, DC, USA, 1998; pp. 26846–26924.
- Betrie, G.D.; Sadiq, R.; Morin, K.A.; Tesfamariam, S. Ecological risk assessment of acid rock drainage under uncertainty: The fugacity approach. Environ. Technol. Innov. 2015, 4, 240–247. [Google Scholar] [CrossRef]
- Lyndall, J.; Barber, T.; Mahaney, W.; Bock, M.; Capdevielle, M. Evaluation of triclosan in Minnesota lakes and rivers: Part i—ecological risk assessment. Ecotoxicol. Environ. Saf. 2017, 142, 578–587. [Google Scholar] [CrossRef] [PubMed]
- Li, H.; Li, J.L.; Yang, Y.; Wang, Z.Q.; Mao, G.; Pu, H.M.; Li, Z.G.; Qin, H.P.; Xu, C. Systematic and quantitative analysis of urban ecological security in Suzhou area in the past 10 years and its control measures. Tianjin Agric. Sci. 2015, 21, 68–75. [Google Scholar] [CrossRef]
- Task Force on the Sustainable Development Index System. Research Manual on the Urban Environmental Sustainable Development Index System of China; China Environmental Science Press: Beijing, China, 1999; ISBN 7-80135-832-5. [Google Scholar]
- Zhao, J.; Dai, D.B.; Lin, T.; Tang, L.N. Rapid urbanisation, ecological effects and sustainable city construction in Xiamen. Int. J. Sustain. Dev. World Ecol. 2010, 17, 271–272. [Google Scholar] [CrossRef]
- Xiamen City Bureau of Environmental Protection. Environmental Bulletin of Xiamen City in 2016. Available online: http://hbj.xm.gov.cn/zwgk/ghcw/hjzlgb/201706/t20170606_1679670.htm (accessed on 24 February 2018).
- Xiamen City Bureau of Environmental Protection. Environmental Bulletin of Xiamen City in 2011. Available online: http://hbj.xm.gov.cn/zwgk/ghcw/hjzlgb/201501/t20150112_1033705.htm (accessed on 24 February 2018).
- Xiamen Municipal People’s Government. Overall Planning of Land Use in Xiamen City (2006–2020); The People’s Government of Xiamen: Xiamen, China, 2010.
- Mo, J.M.; Xue, J.H.; Fang, Y.T. Litter decomposition and its responses to simulated N deposition for the major plants of Dinghushan forests in subtropical China. Acta Ecol. Sin. 2004, 24, 1413–1420. [Google Scholar] [CrossRef]
- Li, D.J.; Mo, J.M.; Fang, Y.T.; Cai, X.A.; Xue, J.H.; Xu, G.L. Effects of simulated nitrogen deposition on growth and photosynthesis of Schima superba, Castanopsis chinensis and Cryptocarya concinna seedlings. Acta Ecol. Sin. 2004, 24, 876–882. [Google Scholar] [CrossRef]
- Fang, Y.T.; Mo, J.M.; Zhou, G.Y.; Xue, J.H. Response of Diameter at Breast Height Increment to N Additions in Forests of Dinghushan Biosphere Reserve. J. Trop. Subtrop. Bot. 2005, 13, 198–204. [Google Scholar] [CrossRef]
- Lu, X.K.; Mo, J.M.; Peng, S.L.; Fang, Y.T.; Li, D.J.; Lin, Q.F. Effects of simulated N deposition on free amino acids and soluble protein of three dominant understory species in a monsoon evergreen broad-leaved forest of subtropical China. Acta Ecol. Sin. 2006, 26, 743–753. [Google Scholar] [CrossRef]
- Yang, X.Y.; Jiang, Q.Q.; Tang, J.J.; Chen, X.; Hu, S.J. Effects of simulated nitrogen deposition on competition of weedy species (Echinochloa crusgalli var. mitis L.) and upland rice (Oryza sativa L.) under different air temperatures. Chin. J. Appl. Ecol. 2007, 18, 848–852. [Google Scholar] [CrossRef]
- Rong, H.; Fan, H.L.; Wu, C.Z. Effects of simulated nitrogen deposition on soil macrofaunal in Agroecosystem. J. Northeast For. Univ. 2011, 39, 85–88. [Google Scholar] [CrossRef]
- Chen, Y.L.L.; Chen, H.Y.; Karl, D.M.; Takahashi, M. Nitrogen modulates phytoplankton growth in spring in the South China Sea. Cont. Shelf Res. 2004, 24, 527–541. [Google Scholar] [CrossRef]
- Chen, Y.C.; Zhang, D.G.; Tang, L. The spatial and temporal dynamics of chlorophyll a concentration and its relationship with phosphorus in lake Dianchi. J. Agro-Environ. Sci. 2010, 26, 1363–1368. [Google Scholar] [CrossRef]
- Landis, W.G.; Wiegers, J.K. Ten years of the relative risk model and regional scale ecological risk assessment. Hum. Ecol. Risk Assess. 2007, 13, 25–38. [Google Scholar] [CrossRef]
- Yao, Y.; Shen, Z.L. Evaluation of seawater eutrophication in Jiaozhou Bay. Mar. Sci. 2004, 28, 14–17. [Google Scholar] [CrossRef]
- Liu, X.J.; Zhang, Y.; Han, W.X.; Tang, A.H.; Shen, J.L.; Cui, Z.L.; Vitousek, P.; Erisman, J.W.; Goulding, K.; Christie, P.; et al. Enhanced nitrogen deposition over China. Nature 2013, 494, 459–462. [Google Scholar] [CrossRef]
- Harmens, H.; Schnyder, E.; Thöni, L.; Cooper, D.M.; Mills, G.; Leblond, S.; Mohr, K.; Poikolainen, J.; Santamaria, J.; Skudnik, M.; et al. Relationship between site-specific nitrogen concentrations in mosses and measured wet atmospheric nitrogen deposition across Europe. Environ. Pollut. 2014, 194, 50–59. [Google Scholar] [CrossRef]
- Cao, H.F.; Shen, Y.G. Summarization of ecological risk assessment research. Environ. Chem. 1991, 10, 26–30. [Google Scholar]
- Zhang, S.F.; Liu, H.M. Review of ecological risk assessment methods. Acta Ecol. Sin. 2010, 30, 2735–2744. [Google Scholar]
- Zhang, Z.M.; Wang, X.Y.; Zhang, Y.; Nan, Z.; Shen, B.G. The over polluted water quality assessment of Weihe river based on kernel density estimation. Procedia Environ. Sci. 2012, 13, 1271–1282. [Google Scholar] [CrossRef]
- Xu, J.B.; Wang, Y. Ecological risk assessment. Songliao J. 1999, 2, 10–13. [Google Scholar] [CrossRef]
- Shi, L.Y.; Zhang, M.; Yang, B.; Gao, L.J. Air pollution-oriented ecological risk assessment in Xiamen city, China. Int. J. Sustain. Dev. World Ecol. 2018, 1–11. [Google Scholar] [CrossRef]
- Shi, Y.F.; Su, Y.; Zhang, X.P. Research Advance in the Functional Role of Soil Fauna in China. J. Nat. Sci. Harbin Norm. Univ. 2011, 27, 84–88. [Google Scholar] [CrossRef]
- Yoshimi, H. Simultaneous construction of single-parameter and multiparameter trophic state indices. Water Res. 1987, 21, 1505–1511. [Google Scholar] [CrossRef]
- Yu, H.X.; Lai, Y.; Zhao, J.J.; Zhou, L.Y.; He, P.; Zhang, L.N. Water Quality Indication of Phytoplankton Community Diversity Index in Urban Rivers. Chem. Boil. Eng. 2016, 33, 32–36. [Google Scholar] [CrossRef]
- Filyushkina, A.; Strange, N.; Löf, M.; Ezebilo, E.E.; Boman, M. Applying the Delphi method to assess impacts of forest management on biodiversity and habitat preservation. For. Ecol. Manag. 2018, 409, 179–189. [Google Scholar] [CrossRef]
- Wang, M.E.; Chen, W.P.; Peng, C. Urban ecological risk assessment: A review. Chin. J. Appl. Ecol. 2014, 25, 911–918. [Google Scholar]
- Environmental Protection Department of Xiamen. Environmental Bulletin of Xiamen in 2009. Available online: http://hbj.xm.gov.cn/zwgk/ghcw/hjzlgb/201501/t20150112_1033698.htm (accessed on 24 February 2018).
- Liu, W.F. Impacts of Nitrogen Deposition on Nutrient Dynamic in the Leaves and Litterfall of Subtropical Plantation Forest. Master’s Thesis, South China Fujian Agriculture and Forestry University, Fuzhou, Fujian, China, 2007. [Google Scholar]
- Vestgarden, L.S. Carbon and nitrogen turnover in the early stage of scots pine needle litter decomposition: Effects of internal and external nitrogen. Soil Biol. Biochem. 2001, 33, 465–474. [Google Scholar] [CrossRef]
- Mo, J.; Brown, S.; Peng, S.; Kong, G. Nitrogen availability in disturbed, rehabilitated and mature forests of tropical China. For. Ecol. Manag. 2003, 175, 573–583. [Google Scholar] [CrossRef]
- Deng, X.W.; Han, S.J. Impact of nitrogen deposition on forest soil carbon pool. Chin. J. Ecol. 2007, 26, 1622–1627. [Google Scholar] [CrossRef]
- Wang, J.F. Atmospheric Deposition of Nitrogen and Its Effect on the Water Environment in the Hangjiahu Area. Master’s Thesis, Zhejiang University of Technology, Hangzhou, Zhejiang, China, 2015. [Google Scholar]
- Luo, X.S.; Tang, A.H.; Shi, K.; Wu, L.H.; Li, W.Q.; Shi, W.Q.; Shi, X.K.; Erisman, J.W.; Zhang, F.S.; Liu, X.J. Chinese coastal seas are facing heavy atmospheric nitrogen deposition. Environ. Res. Lett. 2014, 9, 095007. [Google Scholar] [CrossRef] [Green Version]
- Xiamen Municipal Bureau of statistics; Xiamen Investigation Team of Chinese National Bureau of Statistics. Xiamen Special Economic Zone Yearbook; China Statistics Press: Beijing, China, 2018; ISBN 978-7-5037-8599-3.
- Yi, Y.; Yang, Z.; Zhang, S. Ecological risk assessment of heavy metals in sediment and human health risk assessment of heavy metals in fishes in the middle and lower reaches of the Yangtze river basin. Environ. Pollut. 2011, 159, 2575–2585. [Google Scholar] [CrossRef] [PubMed]
- Kurz-Milcke, E.; Gigerenzer, G. Experts in Science and Society; Kluwer: New York, NY, USA, 2004; pp. 159–177. ISBN 0-306-47903-6. [Google Scholar]
- Miller, C.A. Changing the atmosphere: Expert knowledge and environmental governance. J. Environ. Policy Plan. 2002, 4, 323–325. [Google Scholar] [CrossRef]
Figure 1.
Framework for a nitrogen deposition risk assessment.

Figure 2.
Map showing the location of Xiamen City within China and the divisions within Xiamen City.
Figure 2.
Map showing the location of Xiamen City within China and the divisions within Xiamen City.

Figure 3.
Annual accumulation concentration of nitrogen deposition from 2006 to 2016. Note: Fitting curve: (R2 = 0.719).
Figure 3.
Annual accumulation concentration of nitrogen deposition from 2006 to 2016. Note: Fitting curve: (R2 = 0.719).

Figure 4.
Risk values in forest ecosystems for indices (a) D, E, G and H; (b) F and J; and (c) A, B, C and I. Note: the meanings of A, B, C, D, E, F, G, H, I and J are listed in Table 3. Fitting curves: (R2 = 0.731); (R2 = 0.731); (R2 = 0.731); (R2 = 0.728); (R2 = 0.753); (R2 = 0.751); (R2 = 0.736); (R2 = 0.507); (R2 = 0.543).


Figure 5.
Risk values of indices in farm ecosystems. Note: the meanings of K, L, M, N, O, P and Q are listed in Table 3. Fitting curves: (R2 = 0.732); (R2 = 0.749); (R2 = 0.728); (R2 = 0.751); (R2 = 0.756); (R2 = 0.738); (R2 = 0.752).
Figure 5.
Risk values of indices in farm ecosystems. Note: the meanings of K, L, M, N, O, P and Q are listed in Table 3. Fitting curves: (R2 = 0.732); (R2 = 0.749); (R2 = 0.728); (R2 = 0.751); (R2 = 0.756); (R2 = 0.738); (R2 = 0.752).

Figure 6.
Risk values of indices in aquatic ecosystems. Note: the meanings of R, S, T and U are listed in Table 3. Fitting curves: (R2 = 0.746); (R2 = 0.731); (R2 = 0.740); (R2 = 0.447).
Figure 6.
Risk values of indices in aquatic ecosystems. Note: the meanings of R, S, T and U are listed in Table 3. Fitting curves: (R2 = 0.746); (R2 = 0.731); (R2 = 0.740); (R2 = 0.447).

Figure 7.
Terrestrial ecological risk status distributions in different districts of Xiamen City.


Table 1.
Nitrogen deposition (NO2) in Xiamen City from 2006 to 2016 (mg/m3·d).
| Year | 2006 | 2007 | 2008 | 2009 | 2010 | 2011 | 2012 | 2013 | 2014 | 2015 | 2016 |
|---|---|---|---|---|---|---|---|---|---|---|---|
| Concentration | 0.048 | 0.048 | 0.046 | 0.039 | 0.046 | 0.048 | 0.046 | 0.044 | 0.037 | 0.031 | 0.031 |
Table 2.
Percentages of ecosystem occupation in Xiamen City (%).
| Administrative Division | Farm | Forest | Freshwater | Others |
|---|---|---|---|---|
| Total | 16.0 | 30.3 | 6.9 | 46.9 |
| Island | 2.1 | 15.8 | 6.9 | 75.2 |
| Jimei | 10.3 | 25.0 | 10.7 | 54.1 |
| Haicang | 7.4 | 26.4 | 5.0 | 61.2 |
| Tong’an | 15.3 | 40.2 | 7.9 | 36.7 |
| Xiang’an | 31.8 | 23.1 | 2.9 | 42.1 |
Note: the area of the marine ecosystem is 390 km2.
Table 3.
Empirical models and risk thresholds for the relationship between nitrogen deposition and stress responses for the forest, farm and aquatic ecosystems.
Table 3.
Empirical models and risk thresholds for the relationship between nitrogen deposition and stress responses for the forest, farm and aquatic ecosystems.
| Ecosystem | Index (i) | Index Attribute | Quantitative Relationship (x = the Annual Accumulation of Nitrogen Deposition (g/m2); y = the Response of Nitrogen Deposition) | Response Threshold (RT) | Species in the Study | Data Sources | |
|---|---|---|---|---|---|---|---|
| Forest | A | − | y = −0.001x2 + 0.006x + 0.73 (R² = 0.996) | 0.736 | Mixed forest containing Masson pine | Mo et al. [63] | |
| B or C | − | y = −0.001x2 + 0.007x + 0.73 (R² = 0.994) | 0.741 | ||||
| D | + | y= −7.36 × 10⁻⁴ × x2 + 0.02x + 0.412 (R2 = 0.517) | 0.595 | Cryptocarya concinna | Li et al. [64] Fang et al. [65] | ||
| E | + | y = −0.0017x2 + 0.043x + 0.316 (R2 = 0.992) | 0.595 | ||||
| F | + | y = −0.0029x2 + 0.0043x −0.003 (R2 = 0.968) | 0.154 | ||||
| G | + | y = −0.0022x2 + 0.061x + 0.786 (R2 = 0.786) | 1.215 | Cryptocarya chinensis | |||
| H | + | y = −0.00217x2 + 0.057x + 0.634 (R2 = 0.625) | 1.014 | ||||
| I | + | y = −9.102 × 10−4x2 + 0.0039x − 0.0316 (R2 = 0.895) | −0.027 | ||||
| J | + | y = −0.016x2 + 0.234x − 0.052 (R2 = 0.770) | 0.797 | ||||
| Farm | K | + | y = −0.0002x2 + 0.0075x + 0.0025 (R² = 0.994) | 0.073 | Rice | Liao et al. [5] | |
| L | + | y = −0.0002x2 + 0.0106x − 0.0079 (R² = 0.921) | 0.133 | ||||
| M | + | y = −0.0023x2 + 0.1171x − 0.011 (R² = 0.992) | 1.480 | Lu et al. [66] | |||
| N | - | y = −0.053x2 + 0.387x − 0.017 (R2 = 0.934) | 0.682 | Weeds | Yang et al. [67] | ||
| O | − | y = −0.014x2 + 0.17x + 0.06 (R2 = 0.696) | 0.584 | Rong et al. [68] | |||
| P | + | y = −0.004x2 + 0.057x − 0.016 (R2 = 0.670) | 0.184 | Soil animal | |||
| Q | − | y = −0.005x2 + 0.076x − 0.007 (R2 = 0.956) | 0.294 | ||||
| Aquatic | Marine | R | ● | y = −1.31 + 102.78x (R2 = 0.812) | 39.800 ** | Phytoplankton | Chen et al. [69] |
| S | ● | y = 6.67 + 138.64x (R2 = 0.540) | 62.100 ** | ||||
| T | ● | y = 0.12 + 0.41x (R2 = 0.640) | 0.300 ** | ||||
| Fresh-water | U | ● | y = −1.6886x + 22.367 (r = 0.025, sig = 0.738) | 22.000 * | Algae | Chen et al. [70] | |
Note: the unit of x for farm and forest ecosystems is g/m2; the unit of x for aquatic ecosystems is mg/m3. A: The residual rate of litter in the Masson pine forest. B: The residual rate of litter in coniferous forests. C: The residual rate of litter in mixed forests. D: The stem base diameter of Cryptocarya concinna seedlings. E: The height of Cryptocarya concinna seedlings. F: The net photosynthetic rate of Cryptocarya concinna seedlings. G: The stem base diameter of Castanopsis chinensis seedlings. H: The height of Castanopsis chinensis seedlings. I: The survival rate of Castanopsis chinensis seedlings. J: The net photosynthetic rate of Castanopsis chinensis seedlings. K: Changes in rice height in paddy fields during seedling establishment. L: Changes in rice height in paddy fields during the tillering stage. M: Changes in rice chlorophyll content in a paddy field. N: The aboveground biomass of weeds. O: The fresh weight of weeds. P: The diversity index of large soil animals. Q: The dominance index of large soil animals. R: Primary productivity of marine ecosystems. S: New productivity of marine ecosystems. T: Chlorophyll a in marine ecosystems. U: Chlorophyll a in freshwater ecosystems. * According to China’s standard definition of eutrophication in freshwater ecosystems, eutrophication is confirmed if the total nitrogen content in freshwater is greater than 0.2 mg/L [71]; hence, this value was used as the risk threshold. ** According to the standard definition of eutrophication in marine ecosystems, eutrophication is confirmed if the total nitrogen content in a marine ecosystem is greater than 0.4 mg/L [72]; hence, this value was used as the risk threshold. +: the effect of the index is good; −: the effect of the index is bad; ●: the effect of the index is good at a nitrogen concentration less than 0.2 mg/L for freshwater (0.4 mg/L for marine ecosystems) and the effect of the index is bad at a nitrogen concentration greater than 0.2 mg/L for freshwater (0.4 mg/L for marine ecosystems).
Table 4.
Classification of ecological risks regarding nitrogen deposition in Xiamen City.
| Risk Value (RV) | Risk Level |
|---|---|
| ≤0.2 | Low risk |
| 0.2–0.5 | Moderate risk |
| ≥0.5 | High risk |
Table 5.
Risk levels and risk mechanisms.
| Ecosystem | Risk Level | Mechanism of Ecological Risk | |
|---|---|---|---|
| Forest | High risk | Impact of nitrogen deposition on litter decomposition and seedling survival rate | |
| Farmland | Low risk | Impact of nitrogen deposition on weeds | |
| Water body | Freshwater | High risk | Impact of nitrogen deposition on the chlorophyll a level due to eutrophication |
| Seawater | Moderate risk | ||
© 2018 by the authors. Licensee MDPI, Basel, Switzerland. This article is an open access article distributed under the terms and conditions of the Creative Commons Attribution (CC BY) license (http://creativecommons.org/licenses/by/4.0/).
Share and Cite
MDPI and ACS Style
Shi, L.; Zhang, M.; Zhang, Y.; Yang, B.; Sun, H.; Xu, T. Comprehensive Analysis of Nitrogen Deposition in Urban Ecosystem: A Case Study of Xiamen City, China. Sustainability 2018, 10, 4673. https://doi.org/10.3390/su10124673
AMA Style
Shi L, Zhang M, Zhang Y, Yang B, Sun H, Xu T. Comprehensive Analysis of Nitrogen Deposition in Urban Ecosystem: A Case Study of Xiamen City, China. Sustainability. 2018; 10(12):4673. https://doi.org/10.3390/su10124673
Chicago/Turabian StyleShi, Longyu, Miao Zhang, Yajing Zhang, Bin Yang, Huaping Sun, and Tong Xu. 2018. "Comprehensive Analysis of Nitrogen Deposition in Urban Ecosystem: A Case Study of Xiamen City, China" Sustainability 10, no. 12: 4673. https://doi.org/10.3390/su10124673
Note that from the first issue of 2016, this journal uses article numbers instead of page numbers. See further details here.