Population Matters: Identifying Metropolitan Sub-Centers from Diachronic Density-Distance Curves, 1960–2010


1
Università Politecnica delle Marche, Department of Social and Economic Sciences, Piazzale Martelli 8, I-60121 Ancona, Italy
2
Department of Agricultural and Forestry Sciences (DAFNE), Tuscia University, Via San Camillo de Lellis, I-01100 Viterbo, Italy
3
Council for Agricultural Research and Economics (CREA), Viale S. Margherita 80, I-52100 Arezzo, Italy
4
Global Change Research Institute of the Czech Academy of Sciences, Lipová 9, CZ-37005 České Budějovice, Czech Republic
*
Author to whom correspondence should be addressed.
Sustainability 2018, 10(12), 4653; https://doi.org/10.3390/su10124653
Submission received: 26 November 2018
/
Revised: 5 December 2018
/
Accepted: 5 December 2018
/
Published: 6 December 2018
(This article belongs to the Special Issue Urbanization and Demographic Change: A New Step Ahead in Understanding of World Regional Complexity)
Abstract
:The present study illustrates a simplified procedure identifying population sub-centers over 50 years in three Southern European cities (Barcelona, Rome, Athens) with the aim to define and characterize progressive shifts from mono-centric structures towards a polycentric spatial configuration of (growing) metropolitan regions. This procedure is based on a spatially-explicit, local-scale analysis of the standardized residuals from a log-linear model assessing the relationship between population concentration and the distance from a central place in each metropolitan region, under the hypotheses that (i) a mono-centric spatial structure is characterized by a linear relationship between the two variables and that (ii) population sub-centers—considered early signals of a more polycentric regional structure—are characterized by high and positive regression residuals. Results of this study indicate that the three cities have experienced distinctive urbanization waves influencing the overall metropolitan configuration, with variable impact on the original mono-centric structure. Population sub-centers include (i) peri-urban municipalities around the central city and more remote towns situated in rural districts (Barcelona); (ii) scattered towns at variable distances (20–30 km) from the central city (Rome); (iii) fringe municipalities and peri-urban locations in flat districts, 10–20 km away from the central city (Athens). These results may indicate a distinctive evolution path toward polycentric development in the three cities, more evident in Barcelona and Rome and less evident in Athens. The proposed methodology can be generalized and adapted to discriminate population from employment sub-centers in metropolitan regions all over Europe.
1. Introduction
Polycentrism is a spatial structure characterizing several regional systems worldwide [1,2,3]. Polycentric regions are based on a dense infrastructural network of urban centers having a similar or different demographic size, a more balanced economic power, and concentration of key socioeconomic functions [4,5,6,7,8]. Population and employment sub-centers have emerged in locations more or less close to central cities during the long-lasting transformation from mono-centric to polycentric structures [1,3,8,9,10,11,12,13,14,15,16,17,18]. Regional and place-specific factors shaping distinctive patterns of urban growth made identification and characterization of mono-centric and polycentric structures sometimes difficult and vague [19]. Defining impacts and consequences of polycentric development on socioeconomic dynamics are even more problematic, since urban cycles diverge largely across regions, in both advanced economies and emerging countries [20,21,22].
While population density, urban form, and socioeconomic functions are demonstrated to be important variables influencing metropolitan expansion, analysis of polycentric development appears increasingly complex due to multiple interacting factors [1]. Approaches that integrate morphological and functional issues [8,23,24] were proposed with the aim to identify polycentric patterns of urban growth. However, complete lack (or partial availability) of comparable, high-resolution geo-spatial information at different spatial scales—from local to regional—prevent methodological generalization and limit regional comparisons [25,26,27]. Urban expansion has been routinely assessed through a linear model simulating a negative relationship between population density and the distance from a central place [28,29,30]. This relationship identifies a classical mono-centric model, with density of population, workers, or activities decreasing linearly with the distance from a central location due to agglomeration and scale factors, accessibility and land prices declining along urban gradients [31,32]. In this context, metropolitan sub-centers have been frequently considered an early sign of a truly polycentric and more spatially-balanced urban development, and were identified considering separately population, employment, activities, or other functions [4,26,27,28]. Deviations from such linear models may indicate a progressive shift toward more scattered (and less centralized) spatial patterns, and are usually associated with consolidation of sub-centers attracting population and economic activities [33,34,35]. In this regard, spatially-persistent, positive deviations from a density-distance linear trend are considered an honest signal of formation (and/or consolidation) of sub-centers across metropolitan regions [13].
Being shaped by increasingly complex and locally-based socioeconomic processes, metropolitan expansion in Europe has resulted in a drastic transformation of spatial structures and land use. Polycentric development in this region was mainly based on processes of residential and industrial decentralization characterizing the most recent evolution of metropolitan systems [36,37]. With impacts of polycentric development shaping regional systems’ resilience to external shocks, a multi-level and multi-scale policy strategy is required to promote environmental sustainability, local competitiveness, and social cohesion in polycentric regions [18,38]. However, while the concept of polycentric development is recognized as a key policy goal in the European Spatial Development Perspective (ESDP) [39,40,41,42], applicability and effectiveness of measures promoting a truly polycentric and spatially-balanced development are possibly limited by settlement structures with a marked gap between urban and rural areas and a centralized spatial organization of socioeconomic functions, deriving from a mostly compact and dense long-term development [6,30,43]. These conditions are particularly important in a policy-oriented analysis of polycentric development for metropolitan regions in southern Europe, displaying a relatively slow shift from strictly mono-centric structures to more polycentric spatial assets [37].
To investigate shifts from mono-centric structures towards polycentric spatial configurations in originally compact and dense metropolitan regions, the present study introduces a simplified procedure that identifies population sub-centers and evaluates spatial patterns of population growth—as a proxy of urban growth—over a relatively long time period. This procedure is based on a spatially-explicit analysis of the standardized residuals from a linear (ordinary least square) model that assesses the relationship between population density and the distance from a central location for each investigated region, under the hypotheses that (i) a mono-centric spatial structure is characterized by a perfectly linear relationship between the two variables and that (ii) population sub-centers—considered early signals of polycentric structures—are characterized by high and positive regression residuals. The proposed approach fixes a dynamic threshold for standardized residuals with the aim to identify and profile candidate sub-central locations.
With this approach, population sub-centers were identified over a relatively long time period (1960–2010) in three large metropolitan regions of Mediterranean Europe (Barcelona, Rome, Athens) using easily accessible data on total resident population derived from official censuses held every ten years at the desired spatial scale (municipalities in this case). On average, southern European urban agglomerations are considered more compact and denser than Western and Northern European counterparts, with a central city dominating the regional hierarchy of towns and minor settlements [15]. Although cities in southern Europe have traditionally displayed similar (compact) morphologies and (diversified) socioeconomic structures [44,45], the most recent expansion of such cities was characterized by ‘individual’ growth paths determining uniquely dispersed and highly fragmented spatial structures [2,10,23,46,47]. Nowadays, several cities in southern Europe may represent emblematic cases of urban growth based on ‘individualized’ transitions toward a polycentric regional structure [1,8]. In this regard, a comprehensive investigation of population sub-center dynamics over time may benefit from a comparative analysis of socioeconomic transitions distinguishing compact mono-centric models (Athens) from semi-dense and spatially-discontinuous configurations (Rome) and moderately polycentric (dense) urban structures (Barcelona) [48,49].
This paper is organized as follows: Section 2 illustrates the methodology adopted in this study, focusing on a brief description of case studies (Section 2.1), statistical data sources (Section 2.2), analysis’ spatial units (Section 2.3), indicators (Section 2.4), and statistical procedures (Section 2.5). Section 3 outlines the most relevant results of this study comparatively for each case study. Section 4 presents a broad discussion of the empirical results and, finally, Section 5 provides some concluding remarks to our study.
2. Methodology
The methodology was composed of several phases. After defining the three metropolitan regions in the analysis (Barcelona in Spain, Rome in Italy, and Athens in Greece), the description of statistical data and the spatial unit of analysis identified indicators and variables useful for comparing the study contexts. Then, a statistical analysis focused on a multi-step analytical outline, with the aim of (i) evaluating long-term, individual paths of urban expansion in the three cities and (ii) recognizing population sub-centers. Correspondingly, regression models were used as simplified tools, examining the relationship amongst a dependent variable and one (or more) predictor(s).
2.1. Case Studies
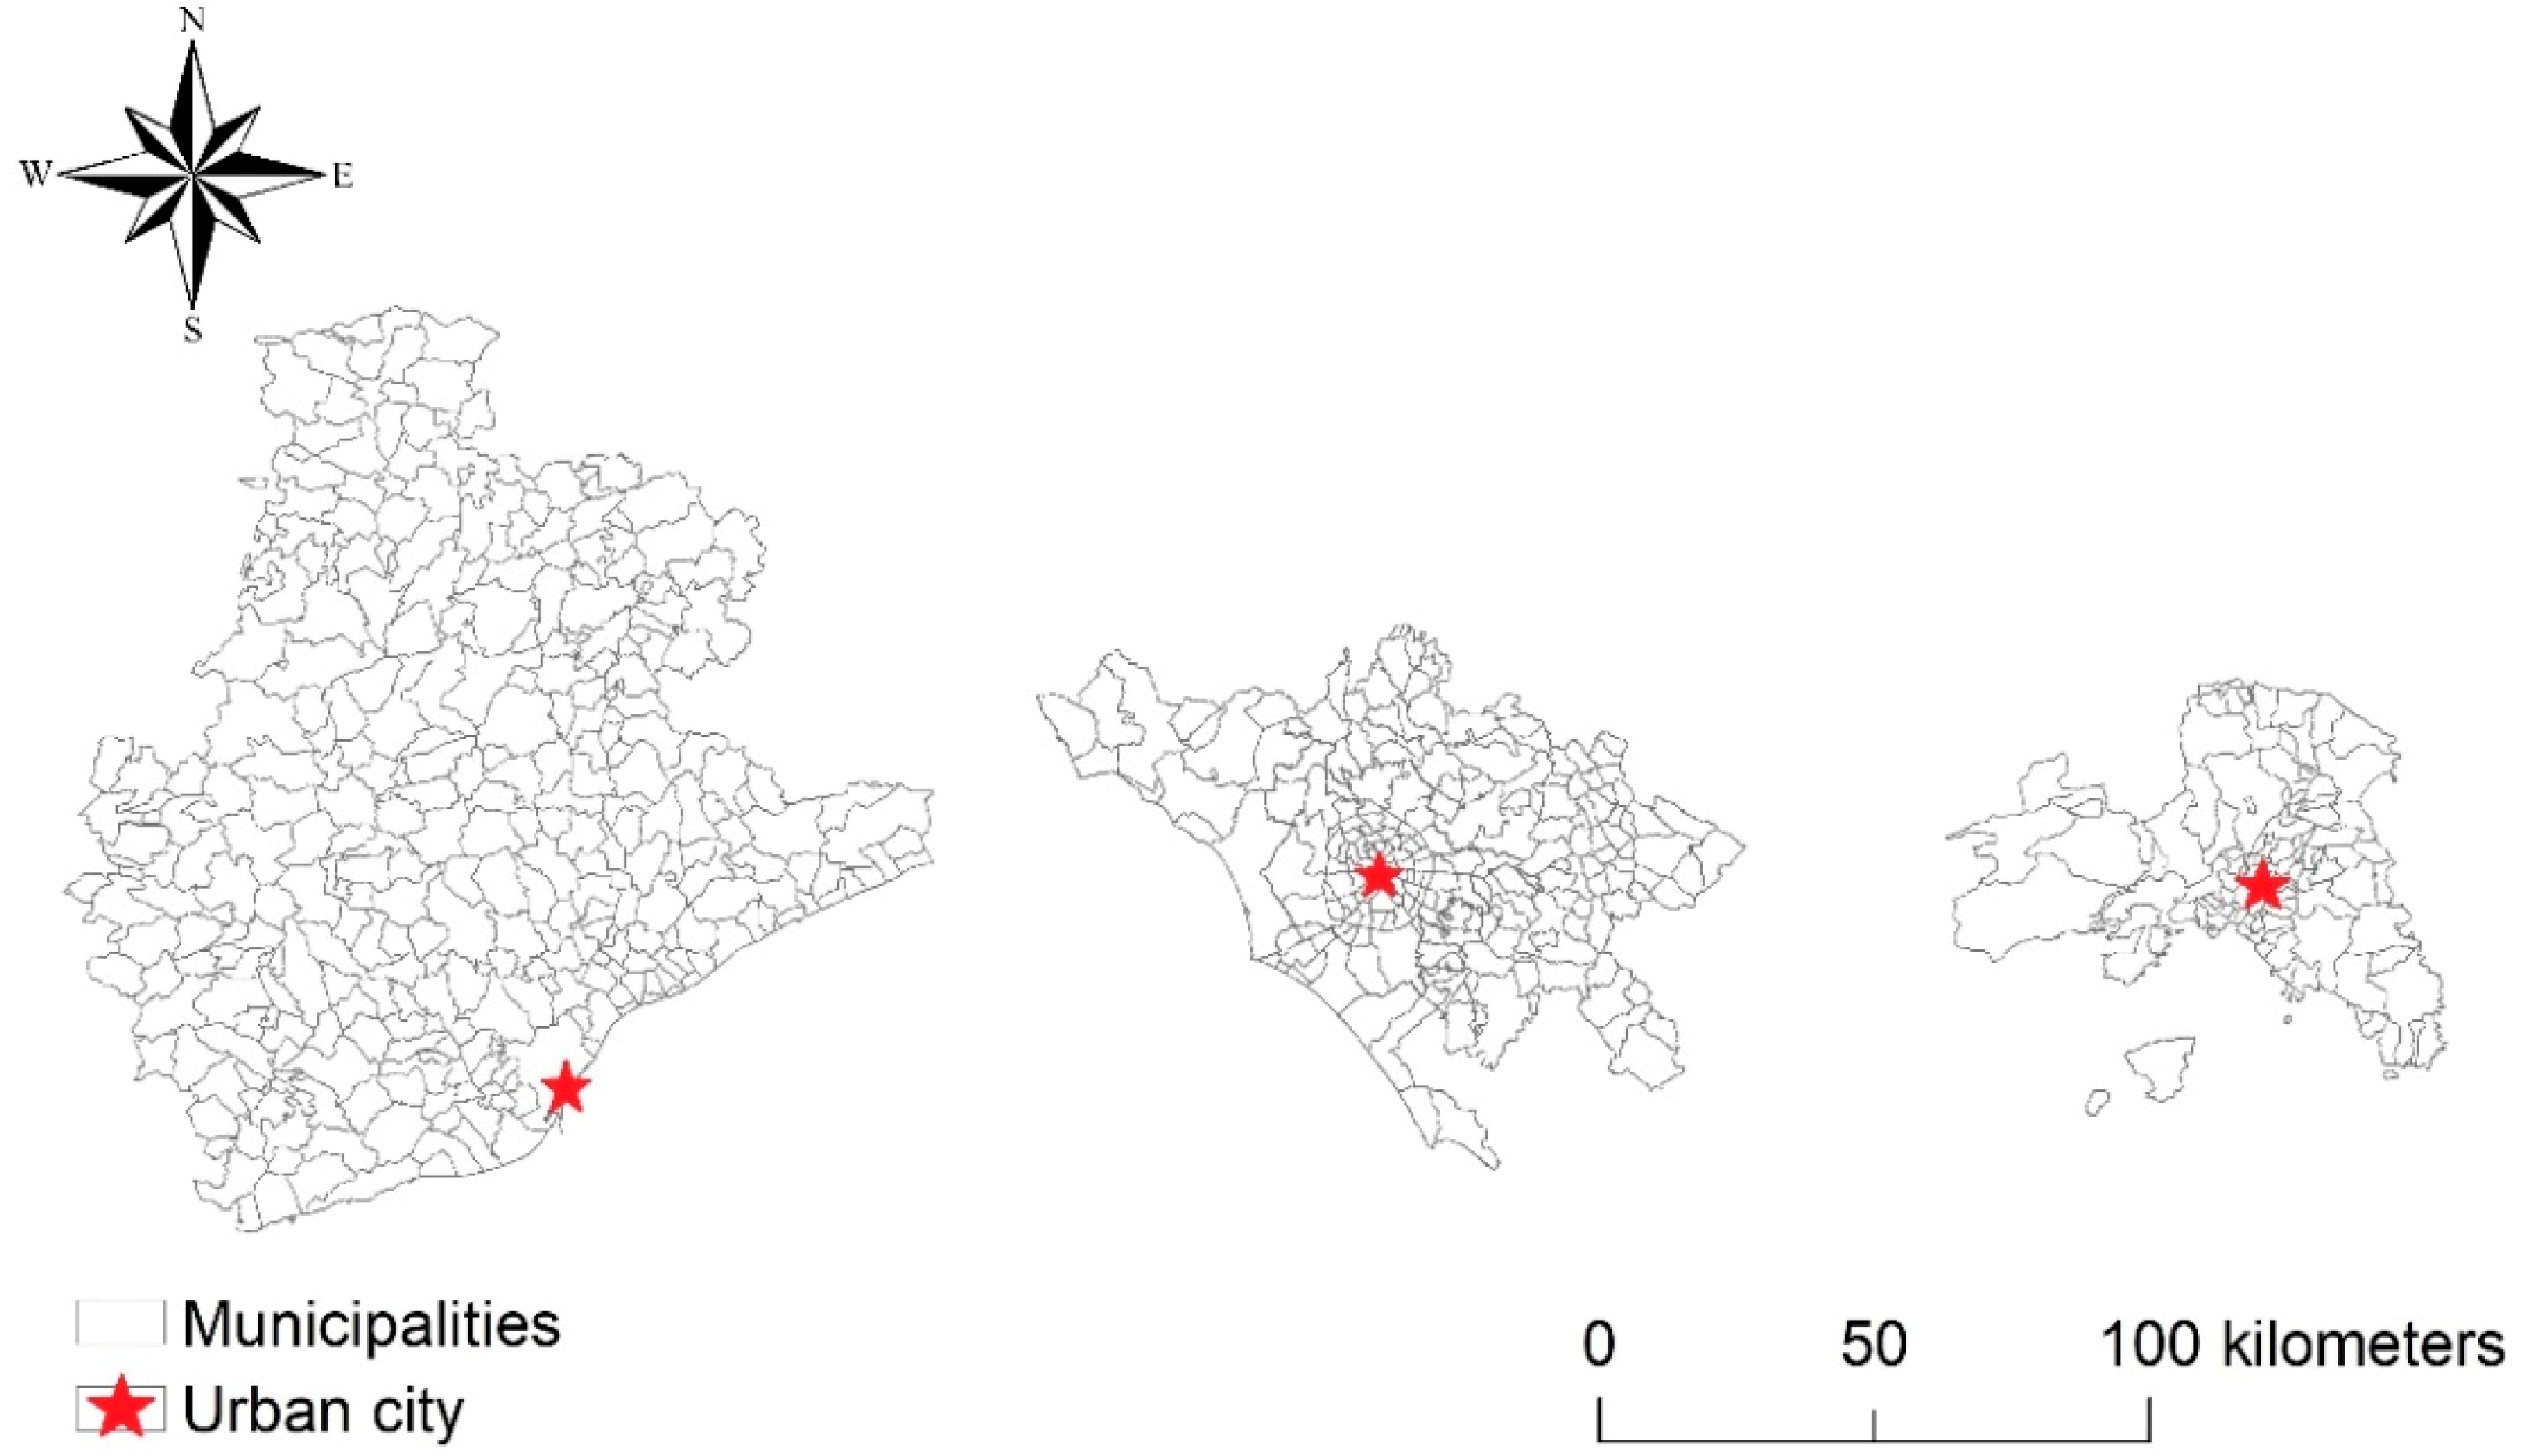
The study area included three metropolitan regions in southern Europe: Barcelona (Spain), Rome (Italy), and Athens (Greece). Considering territorial divisions based on administrative boundaries, broad regions surrounding the central city were selected as the study area with the aim to assess long-term spatial changes in population distribution, as shown in Figure 1: (i) Barcelona’s province, (ii) Rome’s province, and (iii) a large part of the administrative Attica region (including Athens, Piraeus, mainland municipalities, and Salamina island, and excluding mainland and island municipalities located in the geographical region of Peloponnese).
Being relatively stable and easily recognized by non-technical stakeholders, administrative boundaries were preferred to other territorial classifications with the objective to analyze comparative changes in the spatial distribution of the population for the whole study period [50]. The administrative borders adopted in this study correspond to the NUTS-3 level of the nomenclature of the European Territorial Statistics adopted by Eurostat (see the official Eurostat website) a harmonized system of administrative units all over Europe. The study period covers a relatively long time period in the second half of the last century and reflects complex urban dynamics shifting from the massive demographic expansion of the 1960s and the 1970s (associated with compact, mono-centric development of central cities and suburbs) to population shrinkage (associated with a more dispersed expansion of settlements in peri-urban districts) typical of the 2000s. A basic description of the three case studies considering land area, number of spatial units, population density and growth over time is reported in Table 1.
Barcelona’s province encompasses Barcelona’s metropolitan region and includes 311 municipalities that administer nearly 7725 km2 of land. Most of the province’s area still consists of agricultural and natural land cover; urban areas are concentrated around Barcelona and are in the most accessible flat locations [49]. The productive structure of the region is characterized by traditional and advanced services; while Barcelona concentrates tertiary activities with high value added, the city actually hosts a relevant economic base specialized in the manufacturing, metallurgical, chemical, and pharmaceutical sectors [51]. Rome’s province is now officially designed as the ‘metropolitan area of Rome’ (following the prescription of a national Italian law from 2009) and covers nearly 5355 km2 of land. The region is partitioned in 121 local municipalities that administer a relatively heterogeneous territory, with fragmented semi-natural landscapes that contrast with the compactness of the historical city of Rome, where upper socioeconomic functions are concentrated [52,53,54]. The city provides traditional and advanced services and thrives on the retail trade and tourism. Rome’s modern expansion was driven by service expansion instead of industrial development. The industrial sector is characterized by medium- and small-sized enterprises, except for the high-tech industry, located in sparse peri-urban districts south and east of Rome [55].
The Athens region covers nearly 3000 km2 in central Greece and is partitioned into 114 municipalities (referring to the traditional classification of local administrative units, the so called ‘Kapodistrias’ structure). The region consists of steep land bordering the Greater Athens area—a continuous conurbation of residential-service settlements occupying a relatively flat area. Attica’s economy is oriented toward advanced and traditional services [56] concentrated in both Athens (communication, finance, banking, insurance, and real estate) and Piraeus (transport, logistics, and trade). The last Olympics (2004) had a pivotal impact on urban development, attracting public and private investments and promoting road and railway infrastructure [23,44].
2.2. Statistical Data
Our study analyzed population data derived from the National Census of Population and Households carried out in 6 waves every 10 years on behalf of the respective National Statistical Authority (Instituto Nacional de Estadistica: INE in Spain [www.ine.es], Istituto Nazionale di Statistica: ISTAT in Italy (www.istat.it), and Hellenic Statistical Authority: ELSTAT (www.statistics.gr)). The study years were 1960 in Barcelona (or 1961 in Rome and Athens), 1970 (or 1971), 1980 (or 1981), 1990 (or 1991), 2000 (or 2001), and 2010 (or 2011).
2.3. Analysis’ Spatial Unit
Municipalities and homogeneous economic districts were frequently adopted as the elementary analysis’ unit in a spatially-explicit analysis of urbanization, demographic transformations, and regional economic change [13,34]. Criticism was raised on their relevance for evaluation of population dynamics and coherent urban growth trajectories, municipalities, and other spatially-disaggregated administrative units [53]. However, these units allow a detailed investigation of population density over a relatively long time interval, due to homogeneous and standardized census data available for past decades [14].
Municipal-level population data allow a comparative investigation of urban dynamics at both regional and local scales; integration with external data sources producing socioeconomic information relevant to regional studies is possible at such spatial scales. Integrated information on urban growth and population dynamics are more easily comprehensible for policy-makers, planners, practitioners, and non-technical users. In the three Mediterranean countries considered in our study, municipalities are taken as the local authority defining (or contributing to define) land zoning. More specifically, municipal councils fix building volume, settlement size and shape, make decisions on land taxation regimes, and influence with their decisions other socioeconomic factors that influence the spatial distribution of population, ultimately determining population density over relatively vast areas [57,58,59]. In this regard, municipalities are a relevant spatial domain for both urban and regional planning [60] and for this reason are adopted as the homogeneous analysis’ domain. Considering the exceptional size of Rome’s municipality (1285 km2), this area was partitioned into 115 districts oriented along the urban gradient [15].
2.4. Data and Variables
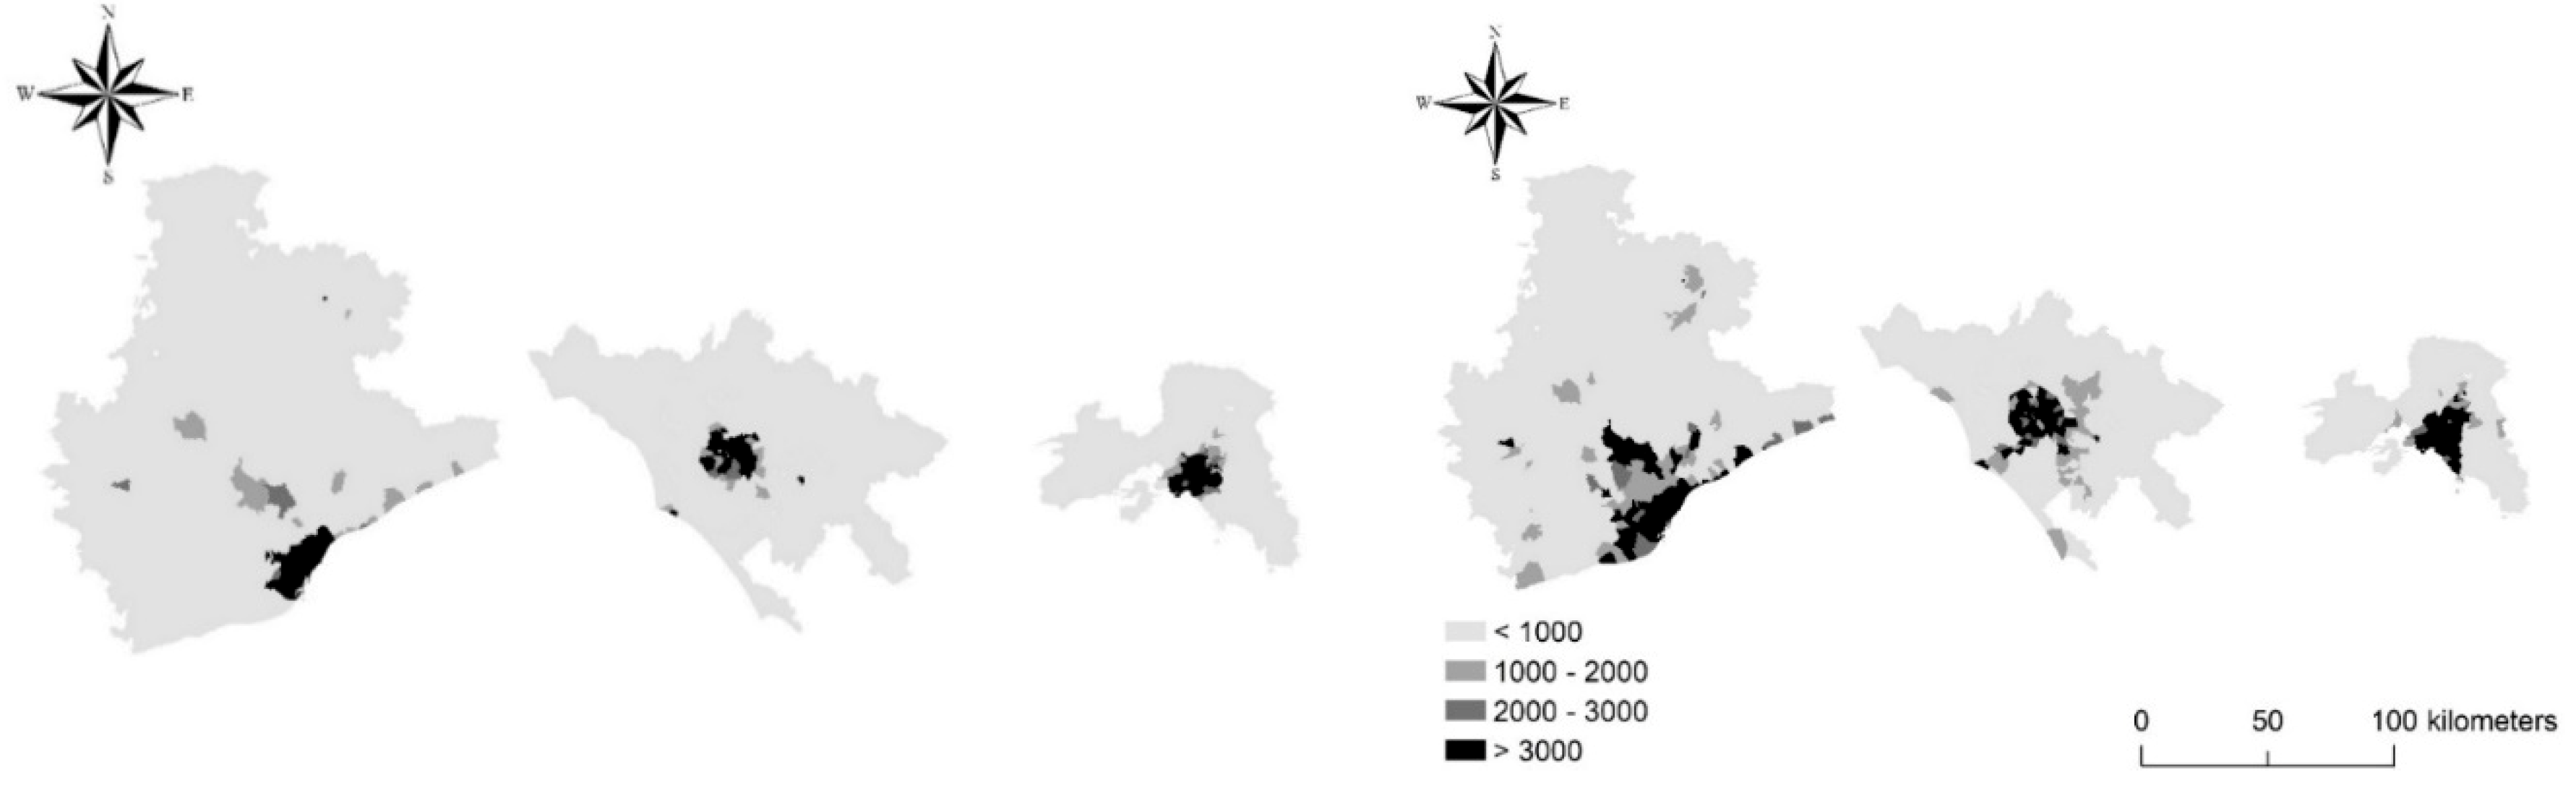
Population density was calculated from data quantifying resident population at a municipal scale and a municipal area (km2), collected on behalf of the General Census of Population carried out in each country once per decade, 1960–2010 (or 1961–2011). Data were analyzed consistently for Barcelona, Rome, and Athens with the aim to assess changes over time in the spatial distribution of population across each region, as show in Figure 2.
2.5. Statistical Analysis
A multi-step analytical framework was proposed in this study with the final objectives (i) to assess long-term, individual paths of urban expansion in the three cities and (ii) to identify population sub-centers. Identification of sub-centers was based on a spatially-explicit analysis of standardized residuals from a specified regression model. Regression models are simplified tools investigating the relationship between a dependent variable and one (or more) predictor(s). Under the assumption that spatial variability in population density along urban gradients is a proxy of long-term urban growth [50], a log-linear regression was run to quantify the linkage between the dependent variable (population density, inhabitants/km2) and a predictor (distance from a central place, km) in each city [34] according to the equation:
where Y is population density, X is the distance from a central place in each city (see Section 2.4), α and β are respectively model’s intercept and slope, and e is the regression error, estimated through the standardized distance of the model’s prediction from the observed value (regression residual). Ordinary least squares regressions were estimated separately for each city and time point, using adjusted R2 as a measure of the model’s goodness of fit. Relevance of each regression coefficient was based on computation of a t-statistic testing for significant coefficients at p < 0.001. Earlier studies [50] illustrated that a diachronic analysis of regression coefficients over a sufficiently long time period allows identification of individual paths of urban expansion.
log(Y) = α + βlog(X) + e
2.6. Mapping Population Concentration
Each municipality was classified according to the standardized value of the regression residual calculated from the respective model run by year. We assumed that positive residuals indicate a population concentration differing largely from what is predicted by the respective model (an important precondition when identifying sub-central locations in a metropolitan region). In particular, we considered a standardized residual >1 as a condition identifying a municipality with a population density deviating significantly from the model’s expectation. Specific maps represent the spatial distribution of standardized residuals by year and city. An average (standardized) residual was finally calculated for each spatial domain and region considering the residual’s values observed over the study period (n = 6 years), a relatively long time interval encompassing different urban phases and distinct economic cycles. Municipalities with an average residual >1 were considered as population sub-centers based on the assumption that sub-centers are characterized by a systematically higher population concentration than the model’s prediction.
3. Results
Table 2 reports the results of the regression model (Equation (1) separately for each area and year. The models’ goodness of fit was high and statistically significant and increased over time for all cities. For Barcelona, the adjusted R2 of the model regressions increased from 0.33 (1960) to 0.51 (2010). The regression intercept increased from 4.28 (1960) to 6.19 (2010), indicating urban expansion. The regression slope decreased from −1.52 (1960) to −2.54 (2010). This trend evidenced an increasing gap in population concentration between urban and rural areas.
For Rome, the adjusted R2 decreased from 0.67 (1961) to 0.60 (2011). Model’s intercept increased moderately up to 1981 (2.60), decreasing slightly in the subsequent decades. The regression slope declined progressively from −1.69 (1961) to −1.45 (2011). For Athens, the adjusted R2 of log-linear models increased up to 1991 (0.79) declining in 2001 and 2011. The regression intercept increased from 5.52 (1961) to 5.76 (2011), with a peak in 1981 (5.92), indicating a latent process of densification up to 1981 and a de-centralized expansion afterwards. Regression slopes reach a peak (−2.80 in 1971) that reflects settlement densification in both Athens and Piraeus.
3.1. Barcelona
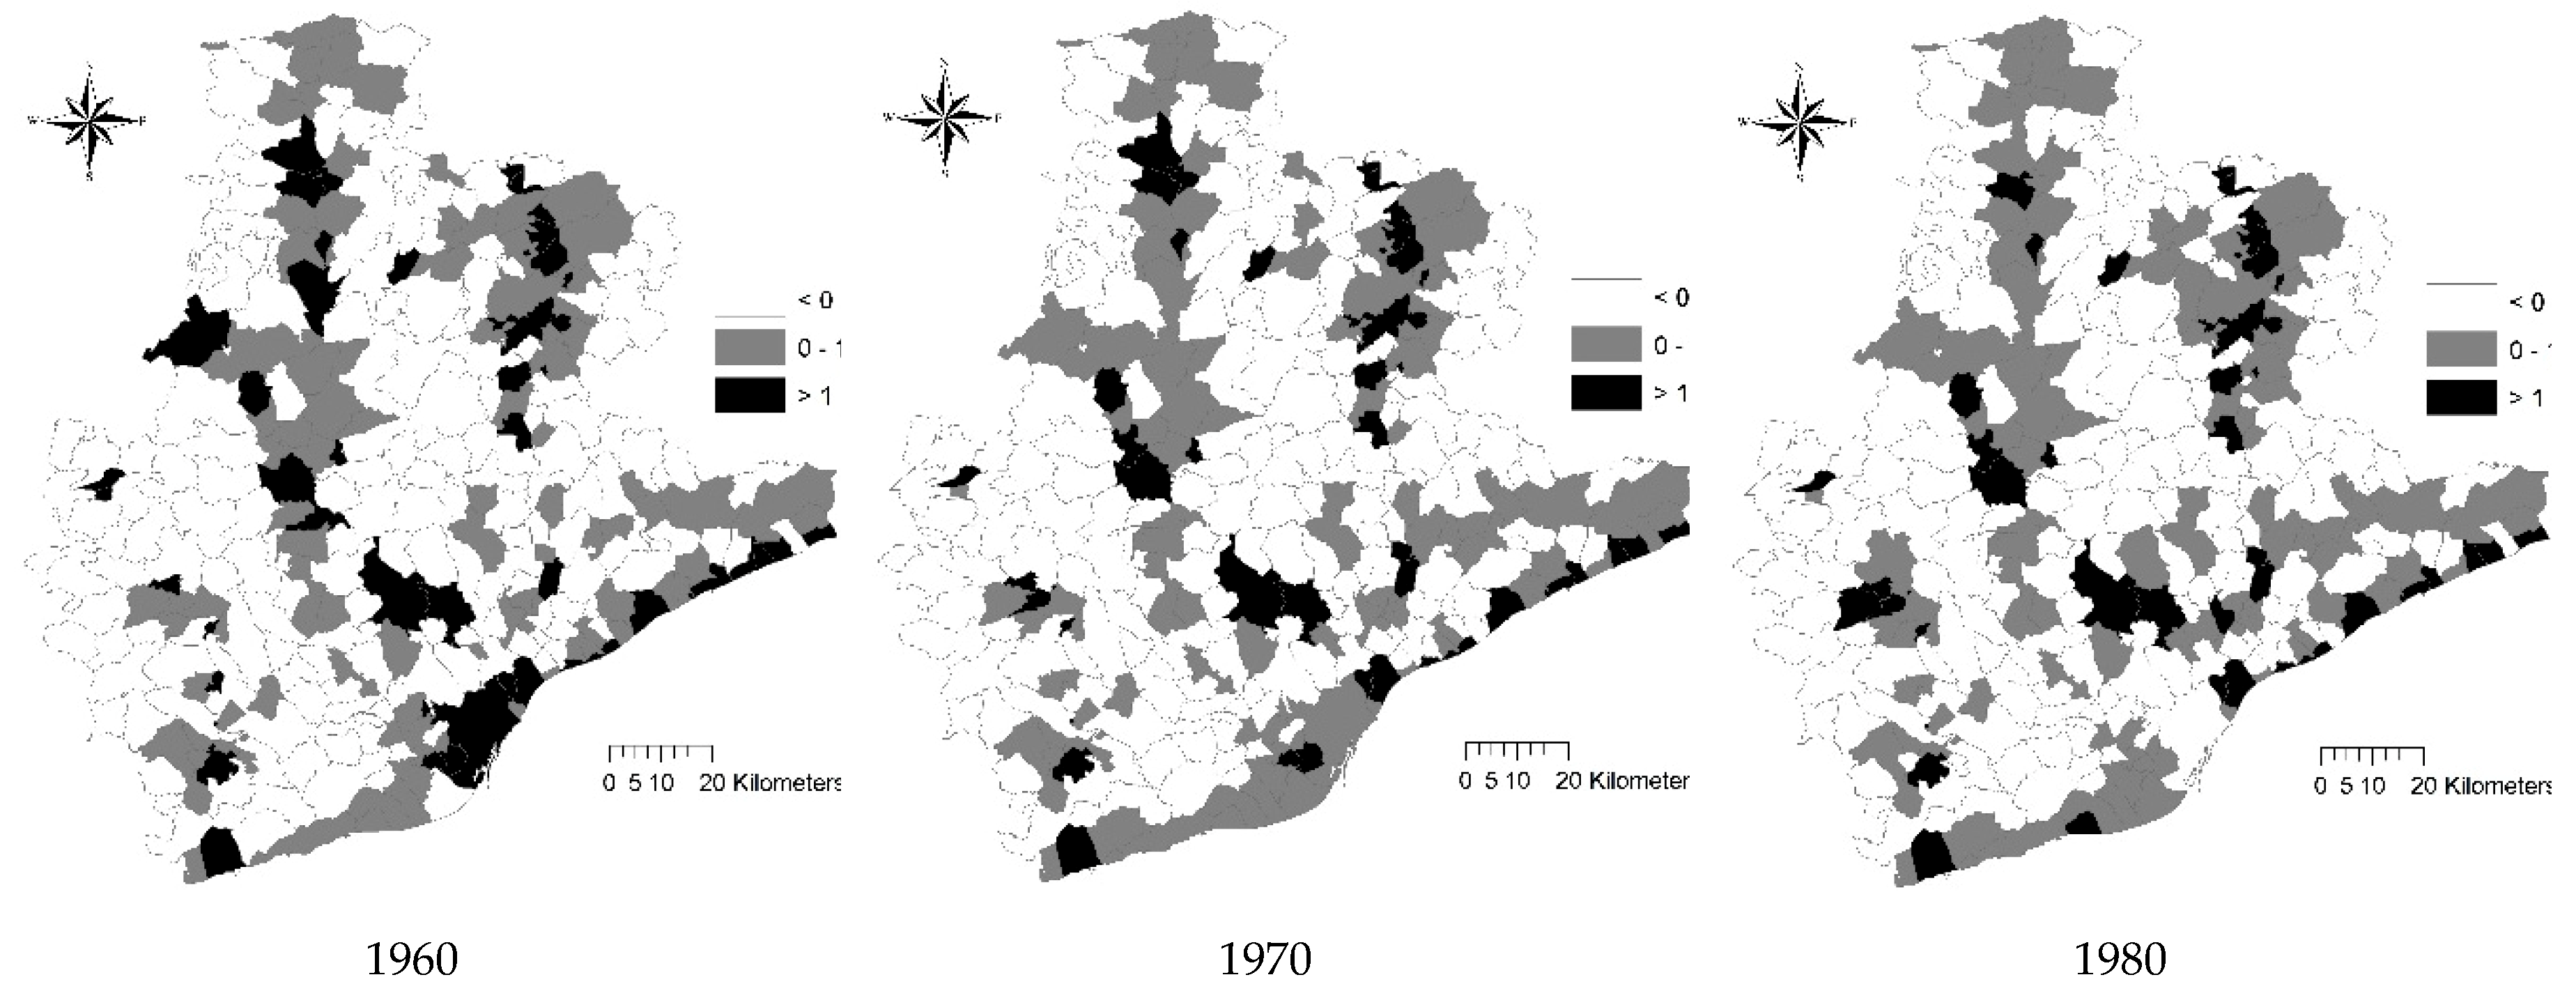
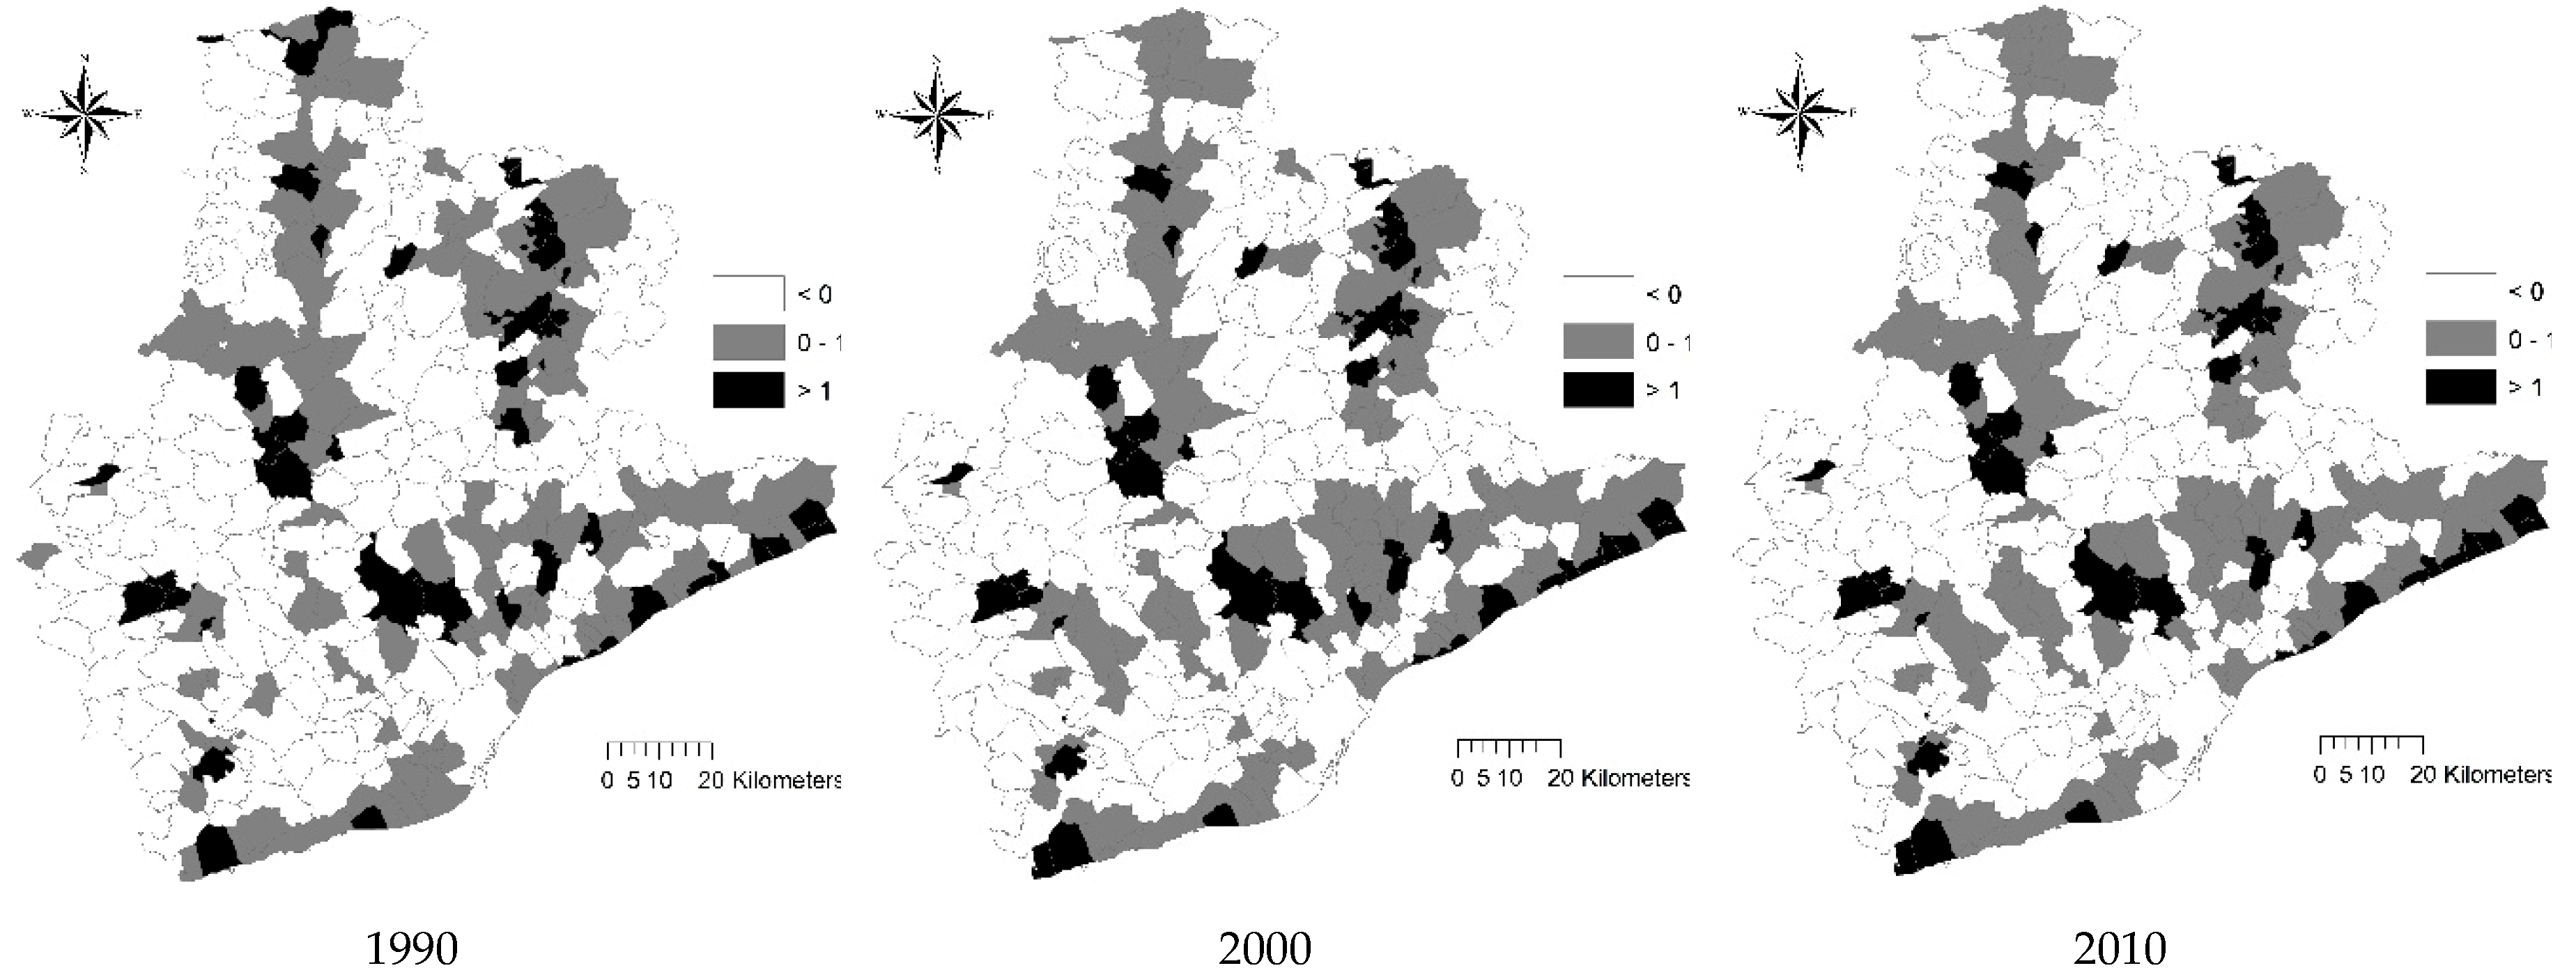
The spatial distribution of the standardized residuals from the log-linear model for Barcelona described in Table 1 is illustrated in Figure 3. Standardized residuals >1 identified (i) coastal municipalities surrounding Barcelona and (ii) inland municipalities situated along the major transport routes to central Spain (Zaragoza) and the Pyrenees mountains. The first group include towns like Matarò, Sitges, and Vilanova i la Geltrù; the second group include towns like Sabadell, Terrassa, Granollers, Sant Cugat, Martorell, Rubì, Manresa, Vic, and Berga. Some of these locations were classified as residential/employment sub-centers in earlier studies. Inland places like Manresa, Vic, and Berga were characterized as head towns of (more or less) wide rural districts functionally connected with (but physically separated from) Barcelona. Interestingly, Barcelona and the neighboring municipalities (e.g., Badalona) received highly positive residuals in 1961 only, indicating a substantial change from a more centralized model to a de-centralized structure with sub-centers consolidating at distances progressively further away from the central city.
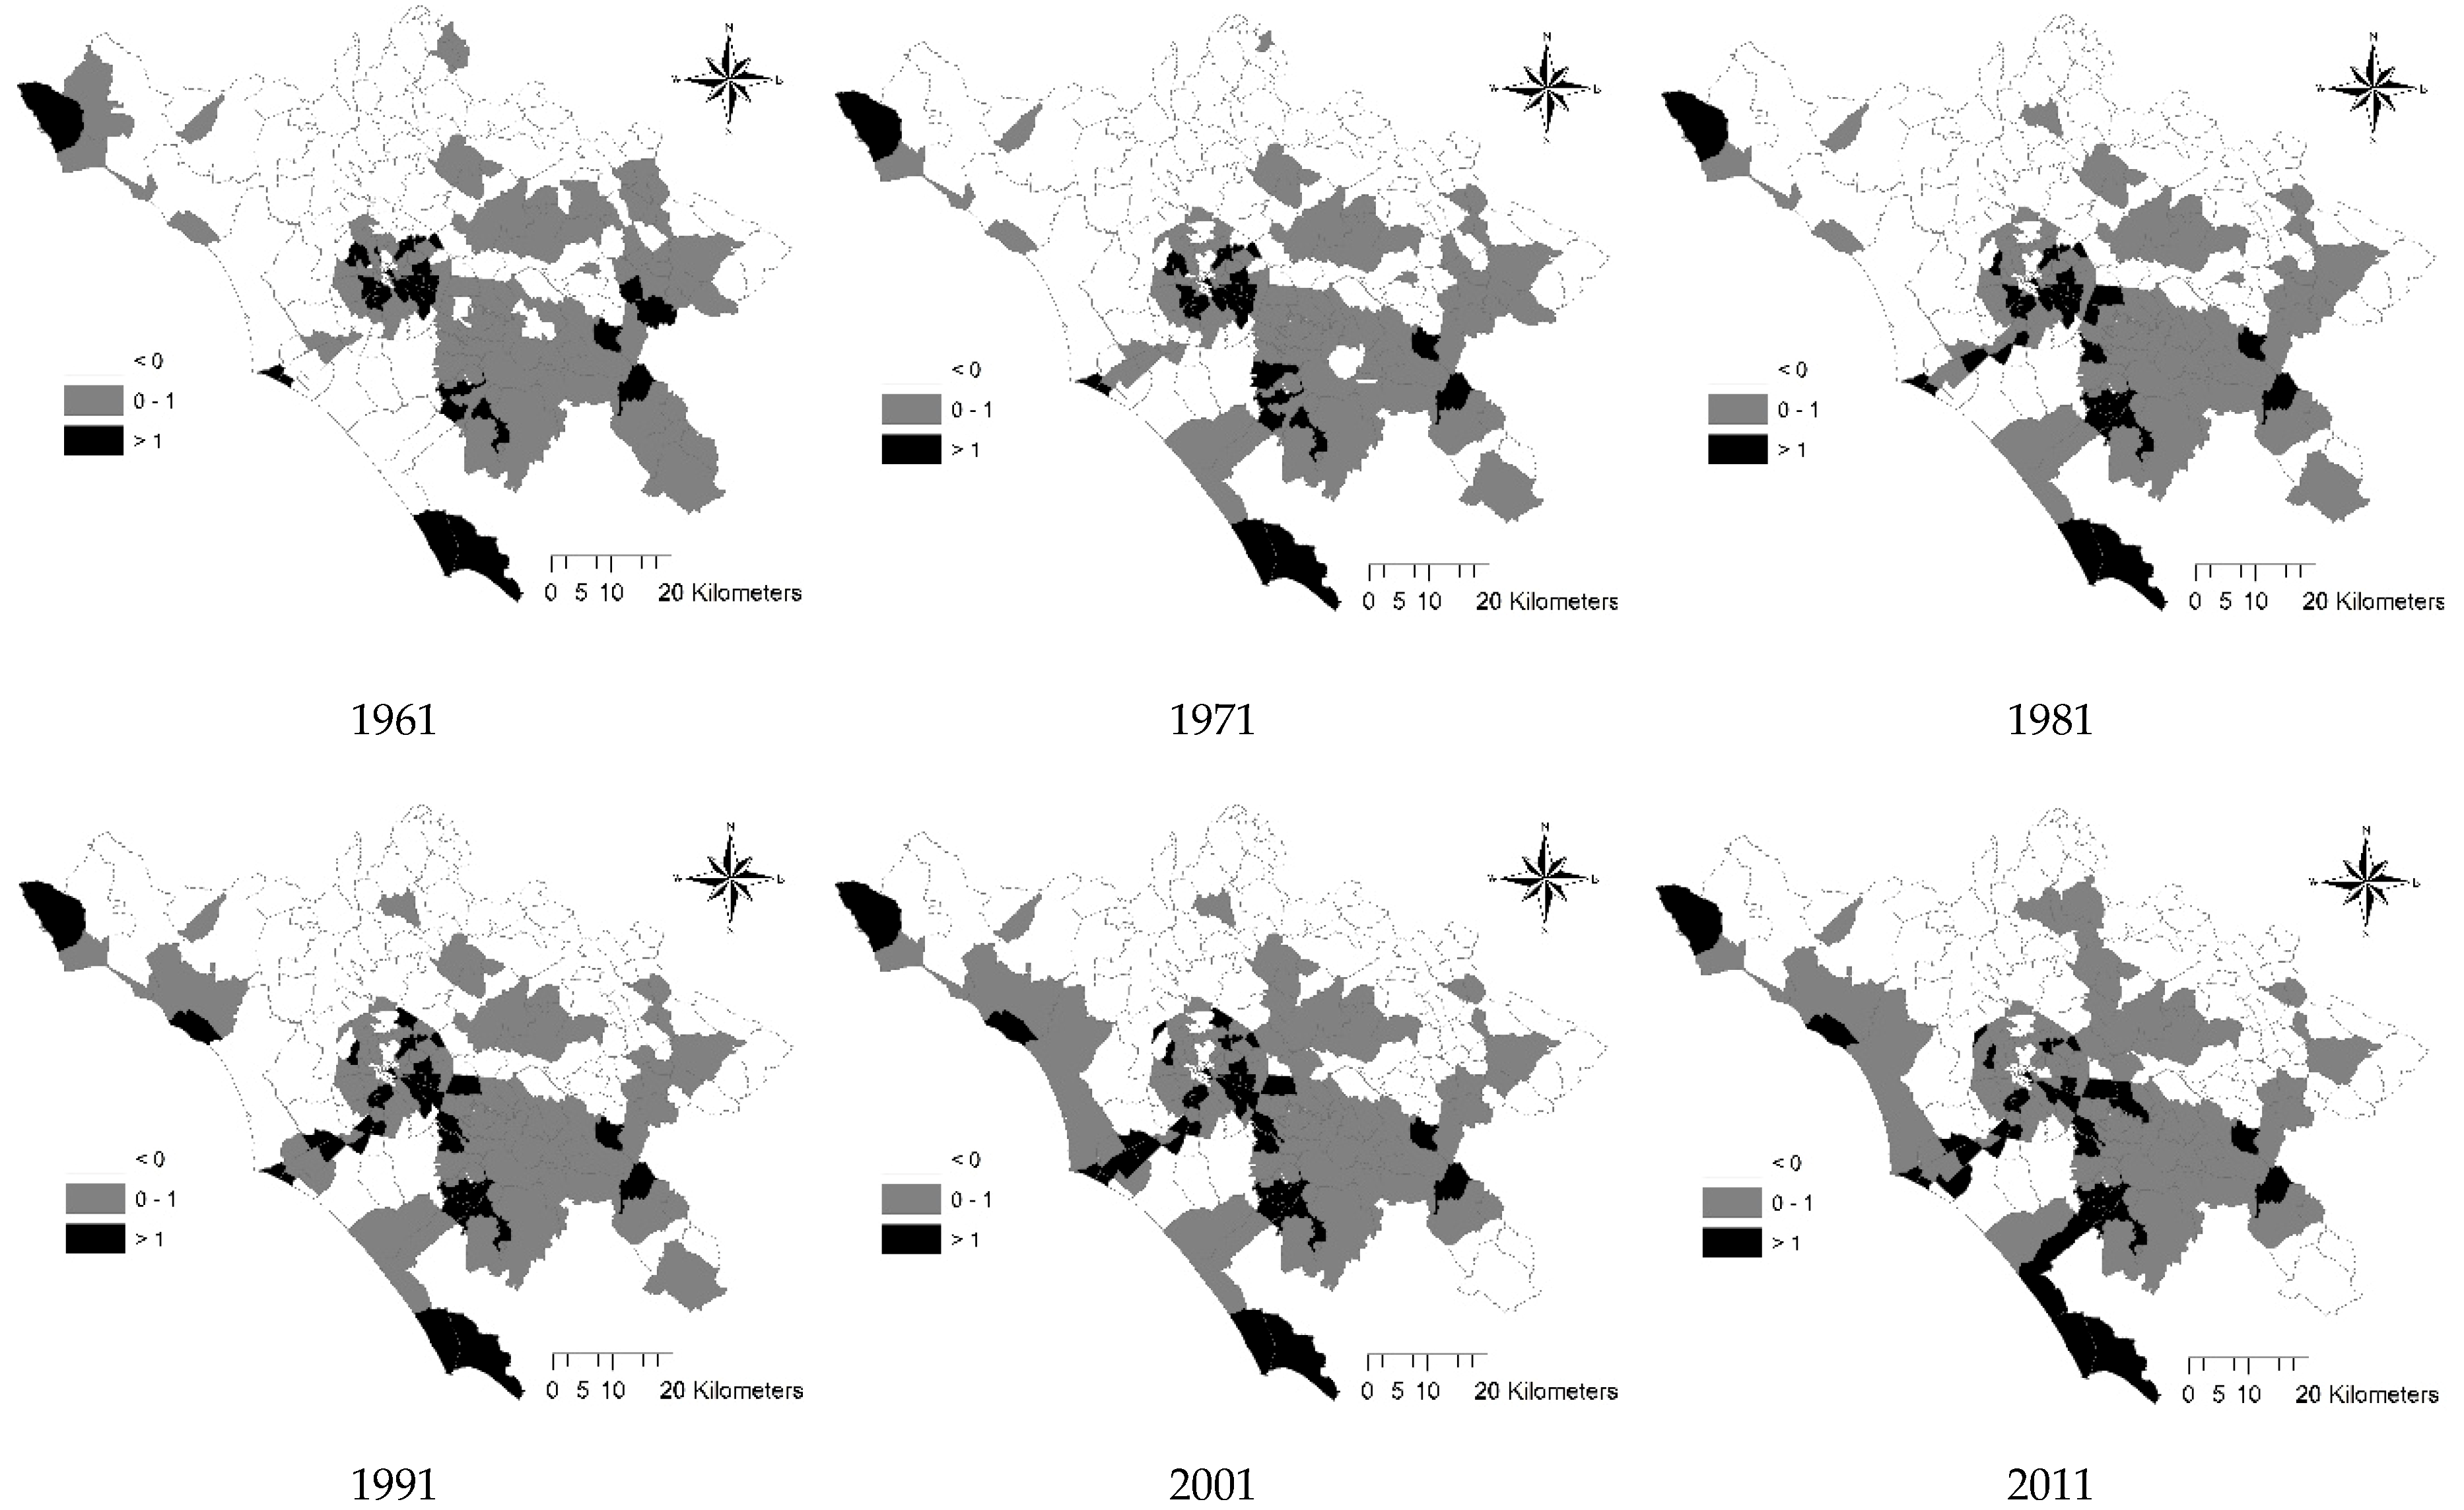
3.2. Rome
The spatial distribution of the standardized residuals from the model described in Table 1 for Rome is illustrated in Figure 4. Standardized residuals >1 were more scattered over space than in Barcelona and identify different clusters of municipalities: (i) peripheral districts belonging to Rome’s agglomeration (including the coastal town of Ostia, belonging to Rome’s municipalities but physically distinct from the main city and at a distance of more than 20 km from the city center), (ii) coastal municipalities at distances between 30 km and 50 km from Rome (including towns such as Civitavecchia and Anzio-Nettuno, with a leading role for the surrounding rural district), and (iii) internal municipalities situated in the Castelli Romani district, a traditional rural territory where some locations consolidated as local centers are attracting population and employment. As in Barcelona, peripheral districts in Rome received residuals progressively less positive over time.
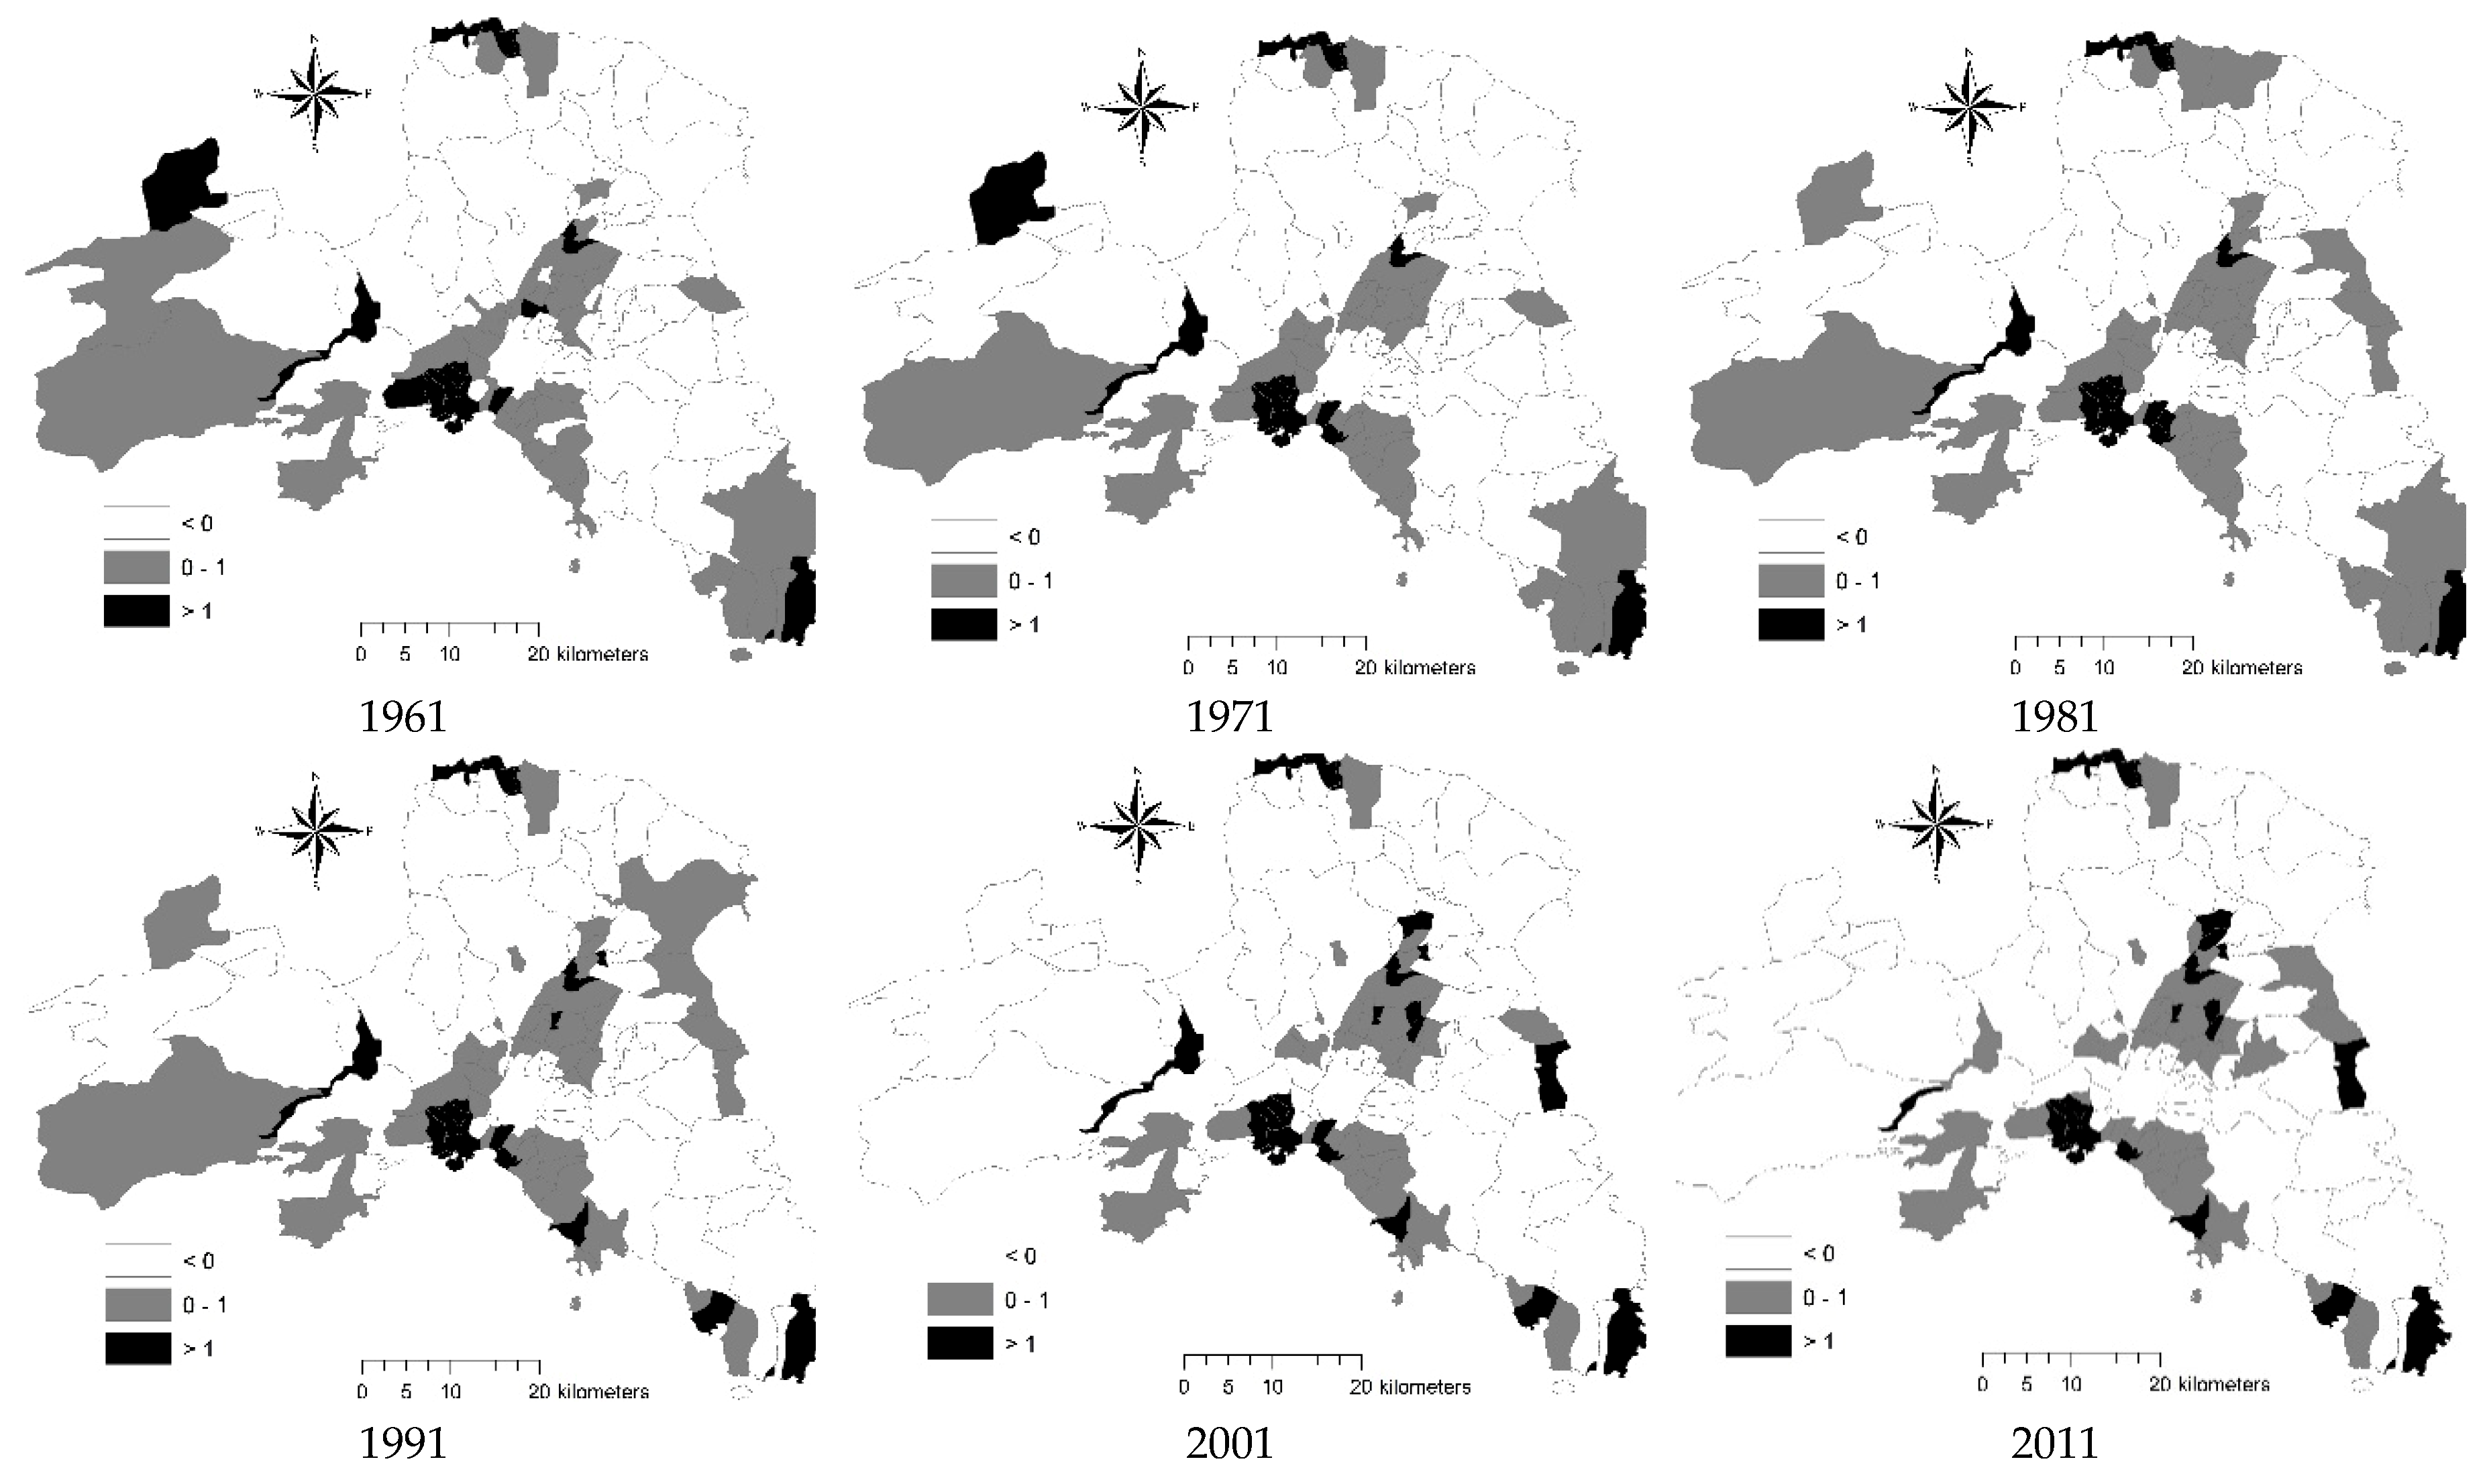
3.3. Athens
The spatial distribution of the standardized residuals of the model described in Table 1 for Athens is illustrated in Figure 5. Municipalities with standardized residuals >1 were relatively few and scattered over space compared with both Rome and Barcelona. Two groups of municipalities were detected: (i) peripheral districts belonging to the Greater Athens area and mainly situated in the Piraeus prefecture and in a district north-east of Athens experiencing rapid urban expansion since the 1980s, and (ii) coastal municipalities west, south-east, and north of Athens, at distances between 30 km and 50 km from downtown (Lavrio, Oropos, Rafina). As in Barcelona, central municipalities around Athens had negative (or slightly positive) standardized residuals. As in Rome, peripheral districts in Athens received standardized residuals progressively less positive over time.
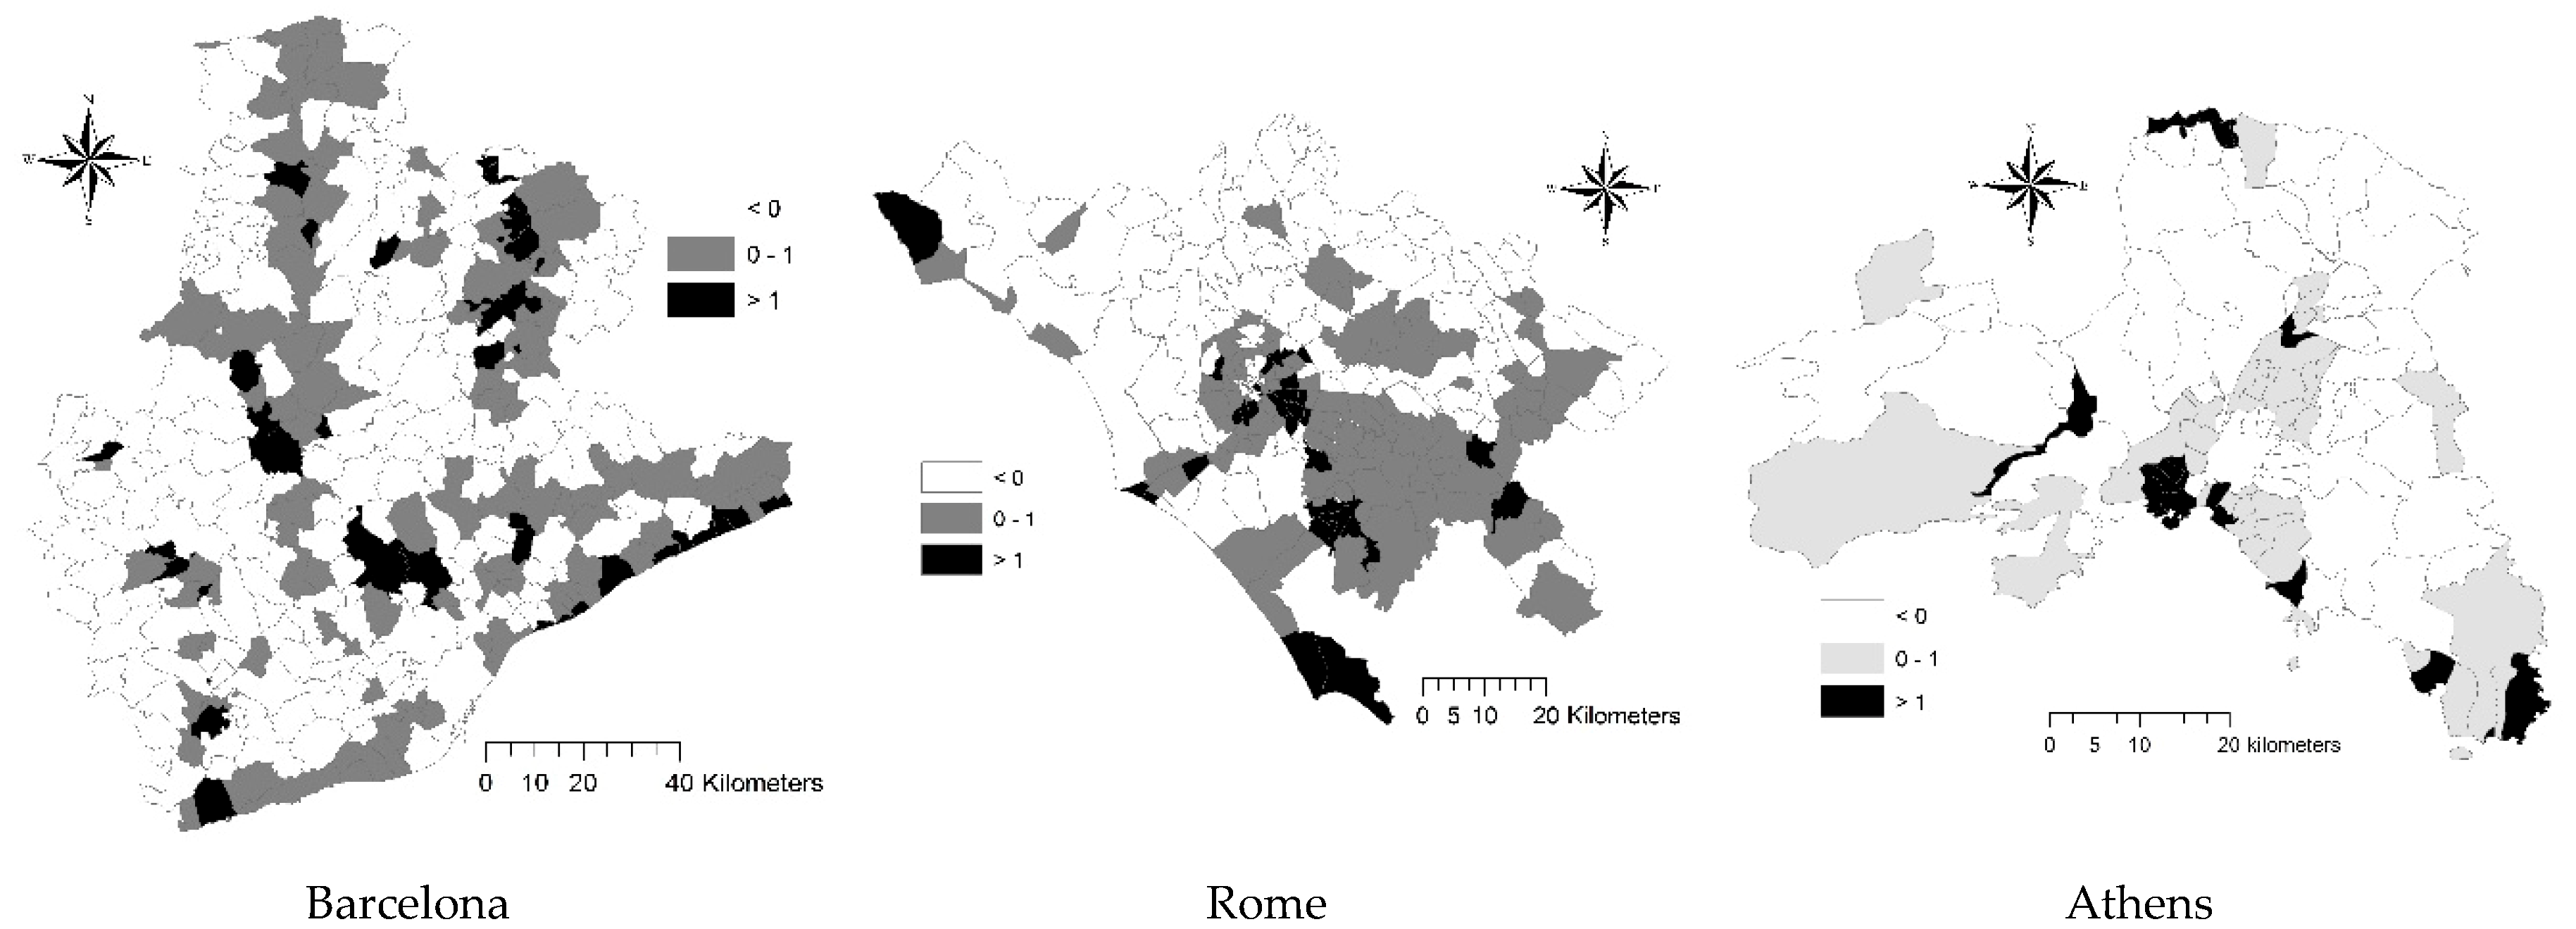
3.4. Identifying Population Sub-Centers
Considering municipalities with standardized residuals systematically above 1 over the study period as candidate sub-centers, as shown in Figure 6, a differentiated spatial pattern emerges for the three cities. For Barcelona, municipalities with average residuals >1 were identified along the sea coast (e.g., Matarò), the outer ring of Barcelona (Sabadell, Terrassa), and in more internal locations along the highways to Zaragoza (Manresa) and Pyrenees (Vic, Berga). Potential sub-centers in Rome were mainly located in the outer city ring (Ostia, Ciampino, and surrounding districts), along the coastal line (Civitavecchia, Ladispoli, Anzio) and in more internal locations (Frascati, Albano, Marino in Castelli Romani districts and Colleferro, along the highway to Naples). Candidate sub-centers in Athens were identified as specific municipalities in the Greater Athens area (Kifissià, Glyfada), and along the sea coast farther away from Athens (Elefsis, Lavrio, Oropos).
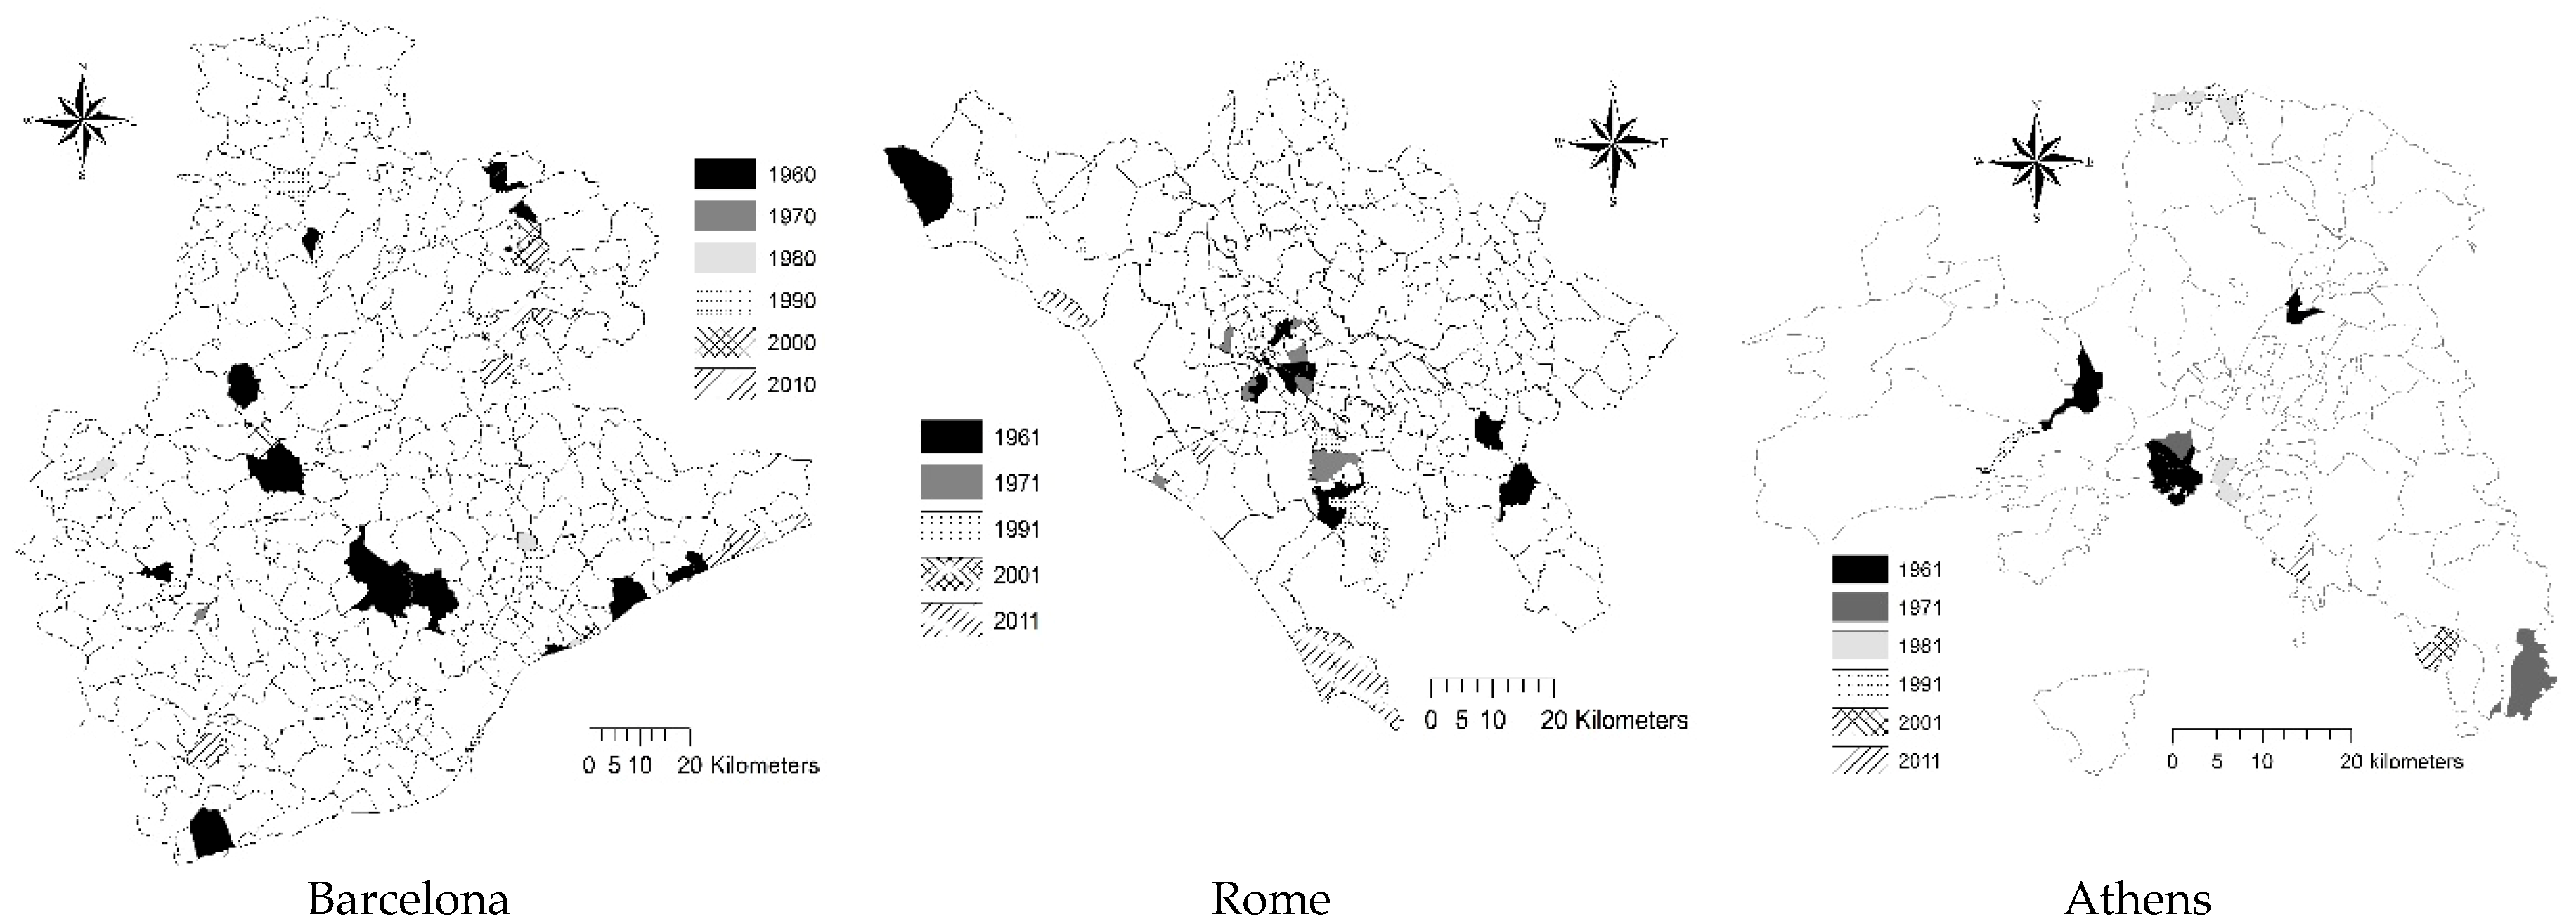
3.5. Local-Scale Trajectories of Urban Growth Based on Residuals of a Density-Distance Regression Model
A summary outline of recent trajectories of urban growth in the three cities was derived from a map, as shown in Figure 7, illustrating the year when the highest standardized residual from a density-distance model was observed for each candidate municipality (i.e., with average standardized residuals >1). In Barcelona, coastal municipalities and municipalities along the highway to Zaragoza received the highest positive residuals at the first observation year (1960). Some internal municipalities in the outer ring of Barcelona and along the highway to the Pyrenees mountains received particularly high residuals in more recent time periods, possibly indicating urban fragmentation and a local development oriented toward consolidation of specific urban nodes in recent decades. In Rome, outer ring districts, inland municipalities, and a coastal municipality (Civitavecchia) received the highest residuals in 1961 or 1971. Municipalities with the highest residuals observed in the most recent time are situated along the coastal sea line (Anzio, Ladispoli). Municipalities belonging to the Greater Athens area received the highest residuals in 1961. Municipalities assuming the highest positive residuals in recent decades are more scattered over space and most of them are situated along the sea coast. In all cases, peri-urban locations identified as candidate sub-centers received the highest residuals in the first decades of the time interval; rural locations—or locations more distant from central cities—identified as candidate sub-centers, showed the highest residuals in more recent decades (2001 or 2011).
4. Discussion
Regional science is oriented toward multidisciplinary approaches exploring urbanization processes and identifying polycentric development according to concepts of metropolitan sustainability and regional resilience [56,61,62]. A comprehensive analysis of polycentric processes of urban expansion requires setting up measures and criteria to define sub-centers considering population, employment, and/or economic activities. A comprehensive analysis of the spatial distribution of population over a sufficiently long time period may contribute to identification of spatial intensity and direction of polycentric growth [29,30,33]. In this regard, our study demonstrates that a comparative analysis of urban expansion is appropriate to define processes of spatial re-organization of metropolitan regions with the formation (and/or consolidation) of population sub-centers around the central city [17]. A spatially-explicit, diachronic analysis of sub-central locations in metropolitan regions definitely advances understanding of non-linear processes of urban growth and the underlying transformation of socioeconomic structures [17,18,51,63].
The approach proposed here defines an operational framework that identifies population sub-centers using local analysis’ spatial domains (e.g., municipalities, economic districts, homogeneous areas) under specific assumptions and criteria. Such analysis assumed that a polycentric structure is characterized by (more or less) considerable deviation from a linear model assessing urban typical relationships oriented along urban gradients, under the hypothesis that a classical mono-centric urban structure is satisfactorily described by a linear relationship between the two variables. Considering a relatively long time period, spatial units assuming systematically high residuals from a linear model linking population density with distance from the inner city are considered relevant examples of population sub-centers. Given the complex interactions between population dynamics and socioeconomic contexts reflected in specific spatial structures [33], our study advances the analysis of long-term urban transitions in three southern European cities (Athens, Rome, and Barcelona), highlighting individual trajectories of metropolitan expansion. The three cities have experienced different urbanization waves influencing the overall metropolitan configuration, with variable impact on the original mono-centric structure.
In line with the empirical evidence of earlier studies, a variable number of candidate sub-centers was identified in the three cities, with a (more or less) scattered distribution along the urban gradient. Such growth trajectories are reflected in a specific spatial distribution of sub-centers. In the first decades of the study period, population sub-centers were identified more frequently in the outer ring of the three central cities. In the most recent decades, municipalities classified as sub-centers were situated at increasing distances from central cities, following the progressive expansion of metropolitan regions with moderate population de-concentration [11,12,35,64]. More specifically, population sub-centers identified in this study include (i) peri-urban municipalities around the central city and more remote towns situated in rural districts (Barcelona); (ii) scattered towns at variable distances (20–30 km) from the central city (Rome); (iii) fringe municipalities and peri-urban locations in flat districts, 10–20 km away from the central city (Athens). Such findings may indicate a distinctive evolution path toward polycentric development in the three cities, more evident in Barcelona and Rome and less evident in Athens.
These trajectories reflect two main urbanization phases with sequential waves of dense and dispersed urban growth over the last 50 years in Mediterranean Europe, the former being associated with compact, mono-centric expansion of central cities (1950–1980), the latter being characterized by a dispersed expansion of residential and service settlements into rural areas (1980–2010). In other words, the studied cities expanded through similar spatial patterns up to the early 1980s. In the following decades, urban expansion has produced differentiated morphologies and a (more or less) fragmented spatial organization of the three metropolitan regions [47]. Landscape morphology, the historic distribution of settlements and communication ways, land availability for building, and improved accessibility may justify such differences.
A comparative analysis of the three cities suggests that place-specific development models reflect a divergent spatial organization that may alter significantly the (presumed) homogeneity of forms and functions in Mediterranean cities [19,49,54]. In line with this assumption, the empirical results of our study indicate that Barcelona’s province is a moderately polycentric region. Municipalities classified as population sub-centers grew in number at progressively larger distances from the core city. The resulting urban structure shows a moderate balance of socioeconomic functions. By contrast, population re-distribution in Rome has partly modified the traditional spatial structure characterized by discontinuous and fragmented settlements organized in few towns around a compact city [46]. While being highly dispersed, this settlement structure was considered only moderately polycentric. The evolution of Athens’ spatial structure is structurally different from paths observed in the other two cities. The organization of the metropolitan region at the beginning of the study period was basically mono-centric. Population and upper socioeconomic functions are concentrated in downtown Athens. Rapid urban expansion has reduced the demographic weight of both cities, consolidating sparse sub-centers along the urban fringe [45]. Sub-centers have expanded over time at limited distances from the core city, simply merging morphologically-distinct settlements. This has prevented the creation of a (more or less) autonomous network of urban poles [64,65,66].
Decentralized, dispersed, and spatially unbalanced development in Mediterranean Europe has often led to social inequalities and economic polarization [67,68,69,70,71]. Identification of new polycentric-oriented developmental patterns contributes to define multi-scale policies promoting a more cohesive regional growth that integrates urban competitiveness and sustainability targets [72,73,74,75]. A more comprehensive knowledge of long-term regional development paths may inform effective policies aimed at promoting polycentric development and regional competitiveness [29,30]. In this regard, policy makers and urban planners are increasingly required to integrate targets of economic competitiveness and socio-ecological sustainability in spatial policies envisioning more interconnected and less fragmented cities [10]. With the recent expansion of suburban areas [71], planning systems in southern Europe could rethink urban models towards more sustainable and equilibrated regional forms [13], e.g., taking into consideration zero-net land consumption targets [8,76] and urban containment measures [72].
5. Conclusions
Polycentric development has transformed traditional, mono-centric Mediterranean cities [1,2,3]. This new regional structure should be investigated through spatially explicit, diachronic, and comparative approaches [23,43,77,78,79]. The originality of this study consists in the use of basic census data and generalized criteria defining population sub-centers. The proposed methodology can be generalized and adapted, for example, to discriminate population from employment sub-centers in metropolitan regions all over Europe. In this regard, a refined statistical approach could be implemented using multi-domain socioeconomic indicators and spatially-explicit analysis techniques together (including spatial statistics and geographic information systems modeling). The integration of exploratory and inferential data analysis can overcome the inherent difficulty when investigating Mediterranean urban gradients, contributing to define peculiar socio-economic contexts.
Author Contributions
Conceptualization, L.S.; Funding acquisition, F.M.; Supervision, F.M.; Data analysis: F.M. and L.S.; Writing—original draft, L.S. and I.Z.; Writing—review & editing, L.S. and I.Z.
Funding
This work was supported by a grant of the Ministry of Education of Czech Republic, NPU I(LO1415).
Conflicts of Interest
The authors declare no conflict of interest.
References
- Salvati, L.; De Rosa, S. ‘Hidden Polycentrism’or ‘Subtle Dispersion’? Urban growth and long-term sub-centre dynamics in three Mediterranean cities. Land Use Policy 2014, 39, 233–243. [Google Scholar] [CrossRef]
- Schneider, A.; Woodcock, C.E. Compact, dispersed, fragmented, extensive? A comparison of urban growth in twenty-five global cities using remotely sensed data, pattern metrics and census information. Urban Stud. 2008, 45, 659–692. [Google Scholar] [CrossRef]
- Hall, P. Looking backward, looking forward: The city region of the Mid-21st Century. Reg. Stud. 2009, 43, 803–817. [Google Scholar] [CrossRef]
- Dujardin, C.; Selod, H.; Thomas, I. Residential segregation and unemployment: The case of Brussels. Urban Stud. 2008, 45, 89–113. [Google Scholar] [CrossRef]
- Hatz, G. Features and dynamics of socio-spatial differentiation in Vienna and the Vienna Metropolitan Region. Tijdschr. Econ. Soc. Geogr. 2009, 100, 485–501. [Google Scholar] [CrossRef]
- Meijers, E. Measuring polycentricity and its promises. Eur. Plan. Stud. 2008, 16, 1313–1323. [Google Scholar] [CrossRef]
- Parr, J. The polycentric urban region: A closer inspection. Reg. Stud. 2004, 38, 231–240. [Google Scholar] [CrossRef]
- Salvati, L. Towards a Polycentric Region? The Socioeconomic Trajectory of Rome, an ‘ethernal’ Mediterranean City. TESG J. Econ. Soc. Geogr. 2014, 105, 268–284. [Google Scholar]
- Cowell, M. Polycentric regions: Comparing complementarity and institutional governance in the San Francisco Bay area, the Randstad and Emilia-Romagna. Urban Stud. 2010, 47, 945–965. [Google Scholar] [CrossRef]
- Faludi, A.K.F. Polycentric territorial cohesion policy. Town Plan. Rev. 2005, 76, 107–118. [Google Scholar] [CrossRef]
- Longhi, C.; Musolesi, A. European cities in the process of economic integration: Towards structural convergence. Ann. Reg. Sci. 2007, 41, 333–351. [Google Scholar] [CrossRef]
- Maloutas, T. Segregation, social polarization and immigration in Athens during the 1990s: Theoretical expectations and contextual difference. Int. J. Urban Reg. Res. 2007, 31, 733–758. [Google Scholar] [CrossRef]
- Salvati, L.; Carlucci, M. The way towards land consumption: Soil sealing and polycentric development in Barcelona. Urban Stud. 2016, 53, 418–440. [Google Scholar] [CrossRef]
- Salvati, L.; Serra, P. Estimating rapidity of change in complex urban systems: A multidimensional, local-scale approach. Geogr. Anal. 2016, 48, 132–156. [Google Scholar] [CrossRef]
- Salvati, L.; Gargiulo, V.; Rontos, K.; Sabbi, A. Latent Exurban Development: City Expansion Along the Rural-To-Urban Gradient in Growing and Declining Regions of Southern Europe. Urban Geogr. 2013, 34, 376–394. [Google Scholar] [CrossRef]
- Servillo, L.; Paolo Russo, A. Spatial Trends of Towns in Europe: The Performance of Regions with Low Degree of Urbanisation. Tijdschr. Econ. Soc. Geogr. 2017, 108, 403–423. [Google Scholar] [CrossRef]
- Ward, K. Toward a comparative (re)turn in urban studies? Some reflections. Urban Geogr. 2008, 29, 405–410. [Google Scholar] [CrossRef]
- Ward, K. Towards a relational comparative approach to the study of cities. Prog. Hum. Geogr. 2010, 34, 471–487. [Google Scholar] [CrossRef]
- Kasanko, M.; Barredo, J.I.; Lavalle, C.; McCormick, N.; Demicheli, L.; Sagris, V.; Brezger, A. Are European Cities Becoming Dispersed? A Comparative Analysis of Fifteen European Urban Areas. Landsc. Urban Plan. 2006, 77, 111–130. [Google Scholar] [CrossRef]
- Cuadrado-Ciuraneta, S.; Durà-Guimerà, A.; Salvati, L. Not only tourism: Unravelling suburbanization, second-home expansion and “rural” sprawl in Catalonia, Spain. Urban Geogr. 2017, 38, 66–89. [Google Scholar] [CrossRef]
- Kazemzadeh-Zow, A.; Zanganeh Shahraki, S.; Salvati, L.; Neisani Samani, N. A Spatial Zoning Approach to Calibrate and Validate Urban Growth Models. Int. J. Geogr. Inf. Sci. 2017, 31, 763–782. [Google Scholar] [CrossRef]
- Sarvestani, M.S.; Latif Ibrahim, A.; Kanaroglou, P. Three decades of urban growth in the city of Shiraz, Iran: A remote sensing and geographical information systems application. Cities 2011, 28, 320–329. [Google Scholar] [CrossRef]
- Colantoni, A.; Mavrakis, A.; Sorgi, T.; Salvati, L. Towards a ‘polycentric’ landscape? Reconnecting fragments into an integrated network of coastal forests in Rome. Rend. Accad. Naz. Lincei 2015, 26, 615–624. [Google Scholar] [CrossRef]
- Neuman, M. The compact city fallacy. J. Plan. Educ. Res. 2005, 25, 11–26. [Google Scholar] [CrossRef]
- Roca Cladera, J.; Marmolejo Duarte, C.R.; Moix, M. Urban structure and polycentrism: Towards a redefinition of the sub-centre concept. Urban Stud. 2009, 46, 2841–2868. [Google Scholar] [CrossRef]
- Veneri, P. The identification of sub-centres in two Italian metropolitan areas: A functional approach. Cities 2013, 31, 177–185. [Google Scholar] [CrossRef]
- Gilli, F. Sprawl or reagglomeration? The dynamics of employment deconcentration and industrial transformation in Greater Paris. Urban Stud. 2009, 46, 1385–1420. [Google Scholar] [CrossRef]
- Vega, A.; Reynolds-Feighan, A. Employment sub-centres and travel-to-work mode choice in the Dublin region. Urban Stud. 2008, 45, 1747–1768. [Google Scholar] [CrossRef]
- Duvernoy, I.; Zambon, I.; Sateriano, A.; Salvati, L. Pictures from the Other Side of the Fringe: Urban Growth and Peri-urban Agriculture in a Post-industrial City (Toulouse, France). J. Rural Stud. 2018, 57, 25–35. [Google Scholar] [CrossRef]
- Pili, S.; Grigoriadis, E.; Carlucci, M.; Clemente, M.; Salvati, L. Towards Sustainable Growth? A Multi-criteria Assessment of (Changing) Urban Forms. Ecol. Ind. 2017, 76, 71–80. [Google Scholar] [CrossRef]
- Bonifazi, C.; Heins, F. Testing the differential urbanisation model for Italy. Tijdschr. Econ. Soc. Geogr. 2003, 94, 23–37. [Google Scholar] [CrossRef]
- Haase, D.; Nuissl, H. The urban-to-rural gradient of land use change and impervious cover: A long-term trajectory for the city of Leipzig. J. Land Use Chang. 2011, 5, 123–141. [Google Scholar] [CrossRef]
- Díaz-Pacheco, J.; García-Palomares, J.C. Urban sprawl in the Mediterranean urban regions in Europe and the crisis effect on the urban land development: Madrid as study case. Urban Stud. Res. 2014, 2014, 807381. [Google Scholar] [CrossRef]
- Muñiz, I.; Galindo, A.; Angel Garcia, M. Cubic spline population density functions and satellite city delimitation: The case of Barcelona. Urban Stud. 2003, 40, 1303–1321. [Google Scholar] [CrossRef]
- Weber, C.; Puissant, A. Urbanisation pressure and modeling of urban growth: Example of the Tunis Metropolitan Area. Remote Sens. Environ. 2003, 86, 341–352. [Google Scholar] [CrossRef]
- Boussauw, K.; Van Meeteren, M.; Sansen, J.; Meijers, E.; Storme, T.; Louw, E.; Witlox, F. Planning for agglomeration economies in a polycentric region: Envisioning an efficient metropolitan core area in Flanders. Eur. J. Spat. Dev. 2018, 69, 1–26. [Google Scholar]
- Zambon, I.; Serra, P.; Grigoriadis, E.; Carlucci, M.; Salvati, L. Emerging urban centrality: An entropy-based indicator of polycentric development and economic growth. Land Use Policy 2017, 68, 365–371. [Google Scholar] [CrossRef]
- Colantoni, A.; Grigoriadis, E.; Sateriano, A.; Venanzoni, G.; Salvati, L. Cities as selective land predators? A Lesson on Urban Growth, (Un)effective planning and Sprawl Containment. Sci. Total Environ. 2016, 545, 329–339. [Google Scholar] [CrossRef]
- ESPON, European Spatial Planning Observation Network. Making Europe Open and Poly-Centric. Vision and Scenarios for the European Territory Towards 2050; European Union: Luxembourg, 2014. [Google Scholar]
- Kloosterman, R.C.; Musterd, S. The polycentric urban region: Towards a research agenda. Urban Stud. 2001, 38, 623–633. [Google Scholar] [CrossRef]
- Roy, A. The 21st-century metropolis: New geographies of theory. Reg. Stud. 2009, 43, 819–830. [Google Scholar] [CrossRef]
- Vasanen, A. Functional polycentricity: Examining metropolitan spatial structure through the connectivity of urban sub-centres. Urban Stud. 2012, 49, 3627–3644. [Google Scholar] [CrossRef]
- Salvati, L.; Carlucci, M.; Grigoriadis, E.; Chelli, F.M. Uneven dispersion or adaptive polycentrism? Urban expansion, population dynamics and employment growth in an ‘ordinary’ city. Rev. Reg. Res. 2018, 38, 1–25. [Google Scholar] [CrossRef]
- Delladetsima, P.M. The emerging property development pattern in Greece and its impact on spatial development. Eur. Urban Reg. Stud. 2006, 13, 245–278. [Google Scholar] [CrossRef]
- Leontidou, L. The Mediterranean City in Transition; Cambridge University Press: Cambridge, UK, 1990. [Google Scholar]
- De Muro, P.; Monni, S.; Tridico, P. Knowledge-Based Economy and Social Exclusion: Shadow and Light in the Roman Socio-Economic Model. Int. J. Urban Reg. Res. 2011, 35, 1212–1238. [Google Scholar] [CrossRef]
- Salvati, L. Urban expansion and high-quality soil consumption—An inevitable spiral? Cities 2013, 31, 349–356. [Google Scholar] [CrossRef]
- Salvati, L.; Venanzoni, G.; Carlucci, M. Urban growth and polycentric settlements: An exploratory analysis of socioeconomic and demographic indicators in Emilia Romagna, Italy. Ital. J. Appl. Stat. 2016, 26, 167–178. [Google Scholar]
- Zambon, I.; Serra, P.; Sauri, D.; Carlucci, M.; Salvati, L. Beyond the ‘Mediterranean City’: Socioeconomic Disparities and Urban Sprawl in three Southern European Cities. Geogr. Ann. B 2017, 99, 319–337. [Google Scholar] [CrossRef]
- Salvati, L. Agro-forest landscape and the ‘fringe’city: A multivariate assessment of land-use changes in a sprawling region and implications for planning. Sci. Total Environ. 2014, 490, 715–723. [Google Scholar] [CrossRef]
- Dura-Guimera, A. Population deconcentration and social restructuring in Barcelona, a European Mediterranean city. Cities 2003, 20, 387–394. [Google Scholar] [CrossRef]
- Biasi, R.; Colantoni, A.; Ferrara, C.; Ranalli, F.; Salvati, L. In-between Sprawl and Fires: Long-term Forest Expansion and Settlement Dynamics at the Wildland-Urban Interface in Rome, Italy. Int. J. Sustain. Dev. World Ecol. 2015, 22, 467–475. [Google Scholar] [CrossRef]
- Salvati, L.; Carlucci, M. The economic and environmental performances of rural districts in Italy: Are competitiveness and sustainability compatible targets? Ecol. Econ. 2011, 70, 2446–2453. [Google Scholar] [CrossRef]
- Salvati, L.; Mavrakis, A.; Serra, P.; Carlucci, M. Lost in translation, found in entropy: An exploratory data analysis of latent growth factors in a Mediterranean city (1960–2010). Appl. Geogr. 2015, 60, 107–119. [Google Scholar] [CrossRef]
- Di Feliciantonio, C.; Salvati, L. ‘Southern’ alternatives of urban diffusion: Investigating settlement characteristics and socioeconomic patterns in three Mediterranean regions. Tijdschr. Econ. Sociale Geogr. 2015, 106, 453–470. [Google Scholar] [CrossRef]
- Rontos, K.; Grigoriadis, S.; Sateriano, A.; Syrmali, M.; Vavouras, I.; Salvati, L. Lost in Protest, Found in Segregation: Divided Cities in the Light of the 2015 ‘Oki’ Referendum in Greece. City Cult. Soc. 2016, 7, 139–148. [Google Scholar] [CrossRef]
- Giannakourou, G. Transforming spatial planning policy in Mediterranean countries: Europeanization and domestic change. Eur. Plan. Stud. 2005, 13, 319–331. [Google Scholar] [CrossRef]
- Gospodini, A. Portraying, classifying and understanding the emerging landscapes in the post-industrial city. Cities 2006, 23, 311–330. [Google Scholar] [CrossRef]
- Gospodini, A. Post-industrial trajectories of Mediterranean European cities: The case of post-Olympics Athens. Urban Stud. 2009, 46, 1157–1186. [Google Scholar] [CrossRef]
- Guérois, M.; Pumain, D. Built-up encroachment and the urban field: A comparison of forty European cities. Environ. Plan. A 2008, 40, 2186–2203. [Google Scholar] [CrossRef]
- Serra, P.; Vera, A.; Tulla, A.F.; Salvati, L. Beyond urban-rural dichotomy: Exploring socioeconomic and land-use processes of change in Spain (1991–2011). Appl. Geogr. 2014, 55, 71–81. [Google Scholar] [CrossRef]
- Zitti, M.; Ferrara, C.; Perini, L.; Carlucci, M.; Salvati, L. Long-term Urban Growth and Land-use Efficiency in Southern Europe: Implications for Sustainable Land Management. Sustainability 2015, 7, 3359–3385. [Google Scholar] [CrossRef]
- Kourliouros, E. Planning industrial location in Greater Athens: The interaction between deindustrialization and anti-industrialism during the 1980s. Eur. Plan. Stud. 1997, 5, 435–460. [Google Scholar] [CrossRef]
- Turok, I.; Mykhnenko, V. The trajectories of European cities, 1960–2005. Cities 2007, 24, 165–182. [Google Scholar] [CrossRef] [Green Version]
- Ceccarelli, T.; Bajocco, S.; Perini, L.; Salvati, L. Urbanisation and Land Take of High-Quality Agricultural Soils—Exploring Long-term Land Use Changes and Land Capability in Northern Italy. Int. J. Environ. Res. 2014, 8, 181–192. [Google Scholar]
- Ferrara, A.; Salvati, L.; Sabbi, A.; Colantoni, A. Urbanization, Soil Quality and Rural Areas: Towards a Spatial Mismatch? Sci. Total Environ. 2014, 478, 116–122. [Google Scholar] [CrossRef] [PubMed]
- Leontidou, L. Alternatives to modernism in (Southern) urban theory: Exploring in-between spaces. Int. J. Urban Reg. Res. 1996, 20, 180–197. [Google Scholar] [CrossRef]
- Leontidou, L. Repolarization in the Mediterranean: Spanish and Greek cities in neoliberal Europe. Eur. Plan. Stud. 1995, 3, 155–172. [Google Scholar] [CrossRef]
- Carlucci, M.; Grigoriadis, E.; Rontos, K.; Salvati, L. Revisiting an Hegemonic Concept: Long-term ‘Mediterranean Urbanization’ in between city re-polarization and metropolitan decline. Appl. Spat. Anal. Policy 2017, 10, 347–362. [Google Scholar] [CrossRef]
- Schwarz, N. Urban form revisited: Selecting indicators for characterising European cities. Landsc. Urban Plan. 2010, 96, 29–47. [Google Scholar] [CrossRef]
- Garcia-López, M.A. Urban spatial structure, suburbanization and transportation in Barcelona. J. Urban Econ. 2012, 72, 176–190. [Google Scholar] [CrossRef] [Green Version]
- Couch, C.; Petschel-Held, G.; Leontidou, L. Urban Sprawl in Europe: Landscapes, Land-use Change, and Policy; Blackwell: London, UK, 2007. [Google Scholar]
- Corona, P.; Ascoli, D.; Barbati, A.; Bovio, G.; Colangelo, G.; Elia, M.; Lovreglio, R. Integrated forest management to prevent wildfi res under mediterranean environments. Ann. Silvicult. Res. 2014, 38, 24–45. [Google Scholar]
- Getimis, P. Comparing spatial planning systems and planning cultures in Europe. The need for a multi-scalar approach. Plan. Pract. Res. 2012, 27, 25–40. [Google Scholar] [CrossRef]
- Marchetti, M.; Vizzarri, M.; Lasserre, B.; Sallustio, L.; Tavone, A. Natural capital and bioeconomy: Challenges and opportunities for forestry. Ann. Silvicult. Res. 2015, 38, 62–73. [Google Scholar]
- Zambon, I.; Colantoni, A.; Carlucci, M.; Morrow, N.; Sateriano, A.; Salvati, L. Land quality, sustainable development and environmental degradation in agricultural districts: A computational approach based on entropy indexes. Environ. Impact Assess. Rev. 2017, 64, 37–46. [Google Scholar] [CrossRef]
- De Rosa, S.; Salvati, L. Beyond a ‘side street story’? Naples from spontaneous centrality to entropic polycentricism, towards a ‘crisis city’. Cities 2016, 51, 74–83. [Google Scholar] [CrossRef]
- Ioannidis, C.; Psaltis, C.; Potsiou, C. Towards a strategy for control of suburban informal buildings through automatic change detection. Comput. Environ. Urban Syst. 2009, 33, 64–74. [Google Scholar] [CrossRef]
- Morelli, V.G.; Rontos, K.; Salvati, L. Between suburbanisation and re-urbanisation: Revisiting the urban life cycle in a Mediterranean compact city. Urban Res. Pract. 2014, 7, 74–88. [Google Scholar] [CrossRef]
Figure 1.
Maps illustrating the administrative boundaries (municipalities) of the three study areas (left: Barcelona, middle: Rome, right: Athens).
Figure 1.
Maps illustrating the administrative boundaries (municipalities) of the three study areas (left: Barcelona, middle: Rome, right: Athens).

Figure 2.
Maps illustrating population density (inhabitants/km2) at the beginning (1961: left panel) and the end (2011: right panel) of the study period in Barcelona (left map in each panel), Rome (middle), and Athens (right).
Figure 2.
Maps illustrating population density (inhabitants/km2) at the beginning (1961: left panel) and the end (2011: right panel) of the study period in Barcelona (left map in each panel), Rome (middle), and Athens (right).

Figure 3.
Spatial distribution of the standardized residuals from a regression model (see Table 1) by year in Barcelona.
Figure 3.
Spatial distribution of the standardized residuals from a regression model (see Table 1) by year in Barcelona.


Figure 4.
Spatial distribution of the standardized residuals from a regression model (see Table 1) by year in Rome.
Figure 4.
Spatial distribution of the standardized residuals from a regression model (see Table 1) by year in Rome.

Figure 5.
Spatial distribution of the standardized residuals from a regression model (see Table 1) by year in Athens.
Figure 5.
Spatial distribution of the standardized residuals from a regression model (see Table 1) by year in Athens.

Figure 6.
Maps of the average standardized residuals from a regression model (see Table 1) for each municipality over the study period by city.
Figure 6.
Maps of the average standardized residuals from a regression model (see Table 1) for each municipality over the study period by city.

Figure 7.
Maps indicating the year with the highest standardized residual from a density-distance model for each municipality (regressions in Table 1), by city.
Figure 7.
Maps indicating the year with the highest standardized residual from a density-distance model for each municipality (regressions in Table 1), by city.


Table 1.
Basic characteristics of the three study areas.
| Variables | Barcelona | Rome | Athens |
|---|---|---|---|
| Land area (km2) | 7725 | 5382 | 3025 |
| Population density (inhabitants/km2), 1960 | 372 | 516 | 669 |
| Population density (inhabitants/km2), 2010 | 716 | 764 | 1249 |
| Annual population growth (%), 1960–2010 | 1.8 | 1.0 | 1.7 |
| No. Municipalities/spatial units | 311 | 235 | 115 |
Table 2.
Results of log-linear regression model (Equation (1)) for each investigated region with population density as the dependent variable and the distance of each spatial unit (municipality) from the respective inner city as the predictor (regression coefficients are all significant at p < 0.001).
| Year | Intercept | Slope | Adj-R2 | Intercept | Slope | Adj-R2 | Intercept | Slope | Adj-R2 |
|---|---|---|---|---|---|---|---|---|---|
| Barcelona | Rome | Athens | |||||||
| 1960 | 4.28(0.20) | −1.52(0.12) | 0.33 | 2.57(0.10) | −1.69(0.08) | 0.67 | 5.52(0.16) | −2.64(0.14) | 0.75 |
| 1970 | 5.05(0.22) | −1.98(0.14) | 0.40 | 2.56(0.11) | −1.66(0.08) | 0.63 | 5.85(0.16) | −2.80(0.13) | 0.79 |
| 1980 | 5.54(0.24) | −2.27(0.15) | 0.43 | 2.60(0.11) | −1.62(0.08) | 0.62 | 5.92(0.15) | −2.72(0.13) | 0.79 |
| 1990 | 5.78(0.24) | −2.40(0.15) | 0.47 | 2.58(0.10) | −1.56(0.08) | 0.61 | 5.84(0.14) | −2.54(0.12) | 0.79 |
| 2000 | 6.02(0.23) | −2.49(0.14) | 0.50 | 2.54(0.10) | −1.51(0.08) | 0.59 | 5.76(0.14) | −2.39(0.12) | 0.78 |
| 2010 | 6.19(0.23) | −2.54(0.14) | 0.51 | 2.59(0.10) | −1.45(0.08) | 0.60 | 5.76(0.14) | −2.36(0.12) | 0.77 |
© 2018 by the authors. Licensee MDPI, Basel, Switzerland. This article is an open access article distributed under the terms and conditions of the Creative Commons Attribution (CC BY) license (http://creativecommons.org/licenses/by/4.0/).
Share and Cite
MDPI and ACS Style
Mariani, F.; Zambon, I.; Salvati, L. Population Matters: Identifying Metropolitan Sub-Centers from Diachronic Density-Distance Curves, 1960–2010. Sustainability 2018, 10, 4653. https://doi.org/10.3390/su10124653
AMA Style
Mariani F, Zambon I, Salvati L. Population Matters: Identifying Metropolitan Sub-Centers from Diachronic Density-Distance Curves, 1960–2010. Sustainability. 2018; 10(12):4653. https://doi.org/10.3390/su10124653
Chicago/Turabian StyleMariani, Francesca, Ilaria Zambon, and Luca Salvati. 2018. "Population Matters: Identifying Metropolitan Sub-Centers from Diachronic Density-Distance Curves, 1960–2010" Sustainability 10, no. 12: 4653. https://doi.org/10.3390/su10124653
Note that from the first issue of 2016, this journal uses article numbers instead of page numbers. See further details here.