Effects of a Travel Behaviour Change Program on Sustainable Travel

1
Transport Department, Universitat Politècnica de València, 46022 Valencia, Spain
2
Social Psychology Department, Universitat de València, 46010 Valencia, Spain
*
Author to whom correspondence should be addressed.
Sustainability 2018, 10(12), 4610; https://doi.org/10.3390/su10124610
Submission received: 9 October 2018
/
Revised: 2 December 2018
/
Accepted: 3 December 2018
/
Published: 5 December 2018
(This article belongs to the Section Sustainable Transportation)
Abstract
:The main objective of the present study is to analyse the effect of a Travel Behaviour Change Program (TBCP) based on health improvement actions, in relation to a potential for an increase in walking and cycling, with reference to particular groups of people defined according to sociodemographics. A TBCP consisting of three persuasion actions based on health improvements was planned and executed in Valencia (Spain). A two-wave panel survey was used to study the effects of taking part in the TBCP. The panel survey collected data related to activity-travel scheduling process before and after the execution of the TBCP. To study the influence of participating in the TBCP, respondents were separated into two groups: those directly implicated in the TBCP and those who were not involved in any action (CG), which were formed on the basis of sociodemographic similarity. We developed descriptive and explanatory analyses and predictive models, to study the effect of the TBCP with reference to particular groups of people defined according to sociodemographics. Results indicate that being involved in the TBCP affects more males than females, those who share their household and do not live with their parents during weekdays, those with lower car availability, those willing to reduce car use and students. Several implications for research and transport policy are derived from these results.
1. Introduction
The extensive use of cars in urban areas significantly contributes to climate change, local air contamination, pedestrian accidents and cityscaping. Additionally, the habitual use of cars to carry out most daily trips results in physical inactivity, which augments the danger of many chronic illnesses such as coronary heart disease, type 2 diabetes and cancer of the colon [1]. Therefore, the promotion of the use of travel mode alternatives to cars, particularly cycling and walking, to carry out habitual trips, could have positive effects on reducing pollution, accidents and increase the health of citizens.
Interventions to promote the reduction of car use have been applied in the past decades. In particular, Travel Behaviour Change Programs (TBCP) usually include the so- call “soft” transport actions, which are based on giving information on transport alternatives, suitable support, motivation and disincentive programs for using the car [2,3]. The key characteristic of these actions is that they can possibly accomplish better cost-effective results in reducing car use and increasing walking or cycling.
Evaluations of TBCP based on soft transport actions like Personal Travel Planning (PTP), travel feedback programs and persuasion strategies, reported significant reductions of car use [4,5,6,7,8,9,10,11,12]. In contrast, other programs based on the use of incentives to promote a reduction of car use has not had success in the past [13,14].
On the other hand, the methods utilized to assess the success of soft transport actions to decrease the use of car and augment walking and cycling remains a topic of discussion among transport professionals and researchers [15,16]. The effect of some programs were studied using methods that did not permit statistical interpretations to be drawn from their outcomes. Besides, it is not common to use control groups to analyse travel behaviour change [17], which facilitates the identification of other causes of changes in travel behaviour, for example due to changes in season [18,19]. In addition, the use of intervention and control groups and a random allocation of participants to both groups is desired to reduce error variances. Lastly, it is uncommon to observe in the literature concerning this subject analysis methods different from descriptive ratios and explanatory statistics. Predictive models are essential to evaluate the effect of other variables.
This research focuses on the effect of TBCP on walking and cycling. These travel modes are usually called Active Travel (AT) modes in the Health and Transportation field ([20,21,22,23,24] European PASTA project—www.pastaproject.eu) but also in Transportation [25,26,27] and Geography studies [28,29].
The motivation of this research is to contribute to the field of design and evaluation of TBCP developing a study of the effect of participating in a specific TBCP implemented in Valencia, Spain, which included persuasion actions based on health improvements, on observed AT. The novelties of this study are twofold: it includes not only descriptive and explanatory statistics but also predictive models; and it is carried out with reference to particular groups of people defined according to sociodemographic characteristics.
This paper is organized as follows: next section includes a Literature Review. Section 3 establish the Research Objectives and Hypotheses of this study. Section 4 presents a description of the Methodology used in this research, including a description of the executed TBCP, the characteristics of the data collection survey, a description of participants and control group, the definition of the dependent and explanatory variables and the methods of data analysis. The Results of descriptive and explanatory analysis and predictive models, are presented in Section 5. And Discussion and conclusions are summarize in Section 6.
2. Literature Review
2.1. Soft Transport Measures to Increase Active Travel
The soft transport measures included in this literature review are based on several models of behaviour and theories of change: Theory of Planned Behaviour [30], Norm Activation Model [31], Value-Belief-Norm [32], Theory of Interpersonal Behaviour [33], Social Learning Theory [34], theories re-elaborated in the transportation field by Bamberg and Schmidt [35], Bamberg et al. [36], Bamberg and Moser [37], Gärling and Fujii [38]; Transtheoretical Model [39,40], Self-Regulated Theories [41], Implementation Intention [42], theories of change re-elaborated and integrated with models of behaviour in the transportation field by Bamberg et al. [43] and Bamberg [44,45].
There are several approaches to develop TBCP based on soft transport measures. Most of them are inspired by two popular and widespread TBCPs: Indimark® and Travel Blending®. Indimark® [46] tries to set out individualized marketing of public transport, walking and cycling to individuals by providing tailored information. On the other hand, Travel Blending® [47] attempts to raise awareness on people on their travel patterns and then offers them viable changes to reduce possible unnecessary or wasteful travelling. PTP actions, travel feedback programs and persuasion strategies are part of those programs.
TBCP based on PTP actions are extensively reviewed in the literature. Chatterjee [5] studied the effectiveness of eight large-scale, residential-based PTP projects in England. He found an average reduction of 11% in car driver trips and an average increase of 3 percentage points in walking and 1 percentage point in cycling. In Italy, Meloni et al. [8] tested PTP in the context of a project to motivate drivers to use park-and-drive. After the implementation of the plan, a reduction of 10% in one-person car trips was achieved. Bamberg and Rees [4] reported a recent study of the effects of PTP using random control groups. They found a reduction of car use between 0.01 and 11.2 percentage points and an increase in public transport use between 4.0 and 13.1 percentage points. Friman et al. [6] and Skarin et al. [7] revised 32 PTP programs in Sweden. They found a reduction of car use by 22% in seven of these programs and an average increase of 36% in public transport use. They also reported results of programs aimed at increasing bicycle use, with an average raise of 43% in bicycle trips.
Similarly, travel feedback programs developed in Japan are reviewed by Fujii and Taniguchi [9]. Results of the application of these programs include reductions of CO2 emissions by around 19% and car use by nearly 18%, while augmenting public transportation use by approximately 50%.
On the other hand, Fujii and Kitamura [13] and Thøgersen and Møller [14] described similar studies in Kyoto and Copenhagen, in which one-month free tickets for public transport were delivered to a group of habitual drivers. While the intervention took place, those in the experimental group used the bus more than those in the control group. However, this increase disappeared after the intervention period.
Persuasion strategies were used by Seethaler and Rose [12] in a pre-intervention phase. A green bag and a voucher were used as incentives. And an announcement letter that was prepared using persuasion principles. They achieved an increase of 2.3 times on willingness to participate compared with the use of a traditional recruitment method.
Finally, Lucken et al. [48] recently implemented a TBCP based on providing parents with information about the health and academic benefits of AT to school for their children. They analysed the influence on parents perception of AT feasibility and found no significant effect.
2.2. Assessing the Effectiveness of Soft Transport Measures
Proper evaluation of the implementation of soft transport measures requires at least the following characteristics: the existence of intervention and control groups, with a random composition (RCT) and a minimum sample size that permit to detect significant statistical differences on the use of travel modes; to carry out at least a before-and-after panel survey; and to develop not only descriptive and explanatory statistics of the data collected to identify statistically significant effects of participating in the TBPC but also predictive models that permit to control for the effect of other variables.
Many program’s designs lack adequate control groups (CGs) to evaluate travel behaviour change. Failure to define a CG may make it impossible to determine if there are underlying travel behaviour changes that need to be factored into the changes measured within the target population. CGs should be a subset of the same population as the sample, facing identical transport options and encountering the same external pressures of changes in the socio-political landscape that could affect travel. They should provide an indication of how target individuals/households would have behaved in the absence of a TBCP (Stopher et al. 2009). In case there is no CG, program designs just use pre- and post-tests of participants behaviour, which cannot exclude the influence of changes in travel behaviour that may occur within the general population, for example due to changes in season, travel or fuel costs, public transportation service, or roadway construction [18,19].
The composition of intervention and control groups is an issue of a recent debate. It is argued that Random Control Trials (RCT), in which participants are randomly assigned to either the treatment or the control group, are required to evaluate the effects of intervention programs. This is why the review by Arnott et al. [49] only included studies that used schemes that they evaluated as ‘robust’, that is, RCT-based studies such as Cluster Randomized Controlled Trials or Controlled Before-and-After studies. But it is challenging to accomplish a random assignment in practice when panel surveys are used, mostly due to abandons of participants. Consequently, quasi-experimental investigations are adequate, assuming that there is a statistical control of the differences between intervention and control groups [4].
Before-and-after panel surveys, in which the same individuals provide information regarding the characteristics of their travel behaviour before and after the implementation of a TBCP, are better than repeated cross-sectional samples, because it is easier to identify significant effects using information provided by the same people over time [26]. Recent examples of the utilization of before-and-after panel surveys to evaluate TBCP interventions are Hsieh et al. [50], Sunio et al. [51] and Meloni et al. [8]. On the other hand, there are some studies that included panels consisting on one survey before and two or more survey waves after the implementation of the TBCP, which facilitates the identification of medium-long term effects [52,53].
Finally, most of the evaluation studies of the effects of TBCP on travel behaviour only included data analysis based on descriptive and explanatory statistics. The use of t-statistics, effect size metrics likes Cohen’s d or h and other explanatory statistics allow the researcher to identify significant effects of participating in TBCP. But only using predictive models (e.g., econometric choice models) it is possible to uncover new causal mechanisms and new measures, thus adding scientific value. Additionally, the results of predictive models can suggest improvements to existing explanatory models. And predictive models can serve as a “reality check” to the relevance of theories [54]. A few studies found in the literature that evaluate the effect of TBCP on travel mode use utilized predictive models but they did not find significant effects [14,48], they did not used control groups [8], or they did not use travel behaviour data before and after the implementation of the intervention [14]. Mutrie et al. [53] mentioned in their paper that they used logistic regressions to study the effects of a TBCP to promote AT to work but they did not detail the results of this analysis.
Only two studies found in the literature used predictive models to evaluate the effect of TBCP on travel mode use, finding significant effects, using control groups and data collected before and after the implementation of the program [52,55]. But none of them focused on analysing different effects, considering the sociodemographic characteristics of the individuals. The present study fills this gap in the research literature regarding evaluation of TBCP.
3. Research Objectives and Hypotheses
The literature review shows that there are very few studies that rigorously evaluate the effect of participating in TBCPs based on soft-transport actions, on the use of alternative travel modes to car. The main objective of our study is to apply a sound evaluation methodology that is based on: designing proper intervention and control groups; carrying out a before-and-after panel survey; and analysing the data collected in both survey waves using predictive models. Furthermore, the evaluation of the effect of participating in the TBCP is focused on identifying differences according to several sociodemographic characteristics of the participants.
Using a TBCP based on persuasion strategies can be a cost-effective measure to encourage drivers to use less their cars and increase active travel. To prove this statement, persuasion strategies were defined to overcome particular psychological barriers to change travel behaviour. These barriers were previously identified among a group of drivers who voluntarily participated in the experiment.
There is no evidences in the literature of studies that detect different effects of participating in TBCPs based on soft-transport actions according to sociodemographic characteristics. We hypothesize that being a woman, having car availability, to be employed and living with family are associated to a lower tendency of being influence by the program. Woman usually have a more complex activity-travel behaviour [56], so that if they decide to use car it is more difficult to convince them to change to other travel modes. Car availability is a deterrence of using public transport and active travel. To be employed and living with family impose a less flexible activity-travel agenda that makes travel behaviour change harder [11].
4. Methodology
This section describes data collection and analysis methods used to carry out this research. The design of the panel survey to collect travel behaviour data before and after the implementation of the TBCP is described in Section 4.1. Section 4.2. defines how volunteers were split into participants in the TBCP and control group. The theoretical framework in which the TBCP is based, the pre-study that was carried out to identify psychological barriers to change travel behaviour and the description of the actions included in the TBCP to help participants to overcome those barriers and reduced their car use, are described in Section 4.3. The variables of the study are defined in Section 4.4. And the methods of analysis are determined in Section 4.5.
4.1. Panel Survey
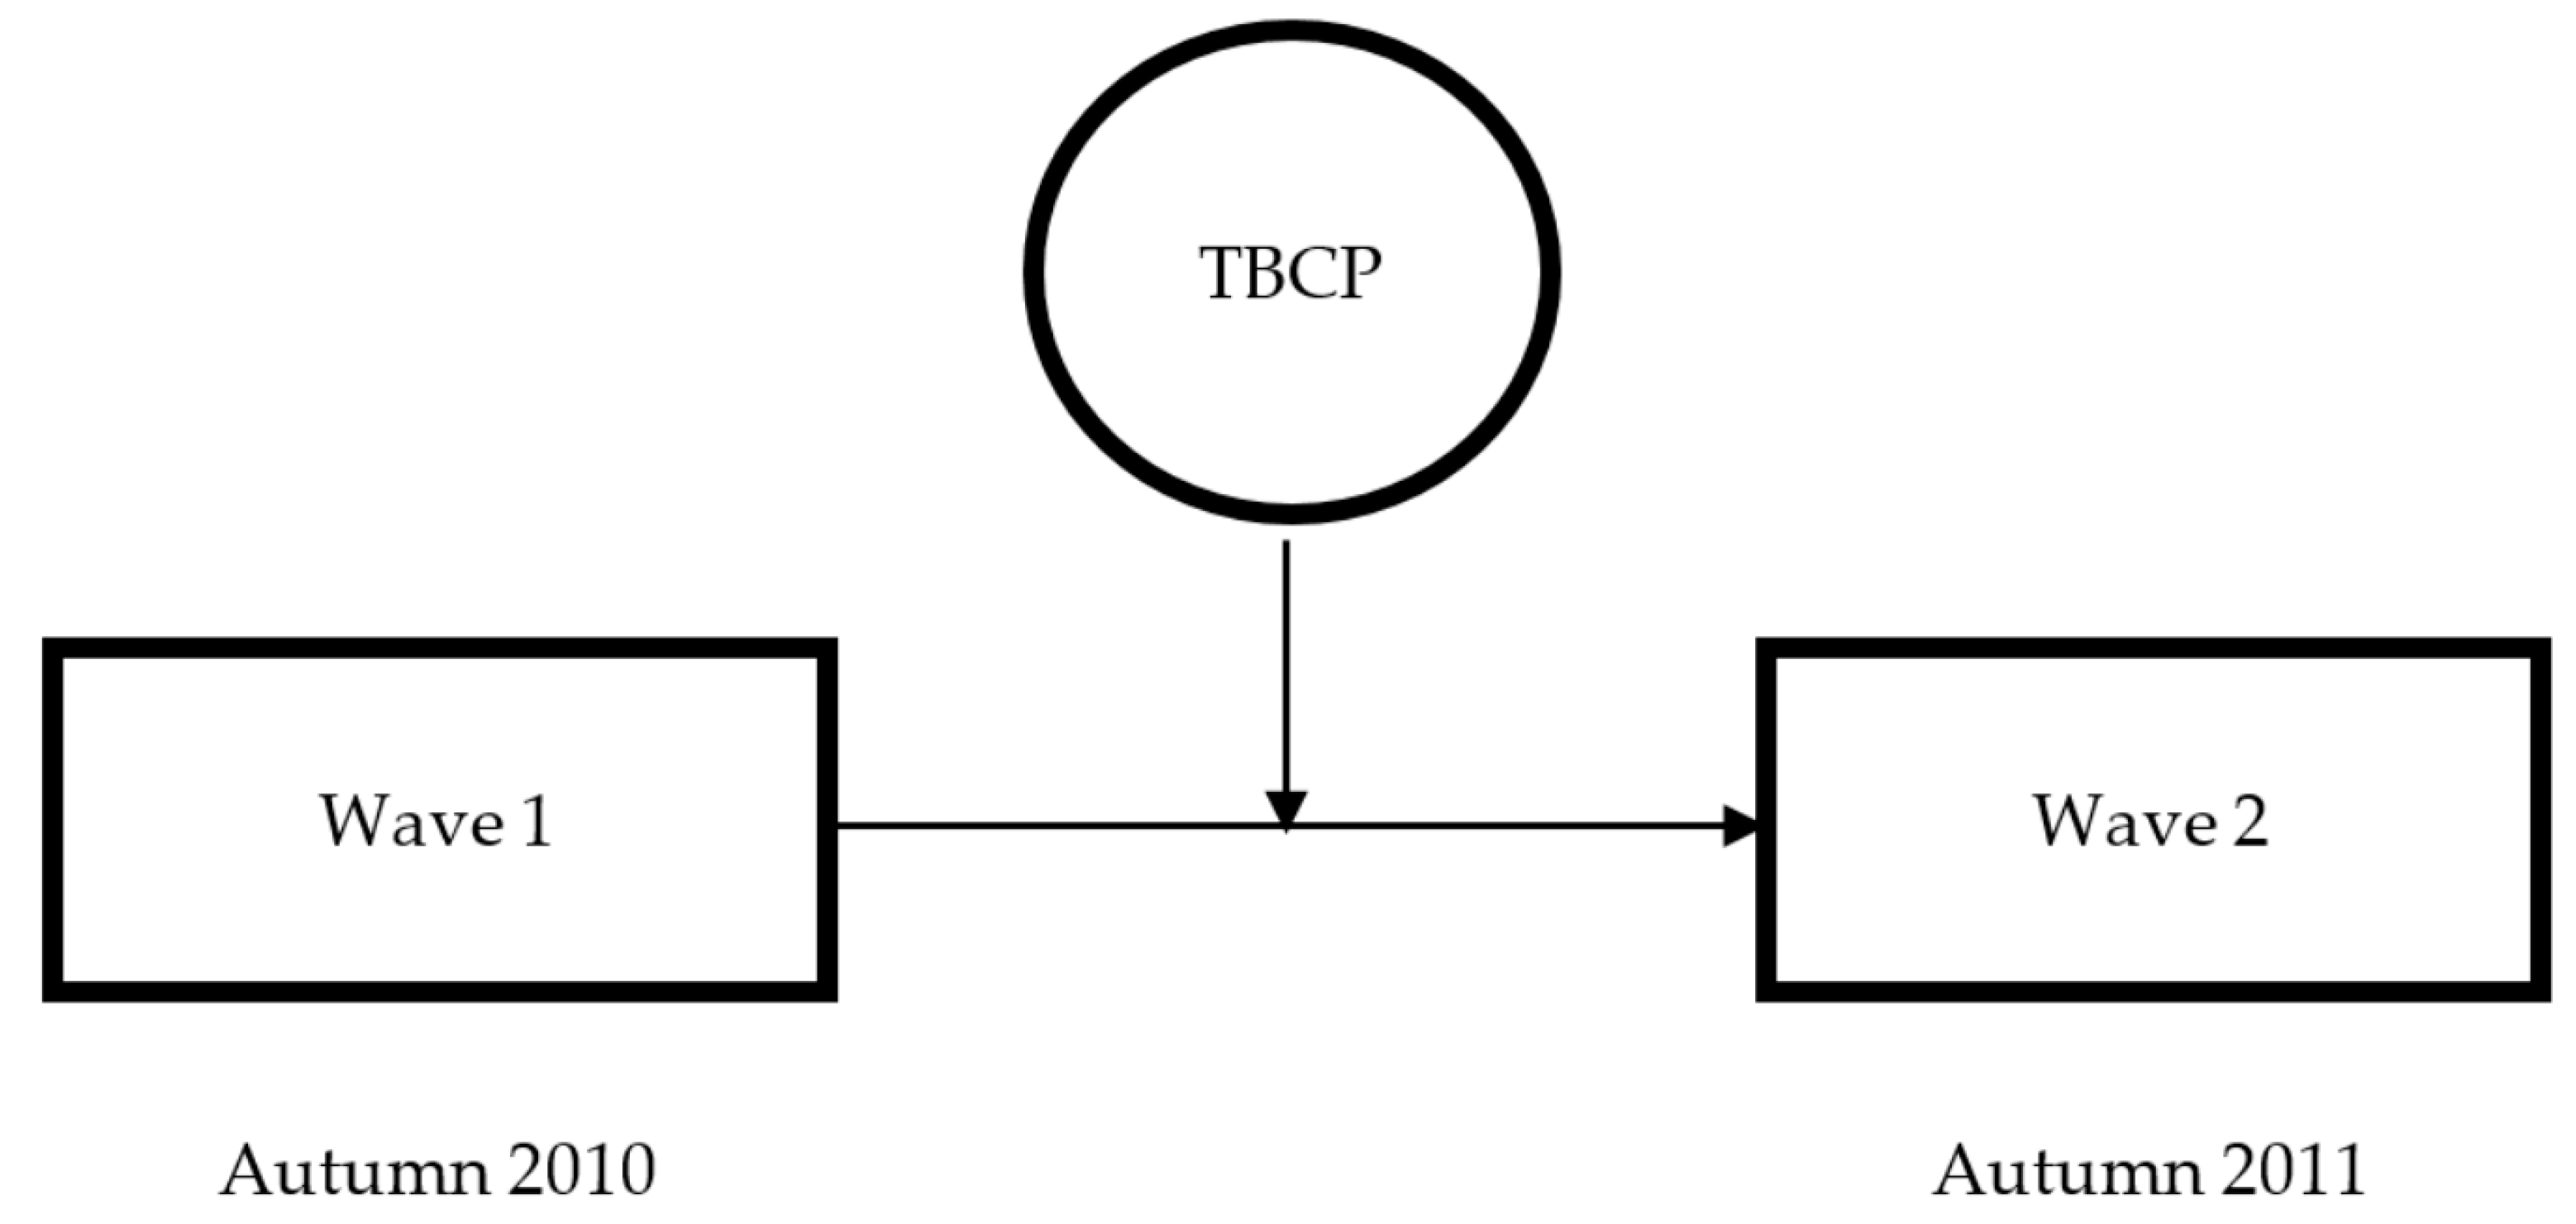
A panel survey that gathered activity scheduling process data, was implemented in the city of Valencia (Spain) over a period of one year [10]. The general objective of this survey was to analyse the potential effect of a TBCP on activity-travel scheduling process decisions. The panel survey consisted of two waves, which took place during autumn of 2010 and 2011 respectively (Figure 1). Actions comprised in the TBCP described later were executed between both waves.
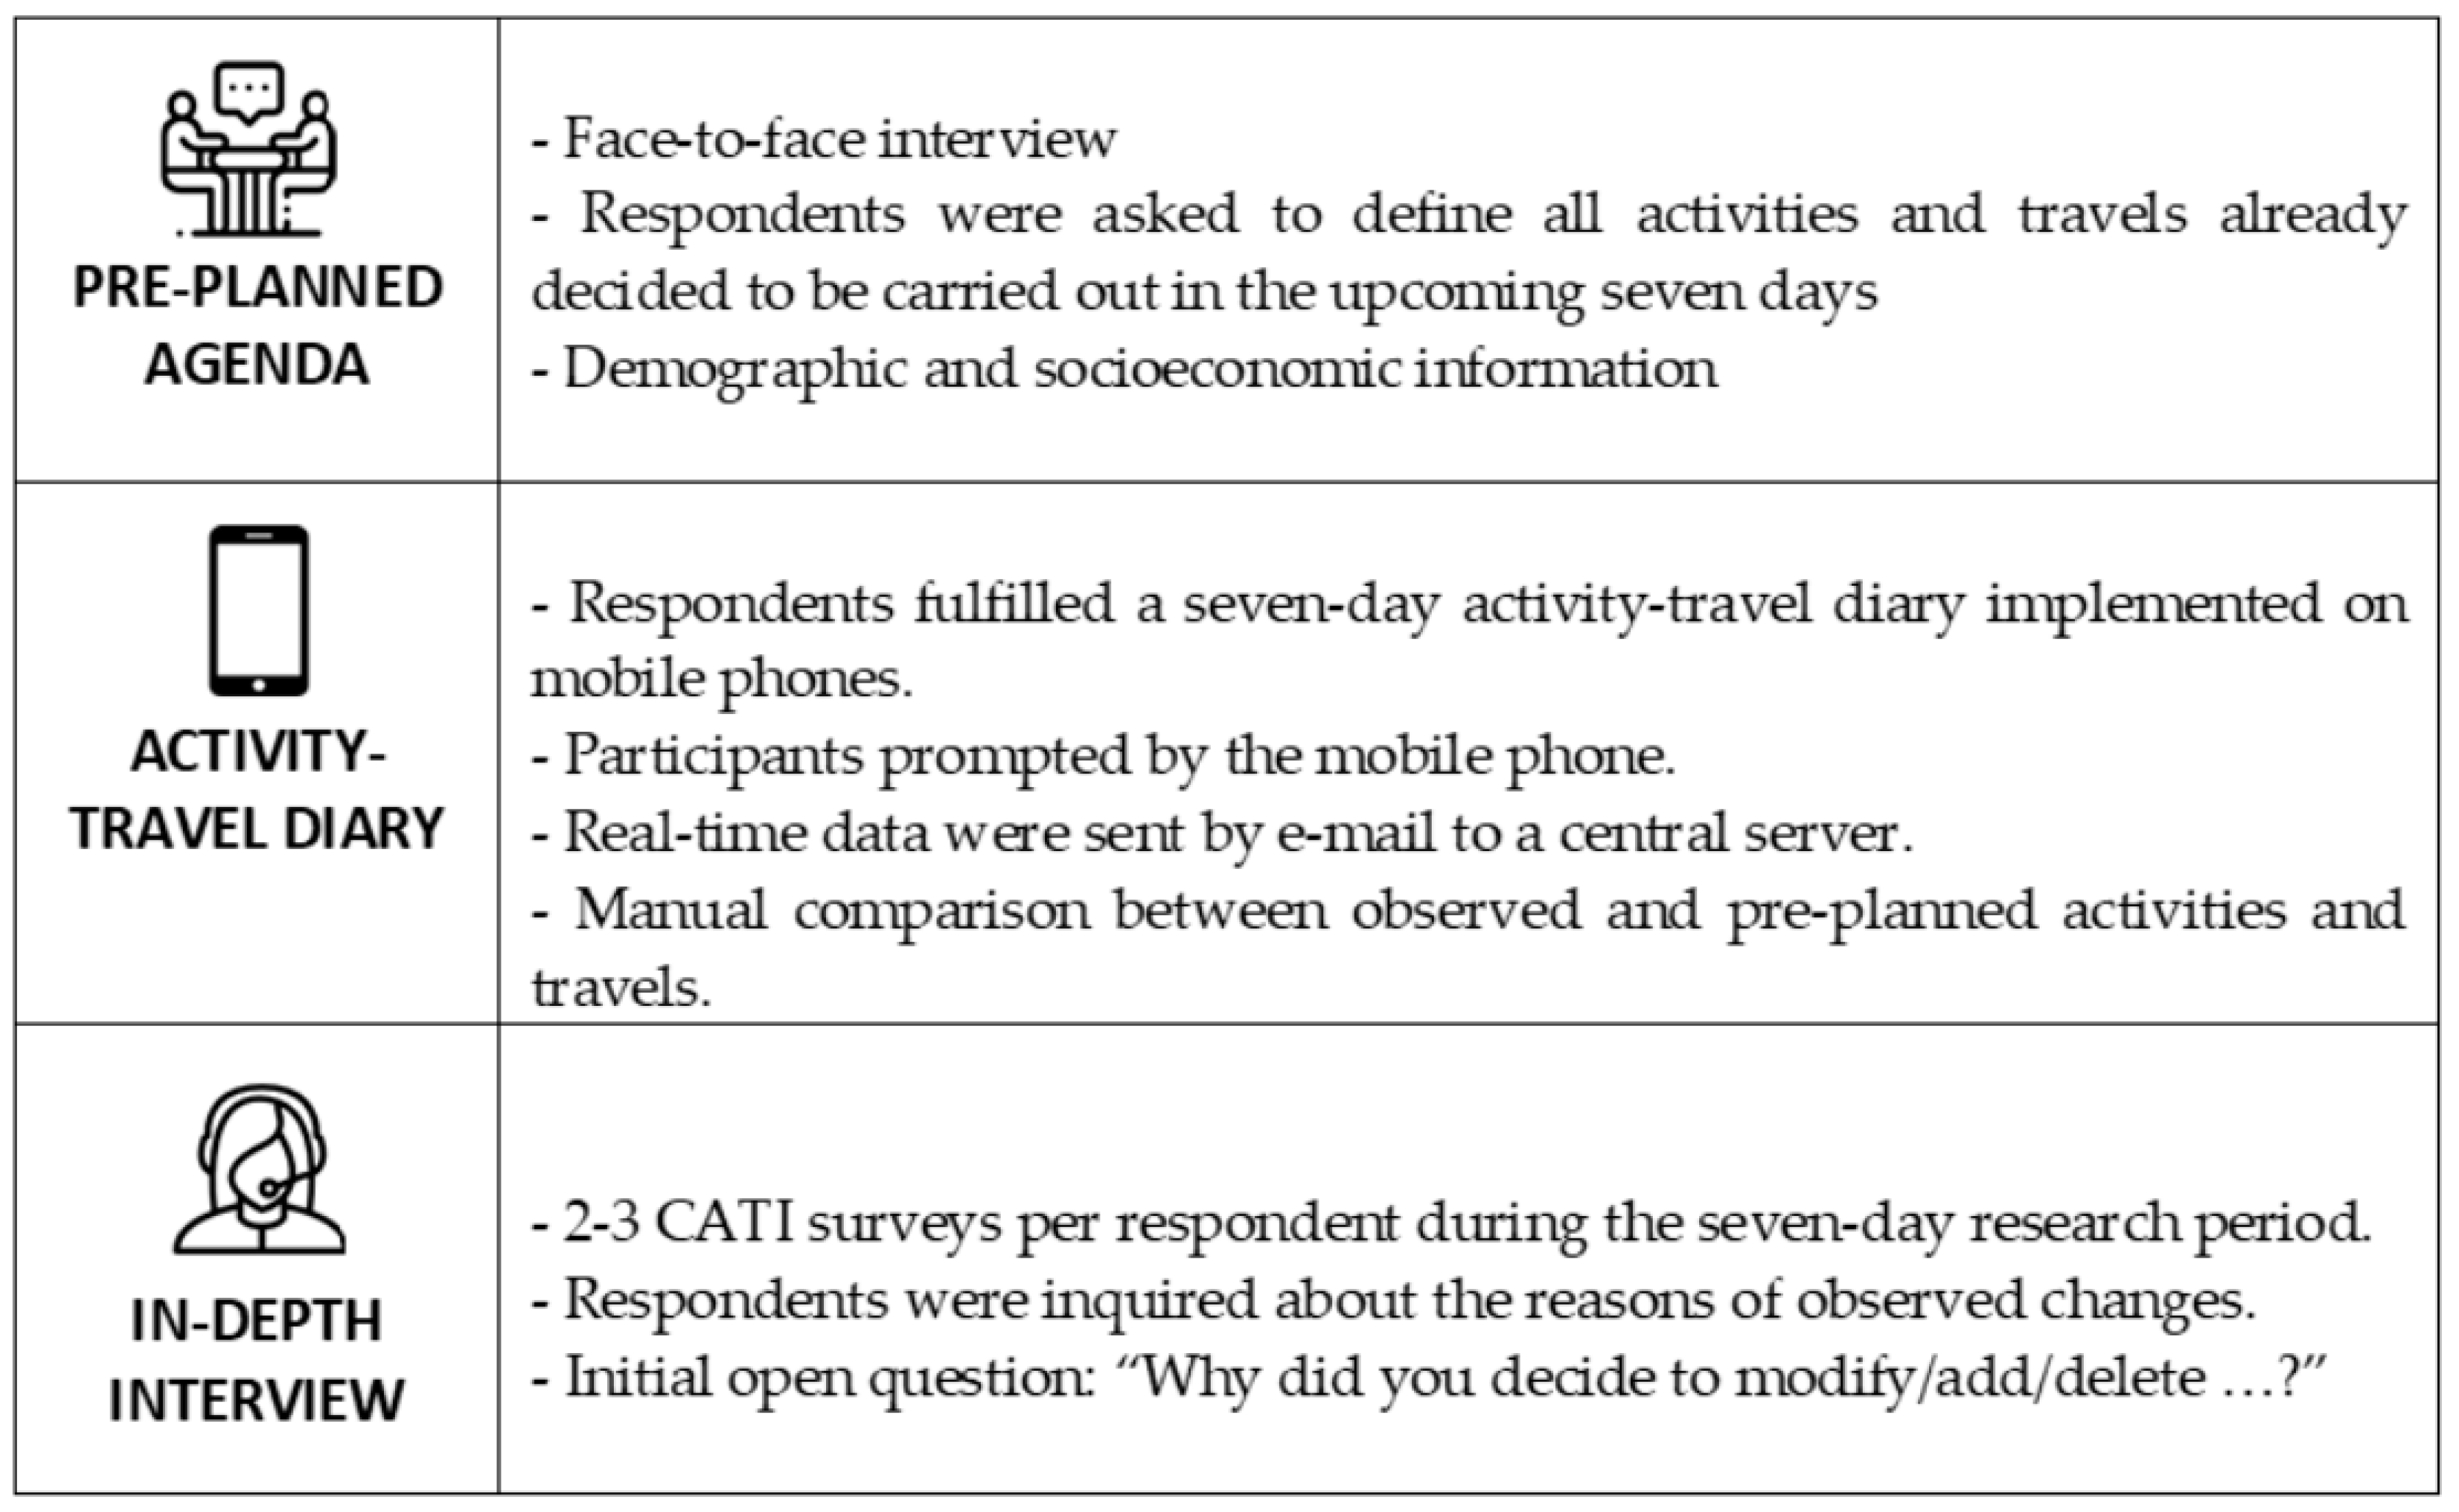
The survey consisted of three stages, which were similar in both waves (Figure 2). The first stage was a personal meeting where participants were asked to pre-plan an activity-travel agenda for the following week using paper and pencil.
Then, throughout the research week, participants provided the characteristics of activities and travels performed using diaries implemented in mobile phones, which were lent to them at the end of the first stage.
In the third stage, in-depth telephone interviews were carried out during the week. Respondents were contacted by phoned several times and were asked to give motives for the alterations detected when their pre-planned and performed activity-travel agendas were compared.
4.2. Participants and Control Groups
The universe of the study was drivers with residence in Valencia (Spain). The number of individuals who accepted to be involved in the panel survey when they took part in another study a year before were 492, for whom willingness or intention to diminish the use of car was not a pre-requisite for participation. Thus, the effect of being involved in the TBCP would not be overestimated.
Valid information (completed activity-travel diary and questionnaire on sociodemographic characteristics) was obtained from 165 respondents in the first survey wave, that being 33.5% of those who firstly specified their willingness to contribute. Those who provided valid information in the first travel survey wave were divided into two groups: the participating or intervention group (TBCP) and the control group (CG). Initially, 85 and 80 individuals were assigned to the TBCP and the CG, respectively. Both groups were formed ensuring that the distributions of gender, age and occupation were equal. As described earlier, it is difficult to achieve a RCT when using panel surveys, because attrition always caused a loss of representativity of the sample. Besides, a true experimental design was not desirable in this case, because the relatively low sample size would have caused underrepresentation of students and the 50+ age group in the two groups. This would have made difficult to undertake the type of analysis presented in this paper. When participants are not assigned randomly to either the treatment or the control groups, we have a quasi-experimental design, which is acceptable if the differences between both groups are statistically controlled [9].
After the first survey wave, 47 respondents left the panel due to a variety of reasons, which represents a dropout rate of 29%. The characteristics of respondents who integrated the TBCP and CG groups are shown in Table 1, which reflects a normal and predicted attrition that occurred between the first and the second survey waves. There are some differences according to gender. Although the two groups are still similar according to activity status and age. Furthermore, they are also similar according to willingness to change travel behaviour: in both groups nearly 75% of participants were willing to reduce their car use (TBCP = 70.8%, CG = 76.1%, t-test for two-independent samples was not statistically significant, t(108) = 1.024, p = 0.310).
4.3. Travel Behaviour Change Program
4.3.1. Theoretical Framework
Three soft actions based of persuasion strategies were designed and implemented to overcome several psychological barriers to travel behaviour change, which form part of those classified by Anable et al. [57]. They established this classification using the four quadrant of Ken Wilber [58] as a basis and integrating different theories that link attitudes to behaviour, to explain the decision-making process. The most influencing theories are the Theory of Planned Behaviour [30] and the Social Learning Theory [34]. Within the framework of TPB, attitudes, norms and Perceived Behavioural Control (PBC) influence intention, which in turn affects behaviour. In this context, psychological barriers to travel behaviour change associated to PBC, Instrumental Attitudes (IA) and Affective Attitudes (AA) were identified.
On the other hand, the SLT contemplates that people can learn by observing others, in addition to learning by participating. Individuals are most likely to model behaviour observed by others they identify with. In this context, psychological barriers to travel behaviour change associated to Self-Identity and Status were distinguished.
A pre-study was carried out to identify the psychological barriers to changing travel behaviour. The results of the pre-study were used to define the actions to promote travel behaviour change. An explanation of the pre-study, the results obtained and a description of the actions are included below.
4.3.2. Pre-Study
A questionnaire was carefully prepared and tested to evaluate the individual subjective factors related to barriers to changing travel behaviour mentioned earlier. It was comprised of twelve sections including questions defined using a variety of formats (Likert scales, yes/no and open and closed-ended questions) that best suited the factor to be evaluated (Table 2). The questionnaire was sent to participants who gave valid information in the first wave of the panel travel survey (see Section 4.2) by ordinary and electronic mail. As a result, 125 valid responses were received out of the 165 participants who provided valid information in the first survey wave.
PBC was evaluated by asking participants how possible it was to perform a particular travel behaviour. Results indicated a low capacity to adapt to other travel modes (for example walking, cycling or use of public transportation). On the other hand, Instrumental Attitudes (IA) measured the degree to which a person had a positive or negative assessment of carrying out a particular act relating to motives such as time, cost and convenience. In this case, results indicated negative attitudes towards travel time by public transport and active modes.
AA try to measure the positive utility associated with using a particular travel mode, referring to feelings related to travelling, such as anxiety, enthusiasm, pleasure, tedium and control. As expected, we found that feelings associated with cars are in general those of comfort, adaptability, freedom and privacy, although respondents acknowledge that using a car is not safe. The AA of respondents towards bike use and walking cited freedom of mobility, privacy and relaxation.
Studying the ways in which people perceive themselves in society with respect to different travel behaviours helped us to design actions to improve the Self-identity and Status of transport modes that offer alternatives to car. We included some questions asking respondents about the differences between them and a cyclist or a pedestrian. Results indicated that cyclists and pedestrian were perceived as healthier people and having more time available.
4.3.3. Description of the Actions
García-Garcés et al. [11] and Ruiz and Garcia-Garcés [10], described the actions included in the TBCP, which were designed based on psychological principles of persuasion [12,59]. The actions were aimed at helping participants to overcome psychological barriers to changing travel behaviour, which were previously identified. The theoretical rationales behind the persuasion strategies selected to overcome them are explained below.
To overcome PBC and negative IA and AA, we used the persuasion principles of reciprocation and scarcity. The Principle of Reciprocation is based on the ability of confident comportment (e.g., presents, favours, assistances, concessions) to elicit confident comportment in response [60]. The effect increases if the incentive is given upfront and unconditionally, in line with the Theory of Reactance [61]. The Principle of Scarcity is based on the fact that as chances become fewer, they are recognized as more appreciated [62]. Social psychology advises to use negative message enclosing for the support of pro-environmental behaviour [63]; the emphasis of losses as a result of indecision rather than the savings because of action.
Taking all this into account, we designed and implemented Action 1 as a service given to participants. The mobility of respondents was studied and frequent trips were identified. A sustainable alternative travel mode was looked for, which accommodated the characteristics of one of the identified trips. Materials prepared to be sent to respondents included information regarding the physical losses associated to little walking and cycling alongside the damaging influence on health of long-term car use. Estimates of accidents and emissions caused by car use was also calculated for each case. All this information was included in a report that was sent by ordinary mail to participants, which also incorporated general information concerning public transport available in their neighbourhoods.
To strengthen Self-Identity and Status related to active travel modes, we based Action 2 on the Principle of Authority, which states that when making a choice, it is usual to search for expert guidance from a recognized source [64]. Participants were asked to attend a speech given by a cardiologist and a sports trainer, who talked about how general health can be improved by walking and cycling more. The attendants were reminded that although the benefits of regular physical activity are well known, few people act on the information. The following general information regarding the health benefits of active travel behaviour was provided:
- -
- A reduction of 50% of the risk of suffering a heart disease
- -
- A reduction of 50% of the risk of suffering adult diabetes
- -
- A reduction of 50% of the risk of suffering obesity
- -
- A reduction of 30% of the risk of suffering hypertension
The Principles of Social Proof and Liking were used to define Action 3, which also attempted to improve Self-Identity and Status. The Principle of Social Proof is based on the fact that opinions, attitudes and acts of like-minded persons are used as principles for one’s own opinions, attitudes and behaviour [65]. The Principle of Liking states that people are more motivated to follow a demand offered by someone of comparable attitudes [66], education [67], appeal [68] or fashion sense [69]. Action 3 involved asking participants to watch a short film in which individuals who had recently decreased their use of car were questioned about why they had made that decision. We selected those answers that were most related to health issues to be shown to the participants. For example:
- -
- “From the time when I started riding my bike to travel, I have not required to go to the gym or go out running for keeping fit. Also, I find it calming and it lets me economize.”
- -
- “When I gave up work, I started to use the bus. The different lines offered let me liberty of movement through Valencia. I also walk a lot, because it helps me to stay thin.”
4.4. Dependent and Explanatory Variables
In this study, the particular influence of participating in the TBCP on the use of the most sustainable travel modes (walking and cycling) is analysed. The level of use of AT modes in both survey waves has been studied for each panellist as the average time allocated to travel in AT per day in relation to the average total time allocated to travel per day. García-Garcés et al. [11] studied the level of use of private vehicle using a similar dependent variable. Consequently, the dependent variable is the proportion:
The data was analysed in disaggregate format. The ratio AT/Total was computed for each individual and each day of the week, in each survey wave. Therefore, initially we had a total of 118 × 7 × 2 = 1652 person-days and 6898 trips.
Strong outliers in the data were detected through the analyses of frequency distribution of time spent travelling per person-day for each mode. We employed the common rule that dictates that a data point is a strong outlier if it is more than 3 times above the third quartile or below the first quartile (for simple outliers, 1.5 times is used). Expressed differently, low strong outliers are below q1 − 3 × (q3 − q1) and high strong outliers are above q3 + 3 × (q3 − q1). As a result, person-days with total time spent travelling lower than one minute were discarded. The higher threshold was different depending on the travel mode. A total of 1476 person-days and 6609 trips were available.
Explanatory variables include trip characteristics and socio-demographics variables (Table 3). Some explicative variables were not binary coded because an increasing value of the code has a meaning. An additional explanatory variable is willingness to reduce car use. Contrary to the common strategy in TBCP implemented elsewhere, inclination to diminish the use of car was not a requisite for participants to be included in the investigation.
4.5. Methods of Analysis
Descriptive and explanatory analyses, including frequency distribution, Cohen’s D and ANOVA were carried out in order to explore the differences of AT/Total ratio among both groups (TBCP and CG).
On the other hand, with the aim of correcting the potential sample selection bias caused by panel attrition, the Heckman two-step procedure [70] is used. This predictive model has been applied in an analogous way elsewhere, for example, to study the effect of unemployment insurance benefits on workers’ re-employment wages [71]. First, a Probit model is used to evaluate the likelihood of participating in the TBCP or CG group (Equation (1)) and the outcomes are saved to be used in the following step of the model (selection equation). Second, a regression with selection is used conditionally on the first step evaluation (Equation (2)). Treatment effects are measured by including the estimated likelihood to be involved in the TBCP (Equation (1)) as an independent variable of the estimated proportion AT/Total (Equation (2)) and utilizing all data to fit this later model. Following Greene [72] we have:
zit* = αi′wit + uit zit = 1(zit* > 0), uit ~ N [0, 1]
yit = βi′xit + γizit + εit εit ~ N [0, σ2]
(εit,uit) ~ N [(0, 0), (σ2, 1, ρσ)], Corr[εit,uit] = ρ
Random coefficients are used in both equations. The main reason to use random coefficients is to consider individual heterogeneity in the coefficients of the models. For instance, the general form of αi as a random coefficient is:
where α0 is the mean of the coefficient, which is fixed and common to all participants, while σ is the standard deviation of the coefficient and vi a normally distributed term.
αi = α0 + σ vi
Applying the difference-in-differences method [73], a double-way interaction variable is defined as period x treatment to capture the change in the ratio AT/Total of those who were involved in the TBCP. To study the influence of being involved in the TBCP, we transform Equation (2) as:
where ai designates those who were involved in the TBCP and wt specifies when the TBCP were applied (wave 2). Both μ1 and μ2 represent the parameters related with the variables ai (main effects of the treatment) and wt (period variable), respectively. The value η denotes the estimated parameter of the variable aw (interaction term between these two variables), which captures the influence of being involved in the TBCP.
yit = βi’xit + γizit + μ1ai + μ2wt + η(aw)it + εit
Lastly, to evaluate the effects of being involved in the TBCP considering the sociodemographics of the participants, we introduce a new three-way interaction variable (period × treatment × sociodemographic characteristic considered):
where, D represents the sociodemographic characteristic considered, η1, η2 and η3 represent the lower order effects. η4 designates the parameter associated with the three-way interaction variable awD (treatment, period and the characteristics considered). Sociodemographics considered are gender, household role, where respondents live during weekdays, car availability, and willingness to reduce car use and education level.
yit = βi’xit + γizit + μ1ai + μ2wt + η1(aw)it + η2(aD)it + η3(wD)it + η4(awD)it + εit
5. Results
5.1. Descriptive and Explanatory Analyses
Table 4 presents the average time that participants in the TBCP and CG groups spent travelling per day in each mode before (Wave 1) and after (Wave 2) the implementation of the actions. Interestingly, participants in the TBCP group spent an average of 8.3 min per day using AT modes before (wave 1) and 12.3 min after (wave 2) the implementation of the actions. The counterpart figures in CG decreases from 11.3 min to 10.0 min.
Table 5 displays the difference of the ratios “Travel time (by each mode)/Total travel time” between survey waves. This difference is calculated for participants in the TBCP and CG groups and for each travel mode. The results of the difference are expressed in percentage points (arithmetic difference of two percentages) and in percentage. It is remarkable that participants in the TBCP group present a positive difference of the ratio for AT modes of +4.9 percentage points and +52.6%. The counterpart figures in CG are negative: −1.6 percentage points and −11.9%.
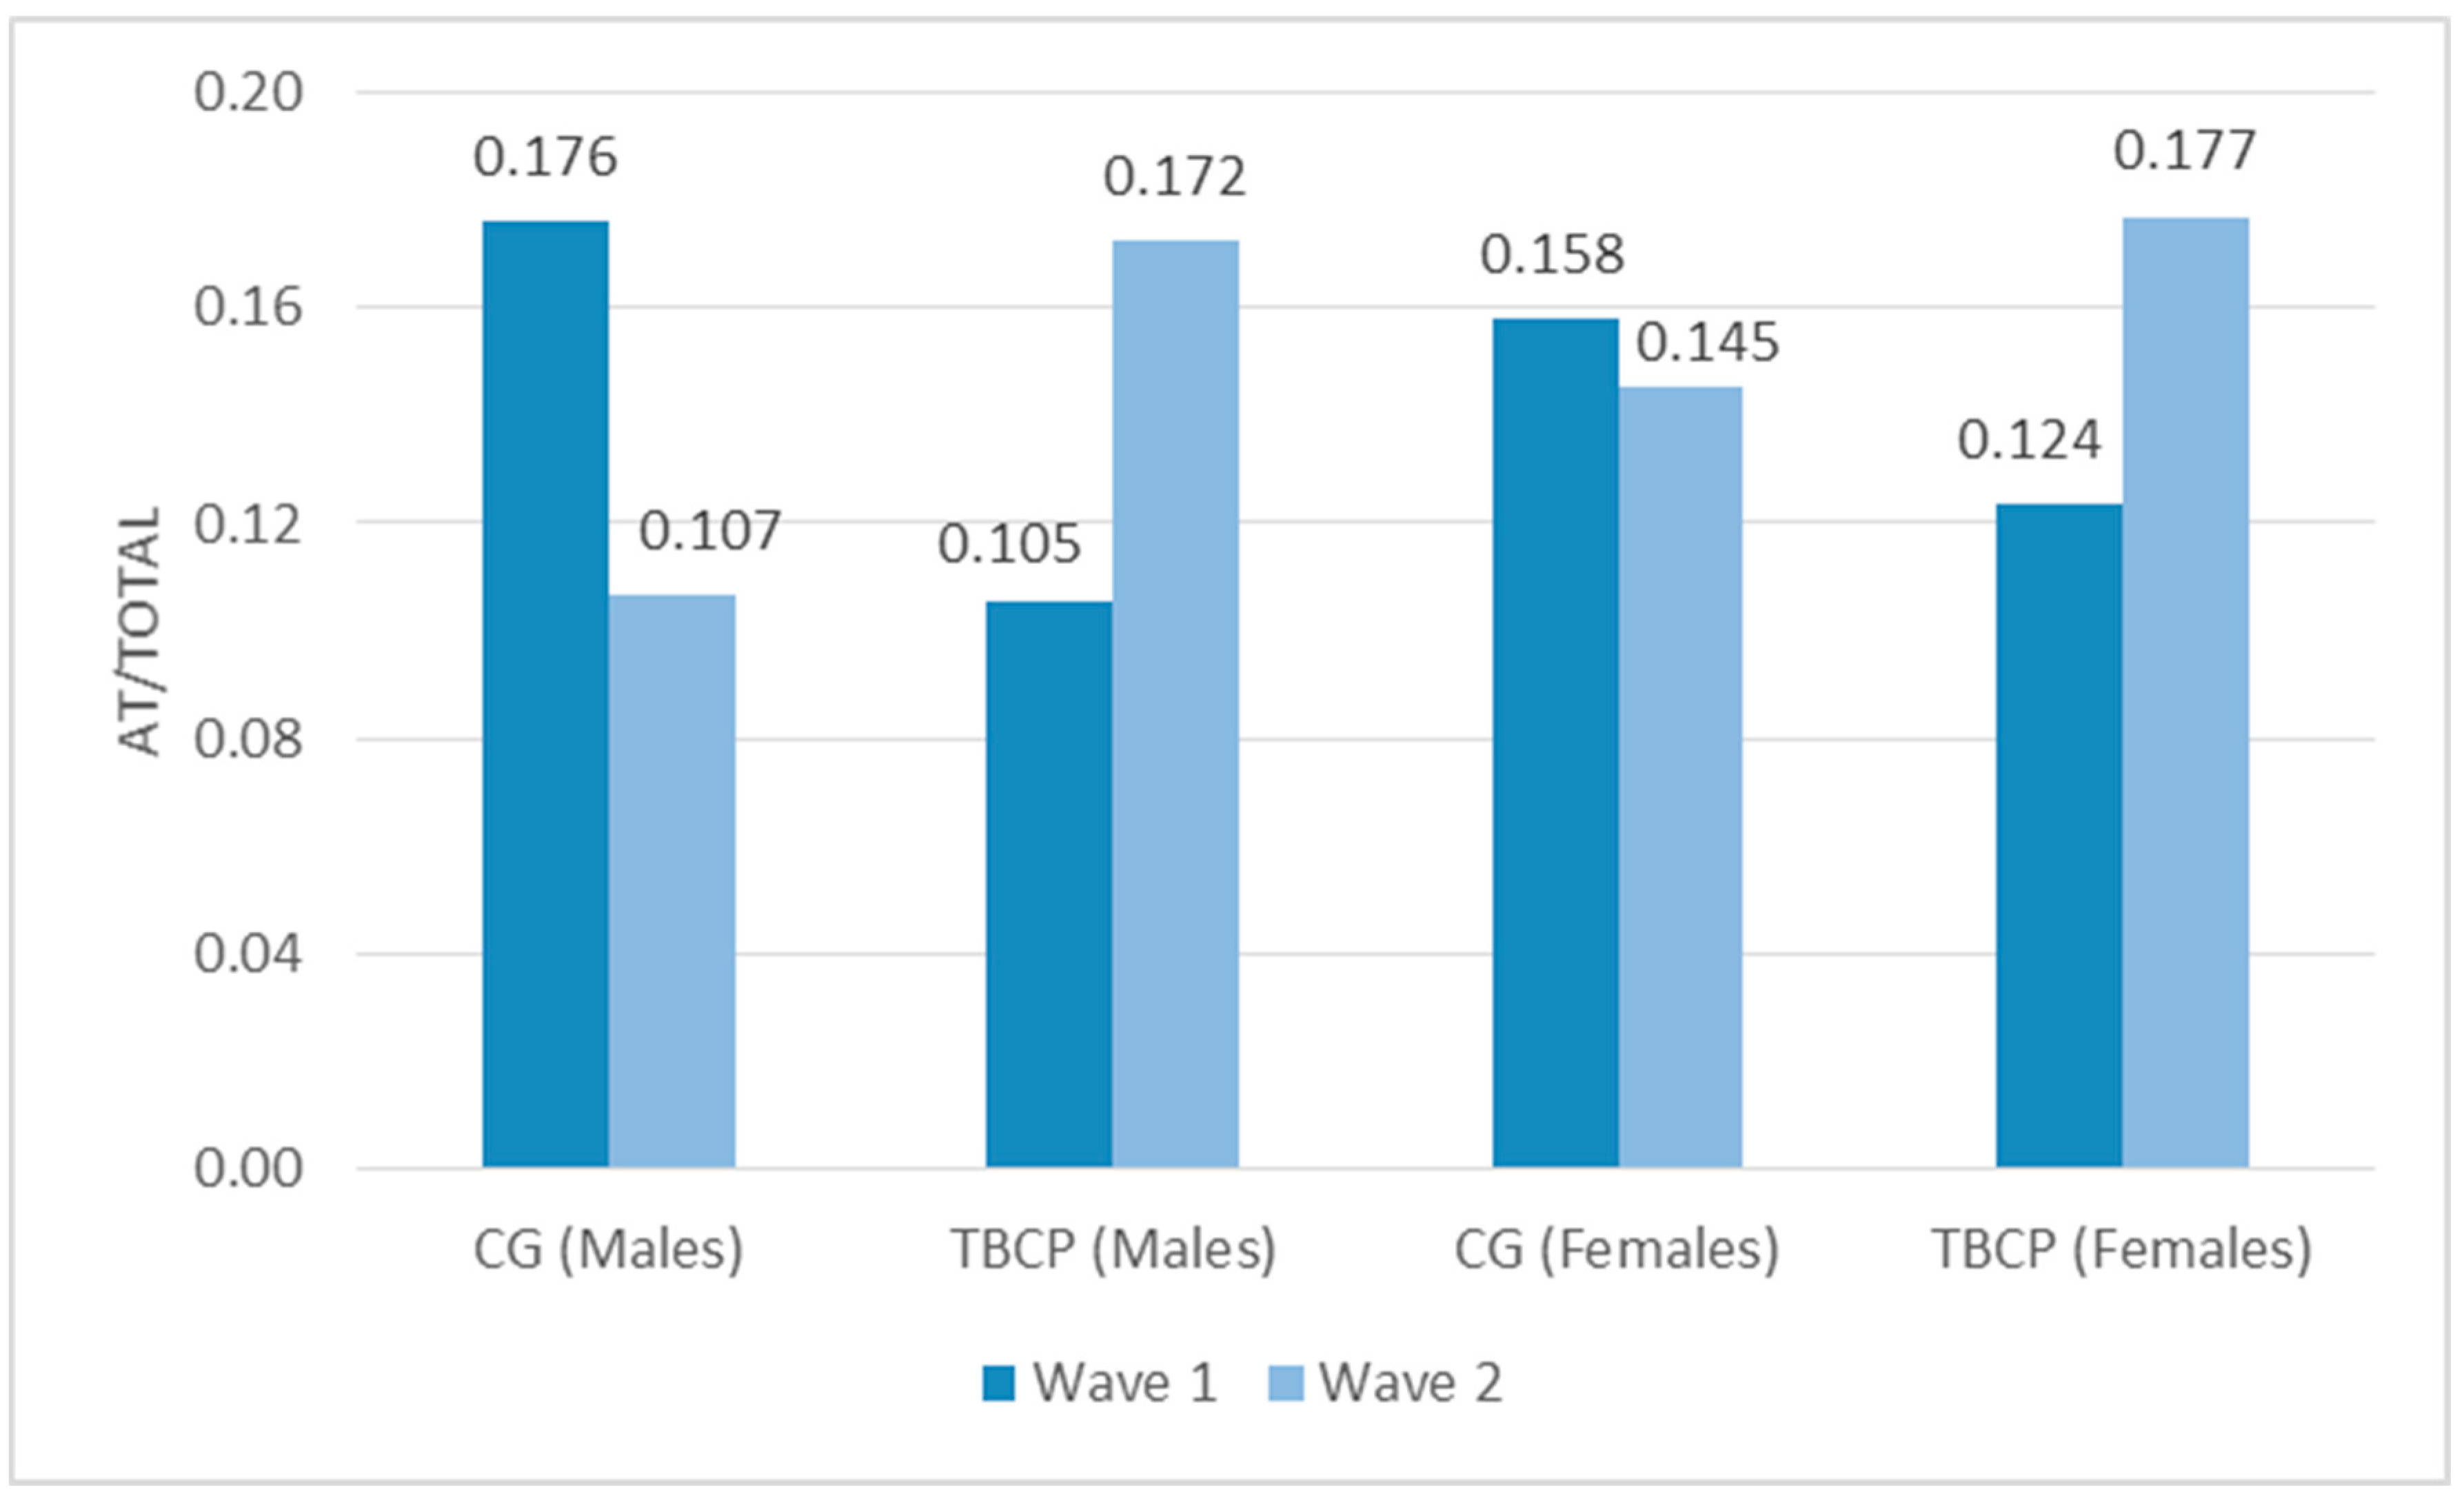
The ratio AT/Total is lower in wave 2 compared with the wave 1 for males who were not involved in the TBCP (Figure 3). In contrast, those males who participated in the TBCP augment their ratio in wave 2. Females in the CG slightly decrease their ratio of time allocated to travel by AT. On the other hand, those females who participated in the TBCP increase their ratio as well.
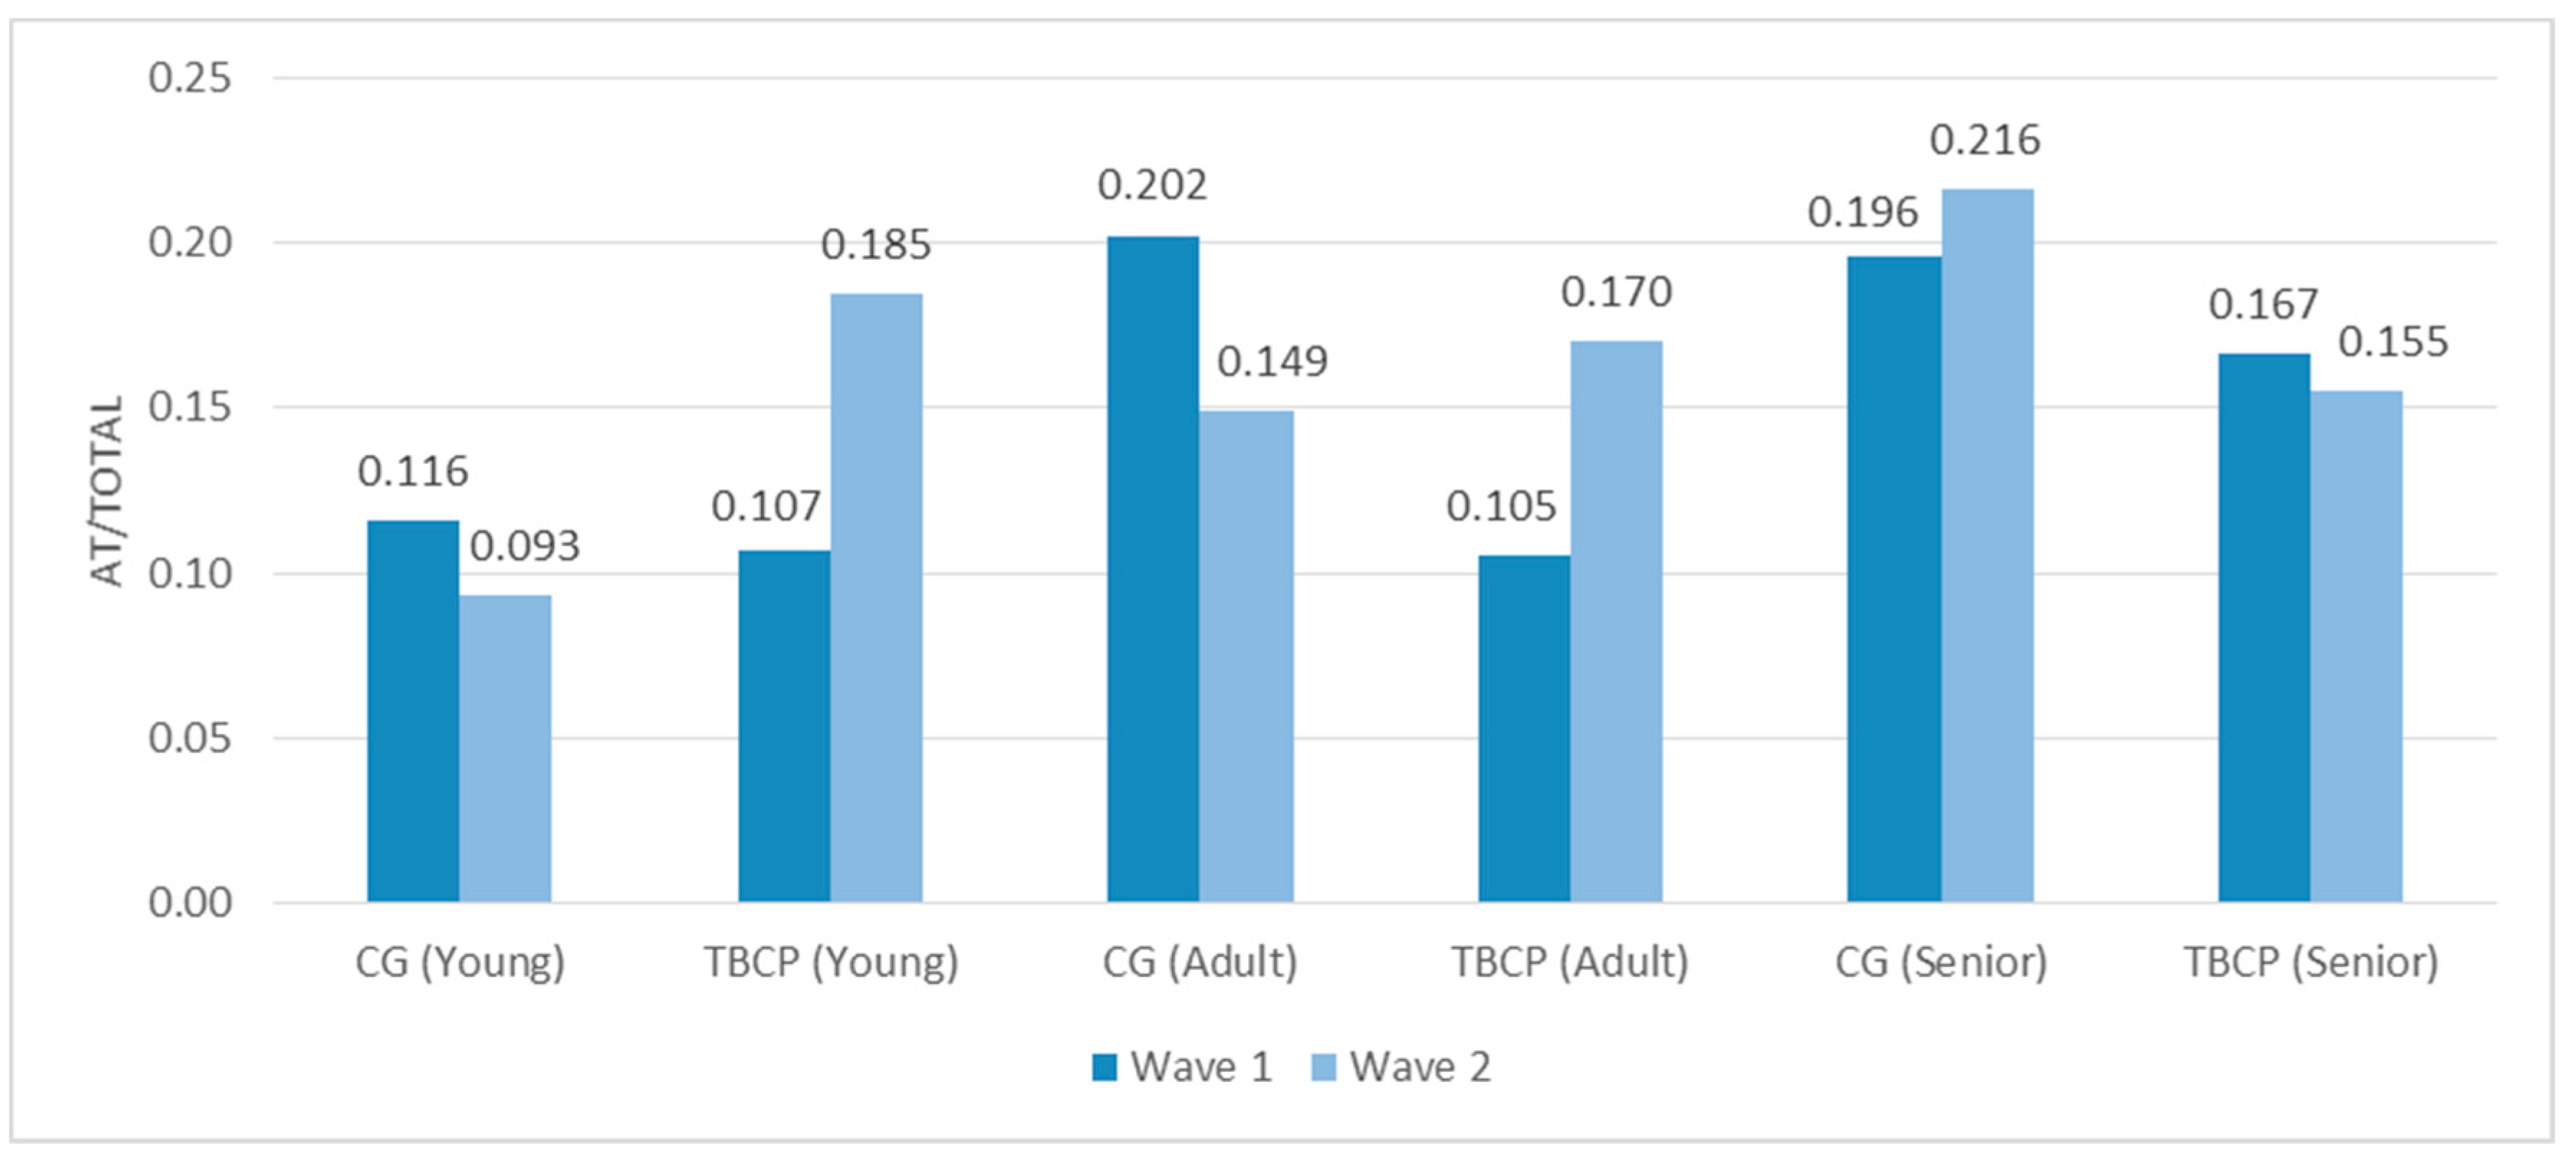
The ratio AT/Total decreases in wave 2 compared with wave 1 for those younger than 50 who were not included in the TBCP (Figure 4). In contrast, those younger than 50 who were included in the TBCP augment the proportion AT/Total. The evolution of the time allocated to travel by AT for those older than 50 is atypical due to the small sample size.
Table 6 presents, for each demographic and socioeconomic variable, the ratio AT/Total and the results of the statistics two-way ANOVA and Cohen’s d effect size. These statistics estimate the effect of being involved in the TBCP comparing the ratios for those who participated in the TBCP and those who did not. A value of Cohen’s d greater than 0.5 and statistically significant F values at 95% confidence level indicate that participating in the TBCP had an effect on males, youngers and adults, singles, those with primary and secondary studies, those who do not live with their family during weekdays and students.
5.2. Predictive Models
Maximum likelihood method is used to estimate the models using Nlogit software [73]. Variables whose estimated coefficients present level of significance worse than 0.10 are excluded from the model. Although in the second step of the model this general rule is not applied: parameters of the main and two-way interaction effects are retained in the models for the reason that they are required to properly estimate the parameter associated with the three-way interaction variable.
Outcomes from the models are summarized in Table 7 and Table 8. Table 7 shows that the ρ coefficients are significantly different from zero. This denotes that the assumption of no selection bias effect is rejected for all models. Consequently, the models are suitable to avoid biased estimation of the parameters. Furthermore, sample selectivity is corrected because in the models’ specification there is one variable (DAY) included in the selection equation that it is not included in the regression equation [74]. Results of the two-step models are presented below. Analysis is focused on results of the second step, which are the objective of this study.
5.2.1. First Step
Table 7 presents results of the first step of the model. Parameters with a positive sign are related with a higher probability for the participant to be involved in the TBCP and give data in wave 1 and wave 2. All estimated parameters are very significant. Bearing in mind that coefficients are normally distributed, we can conclude that estimated scale coefficients can be considered as standard deviations. The specification for unobserved heterogeneity works well, because significance is achieved in nearly all standard deviations. Considering the signs of the estimated parameter, those who travel on weekends, travel more, adults, men, larger household size and single, are more likely to be involved in the TBCP.
5.2.2. Second Step
Models 1 to 6 in Table 8 present estimated coefficients of the regression equation that allow for differences in several socio-demographic characteristics and takes into account potential sample selection bias. Low values of R-squared estimates are found. Analogous outcomes can be found in other studies that use disaggregated travel behaviour data [75,76,77] and more recently in Clark et al. [78], Liu et al. [79], De Vos et al. [80] and Mao et al. [81].
The variables of interest in the models presented in Table 7 are those that measure the two-way (period and treatment) and three-way interactions (period, treatment and the sociodemographic characteristic considered). The first one evaluates the effect on those who were involved in the TBCP compared to those in the CG. Similarly to the first step, coefficients are normally distributed, therefore estimated scale coefficients can be considered as standard deviations. In this case, the specification for unobserved heterogeneity works partially well, because significance is achieved in only some standard deviations.
Interesting implications are associated to the results obtained. Positive coefficients are estimated for variables that measure the two-way interaction (period and treatment). This result suggests that being involved in the TBCP is associated with an augment of AT use.
A negative coefficient is estimated in Model 1 for the variable that measures the interaction among period, treatment and gender. This result indicates that being involved in the TBCP may positively affects more males than females. In general, women use cars less than men. However, women who are habitual drivers are more difficult to convert to other travel modes. Women usually perform activities that are less flexible in terms of schedule, duration and so forth, when driving a car than when walking or cycling, which may explain this result.
In contrast, a positive coefficient is estimated in Model 2 for the variable that measures the interaction among period, treatment and respondent living in a shared house. This effect indicates that those living in a shared house have a more flexible travel behaviour, which may be explained by the fact that they have fewer household obligations.
A negative coefficient is estimated in Model 3 for the variable that measures the interaction among period, treatment and respondents living with their parents during weekdays. This result suggests that those respondents who do not live with their parents during weekdays are more affected by participating in the TBCP. This finding could be connected to the previous one, because those who do not live with their parents during weekdays (typically students), usually share a house.
A negative coefficient is also estimated in Model 4 for the variable that measures the interaction among period, treatment and car availability. This result suggests that the higher the car availability, the lower the tendency to walk or use bicycle more if the respondents participate in the TBCP. This is in line with the fact that a lower car availability forces people to become familiar with other travel modes. Therefore, it is logical that they are more easily affected by being involved in the TBCP.
Regarding Model 5, a positive coefficient is estimated for the variable that measures the interaction among period, treatment and willingness to reduce car use. Logically, this finding suggests that those respondents who are willing to reduce their car use are more likely to do it if they participate in the TBCP.
Finally, a positive coefficient is also estimated in Model 6 for the variable that measures the interaction among period, treatment and being a student. This finding suggests that participating in the TBCP has a greater effect on students, which is logical because students usually have less car availability and they are used to look for travel alternatives.
6. Discussion and Conclusions
6.1. Discussion
The aim of this study is to analyse the effect of participating in a TBCP based on health improvements has on AT. Different effects depending on several demographic and socioeconomic characteristics of the respondents have also been analysed.
Information collected in a panel survey of usual car drivers carried out in Valencia (Spain) has been used to evaluate the influence of a TBCP implemented in that city. A group of panellists were involved in several actions based on health improvements to persuade them to increase walking or cycling. The rest of the panellist formed the CG. The composition of the groups was based on sociodemographic similarities.
The psychological travel behaviour change barriers that have been identified among the participants in our research, form part of those classified by Anable et al. [57]. She established this classification using the four quadrant of Ken Wilber [58] as a basis and integrating different theories that link attitudes to behaviour, to explain the decision-making process. In this research we have considered the Theory of Planned Behaviour [30] that explore the attitude-behaviour gap and the framework of the Social Learning Theory [34].
Descriptive and explanatory analyses have been developed to prove that being involved in the TBCP had a positive effect on AT. Additionally, the use of predictive models that account for sample selection in panel data and include treatment effects and random parameters have confirmed the statistically significant influence of being involved in the TBCP on increasing AT. The application of this predictive model permitted us to find that the influence of being involved in the TBCP is different depending on the gender of the respondents, if they share a house, or live with their parents during the weekdays, car availability, willingness to reduce car use, and labour status.
The present study has two limitations: size and sample characteristics and the number of survey waves after the execution of the TBCP. It is necessary to replicate the present study enrolling a larger number of participants, which would allow the study of the influence of each persuasion action separately. Moreover, it would also be suitable to have a more varied sample, particularly including participants over 50 years old. On the other hand, more survey waves after the execution of the TBCP would allow the analysis of medium and long term effects of being involved in the TBCP.
6.2. Transport Policy Implications
The findings of this study confirm the importance of informative campaigns regarding the health benefits of walking and cycling and the long-term drawbacks of intensive use of car associated not only with health but also with safety and urban space. These preceding campaigns increase the effectiveness of TBCP based on persuasion strategies.
This study also corroborates that “soft” and “hard” measures have synergies that should be exploited. In particular, hard measures that negatively influence car availability (e.g., increased costs of car use through taxes, toll roads, etc.) should be combined with subsequent TBCP based on persuasion strategies.
When designing and implementing TBCP, policy makers should pay more attention to males and students. To specifically target these groups, universities and high schools are good places to implement TBCPs. In the latter case, students cannot have driving license yet (at least in Spain) but the actions could be designed to foster the use of public transport, walking and cycling. The health benefits of walking and cycling could be highlighted at school and universities through the routine monitoring of blood sugar and blood pressure, the results of which could be incorporated into game and competition strategies to encourage the use of AT.
Actions that include detailed and personalized information regarding travel alternatives and closer locations to carry out certain activities, could be more effective to people with less personal commitments.
6.3. Contributions of This Study and Future Work
Studies that use predictive (e.g., econometric) models, analyse the effect of TBCP using before-and-after panel data and have a participating and a control group properly defined, plus controlling for sociodemographic characteristics, are very scarce in the literature. In particular, the advantages of using predictive models are, among others: the potential to uncover new causal mechanisms and new measures thus adding scientific value; they can suggest improvements to existing explanatory models; and they can serve as a “reality check” to the relevance of theories [62].
García-Garcés et al. [11] analysed only the second survey wave of the same dataset used in the present research. The objective of their analysis was to study the influence of being involved in the TBCP on reducing the proportion of time spent using private vehicle. They used a Tobit model as a predictive method of analysis. Recently, Arroyo et al. [55] have studied both survey waves of the same dataset, with the same objective as in the previous study but using different predictive econometric model. In that case, they identified how the influence of being involved in the TBCP varied according only to trip characteristics of the participants. In the present study, data collected before and after the implementation of the program is used and the objective of the study is different from the two previous pieces of research: to analyse the influence of being involved in the TBCP on increasing the proportion of time spent on AT. In the present paper we have identified how the influence of being involved in the TBCP varies according to sociodemographics of the participants.
The results of this study demonstrate that specific travel behaviour change barriers, which have been identified under the framework of several theories that link attitudes to behaviour, can be overcome using specific persuasion strategies. To this end, persuasion strategies, in order to be more effective, should be designed and applied differently depending on the socio-demographics of the individuals. Future work could include the study of how persuasion strategies might be used to overcome other travel behaviour change barriers related to individual objective and collective factors. In any case, as pointed out in the previous section, a larger sample size is needed, so that the effect of each particular persuasion strategy can be identified.
The participation in programs based on persuasion strategies can work in any country, as long as travel behaviour change barriers have been properly identified and the appropriate strategy is selected, designed and implemented correctly. In contrast, we suspect that the particular different effects according to sociodemographics that we have found are not the same in other contexts. It would be interesting to replicate this study in other regions and to study travel behaviour change barriers related to collective factors, which, in theory, depend on group cultures and shared norms.
This study focuses on the effects that participating in the TBCP have on one characteristic of mobility: the travel mode used. We plan to continue using data from both survey waves to study how participating in the program affects other characteristics of the mobility (trip duration, trip timing), characteristics of the activities performed (location, type, duration, timing, with whom) and features of the activity scheduling process (additions, modifications or deletions of activity-travel episodes during this process). This work will be carried out taking into account socio-demographics of the participants and the characteristics of the activities. On the other hand, it would be interesting to replicate this study controlling for several health indicators, so that the effect of the participation in the TBCP can be measured directly.
Author Contributions
The authors confirm contribution to the paper as follows: Conceptualization, T.R.; Formal analysis, R.A. and D.C.; Methodology, L.M. All authors reviewed the results and approved the final version of the manuscript.
Funding
This study has been partially funded by the Ministerio de Economía, Industria y Competitividad of Spain, project MINERVA (TRA2015-71184-C2-1-R).
Conflicts of Interest
The authors declare no conflict of interest.
References
- Fox, K.R.; Riddoch, C. At Least Five a Week: Evidence on the Impact of Physical Activity and Its Relationship to Health; Department of Health: London, UK, 2004.
- Stopher, P.; Bullock, P. Travel Behavior Modification: A Critical Appraisal. In Proceedings of the 26th Australasian Transport Research Forum, Wellington, New Zealand, 1–3 October 2003. [Google Scholar]
- Chatterjee, K.; Bonsall, P. Special Issue on Evaluation of programs promoting voluntary change in travel behavior. Transp. Policy 2009, 16, 279–280. [Google Scholar] [CrossRef]
- Bamberg, S.; Rees, J. The impact of voluntary travel behavior change measures—A meta-analytical comparison of quasi-experimental and experimental evidence. Transp. Res. Part A 2017, 100, 16–26. [Google Scholar] [CrossRef]
- Chatterjee, K. A comparative evaluation of large-scale personal travel planning projects in England. Transp. Policy 2009, 16, 293–305. [Google Scholar] [CrossRef] [Green Version]
- Friman, M.; Larhult, L.; Gärling, T. An analysis of soft transport policy measures implemented in Sweden to reduce private car use. Transportation 2013, 40, 109–129. [Google Scholar] [CrossRef]
- Skarin, F.; Olsson, L.E.; Roos, I.; Friman, M. The household as an instrumental and affective trigger in intervention programs for travel behavior change. Travel Behav. Soc. 2017, 6, 83–89. [Google Scholar] [CrossRef]
- Meloni, I.; Sanjust, B.; Sottile, E.; Cherchi, E. Propensity for voluntary travel behavior changes: An experimental analysis. Procedia-Soc. Behav. Sci. 2013, 87, 31–43. [Google Scholar] [CrossRef] [Green Version]
- Fujii, S.; Taniguchi, A. Determinants of the effectiveness of travel feedback programs—A review of communicative mobility management measures for changing travel behavior in Japan. Transp. Policy 2006, 13, 339–348. [Google Scholar] [CrossRef]
- Ruiz, T.; García-Garcés, P. Measuring the impact of travel behavior change programs on the activity-travel scheduling process. Transp. Lett. 2015, 7, 104–113. [Google Scholar] [CrossRef]
- García-Garcés, P.; Ruiz, T.; Habib, K.N. Effect of travel behavior change programs on time allocated to driving. Transportmetrica 2016, 12, 1–19. [Google Scholar]
- Seethaler, R.; Rose, G. Using the Six Principles of Persuasion to Promote Travel Behavior Change: Findings of a TravelSmart Pilot Test. In Proceedings of the 37th Australasian Transport Research Forum (ATRF), Sydney, Australia, 30 September–2 October 2005. [Google Scholar]
- Fujii, S.; Kitamura, R. What does a one-month free bus ticket do to habitual drivers? An experimental analysis of habit and attitude change. Transportation 2003, 30, 81–95. [Google Scholar] [CrossRef]
- Thøgersen, J.; Møller, B. Breaking car use habits. The effectiveness of a free one-month travelcard. Transportation 2008, 35, 329–345. [Google Scholar] [CrossRef]
- Bonsall, P. Do we know whether travel planning really works? Transp. Policy 2009, 16, 306–314. [Google Scholar] [CrossRef]
- Richter, J.; Friman, M.; Gärling, T. Review of evaluations of soft transport policy measures. Transp. Theory Appl. 2010, 2, 5–18. [Google Scholar]
- Stopher, P.; Clifford, E.; Swann, N.; Zhang, Y. Evaluating of voluntary travel behaviour change: Suggested guide lines and case studies. Transp. Policy 2009, 16, 315–324. [Google Scholar] [CrossRef]
- Moser, G.; Bamberg, S. The effectiveness of soft transport policy measures: A critical assessment and meta-analysis of empirical evidence. J. Environ. Psychol. 2008, 28, 10–26. [Google Scholar] [CrossRef]
- Fujii, S.; Bamberg, S.; Friman, M.; Gärling, T. Are effects of travel feedback programs correctly assessed? Transportmetrica 2009, 5, 43–57. [Google Scholar] [CrossRef]
- Wanner, M.; Götschi, T.; Martin-Diener, E.; Kahlmeier, S.; Martin, B.W. Active Transport, Physical Activity, and Body Weight in Adults. Am. J. Prev. Med. 2012, 42, 493–502. [Google Scholar] [CrossRef] [PubMed] [Green Version]
- Mulley, C.; Tyson, R.; McCue, P.; Rissel, C.; Munro, C. Valuing active travel: Including the health benefits of sustainable transport in transportation appraisal frameworks. Res. Transp. Bus. Manag. 2013, 7, 27–34. [Google Scholar] [CrossRef]
- Keall, M.; Chapman, R.; Howden-Chapman, P.; Witten, K.; Abrahamse, W.; Woodward, A. Increasing active travel: Results of a quasi-experimental study of an intervention to encourage walking and cycling. Epidemiol. Community Health 2015, 69, 1184–1190. [Google Scholar] [CrossRef]
- Fishman, E. Bikeshare’s impact on active travel: Evidence from the United States, Great Britain, and Australia. J. Transp. Health 2015, 2, 135–142. [Google Scholar] [CrossRef]
- Doorley, R.; Pakrasi, V.; Ghosh, B. Quantifying the Health Impacts of Active Travel: Assessment of Methodologies. Transp. Rev. 2015, 35, 559–582. [Google Scholar] [CrossRef]
- Clark, A.F.; Scott, D.M.; Yiannakoulias, N. Examining the relationship between active travel, weather, and the built environment: A multilevel approach using a GPS-enhanced dataset. Transportation 2014, 41, 325–338. [Google Scholar] [CrossRef]
- Hsu, H.-P.; Saphores, J.-D. Impacts of parental gender and attitudes on children’s school travel mode and parental chauffeuring behavior: Results for California based on the 2009 National Household Travel Survey. Transportation 2014, 41, 543–565. [Google Scholar] [CrossRef]
- Haybatollahi, M.; Czepkiewicz, M.; Laatikainen, T.; Kyttä, M. Neighbourhood preferences, active travel behaviour, and built environment: An exploratory study. Transp. Res. Part F 2015, 29, 57–69. [Google Scholar] [CrossRef]
- Clark, A.F.; Scott, D.M. Does the social environment influence active travel? An investigation of walking in Hamilton, Canada. J. Transp. Geogr. 2013, 31, 278–285. [Google Scholar] [CrossRef]
- Yang, H.; Lu, X.; Cherry, C.; Liu, X.; Li, Y. Spatial variations in active mode trip volume at intersections: A local analysis utilizing geographically weighted regression. J. Transp. Geogr. 2013, 28, 101–110. [Google Scholar] [CrossRef]
- Ajzen, I. The theory of planned behavior. Organ. Behav. Hum. Decis. Process. 1991, 50, 179–211. [Google Scholar] [CrossRef]
- Schwartz, S.H. Normative influences on altruism. In Advances in Experimental Social Psychology; Berkowitz, L., Ed.; Academic Press: New York, NY, USA, 1977; Volume 10, pp. 221–279. [Google Scholar]
- Stern, P.C. New environmental theories: Toward a coherent theory of environmentally significant behavior. J. Soc. 2000, 56, 407–424. [Google Scholar] [CrossRef]
- Triandis, H.C. Interpersonal Behaviour; Brooks/Cole Publishing Company: Monterey, CA, USA, 1977. [Google Scholar]
- Bandura, A. Social Foundations of thought and Action: A Social Cognitive Theory; Prentice-Hall, Inc.: Englewood Cliffs, NJ, USA, 1986. [Google Scholar]
- Bamberg, S.; Schmidt, P. Incentives, morality or habit? Predicting students car use for university routes with the models of Ajzen, Schwartz and Triandis. Environ. Behav. 2003, 35, 264–285. [Google Scholar] [CrossRef]
- Bamberg, S.; Hunecke, M.; Blobaum, A. Social context, morality, and the use of public transportation: Results from two field studies. J. Environ. Psychol. 2007, 27, 190–203. [Google Scholar] [CrossRef]
- Bamberg, S.; Möser, G. Twenty years after Hines, Hungerford, and Tomera: A new meta-analysis of psycho-social determinants of pro-environmental behaviour. J. Environ. Psychol. 2007, 27, 14–25. [Google Scholar] [CrossRef]
- Gärling, T.; Fujii, S. Travel behavior modification: Theories, methods, and programs. In The Expanding Sphere of Travel Behavior Research, Proceedings of the 11th International Conference on Travel Behaviour Research, 24–29 September 2017, Estérel, OC, Canada; Kitamura, R., Yoshi, T., Yamamoto, T., Eds.; Emerald Group Publishing: New York, NY, USA, 2009; pp. 97–128. [Google Scholar]
- Prochaska, J.; DiClemente, C. Transtheoretical therapy: Toward a more integrative model of change. Psychotherapy 1982, 19, 276–288. [Google Scholar] [CrossRef]
- Prochaska, J.; Velicer, W. The transtheoretical model of health behavior change. Am. J. Health Promot. 1997, 12, 38–48. [Google Scholar] [CrossRef] [PubMed]
- Carver, C.S.; Scheier, M.F. On the Self-Regulation of Behavior; Cambridge University Press: New York, NY, USA, 1998. [Google Scholar]
- Gollwitzer, P.M. Implementation intentions: Strong effects of simple plans. Am. Psychol. 1999, 54, 493. [Google Scholar] [CrossRef]
- Bamberg, S.; Fujii, S.; Friman, M.; Ga¨rling, T. Behaviour theory and soft transport policy measures. Transp. Policy 2011, 18, 228–235. [Google Scholar] [CrossRef] [Green Version]
- Bamberg, S. Process of Change. In Environment of Psychology; Steg, L., Van Den Berg, A., De Groot, J., Eds.; BPS Bleckwell, West Sussex: Hoboken, NJ, USA, 2012. [Google Scholar]
- Bamberg, S. Applying the stage model of self-regulated behavioral change in a car use reduction intervention. J. Environ. Psychol. 2013, 33, 68–75. [Google Scholar] [CrossRef]
- Brög, W.; Schadler, M. Marketing in Public Transport is an Investment, Not a Cost. In Proceedings of the 22nd Australian Transport Research Forum, Sydney, Australia, 28–30 September 1998. [Google Scholar]
- Rose, G.; Ampt, E. Travel Blending: An Australian Travel Awareness Initiative. Transp. Res. Part D Transp. Environ. 2001, 6, 95–110. [Google Scholar] [CrossRef]
- Lucken, E.; Soria, J.; Niktas, M.-A.; Wang, T.; Stewart, M.; NJikoui, R. Impact of information about health and academic benefits on parent perception of the feasibility of active transportation to school. J. Transp. Health 2018. [Google Scholar] [CrossRef]
- Arnott, B.; Rehackova, L.; Errington, L.; Sniehotta, F.F.; Roberts, J.; Araujo-Soares, V. Efficacy of behavioural interventions for transport behaviour change: Systematic review, meta-analysis and intervention coding. Int. J. Behav. Nutr. Phys. Act. 2014, 11, 133. [Google Scholar] [CrossRef]
- Hsieh, H.-S.; Kanda, Y.; Fujii, S. Incorporation of coping planning into the behavior change model that accounts for implementation intention. Transp. Res. Part F 2019, 60, 228–244. [Google Scholar] [CrossRef]
- Sunio, V.; Schmöcker, J.-D.; Kim, J. Understanding the stages and pathways of travel behavior change induced by technology-based intervention among university students. Transp. Res. Part F 2018, 59, 98–114. [Google Scholar] [CrossRef]
- Ma, L.; Mulley, C.; Liu, W. Social Marketing and the Built Environment: What Matters for Travel Behaviour Change? In Proceedings of the Australasian Transport Research Forum, Sydney, Australia, 30 September–2 October 2015. [Google Scholar]
- Mutrie, N.; Carney, C.; Blamey, A.; Crawford, F.; Aitchison, T.; Whitelaw, A. “Walk in to Work Out”: A randomised controlled trial of a self help intervention to promote active commuting. J. Epidemiol. Community Health 2002, 56, 407–412. [Google Scholar] [CrossRef] [PubMed]
- Shmueli, G. To explain or to predict? Stat. Sci. 2010, 25, 289–310. [Google Scholar] [CrossRef]
- Arroyo, R.; Ruiz, T.; Casquero, D.; Mars, L. Trip Characteristics Analysis of the Effects of a Travel Behavior Change Program. Transp. Res. Record 2018. [Google Scholar] [CrossRef]
- Susilo, Y.O.; Liu, C.; Börjesson, M. The changes of activity-travel participation across gender, life-cycle, and generations in Sweden over 30 years. Transportation 2018. [Google Scholar] [CrossRef]
- Anable, J.; Lane, B.; Kelay, T. An Evidence Base Review of Public Attitudes to Climate Change and Transport Behaviour; The Department for Transport: London, UK, 2006.
- Wilber, K. Integral Psychology; Shambhala: Boston, MA, USA, 2000. [Google Scholar]
- Cialdini, R.B. Influence: How and Why People Agree to Things, 1st ed.; William Morrow and Company, Inc.: New York, NY, USA, 1984. [Google Scholar]
- Groves, R.M.; Cialdini, R.B.; Couper, M.P. Understanding the decision to participate in a survey. Public Opin. Q. 1992, 56, 475–495. [Google Scholar] [CrossRef]
- Brehm, J. A Theory of Psychological Reactance; Academic Press: New York, NY, USA, 1966. [Google Scholar]
- Mazis, M.B. Antipollution measures and psychological reactance theory: A field experiment. J. Pers. Soc. Psychol. 1975, 31, 654–666. [Google Scholar] [CrossRef]
- McKenzie-Moor, D. Guide to Community-Based Social Marketing. Available online: http://www.cbsm.com/pages/guide/preface/ (accessed on 24 December 2017).
- Bushman, B.J. Perceived symbols of authority and their influence on compliance. J. Appl. Soc. Psychol. 1984, 14, 501–508. [Google Scholar] [CrossRef]
- Festinger, L. A theory of social comparison processes. Hum. Relat. 1954, 7, 117–140. [Google Scholar] [CrossRef]
- Byrne, D. The Attraction Paradigm; Academic Press: New York, NY, USA, 1979. [Google Scholar]
- Stotland, E.; Patchen, M. Identification and change in prejudice and authoritarianism. J. Abnorm. Soc. Psychol. 1961, 62, 250–256. [Google Scholar] [CrossRef]
- Benson, P.L.; Karabenic, S.A.; Lerner, R.M. Pretty pleases: The effect of physical attractiveness on race, sex, and receiving help. J. Exp. Psychol. 1976, 12, 409–415. [Google Scholar] [CrossRef]
- Suedfeld, P.; Bochner, S.; Matas, C. Petitioner’s attire and petition signing by peace demonstrations: A field experiment. J. Appl. Soc. Psychol. 1971, 1, 278–283. [Google Scholar] [CrossRef]
- Heckman, J.J. Sample Selection Bias as a Specification Error. Econometrics 1979, 47, 153–161. [Google Scholar] [CrossRef]
- Mooi-Reci, I. Retrenchments in Unemployment Insurance Benefits and Wage Inequality: Longitudinal Evidence from the Netherlands, 1985–2000. Eur. Sociol. Rev. 2012, 28, 594–606. [Google Scholar] [CrossRef] [Green Version]
- Greene, W. LIMDEP Version 10. Econometric Modeling Guide; NYU Stern: New York, NY, USA, 2009. [Google Scholar]
- Abadie, A. Semiparametric Difference-in-Differences Estimators. Rev. Econ. Stud. 2005, 72, 1–19. [Google Scholar] [CrossRef] [Green Version]
- Puhani, P. The Heckman correction for sample selection and its critique. J. Econ. Surv. 2000; 14, 53–67. [Google Scholar]
- Boarnet, M.; Crane, R. The influence of land use on travel behavior: Specification and estimation strategies. Transp. Res. Part A Policy Pract. 2001, 35, 823–845. [Google Scholar] [CrossRef]
- Crane, R.; Crepeau, R. Does neighborhood design influence travel? A behavioral analysis of travel diary and GIS data. Transp. Res. Part D Transp. Environ. 1998, 3, 225–238. [Google Scholar] [CrossRef]
- Krizek, K.J. Neighborhood services, trip purpose, and tour-based travel. Transportation 2003, 30, 387–410. [Google Scholar] [CrossRef]
- Clark, B.; Chatterjee, K.; Melia, S.; Knies, G.; Laurie, H. Life events and travel behaviour: Exploring the interrelationship using UK Household Longitudinal Study data. Transp. Res. Rec. 2014, 2413, 54–64. [Google Scholar] [CrossRef]
- Liu, C.; Susilo, Y.O.; Karlström, A. Jointly Modelling Individual’s Daily Activity-travel Time Use and Mode Share by a Nested Multivariate Tobit Model System. Transp. Res. Procedia 2015, 9, 71–89. [Google Scholar] [CrossRef]
- De Vos, J.; Mokhtarian, P.L.; Schwanen, T.; Van Acker, V.; Witlox, F. Travel mode choice and travel satisfaction: Bridging the gap between decision utility and experienced utility. Transportation 2016, 43, 771–796. [Google Scholar] [CrossRef] [Green Version]
- Mao, Z.; Ettema, D.; Dijst, M. Analysis of travel time and mode choice shift for non-work stops in commuting: Case study of Beijing, China. Transportation 2016. [Google Scholar] [CrossRef]
Figure 1.
Scheme of data collection methodology used in the scheduling process panel survey.

Figure 2.
Stages of each wave of the scheduling process panel survey.

Figure 3.
AT/Total in waves 1 and 2 and TBCP and CG groups. Gender.

Figure 4.
AT/Total in waves 1 and 2 and TBCP and CG groups. Age.


Table 1.
Sample demographic and socioeconomic distribution.
| TBCP | CG | ||
|---|---|---|---|
| GENDER | Women | 43.1% | 58.1% |
| Men | 56.9% | 41.9% | |
| MAIN OCCUPATION | Employed | 69.4% | 62.4% |
| Students | 20.8% | 25.8% | |
| Others | 9.7% | 11.8% | |
| AGE | Aged < 30 | 38.9% | 45.2% |
| Aged 30–39 | 30.6% | 30.1% | |
| Aged 40–49 | 18.1% | 15.1% | |
| Aged 50–59 | 12.5% | 9.7% |
Table 2.
Pre-study questionnaire structure for identification of psychological barriers.
| Section | N° of Questions | Type of Question |
|---|---|---|
| 1. Current mandatory travel behaviour | 5 | Closed-ended and open-ended questions |
| 2. Current discretionary travel behaviour | 5 | Closed-ended and open-ended questions |
| 3. Objective individual conditionings to travel behaviour change | 9 | 5-Likert scale |
| 4. Personal values | 4 | Yes/No |
| 5. Mental structure/beliefs | 3 | Yes/No |
| 6. Cognitive attitudes toward each travel mode | 9 | 5-Likert scale |
| 7. Affective attitudes toward each travel mode | 8 | 5-Likert scale |
| 8. Social norms | 9 | Yes/No |
| 9. Auto-efficacy | 4 | Yes/No |
| 10. Self-Identity/Status | 4 | Open-ended questions |
| 11. Knowledge of negative effects of car use | 12 | Yes/No |
| 12. Social dilemmas | 3 | Yes/No |
Table 3.
Dependent and explanatory variables.
| Variable | Definition |
|---|---|
| Dependent variable | |
| AT/Total | For each panellist and day of the week: [average time allocated to AT per day] divided by [average total time allocated to travel per day] |
| Explanatory variables | |
| TBCP | 1 = Respondent participated in TBCP; 0 = otherwise |
| WAVE | 0 = First survey wave; 1 = Second survey wave |
| Trip attributes | |
| TRIP_TIM | Total time allocated to travel episodes per day (in min) |
| PRIVEHTIME | Time allocated to travel in PV per day (in min) |
| TRIPS | Total number of trips per day |
| DAY | 1 = if trip is carried out on a weekday; 0 = otherwise |
| MORNING_TRIPS_P | Percentage of morning trips per respondent and per day of week |
| AFTERNOON_TRIPS_P | Percentage of afternoon trips per respondent and per day of week |
| EVENING_TRIPS_P | Percentage of evening trips per respondent and per day of week |
| NIGHT_TRIPS_P | Percentage of night trips per respondent and per day of week |
| ACOMP | 1 = if it is a joint trip; 0 = otherwise |
| ACOMP_TIME | Total time travelled with companions per day (min) |
| ACOMP_TIME_P | Percentage of time travelled with companions per day |
| ACOMP_HH_TIME_P | Percentage of time travelled with household companions per day |
| ACOMP_OTHER_TIME_P | Percentage of time travelled with other companions per day |
| Demographic attributes | |
| AGE | 0 = Respondent age is between 18 and 30 |
| 1 = Respondent age is between 31 and 50 | |
| 2 = Respondent age is over 50 | |
| GENDER | 1 = Female; 0 = Male |
| Marital status | |
| MARRIED | 1 = Respondent is married; 0 = otherwise |
| DIVORCED | 1 = Respondent is divorced; 0 = otherwise |
| COUPLE | 1 = Respondent lives in couple but not married (co-habiting couple); 0 = otherwise |
| SINGLE | 1 = Respondent is single; 0 = otherwise |
| EDUCATION | 0 = Primary school is the higher level of education for respondent |
| 1 = Secondary school is the higher level of education for respondent | |
| 2 = Respondent has studied non-university higher education/professional school/further education | |
| 3 = University studies is the higher level of education for respondent | |
| 4 = Bachelor is the higher level of education for respondent | |
| 5 = PhD is the higher level of education for respondent | |
| FAMWD | 1 = if respondent live with his/her family during weekdays; 0 = otherwise |
| FAM_WK | 1 = if respondent live with his/her family during weekends; 0 = otherwise |
| Household attributes | |
| HHMEMBERS | Number of members at home (including respondent) |
| Household position | |
| HEAD | 1 = Respondent lives alone, lives only with his/her partner, or is one of the parents in case the household is inhabited by a family; 0 = otherwise |
| SHARE | 1 = Respondent lives in a shared house; 0 = otherwise |
| SON/DAUGHTER | 1 = Respondent lives with his/her parents; 0 = otherwise |
| Activity status | |
| UNEMPLOYED | 1 = Respondent is unemployed; 0 = otherwise |
| STUDENT | 1 = Respondent is studying; 0 = otherwise |
| EMPLOYED | 1 = Respondent is employed; 0 = otherwise |
| RETIRED | 1 = Respondent is retired; 0 = otherwise |
| Willingness to change | |
| CAR_REDU | 1 = Respondent is willing to change his/her mobility towards a decrease of car use; 0 = otherwise |
| CAR AVAILABILITY | 2 = High car availability (every day in the week); 1 = Medium car availability (3–6 days per week); 0 = Low car availability (2 days per week or less) |
Table 4.
Average time travel per day (min).
| Wave 1 | ||||||
| Total | PV | Walking | Cycling | PT | AT | |
| TBCP | 89.3 | 76.6 | 7.9 | 0.4 | 4.4 | 8.3 |
| CG | 83.6 | 69.5 | 9.5 | 1.8 | 2.7 | 11.3 |
| Wave 2 | ||||||
| TBCP | 86.9 | 68.4 | 10.1 | 2.2 | 6.2 | 12.3 |
| CG | 83.7 | 69.9 | 8.3 | 1.7 | 3.8 | 10.0 |
PV: Private Vehicle; PT: Public Transport; AT: Active Travel (Walking + Cycling).
Table 5.
Difference of Travel time by each mode/Total travel time between survey waves.
| Travel Time by Each Mode/Total Wave 2–Travel Time by Each Mode/Total Wave 1 (Percentage Points) | ||||||
| PV | Walking | Cycling | PT | AT | ||
| TBCP | −7.1 | 2.7 | 2.1 | 2.2 | 4.9 | |
| CG | 0.3 | −1.5 | −0.1 | 1.3 | −1.6 | |
| Travel Time by Each Mode/Total Wave 2–Travel Time by Each Mode/Total Wave 1 (Percentage) | ||||||
| TBCP | −8.2% | 30.9% | 538.7% | 44.1% | 52.6% | |
| CG | 0.4% | −12.9% | −6.7% | 40.0% | −11.9% | |
PV: Private Vehicle; PT: Public Transport; AT: Active Travel (Walking + Cycling).
Table 6.
AT/Total. Cohen’s d and Two-Factor ANOVA.
| Variable | AT/Total | Cohen’s D | Two-Factor ANOVA | |||
|---|---|---|---|---|---|---|
| Wave 1 | Wave 2 | D | F | Sig | ||
| Gender | Female CG | 0.16 | 0.15 | 0.26 | 3.29 | 0.07 |
| Female TBCP | 0.12 | 0.18 | ||||
| Male CG | 0.18 | 0.12 | 0.55 * | 12.58 | 0.00 * | |
| Male TBCP | 0.11 | 0.18 | ||||
| Age | Young CG | 0.10 | 0.10 | 0.44 | 3.90 | 0.05 * |
| Young TBCP | 0.11 | 0.18 | ||||
| Adult CG | 0.23 | 0.15 | 0.45 | 11.96 | 0.00 * | |
| Adult TBCP | 0.12 | 0.17 | ||||
| Senior CG | 0.12 | 0.21 | 0.10 | 0.02 | 0.89 | |
| Senior TBCP | 0.09 | 0.17 | ||||
| Marital status | Married CG | 0.21 | 0.14 | 0.39 | 6.31 | 0.01 * |
| Married TBCP | 0.15 | 0.19 | ||||
| Divorced CG | 0.06 | 0.04 | 1.88 * | 3.46 | 0.07 | |
| Divorced TBCP | 0.01 | 0.12 | ||||
| Couple CG | 0.03 | 0.00 | 1.85 * | 3.40 | 0.07 | |
| Couple TBCP | 0.08 | 0.25 | ||||
| Single CG | 0.17 | 0.13 | 0.57 * | 9.62 | 0.00 * | |
| Single TBCP | 0.08 | 0.17 | ||||
| Household role | Spouse CG | 0.20 | 0.15 | 0.31 | 6.75 | 0.01 * |
| Spouse TBCP | 0.13 | 0.17 | ||||
| House share CG | 0.13 | 0.03 | 0.58 * | 1.68 | 0.20 | |
| House share TBCP | 0.15 | 0.19 | ||||
| Son/daughter CG | 0.15 | 0.15 | 0.25 | 1.34 | 0.25 | |
| Son/daughter TBCP | 0.09 | 0.15 | ||||
| Educational Level | Primary CG | 0.11 | 0.07 | 1.21 * | 4.64 | 0.04 * |
| Primary TBCP | 0.08 | 0.28 | ||||
| Secondary CG | 0.12 | 0.08 | 0.61 * | 5.48 | 0.02 * | |
| Secondary TBCP | 0.11 | 0.22 | ||||
| Technical CG | - (1) | - | - | - | ||
| Technical TBCP | - | - | ||||
| University-level CG | 0.04 | 0.04 | 0.09 | 4.79 | 0.03 * | |
| University-level TBCP | 0.06 | 0.18 | ||||
| Bachelor CG | 0.27 | 0.16 | 0.35 | 2.69 | 0.10 | |
| Bachelor TBCP | 0.11 | 0.10 | ||||
| Degree, PhD CG | 0.13 | 0.11 | 0.31 | 3.55 | 0.06 | |
| Degree, PhD TBCP | 0.13 | 0.19 | ||||
| Car Availability | Low CG | - | - | - | - | |
| Low TBCP | - | - | ||||
| Medium CG | 0.25 | 0.15 | 0.55 * | 1.09 | 0.34 | |
| Medium TBCP | 0.30 | 0.05 | ||||
| High CG | 0.13 | 0.11 | 0.31 | 8.13 | 0.01 * | |
| High TBCP | 0.12 | 0.16 | ||||
| Willing to reduce car use | NotWRCU CG | 0.18 | 0.04 | 0.26 | 0.6 | 0.43 |
| NotWRCU TBCP | 0.13 | 0.07 | ||||
| YesWRCU CG | 0.18 | 0.14 | 0.42 | 12.1 | 0.00 * | |
| YesWRCU TBCP | 0.11 | 0.18 | ||||
| Famweek | FamweekNO CG | 0.18 | 0.06 | 0.78 * | 3.9 | 0.05 * |
| FamweekNO TBCP | 0.06 | 0.08 | ||||
| FamweekYES CG | 0.18 | 0.16 | 0.23 | 5.0 | 0.03 * | |
| FamweekYES TBCP | 0.13 | 0.17 | ||||
| Famwend | FamwendNO CG | 0.18 | 0.05 | 0.27 | 0.5 | 0.50 |
| FamwendNO TBCP | 0.08 | 0.08 | ||||
| FamweekYES CG | 0.19 | 0.17 | 0.25 | 5.4 | 0.02 * | |
| FamwendYES TBCP | 0.12 | 0.17 | ||||
| Main activity | Unemployed CG | 0.02 | 0.10 | - | - | - |
| Unemployed TBCP | - | - | ||||
| Student CG | 0.15 | 0.12 | 0.66 * | 5.0 | 0.03 * | |
| Student TBCP | 0.08 | 0.21 | ||||
| Working CG | 0.19 | 0.14 | 0.35 | 10.0 | 0.00 * | |
| Working TBCP | 0.11 | 0.16 | ||||
| Retired CG | - | - | - | - | - | |
| Retired TBCP | 0.23 | 0.25 | ||||
(1) No cases observed. (*) Significant effect of participating in TBCP on AT/Total.
Table 7.
First Step. Random Parameters Probit Panel Model.
| Coefficient | Coef/SE | Coefficient | Coef/SE | |
|---|---|---|---|---|
| Mean for Random Parameters | Scale Parameters for Dists. of Random Parameters | |||
| Constant | 227.175 | 0.77 | 17.1412 *** | 3.00 |
| DAY | 11.6271 *** | 2.81 | 0.22234 | 0.61 |
| TRIPS | 0.70325 *** | 2.73 | 2.75417 *** | 3.05 |
| AGE | 25.9581 *** | 2.99 | 3.89751 *** | 2.59 |
| GENDER | −35.5314 *** | −2.98 | 5.73108 *** | 2.83 |
| HHMEMBER | 7.82954 *** | 2.95 | 59.3898 *** | 3.00 |
| SINGLE | 14.8495 *** | 2.80 | 5.47581 ** | 2.31 |
| Total n° of observations (per wave) | 738 | |||
| Pseudo R-squared | 0.45714 | |||
Note: ***, **, *: significance at 1%, 5% and 10% level.
Table 8.
Second Step. Random Parameters Selection Panel Model.
| MODEL 1 D = GENDER | MODEL 2 D = SHARE | MODEL 3 D = FAM_WD | MODEL 4 D = CAR_AVAIL | MODEL 5 D = CAR_REDU | MODEL 6 D = STUDENT | |||||||
|---|---|---|---|---|---|---|---|---|---|---|---|---|
| Means for random parameters | ||||||||||||
| Coefficient | Coef/SE | Coefficient | Coef/SE | Coefficient | Coef/SE | Coefficient | Coef/SE | Coefficient | Coef/SE | Coefficient | Coef/SE | |
| 0.16531 | 0.65 | 0.18496 | 0.41 | 0.41495 *** | 12.58 | 0.52501 *** | 5.77 | −0.10966 ** | −2.21 | 0.25892 *** | 8.41 | |
| WAVE | −0.05769 ** | −2.35 | −0.00518 | −0.3 | −0.17933 *** | −4.22 | −0.20301 ** | −2.06 | 0.08957 * | 1.79 | −0.00297 | −0.17 |
| TBCP | −0.06345 | −0.13 | −0.05104 | −0.06 | −0.48478 *** | −9.98 | −0.53204 *** | −3.06 | 0.28787 *** | 5.2 | −0.39848 *** | −15.63 |
| D | −0.01933 | −0.9 | −0.02769 | −0.54 | −0.00555 | −0.18 | −0.14252 *** | −3.28 | 0.07964 * | 1.74 | 0.06508 ** | 2.33 |
| WAVE*TBCP | 0.12056 *** | 3.88 | 0.04998 ** | 2.12 | 0.25598 *** | 4.21 | 0.40500 ** | 2.17 | −0.06197 | −1.02 | 0.04668 * | 1.95 |
| WAVE*D | 0.06352 * | 1.96 | −0.0847 | −1.31 | 0.18343 *** | 4.07 | 0.09333 * | 1.82 | −0.11453 ** | −2.11 | −0.05318 | −1.28 |
| TBCP*D | 0.04304 | 1.44 | 0.04563 | 0.73 | 0.04165 | 0.85 | 0.07997 | 0.91 | −0.02864 | −0.54 | −0.07352 ** | −2.03 |
| WAVE*TBCP*D | −0.09343 ** | −2.18 | 0.14820 * | 1.86 | −0.22964 *** | −3.57 | −0.17558 * | −1.85 | 0.14943 ** | 2.25 | 0.09154 * | 1.68 |
| TRIPS | 0.04768 *** | 12.03 | 0.04573 *** | 11.03 | 0.04874 *** | 13.21 | 0.04669 *** | 11.81 | 0.04570 *** | 11.38 | 0.04721 *** | 12.24 |
| TRIP_TIM | −0.00303 *** | −15.09 | −0.00303 *** | −14.21 | −0.00295 *** | −15.75 | −0.00289 *** | −14.06 | −0.00292 *** | −14.11 | −0.00297 *** | −14.76 |
| MORNING_TRIPS_P | 0.03303 * | 1.69 | 0.04467 ** | 2.2 | 0.05892 *** | 2.86 | 0.04712 ** | 2.27 | ||||
| FAM_WK | 0.05680 *** | 3.68 | 0.06222 *** | 3.89 | 0.05266 *** | 3.29 | 0.05166 *** | 3.32 | ||||
| EDUCATIO | 0.00707** | 2.29 | 0.00834 *** | 2.64 | 0.00996 *** | 3.27 | 0.00538 * | 1.69 | ||||
| ACOMP | −0.02809 ** | −2.26 | −0.02969 *** | −2.58 | ||||||||
| AGE | 0.02686 *** | 3.03 | 0.02882 *** | 3.2 | 0.02070 ** | 2.34 | 0.02493 ** | 2.33 | ||||
| DIVORCED | −0.08077 *** | −2.62 | ||||||||||
| EMPLOYED | −0.02326 * | −1.72 | ||||||||||
| CAR_REDU | 0.04285 *** | 2.95 | 0.02424 * | 1.77 | ||||||||
| GENDER | 0.02392 ** | 2.05 | 0.01335 | 1.21 | ||||||||
| Scale parameters for dists. of random parameters | ||||||||||||
| 0.10464 *** | 20.28 | 0.07760 *** | 13.93 | 0.09096 *** | 18.52 | 0.01960 *** | 3.76 | 0.04020 *** | 7.38 | 0.09014 *** | 18.36 | |
| WAVE | 0.01977 *** | 2.69 | 0.05984 *** | 7.71 | 0.00685 | 0.96 | 0.10813 *** | 15.1 | 0.01312 * | 1.74 | 0.08068 *** | 11.43 |
| TBCP | 0.01161 | 1.62 | 0.00513 | 0.7 | 0.00689 | 1.01 | 0.00236 | 0.32 | 0.01438 ** | 1.98 | 0.01018 | 1.33 |
| D | 0.07623 *** | 11.04 | 0.00807 | 0.44 | 0.11451 *** | 22.83 | 0.0032 | 1.2 | 0.08235 *** | 14.45 | 0.06720 *** | 6.16 |
| WAVE*TBCP | 0.12034 *** | 12.75 | 0.09067 *** | 9.24 | 0.03972 *** | 4.51 | 0.00749 | 0.78 | 0.08853 *** | 9.49 | 0.03129 *** | 3.25 |
| WAVE*D | 0.03195 *** | 2.85 | 0.01798 | 0.77 | 0.04074 *** | 5.25 | 0.03198 *** | 8 | 0.00324 | 0.38 | 0.03110 * | 1.8 |
| TBCP*D | 0.01955 * | 1.77 | 0.01092 | 0.5 | 0.00487 | 0.65 | 0.00174 | 0.44 | 0.02372 *** | 2.99 | 0.00537 | 0.37 |
| WAVE*TBCP*D | 0.04464 *** | 2.99 | 0.24173 *** | 7.85 | 0.00058 | 0.06 | 0.01445 *** | 2.72 | 0.15251 *** | 14.53 | 0.03181 | 1.55 |
| TRIPS | 0.00116 | 1.04 | 0.00176 | 1.51 | 0.00053 | 0.53 | 0.0017 | 1.52 | 0.00053 | 0.47 | 0.00374 *** | 3.35 |
| TRIP_TIM | 0.50946D−04 | 0.8 | 0.35996D−04 | 0.53 | 0.18069D−04 | 0.31 | 0.57804D−04 | 0.88 | 0.60530D−04 | 0.91 | 0.17690D−04 | 0.28 |
| MORNING_TRIPS_P | 0.12573 *** | 10.7 | 0.17594 *** | 15.65 | 0.14268 *** | 11.77 | 0.06447 *** | 5.73 | ||||
| FAM_WKEN | 0.01425 ** | 2.49 | 0.00738 | 1.27 | 0.01955 *** | 3.46 | 0.03579 *** | 6.27 | ||||
| EDUCATIO | 0.00129 | 0.9 | 0.00735 *** | 4.76 | 0.00014 | 0.1 | 0.00577 *** | 3.98 | ||||
| ACOMP | 0.00771 | 1.2 | 0.00043 | 0.07 | ||||||||
| AGE | 0.07290 *** | 12.77 | 0.04187 *** | 8.2 | 0.01693 *** | 2.99 | 0.03361 *** | 6.28 | ||||
| DIVORCED | 0.00339 | 0.11 | ||||||||||
| EMPLOYED | 0.02871 *** | 4.78 | ||||||||||
| CAR_REDU | 0.06291 *** | 10.72 | 0.05361 *** | 9.26 | ||||||||
| GENDER | 0.01617 ** | 2.16 | 0.01623 ** | 2.17 | ||||||||
| Sigma | 4.95436 *** | 154.96 | 4.73842 *** | 136.68 | 3.51066 *** | 522.75 | 3.77144 *** | 515.12 | 4.03829 *** | 479.32 | 3.57703 *** | 519.85 |
| Rho | −0.20601 *** | 52.71 | −0.30741 *** | 68.69 | 0.89535 *** | 70.12 | 0.80542 *** | 33.96 | −0.73288 *** | −19.14 | 0.86233 *** | 54.05 |
| Total n° of observations (per survey wave) | 738 | |||||||||||
| Pseudo R2 | 0.12261 | 0.11352 | 0.14056 | 0.18661 | 0.17211 | 0.17886 | ||||||
Note: ***, **, * ==> Significance at 1%, 5%, 10% level.
© 2018 by the authors. Licensee MDPI, Basel, Switzerland. This article is an open access article distributed under the terms and conditions of the Creative Commons Attribution (CC BY) license (http://creativecommons.org/licenses/by/4.0/).
Share and Cite
MDPI and ACS Style
Ruiz, T.; Arroyo, R.; Mars, L.; Casquero, D. Effects of a Travel Behaviour Change Program on Sustainable Travel. Sustainability 2018, 10, 4610. https://doi.org/10.3390/su10124610
AMA Style
Ruiz T, Arroyo R, Mars L, Casquero D. Effects of a Travel Behaviour Change Program on Sustainable Travel. Sustainability. 2018; 10(12):4610. https://doi.org/10.3390/su10124610
Chicago/Turabian StyleRuiz, Tomás, Rosa Arroyo, Lidón Mars, and Daniel Casquero. 2018. "Effects of a Travel Behaviour Change Program on Sustainable Travel" Sustainability 10, no. 12: 4610. https://doi.org/10.3390/su10124610
Note that from the first issue of 2016, this journal uses article numbers instead of page numbers. See further details here.