Credit Risk Diffusion in Supply Chain Finance: A Complex Networks Perspective

School of Management, Harbin Institute of Technology, Harbin 150001, China
*
Author to whom correspondence should be addressed.
Sustainability 2018, 10(12), 4608; https://doi.org/10.3390/su10124608
Submission received: 30 October 2018
/
Revised: 26 November 2018
/
Accepted: 3 December 2018
/
Published: 5 December 2018
(This article belongs to the Section Air, Climate Change and Sustainability)
Abstract
:The diffusion of credit risk in a supply chain finance network can cause serious consequences. Using the “1 + M + N” complex network model with BA scale-free characteristics, this paper studies the credit risk diffusion in a supply chain finance network, where the credit risk diffusion process is simulated by the SIS epidemic model. We examine the impacts of various key factors, including the general financing ratio, cure time, network structure, and network scale on the credit risk diffusion process. It is found that credit risk diffusion rarely occurs in a network with a low average degree. When the average degree of the network increases, the occurrence of the credit risk diffusion becomes more frequent. Besides, the degree of the initially infected nodes with credit risk does not affect the density of the infected nodes in the steady state, while a higher degree of the cure nodes helps restrain the diffusion of credit risk in the supply chain finance network. Finally, the simulation result based on the supply chain finance network with a core node indicates that the diffusion of the credit risk diffusion in sparse supply chain finance networks with low average degrees is unstable. The results provide better understandings on the credit risk diffusion in supply chain finance networks.
1. Introduction
Since supply chain finance is an important means to solve the financing problem of small and medium-sized enterprises (SMEs), it is crucial to managing the risks in supply chain finance. As one of the significant risks in supply chain finance, credit risk is contagious, leading to credit risk diffusion in the economy. In a supply chain finance network, large-scale credit risk diffusion can be triggered due to the complex relationship among individual interconnected entities. Compared with credit defaults and contagions in traditional financing practices dealing with individual firms, the diffusion of supply chain finance credit risks in the network can bring more serious consequences to the economy. The China steel trade crisis incident that occurred in 2012 is a typical example of the credit risk diffusion in a supply chain finance network. Large state-owned or listed steel trading companies which served as “shadow banks” raised credit financing for small and medium-sized steel trading companies. It was found that steel trading companies repeatedly pledged via the false warehousing documents issued by warehousing companies. However, one company’s withdrawal led to the outbreak of the crisis in the steel trade. Consequently, a number of steel trading companies were affected by a series of capital chain breaks resulting in bankruptcies, leading to an upsurge of the balance of non-performing loans (over 20 billion Yuan) in several banks. Therefore, it is necessary to study the essential influencing factors of the credit risk diffusion phenomenon and provide the corresponding decision-making basis for the management of supply chain financial credit risk.
Current research on the credit risk in supply chain finance focuses on the identification, measurement, and evaluation of the risk, of which the evaluation of credit risk is extensively studied. In evaluating the credit risk, the core enterprise, the financing project, and the condition of the entire supply chain are integrated into an appraisal system using various assessment methods [1]. The relationship among enterprises in a supply chain finance network is complex. Besides the business transactions, there is a credit risk propagation among the interconnected enterprises. The default behavior and credit conditions among enterprises are correlated. On the one hand, the correlation comes from the influence of common macro factors on the enterprises in the economy. On the other hand, the correlation originates from the interconnectedness among different enterprises. The correlated default behavior leads to a credit risk contagion, and the research has utilized both simple models and structural models to study these contagion phenomena. Davis and Lo [2] described credit risk contagion as a phenomenon of the debtor’s default strength increasing due to the breach of another debtor, regardless of the relationship between the enterprises. Jarrow and Yu [3] characterized the credit risk contagion by the default intensity and they divided the enterprises with a business relationship into two levels, of which the default intensity of the second level enterprises is affected by the first level enterprises, and the risk can only be transmitted from the first level enterprise to the second level. Giesecke and Weber [4] found that the credit risk contagion is due to the interactions among enterprises. By establishing an influence model with different network structures and local interactions among enterprises, they found that the default of an enterprise is related to the number of partners directly related to it. Jorion and Zhang [5], through an empirical study, found that the business relationship is the channel of credit risk transmission, while the counterparty with a lower credit level is more susceptible to the infection. The contagion of credit risk among connected enterprises will lead the default of the industry cluster. Kwok and Leung [6] used simulation modeling to construct Markov chains to study the credit risk contagion among affiliated enterprises and found that credit risk contagion is the main reason for the cluster default. However, there are few research articles on the credit risk diffusion mechanism in the supply chain financial network, which is the research focus of this study.
In the existing research, to study the credit risk contagion, the copula function [7] and the conditional independent default methods [8] are widely used in the literature. The copula function is used to model the firm’s default intensity directly, without considering the underlying factors that lead to a credit risk contagion. Although the macroscopic factors are added to the model, the conditional independent default methods consider the risk contagion among the enterprises to a less extent. Further studies of credit risk research find that interaction among enterprises is much more complicated using individual transfer systems and real financial networks. Nier [9] conducted a study on the banking network and found that the network structure can affect the credit risk contagion. Steinbacher [10] constructed a network-based credit contagion model to examine the impact of special and systemic shocks on individual banks and banking systems, and the impact of network topologies, capital ratios and recovery rates on the stability of the financial systems. On the basis of the original portfolio credit risk model, Anagnostou [11] included the systemic risk factors that affect the whole credit system, then built an extended model of investment credit risk and a credit pressure transmission network. Petrone [12] introduced a dynamic model to quantify the systemic risk by incorporating credit risks with various transmission mechanisms in the bank credit risk network and obtaining the distribution in terms of potential losses through multi-cycle Monte Carlo simulations. It can be seen that while the network model has been used in many studies, few studies have focused on the network characteristic of the supply chain financial network to study credit risk diffusion.
The complex network theory and tools have been widely used to study network problems in the real world [13]. The complex network theory and tools have been widely used to study network problems in the real world, such as social network human-to-human relationships, research cooperation networks, citation networks, power networks, urban road traffic networks, aviation networks, SME cluster networks, inter-bank market networks, etc. With the features of large-scale networks, a complex structure, and evolving characteristics, complex networks can be used to construct the supply chain finance network. A few studies have used complex networks to investigate the risks in supply chain finance networks. Yang [14] used the SIS-type complex network model to study the supply chain risk contagion and builds the supply chain risk communication model (SIS–RP). Based on the small world network, Chen [15] investigated the impact of the relationship among individuals in a social network, individual’s risk attitude and ability to resist risk, financial market regulators, network structure characteristics, monitoring intensity, etc., on the credit risk contagion. Zhong [16] built a scale-free network to study the “overall credit” problem in supply chain finance, and to monitor the bank’s business process to facilitate business design and decision-making. Therefore, it is reasonable to study the risk diffusion in the network of supply chain finance from the perspective of complex networks, which enriches the existing research on the risk diffusion mechanism in the network of supply chain finance from the perspective of the network structure.
As supply chain finance becomes increasingly critical to the economic development, better understandings on the credit risk contagion and the impact of various underlying factors, particularly the complexity characteristics of the supply chain finance network, are needed. The aim of this study is to investigate the credit risk contagion using the approaches from complex networks. More specifically, we focus on how the credit risk spreads and the steady status in the supply chain finance network. In this paper, we investigate the credit risk contagion using the approaches from complex networks. Based on this, this paper studies the diffusion of credit risk in supply chain finance from the perspective of complex networks, starting from the perspective of risk diffusion. The SIS epidemic model based on complex network theory [17] is used to systematically analyze the credit risk diffusion in the network and to judge the important influencing factors that affect the diffusion of credit risk. The results of the model are validated through simulation methods, providing a corresponding decision-making basis for the management problems of supply chain financial credit risk.
The existing research has forced on the identification, measurement, and evaluation of financial risks, the characteristics of the supply chain finance network—such as multiple stakeholders, the complex structure, and the dynamic evolution—that determine the considering of complex network perspective. This study contributes to the construction of a financial risk network in the supply chain by analyzing the risk environment, risk sources, and risks objects. In addition, this study advances the logic mechanism and the dynamic diffusion of financial risks which contributes to control uncertainty and potential risks. Finally, this study solves the problem of missing data in the financing risk research by constructing the visual simulation model. The suggestion about cure strategies under different conditions provides significant decision references.
2. Construction of a Supply Chain Finance Network
A complex network is a graph with non-trivial topological features and is generally considered to be a network that is large in scale, complex in structure, and constantly evolving, with diverse nodes and edges that increase. Complex network theory is an effective way to identify the interrelations between different risks factors and objects and reveal the risk diffusion process. Compared with the traditional risk theory that only focuses on the systematic and comprehensive risks, complex network theory is more concerned with factors relations and diffusion mechanisms [18,19]. Thus, complex network theory provides the theoretical underpinning for supply chain finance. Hofmann [20] defines supply chain finance as the intersection of logistics, supply chain management, collaboration, and financing. It is the intersection of two or more organizations in the supply chain, including external service providers. A method of co-creating value by planning, directing, and controlling financial flows at the organizational level. The main participants in supply chain finance are the core enterprises, small and medium-sized enterprises, financial institutions and third-party logistics enterprises. At present, the main financing model is confirmed warehouse financing based on prepaid account financing, financing based on accounts Receivable and finance based on inventory financing. Based on different core enterprise characteristics, supply chains can be divided into three main types: supply chains based on a manufacturing core enterprise, supply chains dominated by a resource core enterprise, and supply chains dominated by a channel core enterprise. The supply chain network is a multi-layer network with an interdependent structure. This means that the network of supply chain finance is a multi-layer network with an interdependent structure as well. The internal hierarchical relationship of the supply chain financial network can be expressed to be the supplier relation between n-level enterprise group to the first-level group or the distributor relation between the level 1 core enterprise group and the n-level distributor business group, and finally, to the final customer group [21].
At first, the supply chain finance was mainly centralized offline as “1 + N”, in which the core enterprises represented “1”, while the upstream and downstream SMEs were “N”. The development of the Internet provided an opportunity for the online “1 + N”. The biggest change of this model is that the core enterprise can connect its data with the bank, and the online supply chain finance can efficiently complete the multi-party online coordination, and improve the efficiency of the operation. This kind of supply chain finance is mainly centered on a core enterprise, emphasizing the financing activities of a certain industry chain. When multiple industrial chains intersect and multiple core companies form strategic alliances, the supply chain finance network based on the “1 + M + N” model will also be established. In the “1 + M + N” model, a bank has strategic relationships with many core companies and completes supply chain operations in complex multi-core networks with multiple layers. Different from the financing model mentioned above, the number of core enterprises has changed from one to multiple enterprises and the network form will be more complicated. SMEs can face multiple core companies to carry out financing activities. Take the Shanxi aerospace industry chain as an example. A commercial bank is “1”. There are 4 core enterprises that have established alliances with the bank(“M”), and 24 small and the medium-sized enterprises that have close ties with these 4 core enterprises are “N”. Through this model, the bank’s target customer base is multiplied.
A supply chain network has systematic and complex features [20]. A supply chain finance network is based on the supply chain network. In the network, an enterprise directly connected to an enterprise is called the neighbor nodes of the enterprise. The number of neighbor nodes is called the node degree of the enterprise, and the number of core enterprises in the supply chain finance network is very small, but the node degree is high. The number of SMEs is very large and the node degree is small, which reflects the scale-free characteristics of the supply chain finance network. Under such a network structure, when the supply chain finance network is facing the influence of external or internal supply chain default events, due to a high degree, core enterprises which were infected will affect a large number of enterprises in a short period of time. SMEs have a small node degree and the impact on the network in a short period of time is limited. This phenomenon also indicates that the supply chain finance network has robustness and vulnerability.
The more classical networks in complex networks are small-world networks and scale-free networks [22,23]. Although two small-world networks may have the same degree distribution but very different clusterings and characteristic path lengths [24], small-world features generally describe networks with a smaller average path length and a larger clustering coefficient. Meanwhile, the scale-free network describes that the degree distribution of each node has severely uneven distribution characteristics, that is, a small number of nodes in the network have a large node degree, while a large number of nodes have a lower node degree, emphasizing the growth characteristics and preferential connection mechanisms of the network, with the phenomenon of “the rich becoming richer”. The SMEs entering the network will preferentially seek the help of the core enterprises to achieve financing requirements. The scale-free network is more suitable as the basic network of supply chain finance because the supply chain financial network is a dynamically evolving network and the newly growing nodes in the network are based on priority connections. In detail, the new SME nodes entering the network will first seek the help of the core enterprises to achieve financing needs. Then, a small number of core enterprises in the supply chain financial network will have a higher degree, while a large number of other enterprises have a lower degree. Taking into account the financing priority mechanism and the scale-free features of the supply chain finance network, this paper will use the BA scale-free network as the basic network environment to construct the supply chain finance network environment.
The following are used to build a supply chain finance network with the average node degree of 2 according to the BA scale-free network construction rules.
- (1)
- Growth mechanism: starting from a network with nodes, each time a new node is introduced, it is connected to the existing nodes, and .
- (2)
- Priority connection mechanism: the probability that a new node is connected to an existing node is , which can be expressed as the relationship between the node with a node degree of and the sum of the node degrees is .
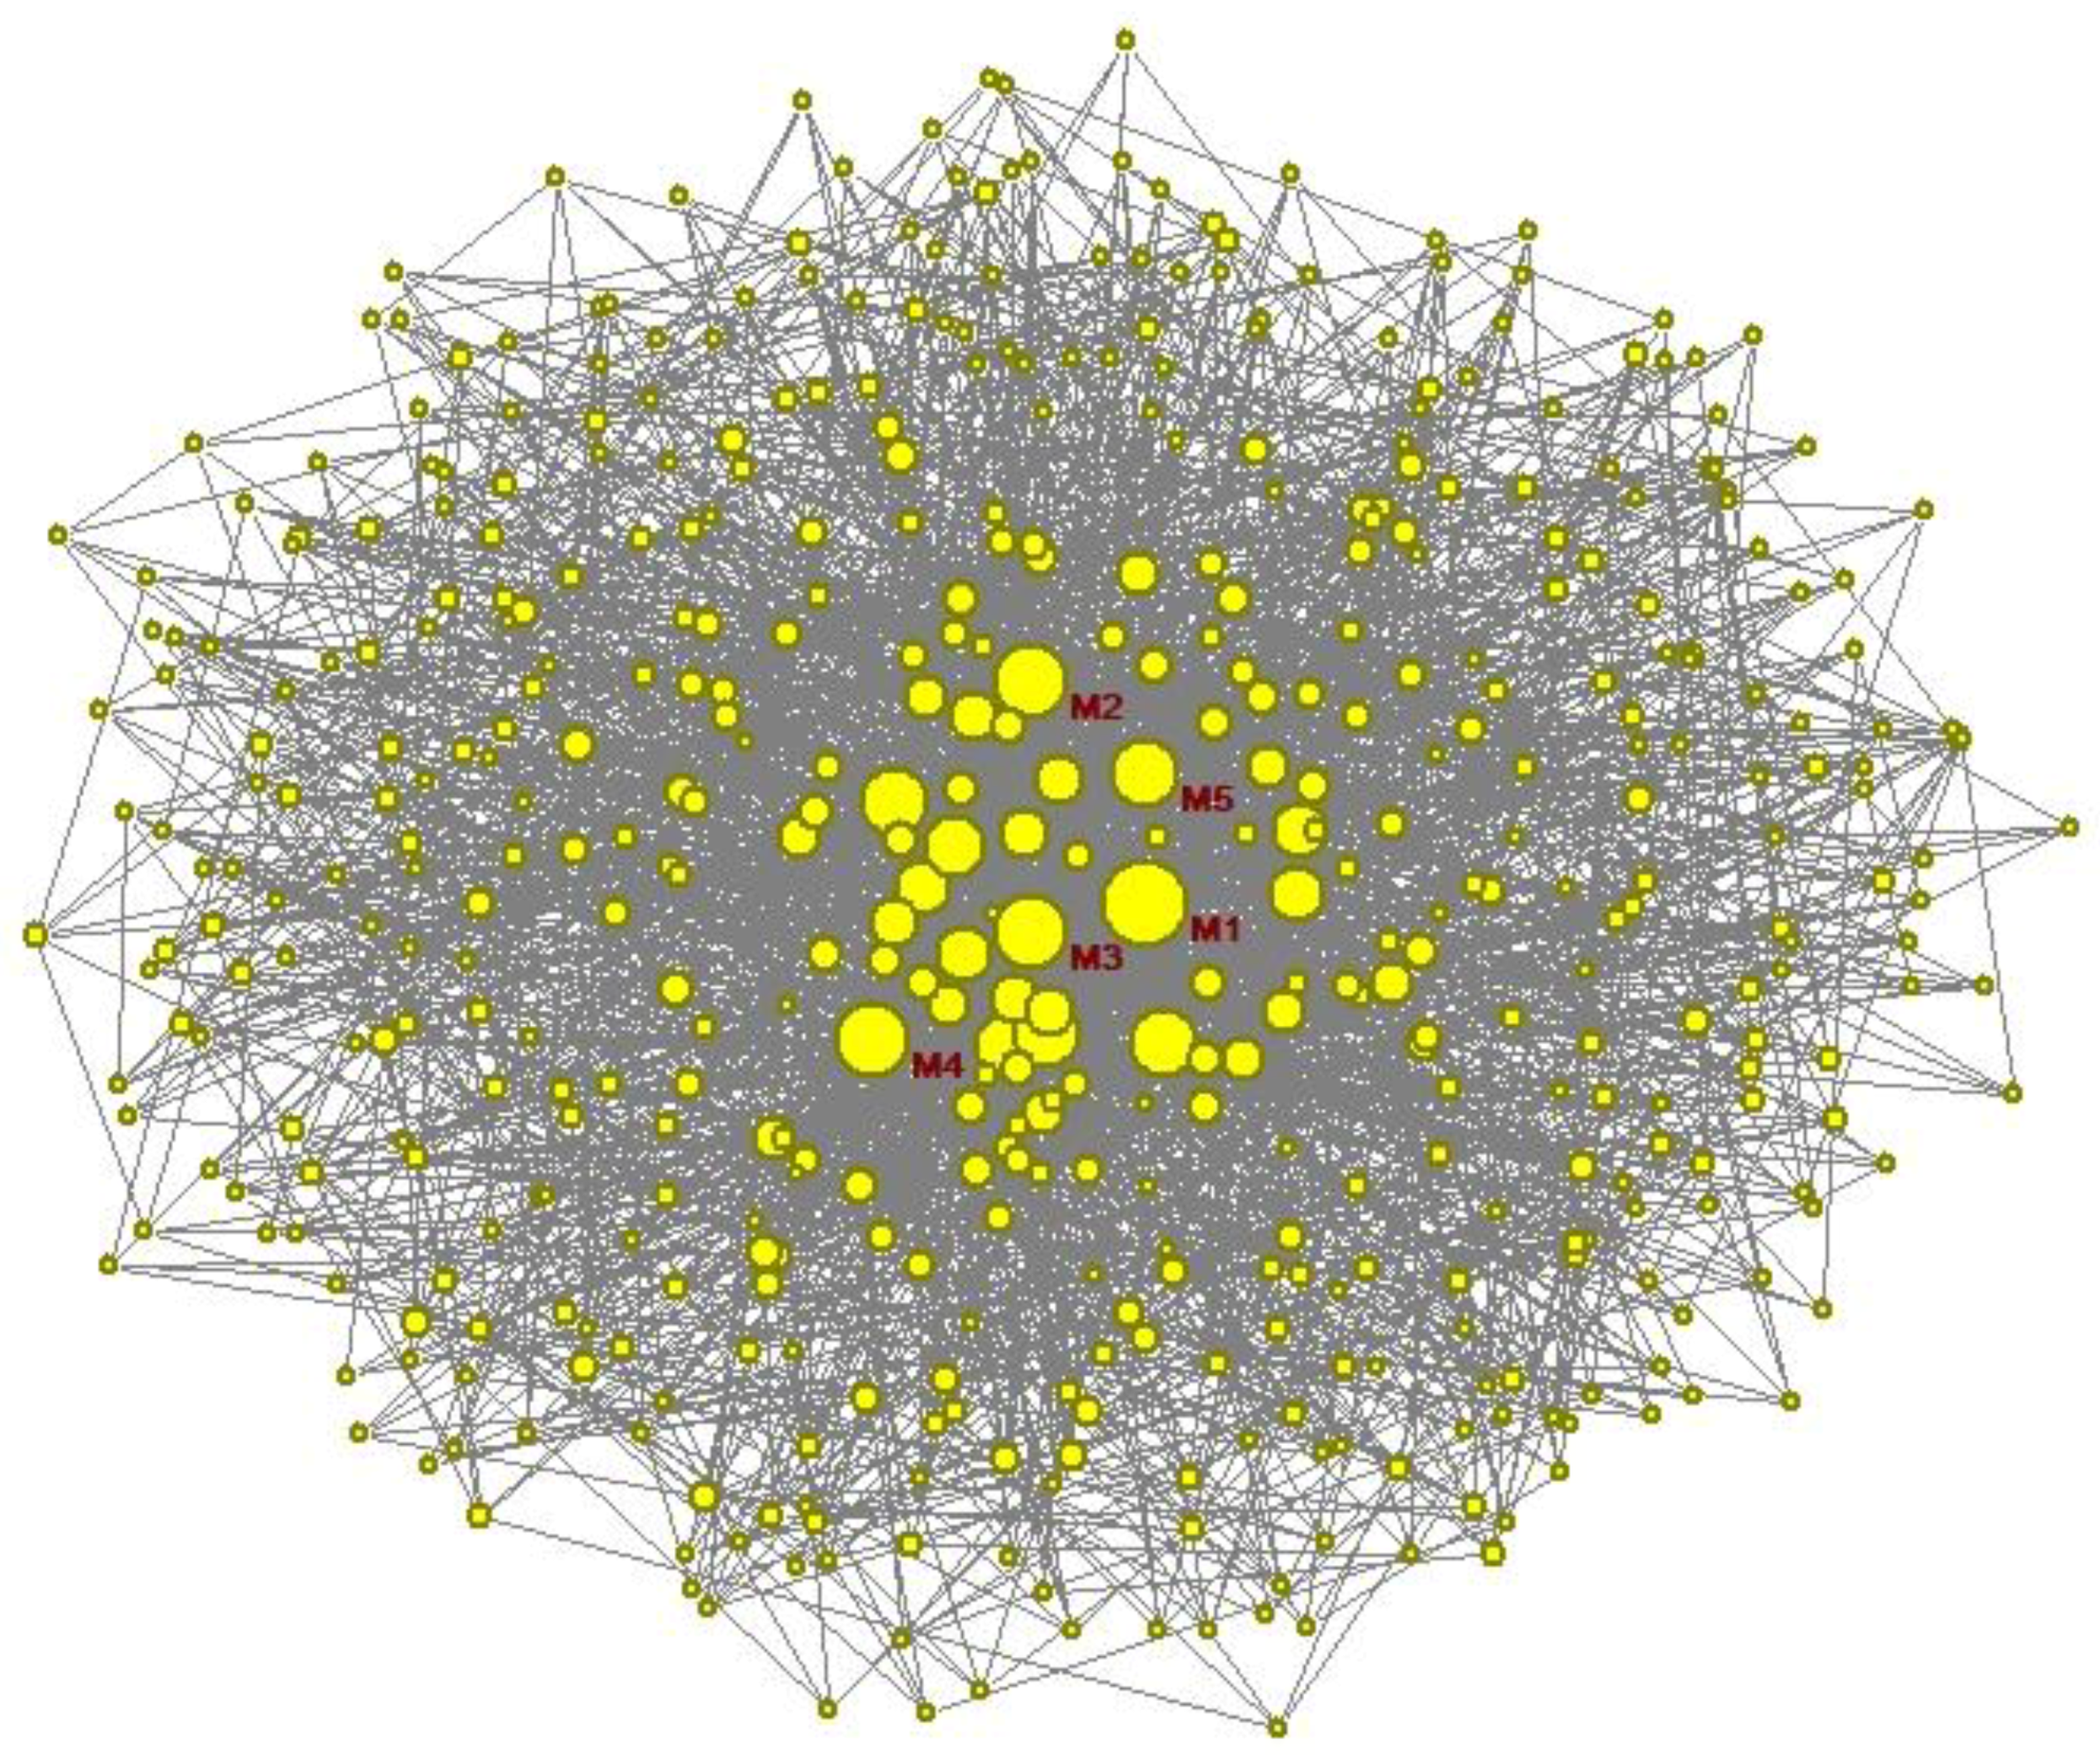
In order to describe the network structure of supply chain finance, according to the above construction rules and using Pajek to draw a supply chain finance network under the “1 + M + N” model, the network scale generated by the Kamada–Kawa algorithm is 500, and the number of core enterprises is 5. The supply chain finance network schematic diagram is shown in Figure 1.
The size of the dots in the illustration represent the size of the node degree of enterprises, indicating the enterprise’s importance in the supply chain finance network. The nodes labeled from “M1” to “M5” represent the five core enterprises in the virtual network and the remaining nodes represent SMEs. The foundation of supply chain finance is the supply chain, and its scale is limited to the scale of the supply chain networks. Additionally, the scales of the supply chain network in different industries are different. In this paper, the scale setting in the simulation of the supply chain network relies on existing references and the actual scale in some supply chain finance cases [14,25,26]. In the following study, the basic network parameters were set to = 1000, , on the basis of which credit risk diffusion in the supply chain finance network is analyzed.
3. Modeling Supply Chain Finance Network Using Complex Networks
3.1. Analysis of Credit Risk Diffusion in Supply Chain Finance
Credit risk refers to the possibility of loss to counterparty caused by one party’s inability to perform the contract. Credit risk can be divided into default risk, credit rating downgrade risk, and credit spread increase risk. From the perspective of commercial banks, this paper considers that due to various unpredictable events or uncertainties, it is difficult for SMEs or core companies to achieve the expected guarantees and repayment commitments, which will, in turn, cause banks to lose credit risks. Sources of credit risk in supply chain finance include the objective credit risk due to poor management, subjective fraud-induced credit risk, and credit risk caused by the inadequate supervision of banks and third-party logistics companies, and credit risk caused by an unstable value of pledged goods. Enterprises in the supply chain finance network serve as the carrier for the diffusion of credit risk, and business relationships and guarantee relationships between enterprises are used as a way to diffuse credit risks.
Credit risk contagion is the basis of credit risk diffusion. Narrowly defined credit risk diffusion refers to the phenomenon of another borrower defaulting due to a default by a borrower. The channel of credit risk contagion can be divided into periodic infections, related relationship contagions, and contagions caused by guarantee relationships [27]. In the supply chain finance network, periodic infection refers to the fact that enterprises are affected by macro external conditions, which result in a certain industry or a large number of enterprises in the industrial chain being affected and resulting in a breach of contract. This is a causal contagion relationship. Related relationship contagion refers to the infection of the counterparty, and the contagion of guarantee relationship refers to credit risk contagion between enterprises with guarantee relationship. In this paper, we consider the counterparty contagion and guarantee relationship contagion.
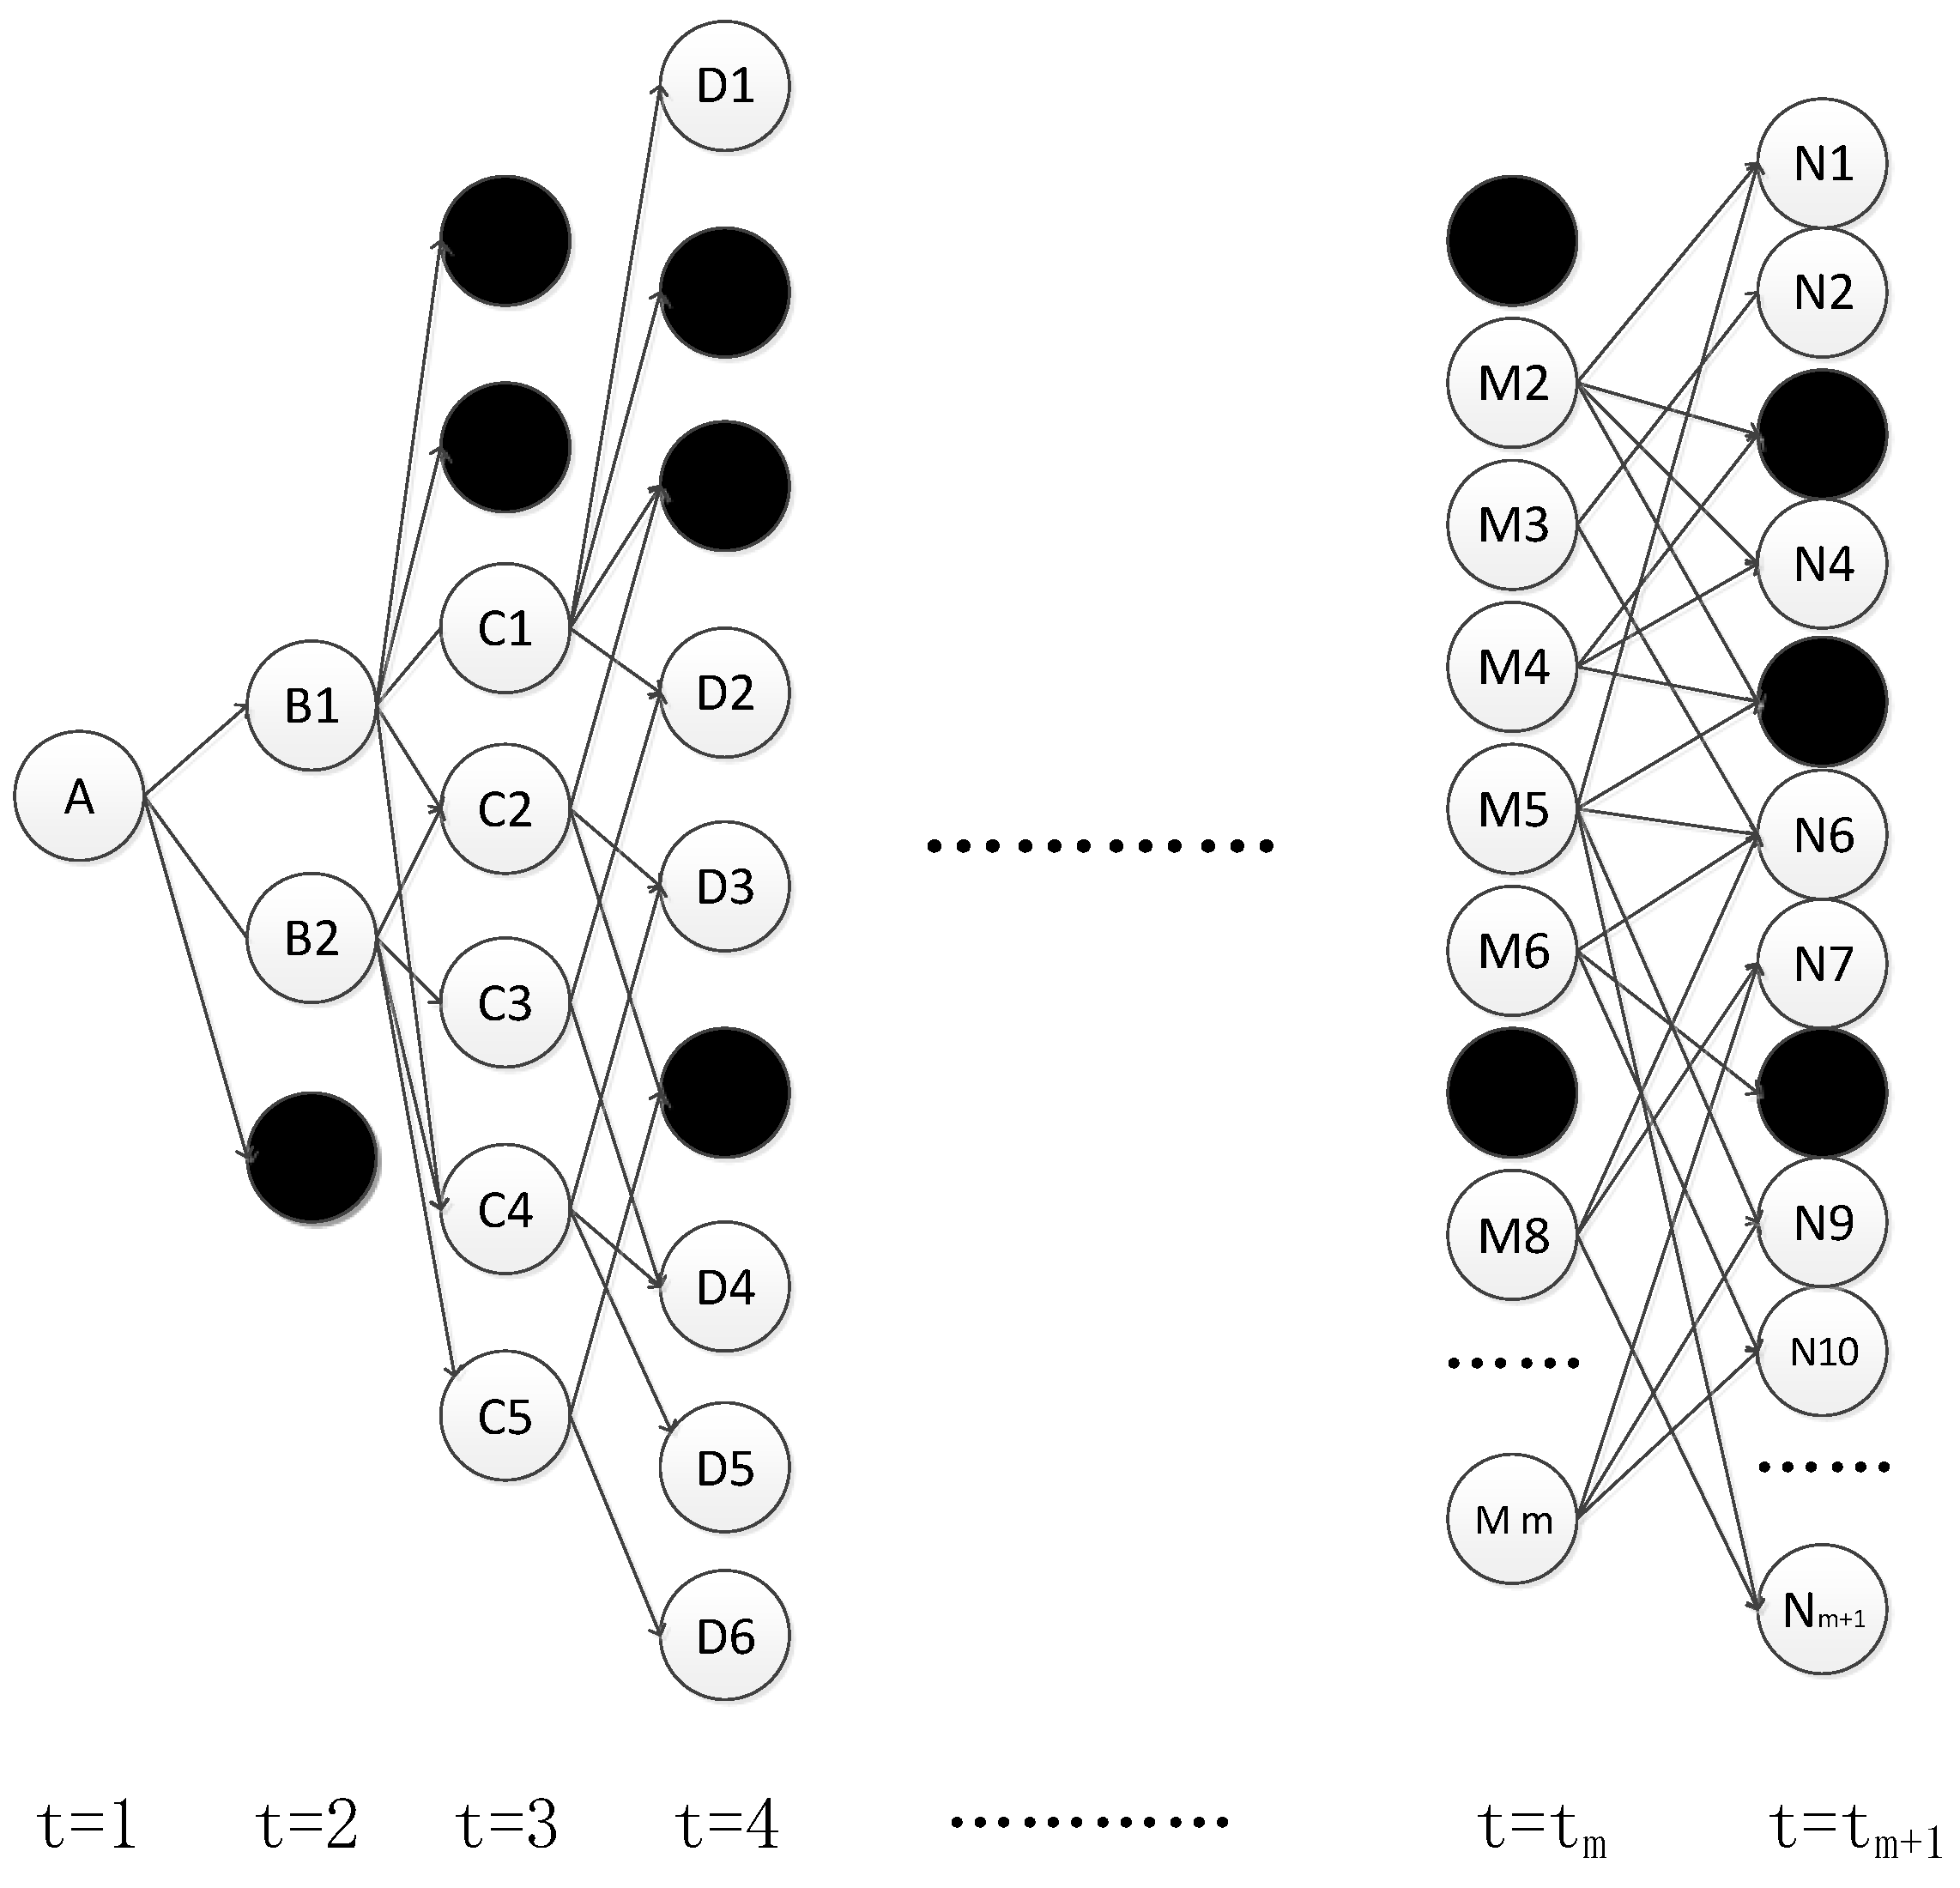
At present, there is no authoritative definition of credit risk diffusion. The diffusion of supply chain finance credit risk in this paper describes the occurrence of a credit default event in an enterprise and the continuous transmission of credit risk through the complex correlation of the enterprise until, after a period of time, the supply chain finance network is stable. When the number of infected enterprises is no longer significantly increased, many enterprises in the network are infected by credit risk. The credit risk diffusion diagram is depicted in Figure 2.
The black dot in the picture represents the uninfected node, and the white dot refers to the infected node, in which the letter in the white dot refers to the initial state of infection for each round of transmission. A is the initial state of infection with only one infected node. As time goes on, B represents the second transmission process with two infected nodes and C represents the third infection process with five infected nodes, and so on, until the credit risk diffusion reaches a steady-state as is shown in N with n nodes.
According to the above analysis of the credit risk diffusion of supply chain finance, the model for the diffusion of credit risk in supply chain finance is established below. The traditional credit risk contagion model studies the relationship between credit risk transmission between two or a few individuals, the model calculation is very complex and research focuses on one-way transmission between individuals, and cannot reveal the dynamic process of credit risk contagion and diffusion [3,12,28]. The SIS model under the complex network theory is a classic virus infection model and has recently been widely applied to credit risk research [12,14]. As a model for studying a large-scale risk diffusion phenomenon, the SIS infection model has several characteristics that can meet the needs of this research: first, it can be applied to large-scale network environments; second, the model has simple and easy-to-use features in case a large number of calculation processes make research work impossible; third, there is no clear requirement for the direction of credit risk transmission in the network; fourth, the model reflects the dynamic evolution characteristics of the credit risk contagion process in the network. In Summary, the diffusion of credit risk in the supply chain finance network is very similar to the spread of the virus from the object of dissemination, the method of transmission, and the process of dissemination. Therefore, the SIS model is used as the basic model for the diffusion of financial credit risk in the supply chain.
3.2. Model Construction
The construction of the model is based on the purpose of the research. The study of credit risk diffusion in the supply chain finance complex network is mainly to solve two problems: firstly, to determine whether the diffusion of credit risk in the network will occur, and secondly, to clarify the impact of credit risk diffusion to the entire network. This paper sets the critical value of the risk propagation probability as the critical condition for the diffusion of credit risk in the network. The density of network infection nodes at the steady-state and the spread of credit risk are taken as the impact of credit risk diffusion on the entire network, which will be made in the following model to describe.
Combined with the characteristics of supply chain finance, the following basic hypotheses are proposed to build the model.
Hypothesis 1.
The supply chain finance network is an undirected network.
The risk diffusion in the supply chain network is mainly directed upstream, downstream, and cross-contagion-wise, which are different from the logistics, the capital flow, and information flow. Thus, the risks in the supply chain network are assumed to spread along the line and there is no specified direction. This study does not specifically distinguish the transmission order between two nodes.
Hypothesis 2.
Nodes in the network will only be directly infected by their neighbor nodes.
Nodes in the network are only directly infected by their neighbors. Considering the effect of information diffusion in the supply chain network, enterprises that do not have a direct transaction correlation can also carry out credit risk contagion, but in this paper, in order to simplify the structure of the model, this contagion method is not considered.
Hypothesis 3.
The credit risk in the supply chain finance network is diffused with a certain probability.
Even if two nodes are directly connected, this does not mean that certain risks will be transmitted through the connection between these two nodes. This probability is related to the strength of the relationship between the enterprises and the frequency of arrivals and flows. In this paper, it is simplified as a constant λ without considering factors such as the strength of the relationship between enterprises and the frequency of communication.
Hypothesis 4.
The network structure of supply chain finance does not change with the contagion of credit risk.
In the real world, the complex network of supply chain finance is constantly evolving. When some nodes are disconnected from the network, new nodes will be added. Thus, in order to highlight the research focus and reduce the complexity of the model, this study assumes that the network structure of supply chain finance does not change with the spread of credit risk.
In the modern supply chain finance, the core enterprises provide guarantees for the funds obtained by SMEs. The amount of guarantees is the sum of the financing amount of all the upstream and downstream SMEs. This paper assumes that the amount of financing and the amount of guarantee are collectively referred to as the financing-related amount. In a network of scale , it is assumed that the debt-recovery assets of node before financing is (excluding the value of the assets under participation in the financing project), the asset value under the financing project is , and the financing obtained from supply chain finance is . Capital income under financing is the first source of repayment, then . Assume that enterprises in the network get financing at the same time with the same financing term . Assets under financing may be subject to losses due to some assets (loss, depreciation of pledged movable assets, etc.) or external accidents (economic factors, political factors, force majeure, etc.), and values are random. Additionally, . When the enterprise is due to repay the loan or assume the guarantee liability, it should be guaranteed by the value of the assets under the financing item as well as its repayable assets.
The basic condition for repaying loans on the schedule is
where the first item on the left is debt repayment with the financing project’s own assets, and , the second is that the enterprise is guaranteed by its solvency assets and . Since it is impossible to determine the extent of the loss of assets under the financing item during the financing period, considering the extreme circumstances, all the assets under the financing project are lost, the enterprise has to make the repayment with its own repayable assets. For the bank, it is the most basic requirement that . In this paper, the ratio of the financing amount of node to the repayable assets is defined as the financing ratio , which is expressed as , and . This variable can be used to describe the extent of credit granted by banks to core enterprises and their small and medium-sized enterprises when conducting supply chain financial activities. The greater the value, the higher the level of credit evaluation of the financing group. Correspondingly, the larger the scale of the bank’s financing business, the higher the expected income, and vice versa. At the same time, this variable can also describe the risk of nodes being infected by credit default events in the network. The higher the value, the more susceptible to infection. Upon further analysis, there are nodes in the network, assuming there are core nodes, SME nodes, where . The sum of the financing-related amounts of the core nodes is the sum of the financing-related amounts of the SME nodes, which can be derived as below:
where we have . There are many enterprises in the supply chain finance network and enterprises with similar status have few differences. To simplify the model, it is assumed that commercial banks have no difference in the credit assessment of SMEs in the supply chain finance network, giving them the same financing status. The same financing ratio (rationing financing quota) and also the same treatment for multiple core enterprises, and the same financing ratio (rationing financing quota). Then Formula (2) can be converted into: , that is,
If the sum of the debt-payable assets of the SMEs is greater than the sum of the debt-payable assets of the core enterprise, the financing ratio of the SMEs is less than the financing ratio of the core companies, and vice versa. In particular, in order to simplify the model, assuming that the sum of assets of small and medium-sized enterprises is equal to the sum of assets of the core enterprises, all enterprises in the network have the same financing ratio, which is defined as the general financing ratio and is expressed by . The advantage of this analysis is that it can not only describe the impact of financing behavior during the diffusion of supply chain finance credit risk, but also does not make the model too complicated.
Assume that the probability of transmission of credit risk in the network is , and 0<<1. The density of infected individuals at time is . When the time tends to infinity, the steady-state density of infected individuals is . Since the scale-free network is a non-uniform network, the degree of each node in the network is not the same, and the node degree reflects the number of potential objects that the node may infect or be infected in one infection. The definition of relative density is the proportion of nodes with degree k at time t in the entire supply chain finance network and represents the probability that a node with node degree of is infected at that moment, then the health probability is [17]. There is a cure phenomenon in the network. The cure time is expressed in terms of , and indicates the interval between the health recovery after the node is infected. Obviously, the shorter the time interval, the soon the recovery of the node, and the weaker the effect of credit risk diffusion. The longer the time interval, the stronger the effect of diffusion will be, and the network cure will influence the contagion and diffusion of credit risk in the network through the variable of cure time.
Combined with the above variables, the probability of risk propagation is higher than the critical value of the propagation probability as the variable to measure the occurrence of credit risk diffusion. The density of infected nodes and the speed of credit risk diffusion are taken as the variables to measure the impact of credit risk diffusion on the network.
The above analysis describes the basic process of credit risk diffusion in the supply chain finance network. The general financing ratio and node degree will have a positive relationship with the emergence of the credit risk contagion, and the cure time will be reversed to the annihilation of the credit risk contagion. Synthetically analyzing the content, we can get the average field equation of the credit risk diffusion degree of the supply chain at .
where the steady-state of is . The first item on the right side of the equation is the density of the individuals returning to the healthy state S in the credit risk diffusion process, which is the annihilation term of the credit risk, and the second item is the increase in the density of the infected individuals caused by the credit risk infection in the network, which is the generation item of the credit risk. The degree of node (k) in the supply chain network has a certain impact on the spread of credit risks. The greater the k, the easier the credit risk passes to the neighbor nodes.
represents the probability of a connection between any given edge and an infected node in the network, , and , the average node degree is , is the distribution probability value for a node of degree .
Computing the of the stable state and making the right end of the equation equal to 0
Obviously, corresponding to any is an increasing function about , , and . Correspondingly, the density of the infected individuals in the steady-state network is an increasing function of , , and . Structure, general financing ratio, and cure time all positively affect the risk propagation threshold.
The steady-state can be expressed as
With Equations (5) and (6), we have
In general, the traditional metric of vulnerability is the percolation threshold [29]. To reflect the critical condition of credit risk contagion and diffusion in the network, we defined as the critical value of the risk propagation probability in this study. After calculation, we can get the following
In a BA scale-free network, , , and , Assume that the maximum node degree in the network is . When the network approaches infinity, approaches and , the critical value of infection can be expressed as
It can be seen that the four variables such as the general financing ratio , network structure , cure time and network size will affect the critical value of the probability of credit risk propagation, and all of them are inversely related.
Based on the above system dynamics model, the following judgments can be made in Table 1: Take “+” as the positive influence, “−” as the reverse influence, “unknown” as an unjudged situation.
4. Simulation Result and Discussion
4.1. Algorithm Design
- (1)
- Generating basic network model, = 1000, .
- (2)
- Random selection of a node as the initial infected node in the network.
- (3)
- Find out the suspicious nodes of infection connected to the infected nodes, determine the number of infected nodes in its neighbors and calculate the impact, compare with the risk threshold of the enterprise, and finally determine the new node at this moment. Suppose that the state of the node is represented by (0 or 1), where represents the node as a healthy node, and represents the node is an infected node. Referring to previous research literature, the impact on enterprise nodes can be expressed aswhere , represents the connecting edge between node and node , means that the nodes are directly connected, otherwise it is 0. αi represents the number of nodes that have been infected in the neighbor nodes of suspicious infected nodes. The larger the number, the greater the impact on the enterprise, which is similar to the situation of the credit risk diffusion in the network of supply chain finance in reality. This indicator is related to the degree of the node. Generally speaking, the greater the degree of the node, the larger the value of this indicator. βi describes the external impact of enterprises, which can be used to refer to the enterprise loss in supply chain financial networks caused by external credit risk contagion. The enterprise’s risk threshold reflects the ability of the company to resist credit risk. Combined with the analysis in the above model, the risk threshold of node can be set as :represents the assets under the financing project left behind after the company has suffered some normal or unpredictable losses in its normal production and business activities. Its existence describes the risks originating from the company itself. According to the setting above in which is a random value, is then also a random value. Here for ease of analysis, it is assumed that is referred to in the model as a randomly generated value.
The initial value of the initial general financing ratio is 0.8, and the initial risk propagation probability is set to 0.5
- (4)
- The cure time of the enterprises in the network is and the initial setting is = 2.
- (5)
- When an infected enterprise appears in the network, it will be infused repeatedly according to the above procedure until the stable state of the network is reached and the time set in the simulation is 40-time steps.
4.2. Analysis of Simulation Result
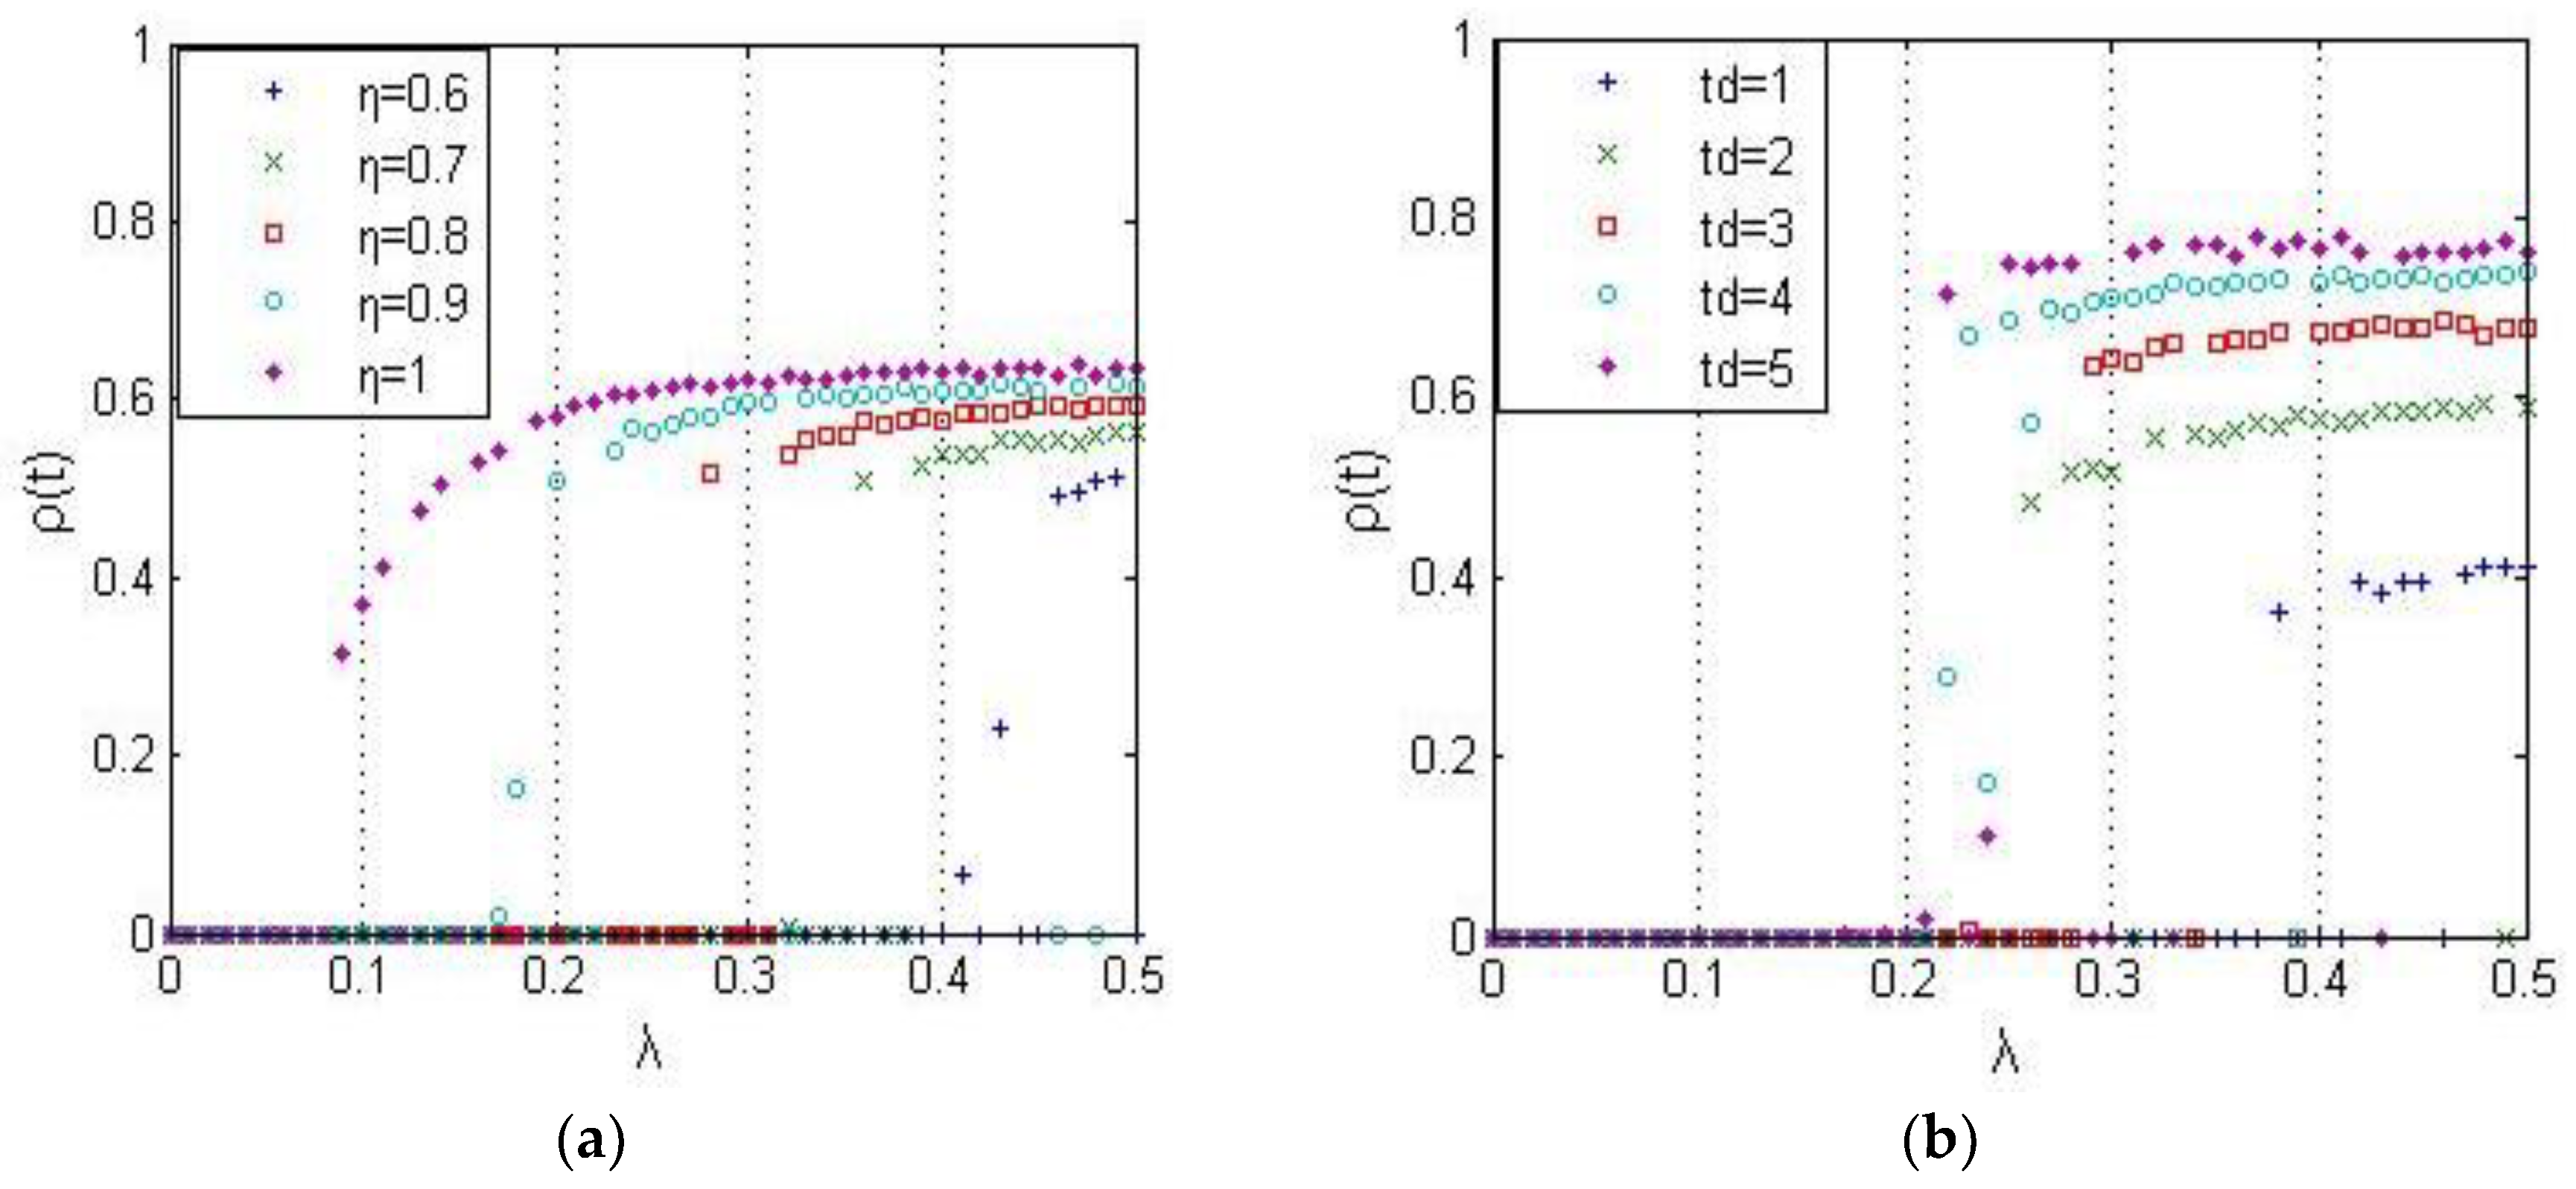
The influence of influencing factors on the critical value of risk propagation probability: under the premise of the basic parameters of the network, the risk propagation probability λ is changed from 0 to 0.5, and the step length is 0.01. The simulation results are shown in Figure 3.
The probability of risk propagation depends on the strength of the relationship between enterprises. The higher the strength of the relationship, the higher the probability of risk propagation. Only if the probability of risk propagation reaches a certain level does the spread of credit risk will occur. This particular level is the critical value of the risk propagation probability. The higher the critical value of risk propagation probability, the less likely the network is to spread credit risk, and vice versa. Therefore, the critical value of the risk propagation probability can be used to describe the vulnerability of the network.
From the simulation results, we can see that the greater the general financing ratio , the higher the liability that the enterprise has to bear, and the lower the threshold value of risk propagation probability. Once a credit default event occurs, it is easily infected. The critical value of the risk propagation probability of is larger. When , the cure time has no obvious regular effect on the critical value of risk propagation probability, which indicates that the cure time does not change the vulnerability of the network itself. When , the diffusion event of credit risk does not occur, and with the increase of , the critical value of the risk propagation probability increases, but the difference decreases, which indicates that with the increase of , the network becomes more stable and the influence of the network structure on network vulnerability decreases. There is no significant correlation between the network scale and the critical value of risk propagation in a certain range, and the vulnerability of the network will not be changed obviously.
- (6)
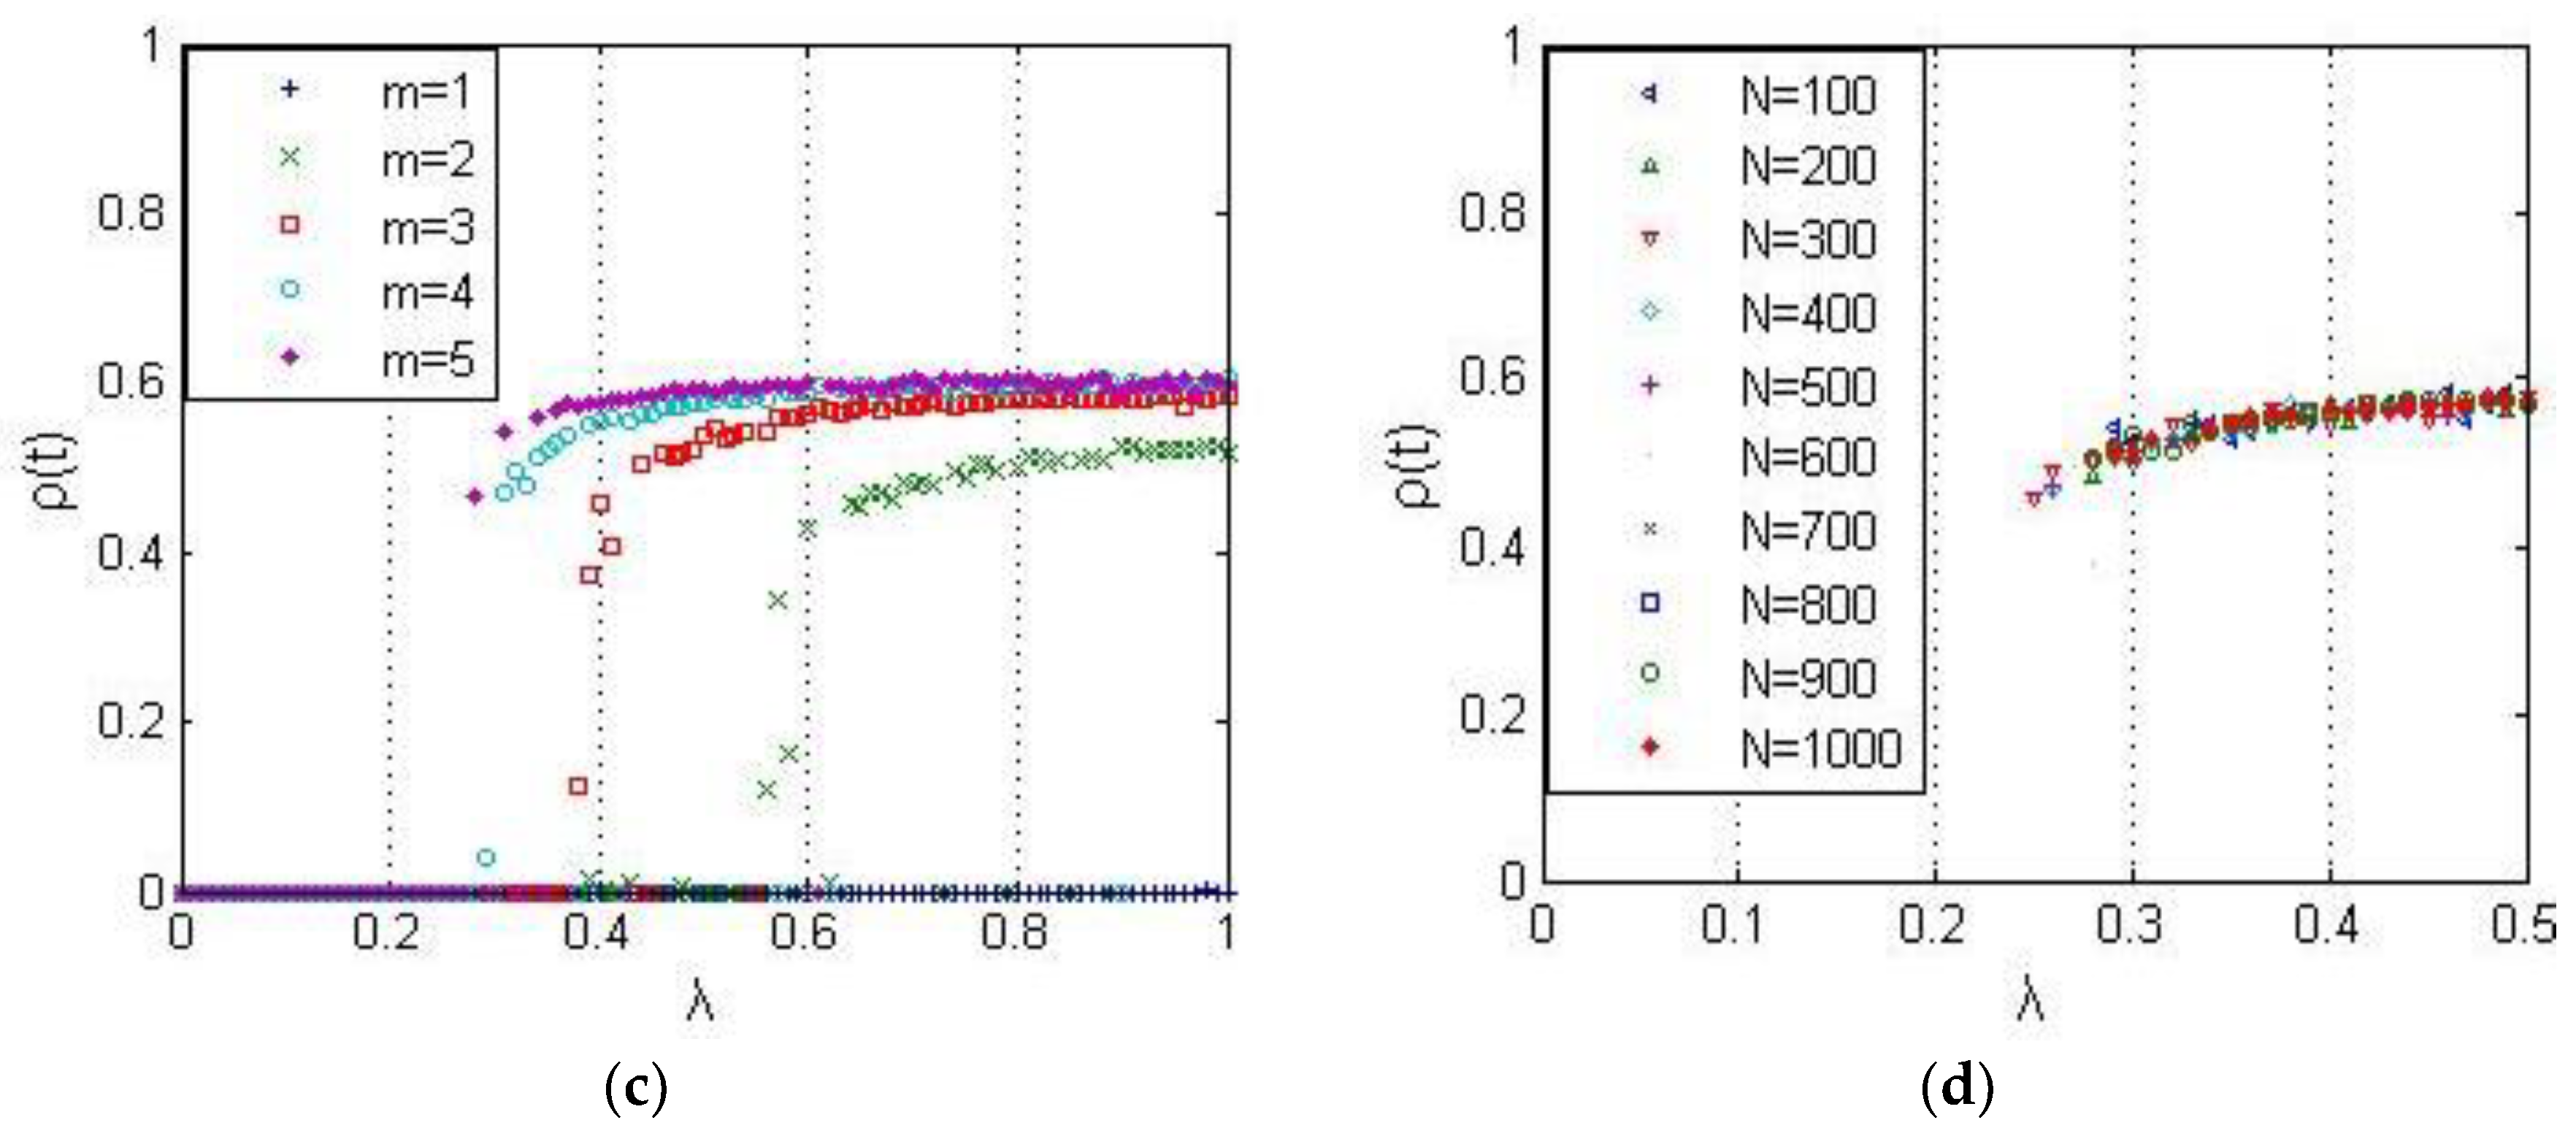
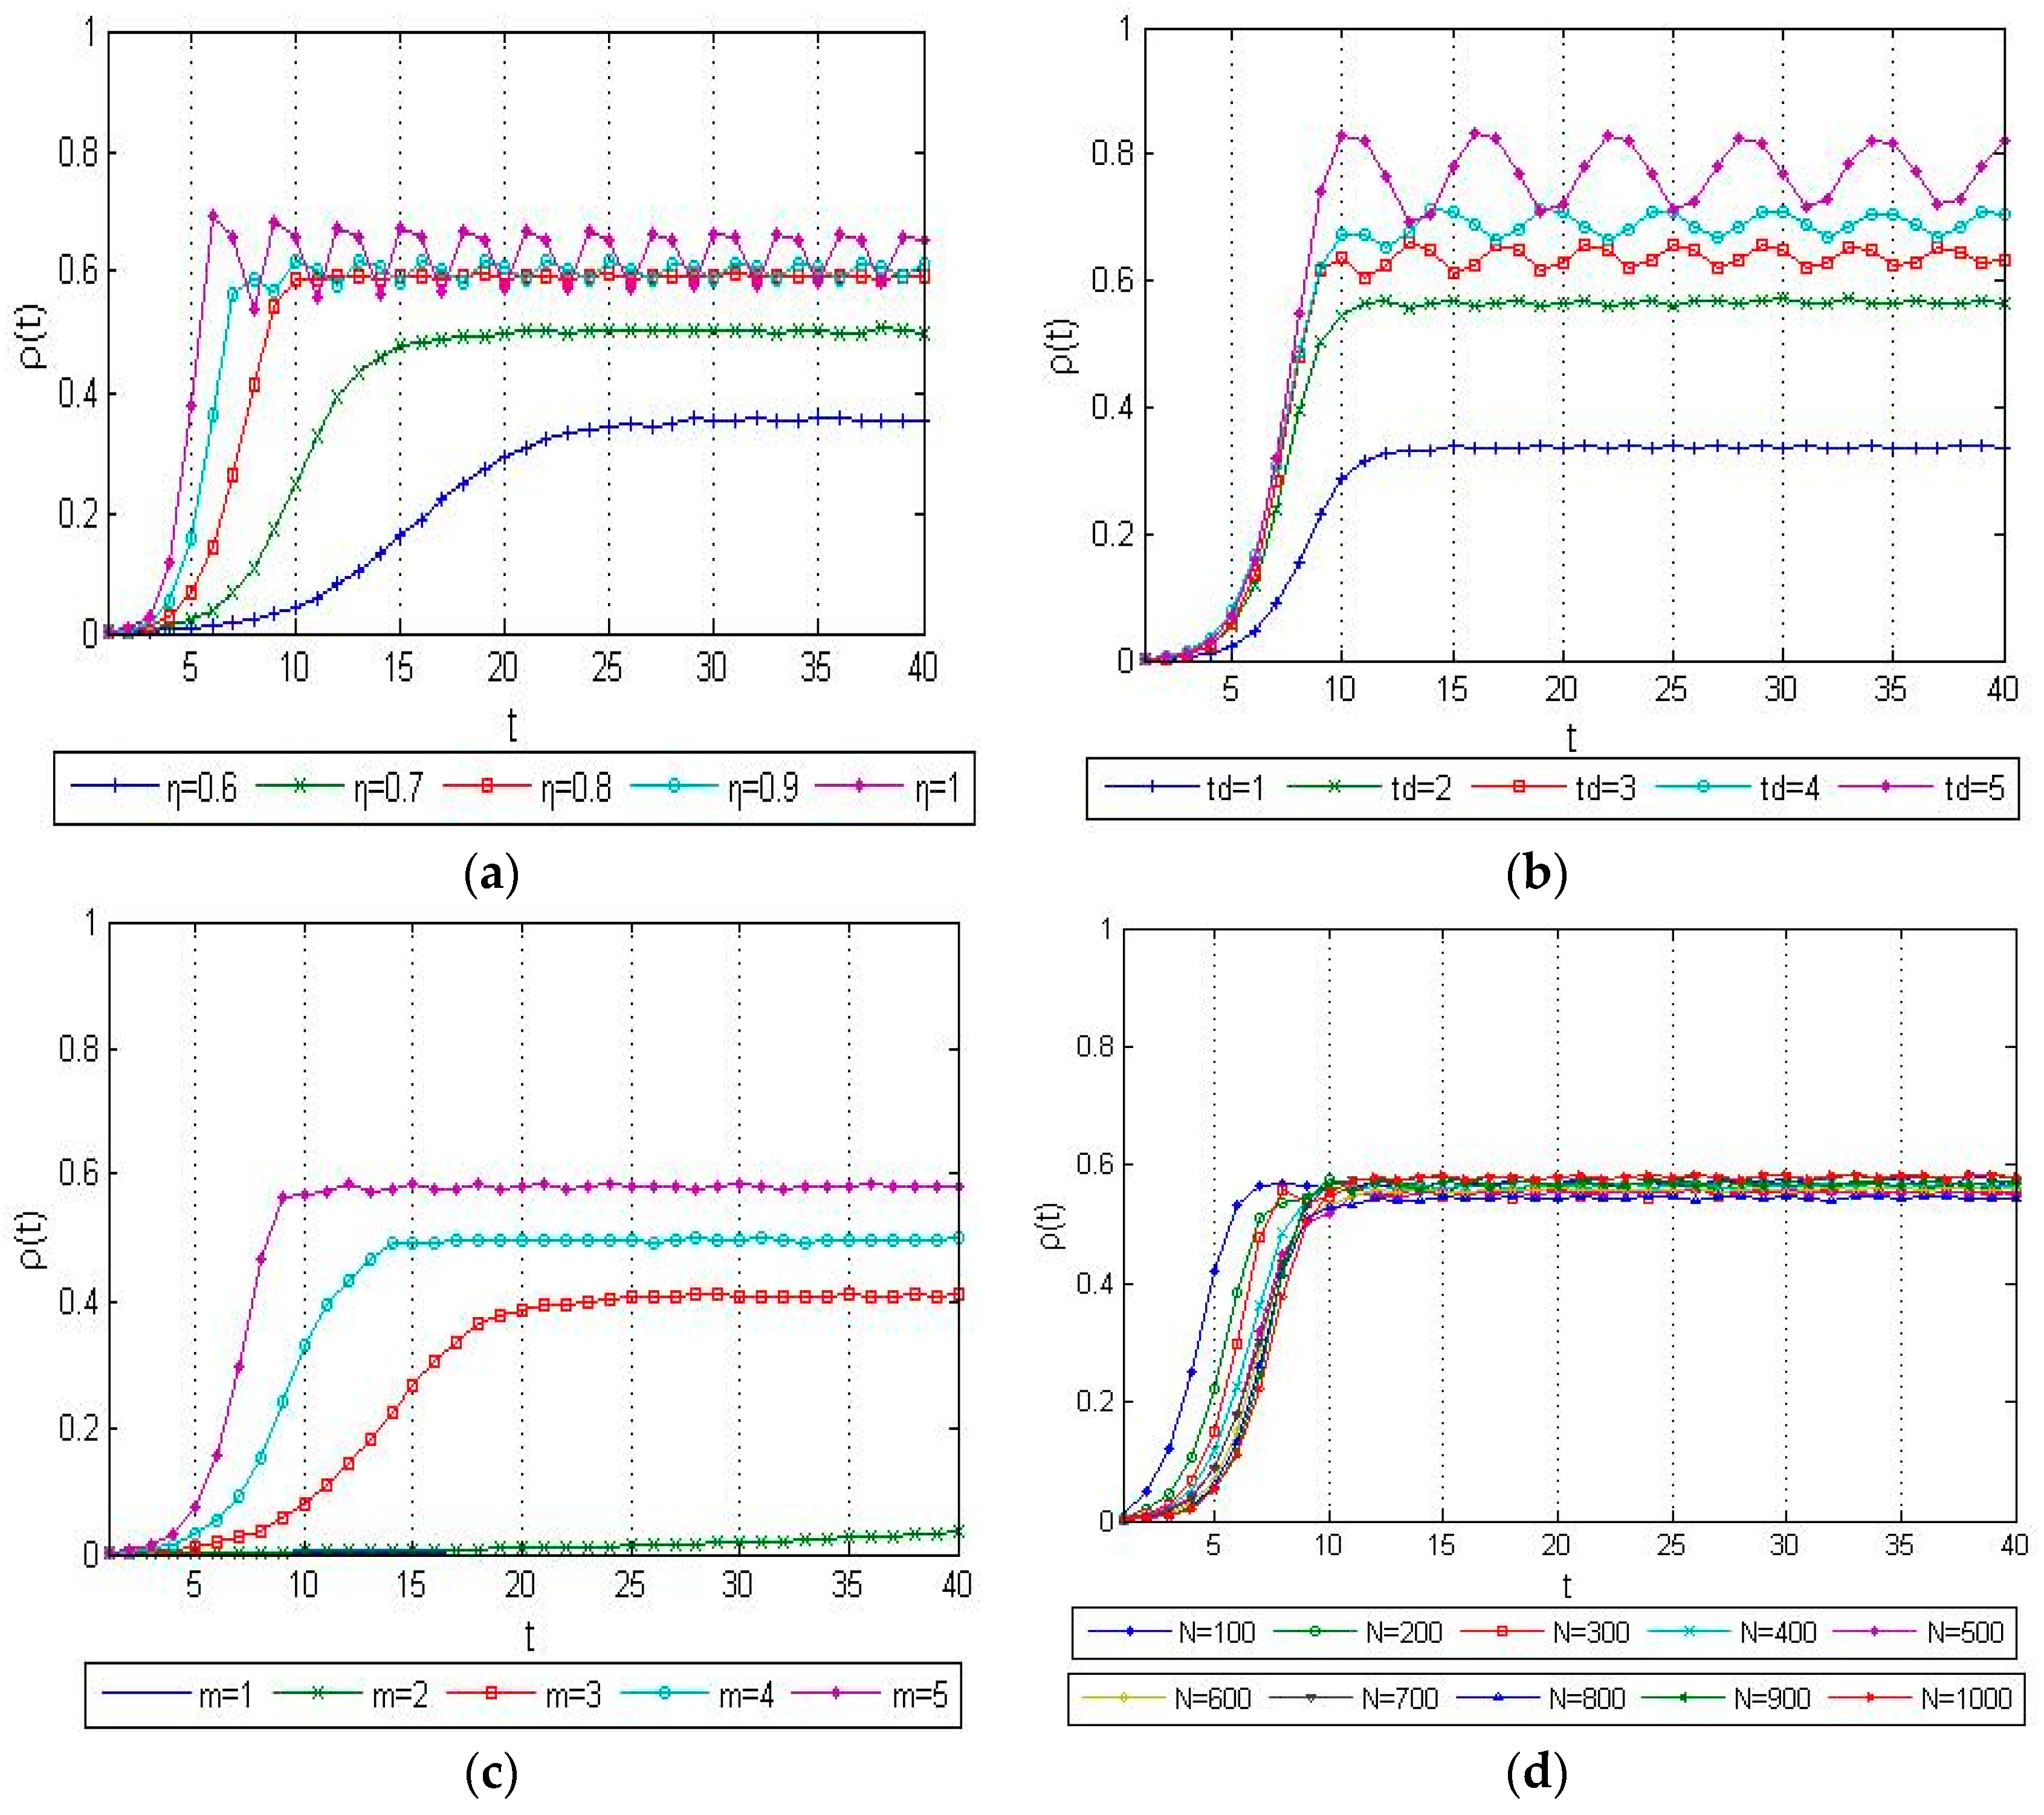
- The influence of influencing factors on the density of infected nodes in the network: Changes are made under the premise of the basic parameters of the network and . The simulation results obtained within the range of 40 time steps are shown in Figure 4.
The simulation results show that the density of the infected nodes in the steady-state can be obtained directly from the diagram, while the speed of the credit risk diffusion is measured by the time taken when the diffusion of credit risk tends to be stable. The higher the general financing ratio , the greater the credit risk density at the steady state, the shorter the time to reach the steady state, and the faster the risk diffusion rate. The longer the cure time , the higher the infective density of credit risk in the steady state. In the short term, a rapid cure will significantly inhibit the diffusion of credit risk, and the cure time does not significantly affect the speed of credit risk diffusion. The larger the network structure , the higher the density of credit risk in the steady state, the shorter the time to reach the steady state, and the faster the risk diffusion rate. There is no significant relationship between network scale N and the infection density of credit risk and the speed of credit risk diffusion in the steady state.
Collate the simulation results in Table 2. The “+” refers to the positive effect, and “−” refers to the reverse effect in Table 2.
According to the simulation results mentioned above, we can obtain the following details: (1) the general financing ratio and network structure will negatively affect the critical value of credit risk propagation probability so that the vulnerability of the network will be enhanced, and the network will be more vulnerable to credit risk infections. (2) The network scale of a supply chain finance network has no significant influence on the credit risk diffusion process. (3) The effect of cure time on credit risk diffusion is only reflected in the density of infected nodes in the steady state, but does not affect the vulnerability of the network and the speed of credit risk diffusion.
4.3. Further Simulation Analysis
4.3.1. Selection of Initial Infection Nodes
Change the infection strategy to carry on the further simulation analysis of the original credit risk infection process. Here we will discuss the influence of the initial infection nodes with different node degrees on the infection density of the network in the steady state. The basic parameters of the network are set to N = 1000, , m = 5, the general financing ratio is 0.8, the cure time is , and the probability of credit risk propagation is 0.5. The simulation results are shown in Figure 5.
It is shown from the figure that the density of the infected nodes in the steady-state is almost the same with the increase of the node degree of the initial node, and the density of the infected node is in a straight line. This means that the node degree of the initial infected node does not affect the density of the infected node in the network at the steady state.
According to the simulation results, for the general supply chain finance network, no matter what kind of status the initial infected node occupies in the network, it cannot ignore its credit default. When the bank manages the risk of supply chain finance, it cannot ignore the event of a default by the small-scale enterprise, it must promptly adopt relevant countermeasures to prevent the diffusion of credit risk in the network.
4.3.2. Different Cure Strategies
To study the effect of different cure strategies on the density of infected nodes in the steady-state network, assuming that the network’s healing ability is limited and each step can cure only a limited number of infected nodes, the number of curable nodes at each time step is randomly given by the simulation system. In strategy 1, the nodes in the network are treated first, that is, with limited capacity, the nodes with a large number of nodes are first cured. In strategy 2, the nodes in the network are randomly cured, that is, the nodes that are curable are randomly cured under a limited capacity. Strategy 3 takes the set in the original simulation experiment to cure the infected node at a fixed time as a comparison item. The basic parameters of the network are set to N = 1000, , m = 5, the general financing ratio is 0.8, the cure time is , and the probability of credit risk propagation is 0.5. The simulation results are shown in Figure 6.
As shown in the figure, the effect of credit risk diffusion under the three cure strategies is different: for the density of the infected nodes in the network at steady state, strategy 3 is the smallest, strategy 1 is the largest, and strategy 2 is intermediate.
The above simulation results further verify the effect of the cure phenomenon on the credit risk diffusion process of supply chain finance and reflect the influence of the cure number and the importance of nodes at the same time. Among them, the curve difference between strategy 1 and strategy 3 reflects the effect of the cure number, the difference between strategy 1 and strategy 2 reflects the importance of the cure node, and the difference between strategy 2 and strategy 3 is the sum of the two effects.
5. Case Analysis and Discussion
In the above, a general supply chain financial credit risk diffusion model is constructed and the effects of influencing factors through simulation are estimated. This section will apply the above model and simulation method to analyze the actual case. The case in Section 5 is a special case of a supply chain financial network with only one core node in the network. Compared with the general simulation network in Section 4, the real case has unstable characteristics. The main purpose of the case study is to test whether the supply chain financial network can meet the general characteristics in the simulation model in the extreme condition. This paper constructed the credit risk diffusion model based on a real case to explore the impact of different initial infection points and cure strategies on risk diffusion. Notably, the analysis in this section follows Hypothesis 1 to Hypothesis 4 as that in Section 4. This hypothetical environment approximates the basic elements of the real supply chain network and provides a relatively reasonable evolution condition.
5.1. Case Description and Variable Assignment
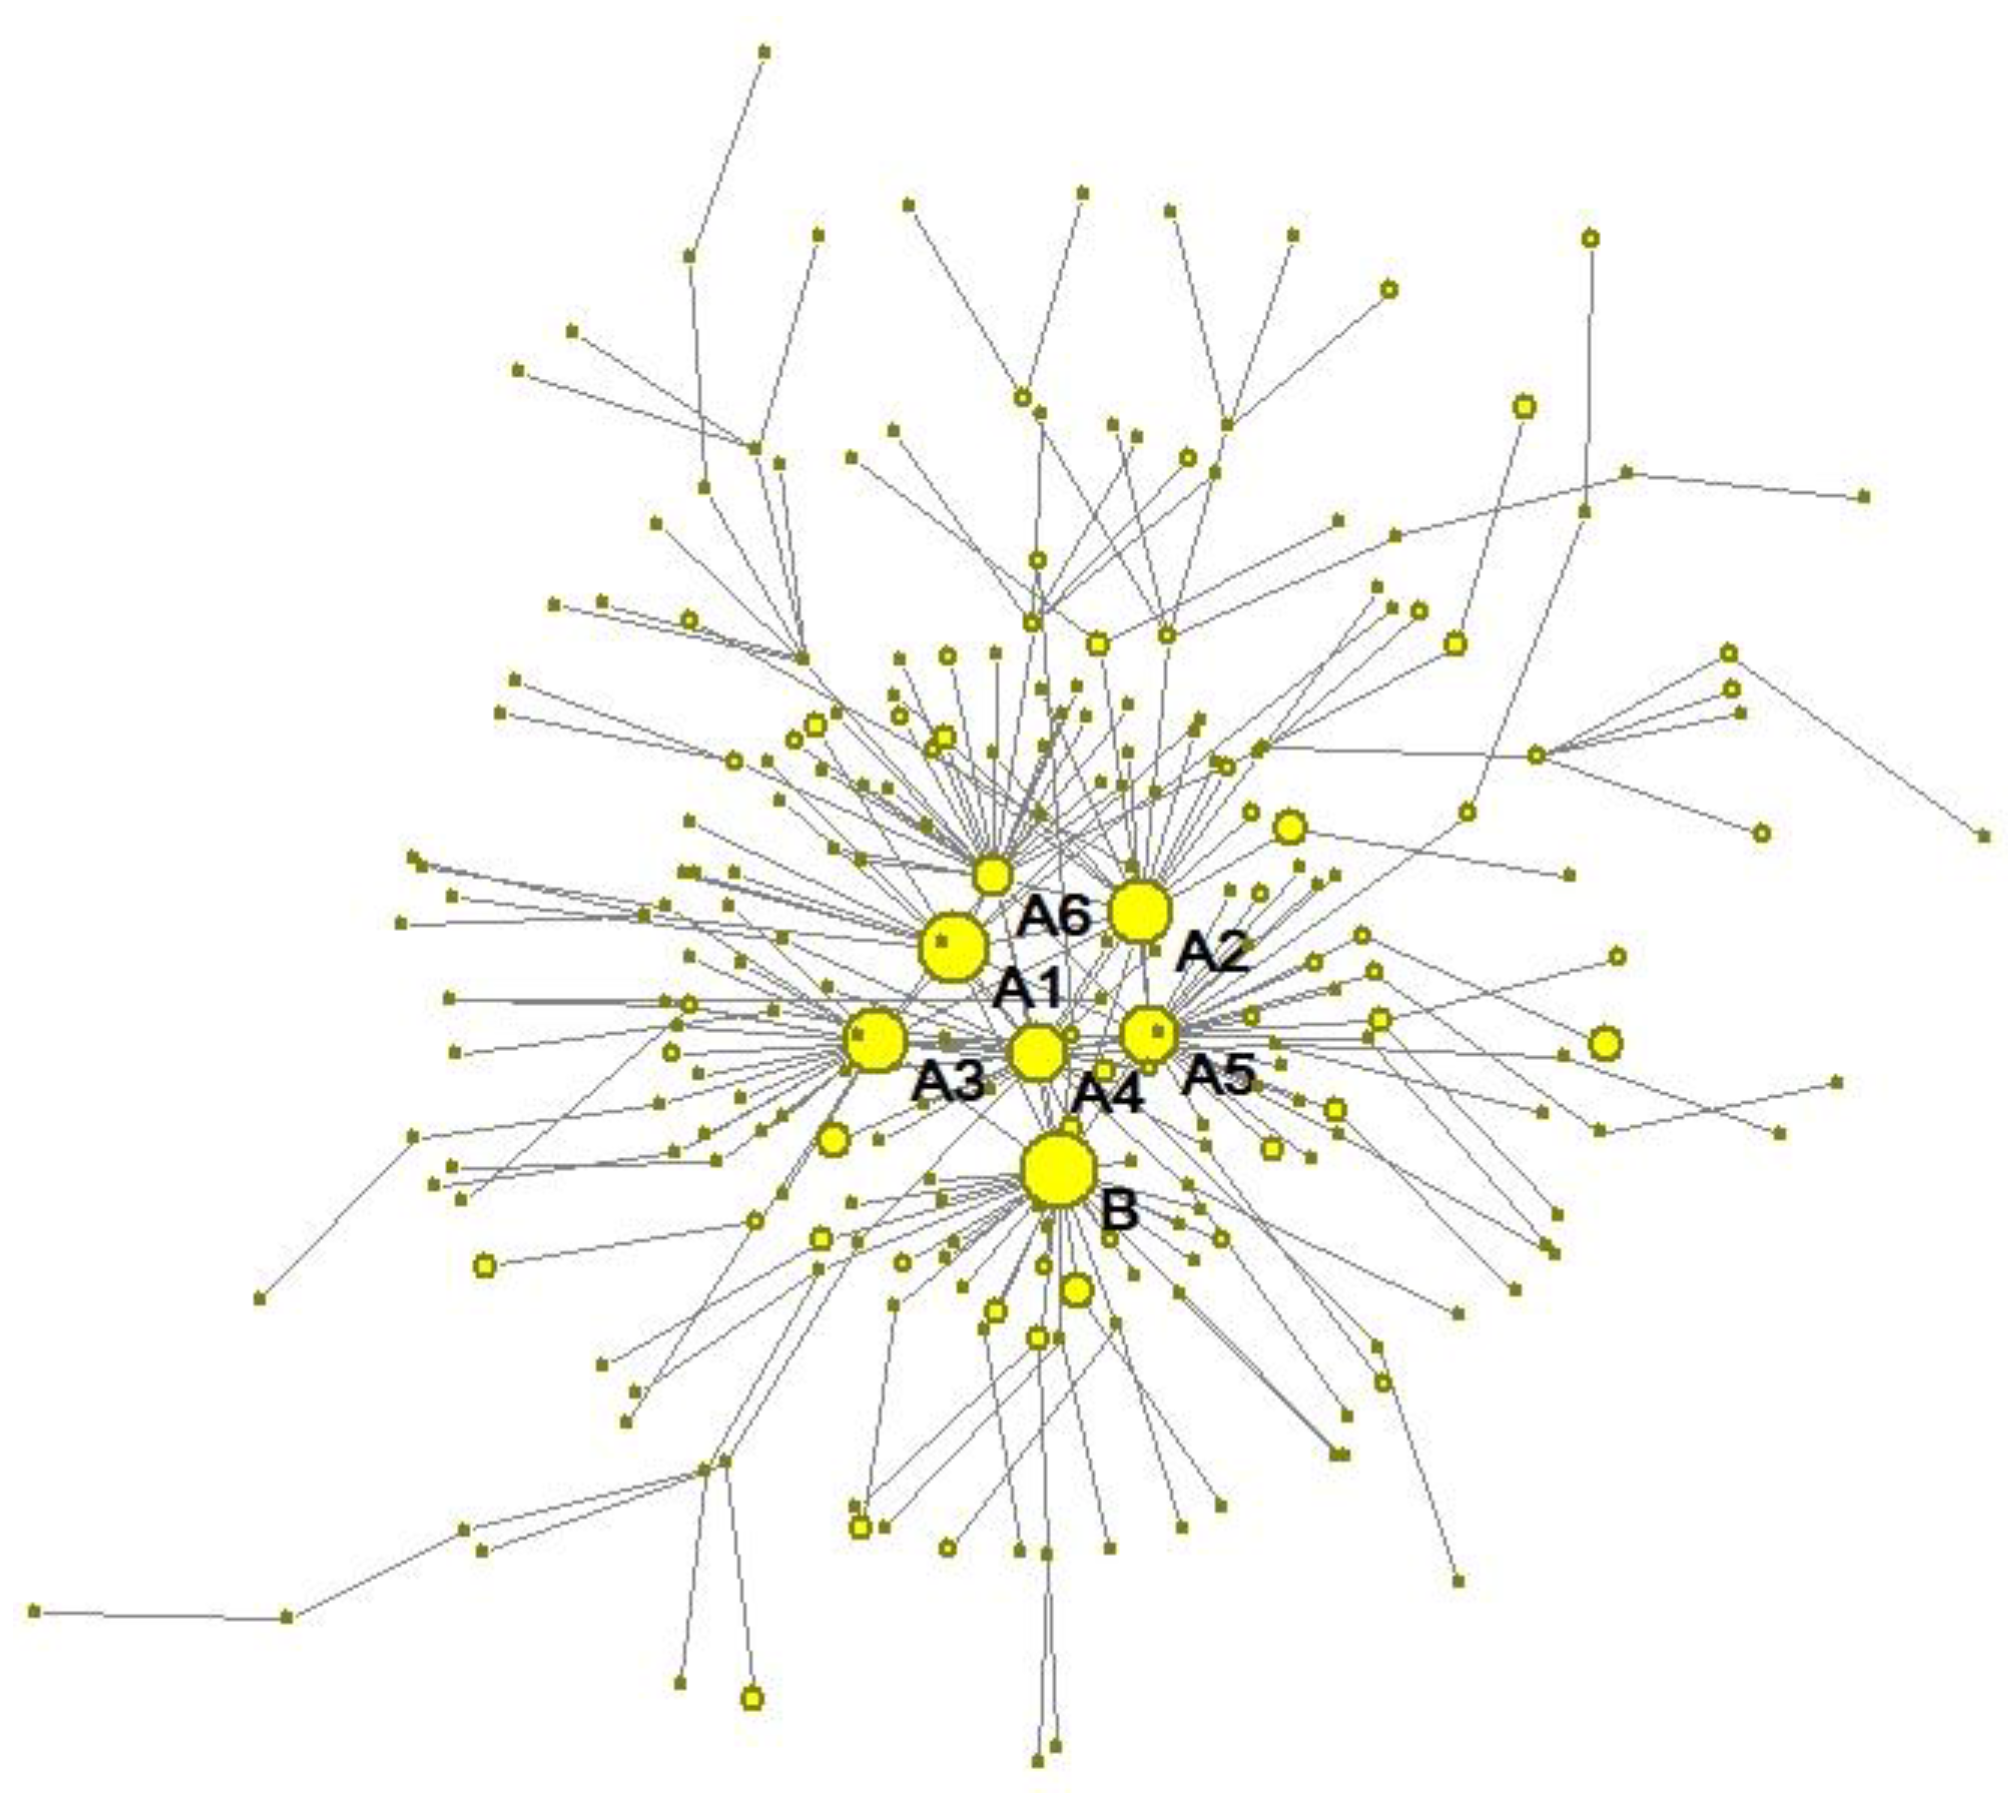
Bank A provided financing services for the powerful B supermarket and its upstream suppliers. Eventually, 245 suppliers were selected as the credit target group and divided into A, B, and C credit levels. The evaluation criteria are sales experience, channel control capabilities, and corporate sales capabilities. There are 6 A-level suppliers, 33 B-level suppliers, and 206 C-level suppliers. Credit rules of bank A are divided into non-pledged credits and mortgage credits. The amount of non-negotiated credit is 60% of the funds used by suppliers. Mortgage rates in mortgage credits are divided into the following: the average residential mortgage rate was increased to 100%, and villas, stores, and the office mortgage rates were increased to 80%, and the land and plant mortgage rates were increased to 70%.
According to the above introduction, if the financing limit is not considered, assuming that the enterprise can carry out mortgage financing except for the assets under the financing item, the variable assignment of the supply chain finance network can be determined as shown in Table 3.
5.2. Case Analysis
5.2.1. Construction of Supply Chain Finance Network
According to the above variable assignment, we used Matlab and Pajek to draw the supply chain finance network chart of enterprise B and its upstream suppliers, as shown in Figure 7.
5.2.2. Selection of Initial Infection Nodes
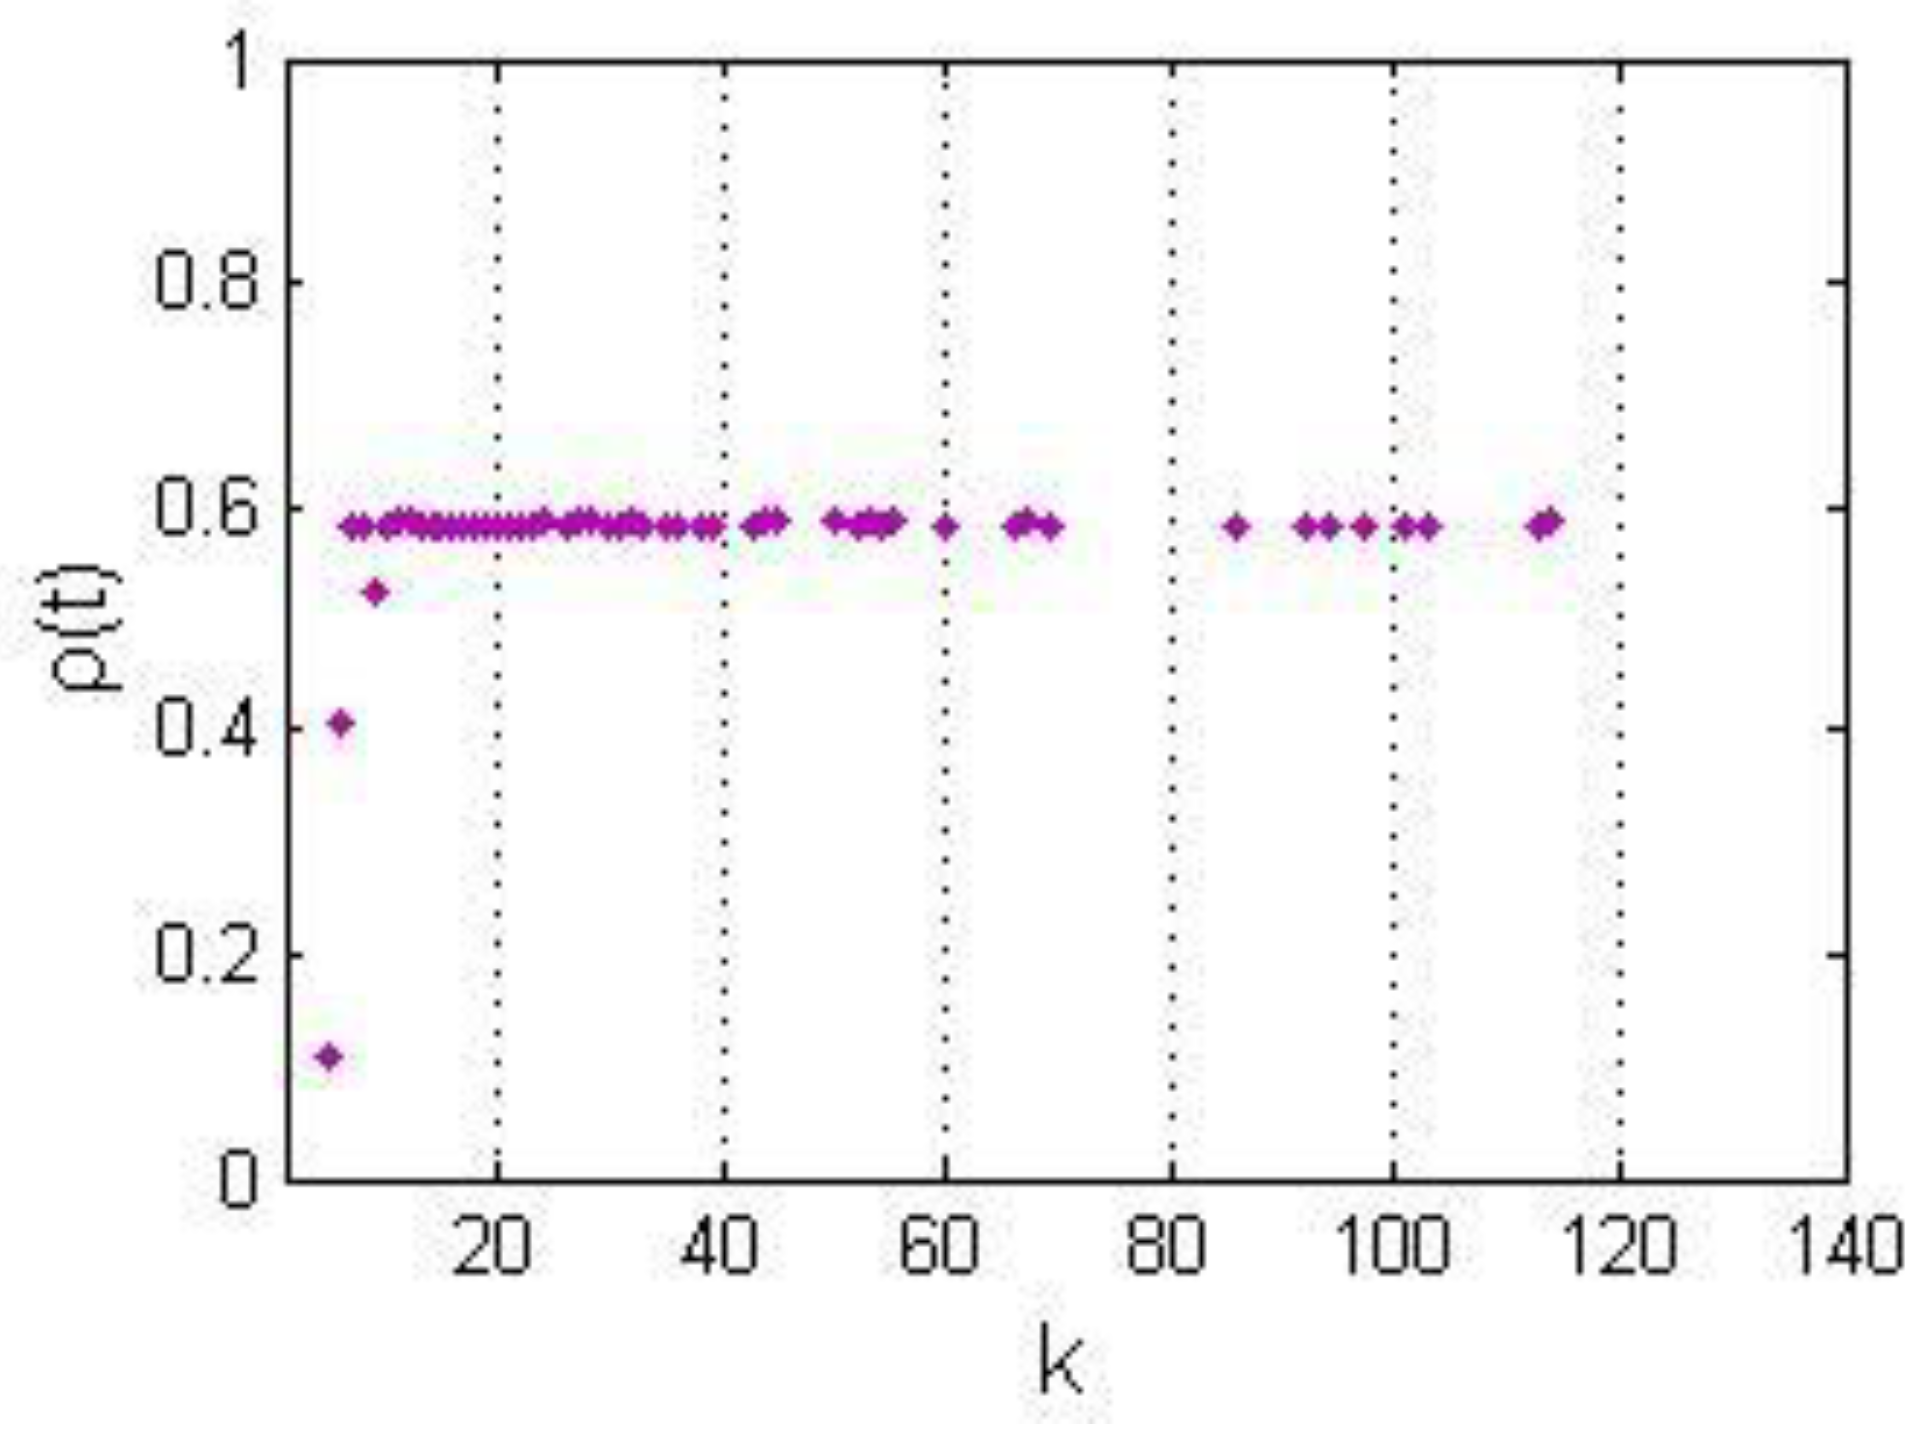
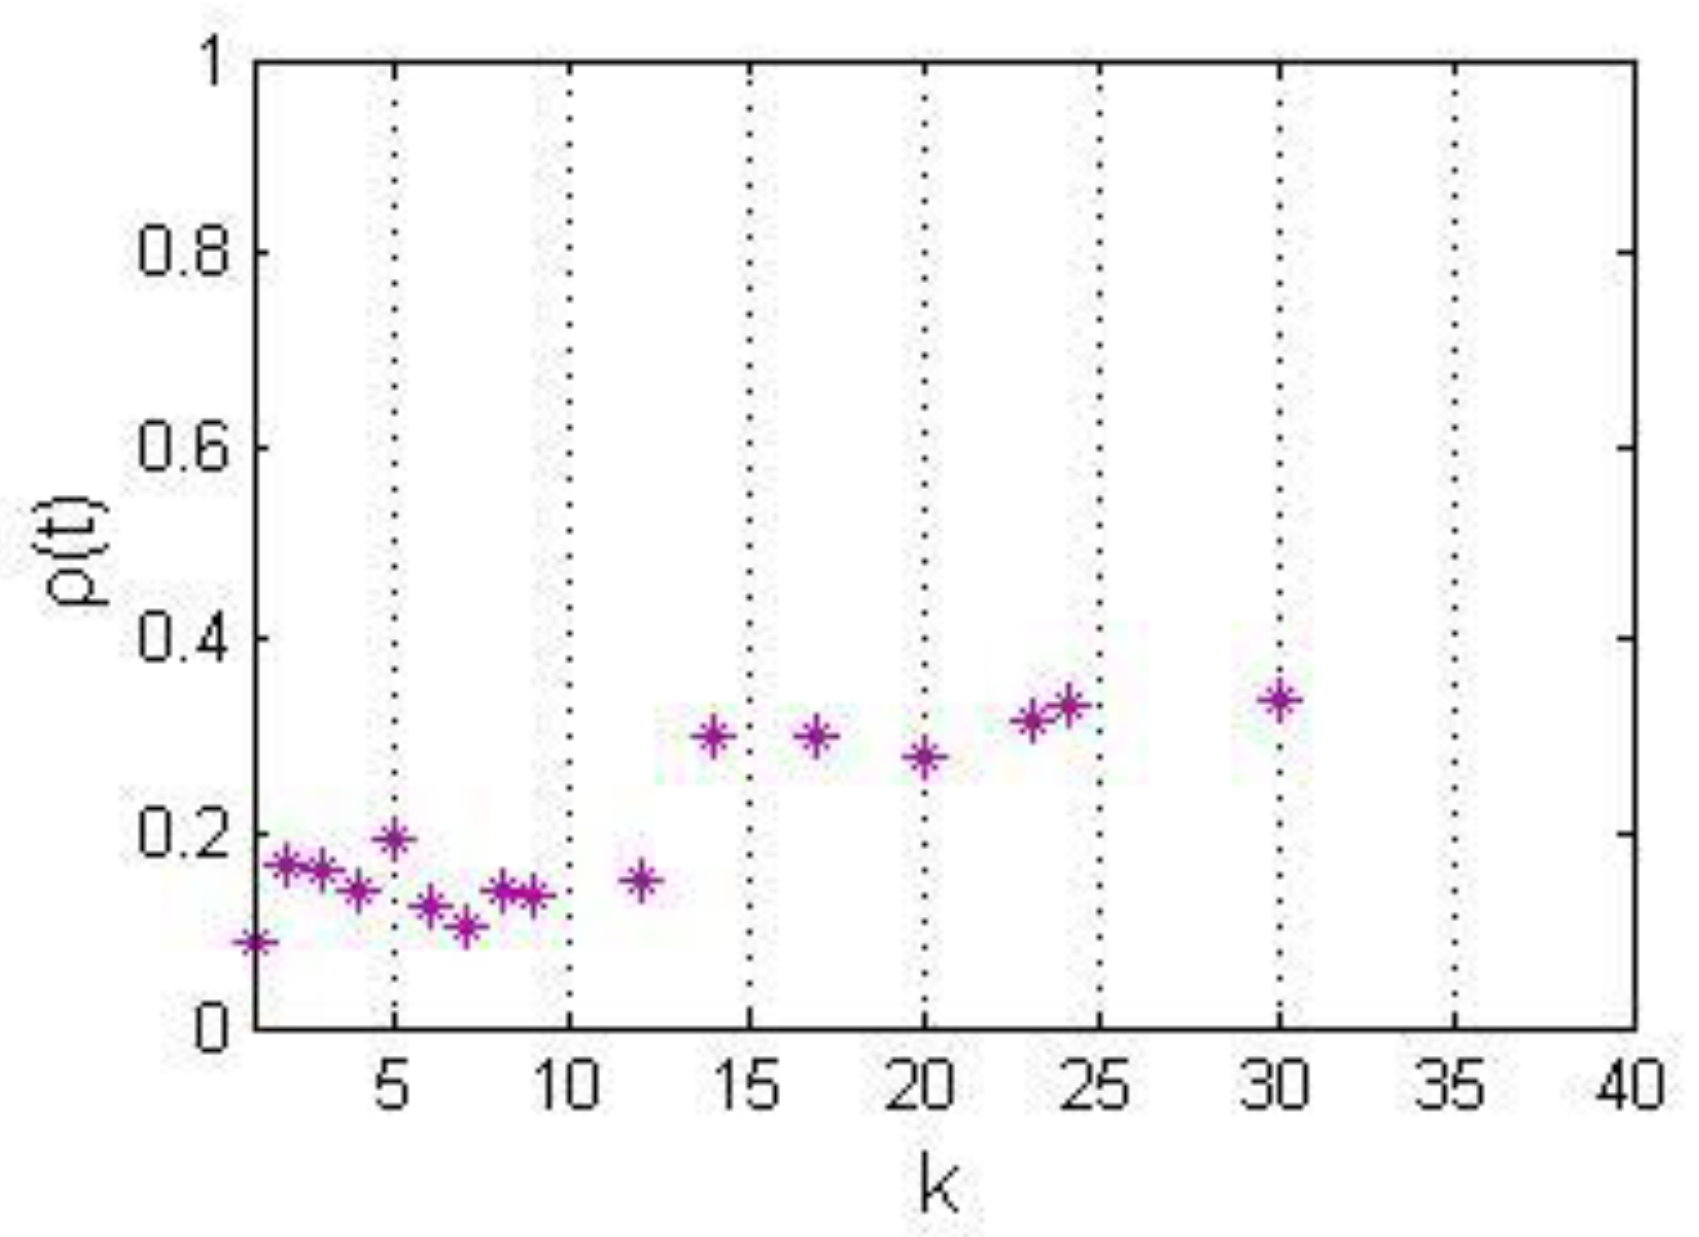
In this paper, the credit risk diffusion phenomena in three scenarios are simulated and analyzed. In the first scenario, enterprise B is selected as the initial infection point. In the second scenario, one of the six level-A suppliers is selected as the initial infection point. In the third scenario, we select a generic vendor node as the initial infection node. According to the above simulation results, in order to realize the credit risk diffusion, the probability of credit risk propagation is assumed to be 0.8, and the cure time is 5. The simulation results obtained are shown in Figure 8.
According to the analysis of the simulation results: in the case in which the nodes with a node degree in the range of 1 to 12 are the initially infected nodes, the density of the infected nodes in the steady-state of the network is approximately between 0.1 and 0.2. In the case where the nodes with a node degree in the range of 14 to 30 are the initially infected nodes, the density of the infected nodes in the steady-state of the network is roughly 0.3.
Compared with the analysis results in the general model, the simulation results of the actual cases satisfy the general characteristics within a certain range and, at the same time, show more uncertainty. Nodes with different degrees of nodes as the initial infection point will change the credit risk diffusion results of the network to a small extent.
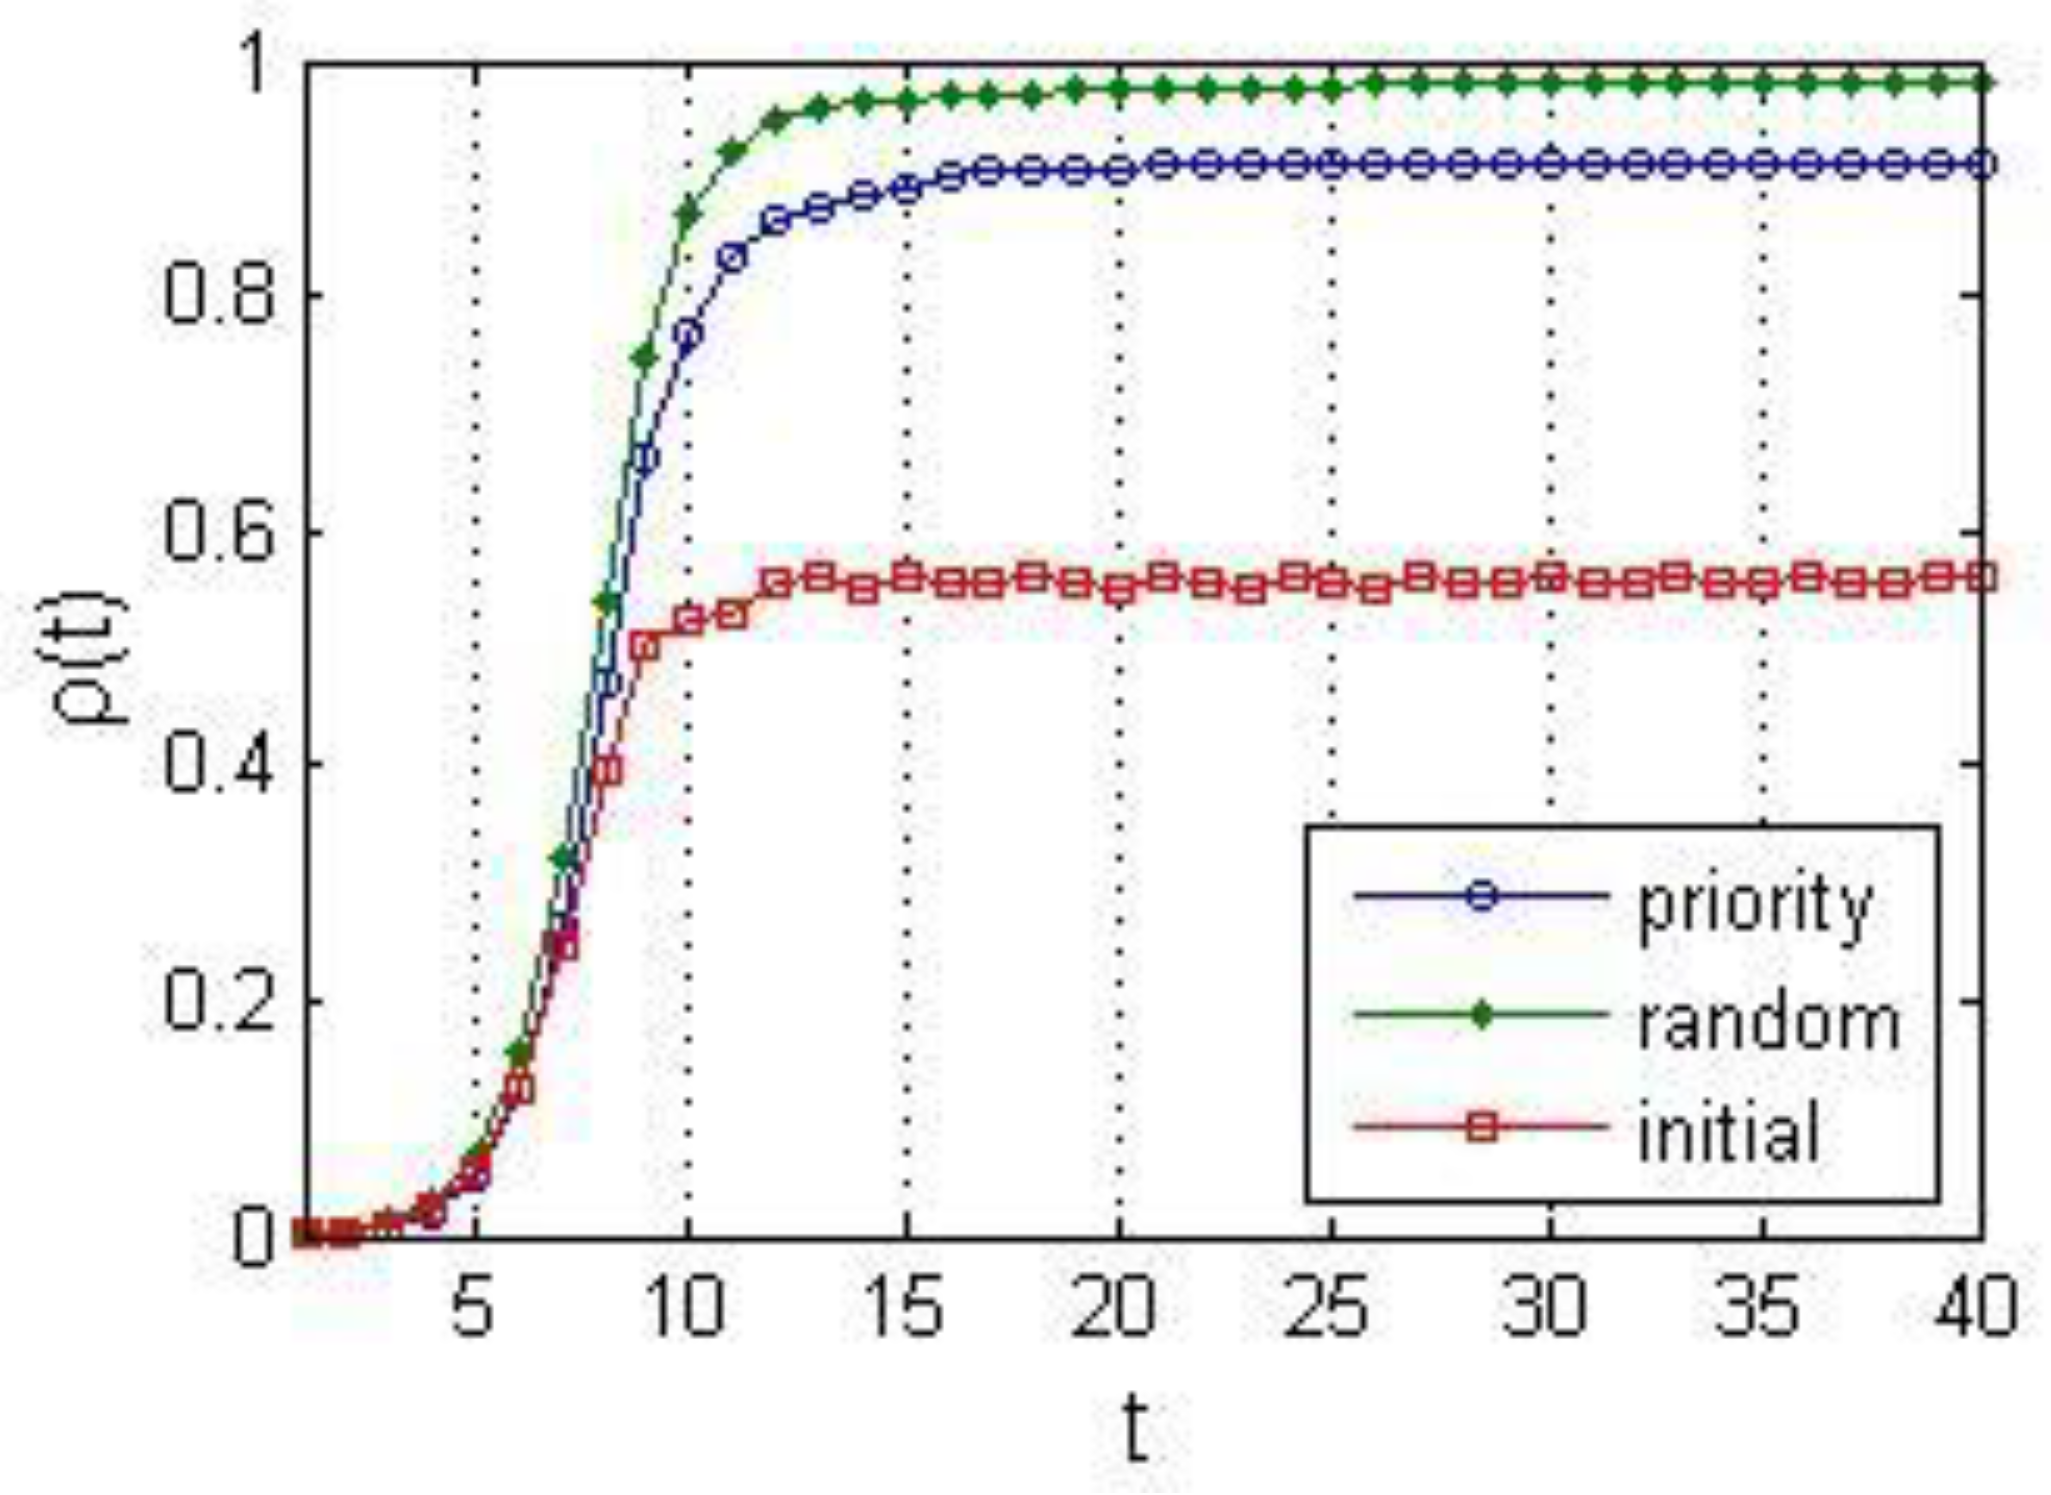
5.2.3. Different Cure Strategies
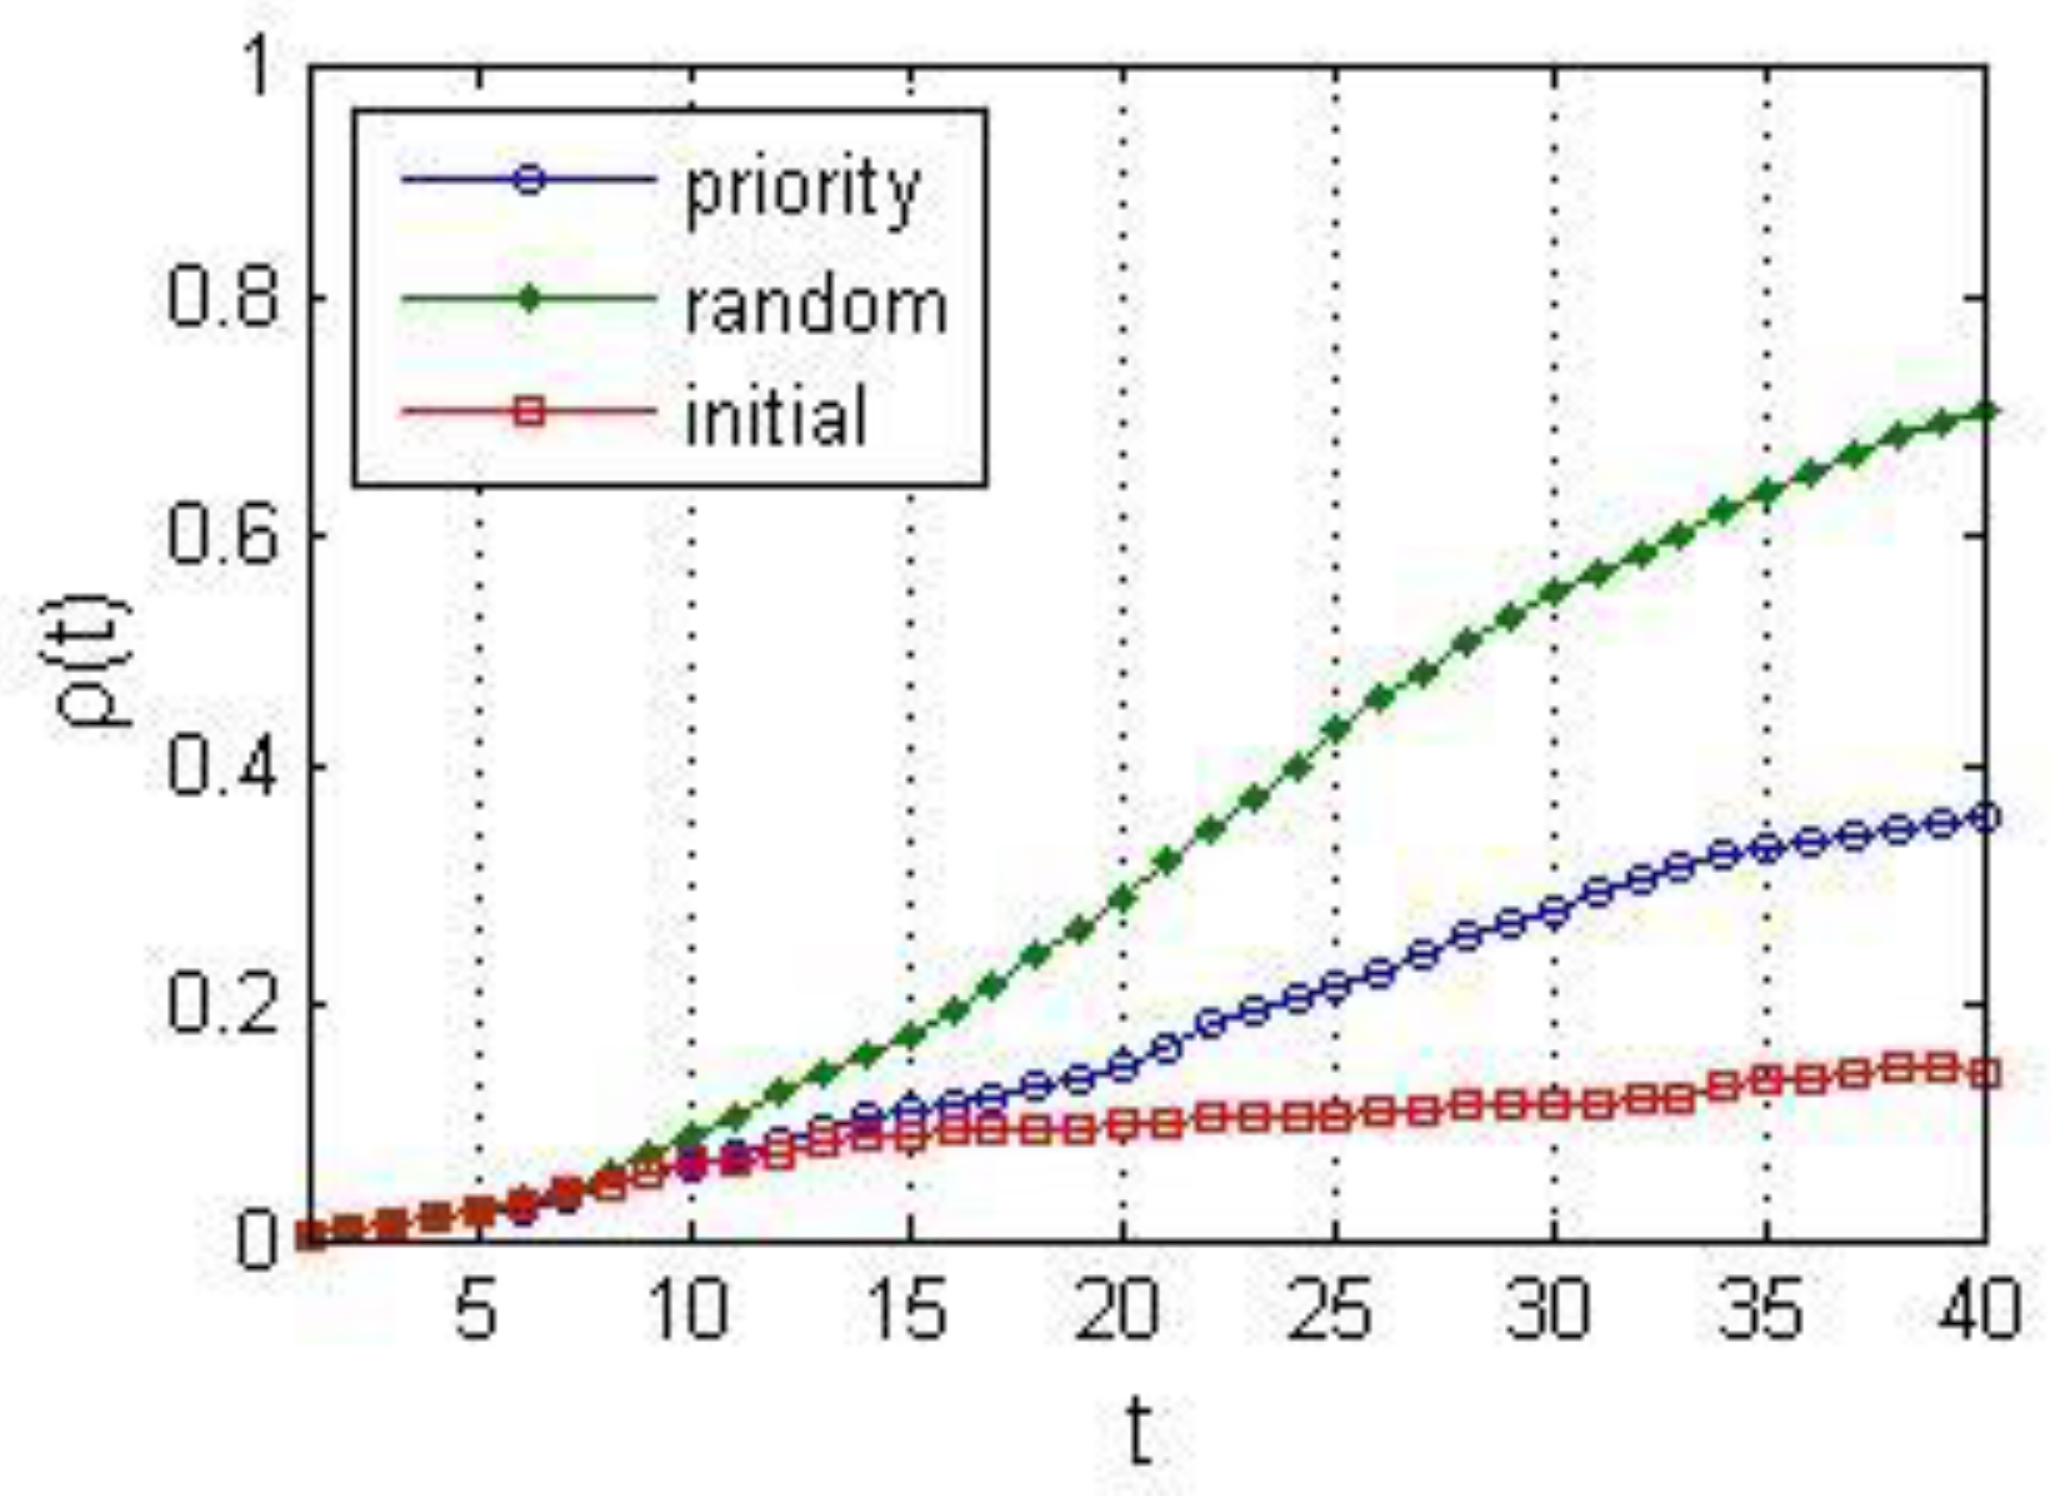
Assume that the credit risk propagation probability is 0.8 and the cure time is 5. Study the effect of different cure strategies on the network risk infection density and the limited number of cures at each step is randomly given by the system. Strategy 1: under the condition of a limited cure power, the priority will be given to cure the important enterprise nodes in the network. The importance is measured by the degree of node nodes. Strategy 2: under the condition of a limited cure power, the infected nodes are randomly cured; Strategy 3: follow the fixed cure time to heal all cure nodes. The resulting simulation results are shown in Figure 9.
According to the analysis of the simulation results: in the case in which the density of the infected nodes under strategy 2 is the highest, the density of the infected nodes under strategy 3 is the lowest, the density of infected nodes under strategy 1 is in the middle, and the difference of the speed of credit risk expansion is not clear.
Compared with the simulation results of the general supply chain finance networks, these cases can also reflect the number of cured nodes and the impact of the importance of the cured nodes on the credit risk diffusion: the curve difference between strategy 1 and strategy 3 shows the effect of the cure number. The difference between strategy 1 and strategy 2 reflects the importance of the healing node, and the difference between strategy 2 and strategy 3 is the sum of the two effects. It is notable that the cure strategy has an important impact on the spread of credit risk. In a certain time frame, in the face of the infected enterprise nodes in the network, the priority should be given to assisting enterprises with larger nodes, and the number of rescue enterprises should be increased as much as possible within the scope of capacity. These two rescue methods are efficient to curb the spread of credit risk in the network.
5.2.4. Discussion
Based on the hybrid model, the process of credit risk contagion and the effects of various influencing factors were visually observed. The results show the general financing ratio as an important influencing factor that not only affects the critical value of the probability o the f transmission of credit risk in the network, but also affects the density at the steady-state and the speed of the financial risks transmission. Although the cure time and network structure are less effective than the general financing ratio, these two factors cannot be ignored. In order to prevent the risk of supply chain financial credit, and to reduce the damage caused by this risk, this section puts forward the following suggestions.
For the financers such as banks, reducing the vulnerability of the network before credit risk diffusion is an efficient way for risk control. In detail, financers should carefully assess the credit level of the supply chain network, conduct strict inspections of the assets of the enterprise group, and pay special attention to the evaluation of core enterprises to avoid blindly striving for high profits in the industry. Besides, because of the tighter connections of the network and the higher vulnerability of the network, the business association between SMEs within the financing scope should not be too close. Thus, when making credit credits, banks should consider the intensity of the business transactions between small- and medium-sized financing groups and should not ignore the impact of small business credit default events on the network. Meanwhile, core enterprises should raise their awareness of risk prevention and cooperate with banks to become managers of credit risks. Because the effects of awareness including the contact, the local awareness and global awareness are key points to reduce the risk of infection in both continuous and dynamic networks [30,31].
Furthermore, in the supply chain financial network where credit risk diffusion has already taken place, it is crucial to control the extent of credit risk diffusion and the speed of credit risk diffusion. Banks need to restrict the financing of some nodes in the network to reduce the general financing ratio of the network, which can effectively delay the speed of credit risk diffusion in the network and can also reduce the harm degree of credit risk diffusion to a certain extent.
In addition, the government should cooperate with banks promptly to adopt corresponding policies to rescue key nodes that have been infected in the network to help them restore normal levels, thereby boosting the confidence of the financial network and effectively reducing the risk of credit risk diffusion in the network.
6. Conclusions
Through the above model analysis and simulation, we can find that the general financing ratio and the network structure influence the vulnerability of the network negatively, the density of the infected nodes, and the speed of credit risk diffusion in the steady state. The cure time has no significant effect on the vulnerability of the network and the speed of awareness credit risk diffusion, but positively affects the density of the infected nodes in the steady state, and the network size does not have a significant effect on the diffusion process of the credit risk in supply chain finance.
In further studies, it was found that the choice of the initial infection point of the supply chain finance network has no effect on the credit risk diffusion process. No matter what position the enterprise occupies in the network, if other conditions are unchanged, the density of the infected nodes in the network is the same in steady state, which means that banks can not ignore the credit default behavior of small and medium-sized enterprises in the network when carrying out the supply chain financial business. We should pay enough attention and take measures in time to avoid the spread of credit risk in the network. At the same time, by changing the cure strategy, it can be found that under the premise of the limited network cure ability, priority healing enterprises can effectively restrain the spread of credit risk and reduce the density of infected nodes in the steady-state network.
The simulation of credit risk diffusion in a supply chain finance network with only one core enterprise shows that it is difficult to spread credit risk in a too sparse supply chain finance network, and the process of credit risk diffusion is very volatile. Compared with the network with more core enterprises, its risk diffusion process is more uncontrollable so it is more difficult to predict the diffusion of credit risk. For this kind of supply chain finance network, banks can adjust other variables to improve their profit level, and at the same time, they should strengthen the management of these networks and raise the awareness of risk prevention.
However, there are also limitations that need further improvement in this study. Firstly, in this study, three contagion mechanisms including the direct relationships, the periodicity relationship, and the guarantee relationship were considered. The indirect relationships and awareness factor of different individuals were assumed to be non-existent. In further research, credit risks caused by external factors such as the macroeconomic condition and systematic risks should be taken into account. Besides, firms in the supply chain network are not distinguished in different industries and different sectors of the industry. It must be possible that different industries or sectors may meet different risk shocks. Thus, in further research, the risk propagation probability can be set by considering the features of different industries, or a weighted network can be constructed to distinguish different departments in the network.
Author Contributions
Z.Z. contributed to the conceptualization, methodology and results analysis; D.C. wrote the manuscript based on the idea; Z.Z. provided revision advices and contributed to funding acquisition. L.W. and C.H. contributed to the revision.
Funding
This research was funded by the National Natural Science Foundation of China (NSFC) (Grant No. 71771067, No. 71390522, No 70903018).
Conflicts of Interest
The authors declare no conflict of interest.
References
- Xiong, X.; Ma, J.; Zhao, W.J.; Wang, X.Y.; Zhang, J. Credit Risk Evaluation in Supply Chain Finance Model. Nankai Bus. Rev. 2009, 12, 92–98. [Google Scholar]
- Davis, M.; Lo, V. Infectious Defaults. Quant. Financ. 2001, 1, 382–387. [Google Scholar] [CrossRef]
- Jarrow, R.A.; Yu, F. Counterparty Risk and the Pricing of Defaultable Securities. J. Financ. 2001, 56, 1765–1799. [Google Scholar] [CrossRef] [Green Version]
- Giesecke, K.; Weber, S. Cyclical Correlations, Credit Contagion, and Portfolio Losses. J. Bank. Financ. 2004, 28, 3009–3036. [Google Scholar] [CrossRef]
- Jorion, P.; Zhang, G. Credit Contagion from Counterparty Risk. J. Financ. 2009, 64, 2053–2087. [Google Scholar] [CrossRef] [Green Version]
- Leung, K.S.; Yue, K.K. Counterparty Risk for Credit Default Swaps: Markov Chain Interacting Intensities Model with Stochastic Intensity. Asia-Pac. Financ. Mark. 2009, 16, 169. [Google Scholar] [CrossRef]
- Li, D.X.; Financial, A. The Valuation of Basket Credit Derivatives: A Copula Function Approach; AXA Financial: New York, NY, USA, 2000. [Google Scholar]
- Giesecke, K. A Simple Exponential Model for Dependent Defaults. Soc. Sci. Electron. Publ. 2002, 13, 74–83. [Google Scholar] [CrossRef]
- Nier, E.; Yang, J.; Yorulmazer, T.; Alentorn, A. Network Models and Financial Stability. Soc. Sci. Electron. Publ. 2007, 31, 2033–2060. [Google Scholar] [CrossRef]
- Steinbacher, M.; Steinbacher, M.; Steinbacher, M. Credit Contagion in Financial Markets: A Network-Based Approach. Muchich Personal RePEc Archive (MPRA) Paper 49616. 2013. Available online: https://mpra.ub.uni-muenchen.de/49616/1/MPRA_paper_49616.pdf (accessed on 30 October 2018).
- Anagnostou, I.; Sourabh, S.; Kandhai, D. Incorporating Contagion in Portfolio Credit Risk Models Using Network Theory. Complexity 2018, 2018, 6076173. [Google Scholar] [CrossRef]
- Petrone, D.; Latora, V. A Dynamic Approach Merging Network Theory and Credit Risk Techniques to Assess Systemic Risk in Financial Networks. Sci. Rep. 2018, 8, 5561. [Google Scholar] [CrossRef] [PubMed]
- Mitchell, M. Complex Systems: Network Thinking. Artif. Intell. 2006, 170, 1194–1212. [Google Scholar] [CrossRef]
- Yang, K.; Zhang, Z.Y. SIS-RP Model and Simulation of Supply Chain Network Risk Propagation. J. Beijing Jiaotong Univ. 2013, 37, 122–126. [Google Scholar]
- Chen, T.Q.; He, J.M. Research on Credit Risk Contagion Model Based on Complex Network. Soft Sci. 2014, 22, 1–10. [Google Scholar]
- Zhong, S.; Zhao, Y. A Buisness System towards Supply Chain Finance Based on Complex Network. In Proceedings of the International Conference on Logistics, Informatics and Service Sciences, Barcelona, Spain, 27–29 July 2015. [Google Scholar]
- Pastor-Satorras, R.; Vespignani, A. Epidemic Dynamics and Endemic States in Complex Networks. Phys. Rev. E 2001, 63, 066117. [Google Scholar] [CrossRef]
- Chen, Q.; Du, F. Financial Innovation, Systematic Risk and Commercial Banks’ Stability in China: Theory and Evidence. Appl. Econ. 2016, 48, 3887–3898. [Google Scholar] [CrossRef]
- Hearnshaw, E.J.S.; Wilson, M.J. A Complex Network Approach to Supply Chain Network Theory. Int. J. Oper. Prod. Manag. 2013, 33, 442–469. [Google Scholar] [CrossRef]
- Hofmann, E. Supply Chain Finance: Some Conceptual Insights; Springer: Berlin, Germany, 2005. [Google Scholar]
- Wang, Q.; Hartmann-Wendels, T. Credit Default Risk Contagion Modeling. J. Financ. Res. 2008, 10, 162–173. [Google Scholar]
- Bellamy, M.A.; Basole, R.C. Network Analysis of Supply Chain Systems: A Systematic Review and Future Research. Syst. Eng. 2013, 16, 235–249. [Google Scholar] [CrossRef]
- Watts, D.J.; Strogatz, S.H. Collectivedynamics of ’small-World’ Networks. Nature 1998, 393, 440–442. [Google Scholar] [CrossRef]
- Shang, Y. L Distinct Clusterings and Characteristic Path Lengths in Dynamic Small-world Networks with identical limit degree distribution. J. Stat. Phys. 2012, 149, 505–518. [Google Scholar] [CrossRef]
- Xin, Y.H.; Sun, Y.M. Analysis and Simulation Research of Supply Chain Robustness Considering the Risk Transmission. Sci. Technol. Manag. Res. 2017, 37, 245–253. [Google Scholar]
- Wang, W.; Fu, W.P. Review of Research on Modeling and Simulation for Dynamics and Complexity of Supply Chain Systems. J. Syst. Simul. 2010, 22, 71–279. [Google Scholar]
- Barabási, A.L.; Albert, R.; Jeong, H. Mean-Field Theory for Scale-Free Random Networks. Phys. A Stat. Mech. Its Appl. 1999, 272, 173–187. [Google Scholar] [CrossRef]
- Chakrabarty, B.; Zhang, G. Credit Contagion Channels: Market Microstructure Evidence from Lehman Brothers’ Bankruptcy. Financ. Manag. 2012, 41, 320–343. [Google Scholar] [CrossRef]
- Shang, Y. L Vulnerability of networks: Fractional percolation on random graphs. Phys. Rev. E 2014, 89, 012813. [Google Scholar] [CrossRef]
- Shang, Y. L Modeling epidemic spread with awareness and heterogeneous transmission rates in networks. J. Boil. Phys. 2013, 39, 489–500. [Google Scholar] [CrossRef]
- Shang, Y. L Discrete-time Epidemic Dynamics with Awareness in Random Networks. Int. J. Biomath. 2013, 6, 135007. [Google Scholar] [CrossRef]
Figure 1.
The supply chain finance network topology structure in the “1 + M + N” model.
Figure 2.
The schematic diagram of credit risk diffusion in supply chain finance network.
Figure 3.
The influence of influencing factors on the critical value of propagation probability. (a) from 0.6 to 1, step length is 0.1; (b) from 1 to 5, step length is 1; (c) from 1 to 1, step length is 1 (λ from 0 to 1); (d) from 100 to 1000, step length is 100.
Figure 3.
The influence of influencing factors on the critical value of propagation probability. (a) from 0.6 to 1, step length is 0.1; (b) from 1 to 5, step length is 1; (c) from 1 to 1, step length is 1 (λ from 0 to 1); (d) from 100 to 1000, step length is 100.


Figure 4.
The effect of influencing factors on infection density. (a) from 0.6 to 1, step length is 0.1; (b) from 1 to 5, step length is 1; (c) from 1 to 5, step length is 1; (d) from 100 to 1000, step length is 100.
Figure 4.
The effect of influencing factors on infection density. (a) from 0.6 to 1, step length is 0.1; (b) from 1 to 5, step length is 1; (c) from 1 to 5, step length is 1; (d) from 100 to 1000, step length is 100.

Figure 5.
The influence of the initial infection node selection on network risk infection density.

Figure 6.
The effect of different cure strategies on network risk infection density.
Figure 7.
The supply chain finance network structure.
Figure 8.
The influence of the initial infection node selection on credit risk diffusion.

Figure 9.
The influence of different cure strategies on credit risk diffusion.


Table 1.
The influencing factors and effect judgment.
| Influential Factors | Risk Diffusion Effect Index | |
|---|---|---|
| Critical Value of Risk Propagation Probability | Steady Infection Density | |
| general financing ratio | − | + |
| cure time | − | + |
| network structure | − | + |
| network scale | − | unknown |
Table 2.
The summary of the simulation experiment.
| Influencing Factors | Risk Diffusion Effect Index | ||
|---|---|---|---|
| Critical Value of Risk Propagation Probability | Steady Infection Density | Risk Diffusion Speed | |
| general financing ratio | − | + | + |
| cure time | 0 | + | 0 |
| network structure | − | + | + |
| network scale | 0 | 0 | 0 |
Table 3.
The variable assignment.
| Name of Variable | Assignment | Explanation |
|---|---|---|
| network scale | 246 | sum of enterprise B and suppliers with financing needs |
| network structure | core enterprise B | |
| initial network | sum of enterprise B and A-level suppliers | |
| assets under financing program | funds of suppliers occupied by enterprise B | |
| assets available for debt repayment | assets available to suppliers for mortgage financing | |
| general financing ratio | the mortgage rate of ordinary residential buildings | |
| financing amount | non-mortgage financing | |
| mortgage financing | ||
| cure time | recovery time of infected enterprises | |
| probability of risk propagation | risk propagation probability among enterprises |
© 2018 by the authors. Licensee MDPI, Basel, Switzerland. This article is an open access article distributed under the terms and conditions of the Creative Commons Attribution (CC BY) license (http://creativecommons.org/licenses/by/4.0/).
Share and Cite
MDPI and ACS Style
Zhao, Z.; Chen, D.; Wang, L.; Han, C. Credit Risk Diffusion in Supply Chain Finance: A Complex Networks Perspective. Sustainability 2018, 10, 4608. https://doi.org/10.3390/su10124608
AMA Style
Zhao Z, Chen D, Wang L, Han C. Credit Risk Diffusion in Supply Chain Finance: A Complex Networks Perspective. Sustainability. 2018; 10(12):4608. https://doi.org/10.3390/su10124608
Chicago/Turabian StyleZhao, Zebin, Dongling Chen, Luqi Wang, and Chuqiao Han. 2018. "Credit Risk Diffusion in Supply Chain Finance: A Complex Networks Perspective" Sustainability 10, no. 12: 4608. https://doi.org/10.3390/su10124608
Note that from the first issue of 2016, this journal uses article numbers instead of page numbers. See further details here.