1. Introduction
Based on the existing research results, the probability of a negative impact of climate change on the production of spring wheat is extremely high—both in the current climate context, and in the predicted future climate scenario [
1,
2,
3]. As agricultural production is affected by many factors, including economic, social, climatic factors, and so on, the study of the impacts of climate change is very difficult, although many studies have not considered the impact of economic and social factors [
4,
5,
6]. Integrated considerations of multi-factor impacts are required to assess the impact of climate change. A vulnerability assessment can make up for these shortcomings [
4,
7,
8].
The vulnerability assessment includes a sensitivity assessment and an adaptability assessment [
9,
10]. A sensitivity assessment refers to the response of a system, after being stimulated in the context of climate change, including adverse and beneficial effects. The properties of the system assessed are fully considered. An adaptability assessment refers to the response ability of a system in the context of climate change after adaptation, exercise, and structural adjustment. The evaluation of adaptation includes many external environments, such as human influence and socio-economic conditions [
11,
12,
13,
14]. External properties are fully considered. Vulnerability assessment of the system can not only reveal the reasons for the impact of climate change on the system, but also propose adaptation or mitigation measures based on these reasons [
15,
16]. The interpretation of vulnerability refers to the degree of difficulty in attacking the system, the difficulty of injury, and the difficulty of being damaged.
At the end of the 1960s, the word of vulnerability emerged in the research on natural disasters [
7,
17,
18]. In the early 1980s, the geologist Timmerman first proposed the concept of vulnerability [
15,
16]. Since then, the 1995 IPCC (Intergovernmental Panel on Climate Change) [
19] Second Assessment Report and the 2001 IPCC Third Assessment Report [
20] have defined and qualitatively analyzed the concept of vulnerability. In 2007 and 2013 [
21,
22], the IPCC Fourth Assessment Report and Fifth Assessment Report quantified vulnerability as a function of the system’s risk, sensitivity, and adaptive capacity, and the concept of vulnerability was further elaborated. Vulnerability refers to the extent to which a system is adversely affected by climate change and the extent to which it is incapable of responding to adverse effects [
7,
23,
24]. Vulnerability varies with the rate, characteristics, magnitude, etc., of climate change and variability faced by the system studied, and varies with the sensitivity of the system and its adaptive capacity [
17,
25,
26,
27,
28].
Based on previous studies, this paper introduces the crop model—the Agricultural Production System Simulator (APSIM)—and proposes an improved vulnerability assessment method. APSIM was developed by the Australian Federal Institute of Science and Technology and the Queensland Government’s Agricultural Production Research Collaborative Group to simulate the mechanism of the major components of a dry farming system [
29,
30,
31,
32]. Its applicability has been recognized around the world, including for crop management, cropping system changes, crop breeding, land-use change, climate change, and regional water balance. Currently, the APSIM model is primarily used to study the effects of climate change on crop yields [
33,
34,
35,
36].
Research shows that the APSIM model has good applicability to different crops, different climates, and different soils [
32,
34,
35,
37]. In Inner Mongolia, there are many types of crops, climate types (four climatic zones across humid, semi-humid, semi-arid, and arid), and soil types. This model is used to solve this problem. Currently, the APSIM model is primarily used to study the effects of climate change on crop yields. Research on applying this model to vulnerability assessment is still relatively scarce. Therefore, this paper attempts to introduce the APSIM model to vulnerability assessment in order to develop a new vulnerability assessment method.
2. Theory and Method
2.1. The Original Vulnerability Assessment Method
In 2014, Pan et al. [
25] proposed the evaluation method of vulnerability for the first time. In 2016, Zheng et al. [
18] further elaborated the method in the “200 questions on climate change adaptation”. The original vulnerability assessment method [
18,
25] was:
where
represents the climatic output in year
i,
represents the average climatic output in the reference period,
represents the adaptation output of year
i, and
represents the average adaptation output in the reference period.
The specific discussion of the vulnerability formula is as follows (
Table 1):
When the climatic output is less than the average value of the baseline climate output, and the adaptation output is less than the average value of the baseline adaptation output, then the system is fragile, the actual value of the vulnerability is positive, but the formula value is negative. The formula does not meet the actual situation.
When the climatic output is less than the average value of the baseline climate output, and the adaptation output is greater than the average value of the baseline adaptation output, if the absolute value of [climatic yield–the average value of the baseline climatic output] is greater than the absolute value of [adaptation output–the average value of the baseline adaptation output], the system is fragile, the actual value of vulnerability is positive, the formula value is positive, the formula is in line with the actual situation; if the absolute value of [climatic yield–the average value of the baseline climatic output] is less than the absolute value of [adaptation output–the average value of the baseline adaptation output], the system is not fragile, the actual value of the vulnerability is negative, but the formula value is positive, the formula does not conform to the actual situation.
When the climatic output is greater than the average value of the baseline climate output and the adaptation output is greater than the average value of the baseline adaptation output, then the system is not vulnerable, the actual value of the vulnerability is negative, and the formula value is negative. The formula is in line with the actual situation.
When the climatic output is greater than the average value of the baseline climate output, the adaptation output is less than the average value of the baseline adaptation output, if the absolute value of [climatic yield–the average value of the baseline climatic output] is greater than the absolute value of [adaptation output–the average value of the baseline adaptation output], the system is not fragile, the actual value of vulnerability is negative, but the formula value is positive, the formula does not meet the actual situation; if the absolute value of [climatic yield–the average value of the baseline climatic output] is less than the absolute value of [adaptation output–the average value of the baseline adaptation output]. The system is fragile, the actual value of the vulnerability is positive, and the formula value is positive. The formula is in line with the actual situation.
Here, we can see that in some cases the evaluation method of this vulnerability is feasible and in line with the actual situation, but in other cases the evaluation method of this vulnerability is not feasible and does not conform to the actual situation. The original vulnerability assessment method considers vulnerability as the ratio of sensitivity to adaptability. This also does not reflect the actual situations. This study considers vulnerability as the sum of the sensitivity and the adaptability.
Based on the analysis above, an improved method is developed as follows.
2.2. An Improved Vulnerability Assessment Method
According to IPCC assessment reports, vulnerability is a function of sensitivity, adaptability, and exposure [
19,
20,
21,
22]. Therefore, we quantify these three parameters and build a functional model based on previous studies [
7,
16,
17,
18,
25].
2.2.1. Sensitivity Assessment
Sensitivity characterizes the extent to which agricultural production systems are affected by climate change. Sensitivity can be described by the sensitive production, which is the output under climate conditions. The impact of climate change on wheat production is manifold, including the growth period, the water demand, etc. Apparently, the ultimate impact of climate change on agricultural production is reflected in the agricultural yields. Therefore, the change in crop yields is used to assess the response of agricultural production to climate change. It is important to note that the crop yield is also impacted by other factors. Sensitivity, i.e., sensitive production, is the climate output in the context of climate change. Sensitivity can be expressed as the ratio of the difference between the annual sensitive yield (climate yield) and the base period sensitive yield, and the baseline period sensitive yield average, and can be expressed as follows:
where
represents the sensitivity,
represents the climatic output in year
i, and
is the average climatic output in the reference period. The sensitivity index is positive, indicating that the climatic conditions during the study period had a positive effect on wheat production relative to the base period, resulting in an increase in wheat yield; a negative sensitivity index indicates that the climate in the study period is more detrimental to crop growth than the reference period climate. The larger the positive value or negative value, the more obvious the effect of increasing production or decreasing production, respectively.
2.2.2. Adaptability Assessment
The adaptive characterization of agricultural production systems is affected by factors other than climate change. These other factors include species renewal, the improvement of agronomic practices, and the development of agricultural mechanization, i.e., adaptation production is the total production minus the sensitive production. Adaptive quantification (adaptability) is represented by the ratio of the annual adaptation yield minus the base-period adaptation yield, to the base-period average adaptation yield, as follows:
where
represents adaptability,
represents the adaptation output of year
i, and
represents the average adaptation output in the reference period. The larger the
value, the stronger the adaptability, and vice versa. Adaptability may be positive or negative. When adaptability in the research period is stronger than the baseline period, adaptability is positive. There may be situations when the effect of improved varieties is not good, or the improvement of agronomic practices is inappropriate, the adaptive capacity would be damaged, and the adaptability would be negative.
2.2.3. Exposure Degree Assessment
Exposure is quantified by the exposure index (EI), which is expressed by the ratio of the crop area of a certain year to the average area planted in the base period, which reflects the extent to which agricultural production is affected by climate change. The equation is as follows:
where
represents the degree of exposure,
represents the area sown in the year
i, and
is the average sown area during the reference period. When the unit vulnerability of agricultural production is large, the increase in exposure will exacerbate the fragility of agricultural production and the reduction in exposure will reduce the fragility of agricultural production. When the agricultural production system is less brittle, the increase in exposure will be beneficial to the agricultural production and the decrease in exposure will adversely affect agricultural production.
2.2.4. Vulnerability Assessment
The main factors contributing to the agricultural production system includes the unit yield and the planting area of the crop. The product of these two factors is the total output of the agricultural production system. When evaluating the vulnerability of the agricultural production system, a unit vulnerability index (
UVI) and a regional vulnerability index (
VI) are established to measure the vulnerability degree and scope of the agricultural system. The unit vulnerability can be calculated as follows:
The equation for calculating the regional vulnerability is as follows:
Based on Equations (5) and (6), the changes in the vulnerability of a system will take place in the following scenarios (
Table 2):
When the adaptation output is less than the average value of the baseline adaptation output, the climatic output is less than the average value of the baseline climate output, the system changes in a fragile direction, the actual value of vulnerability is positive, and the formula value is positive. The formula is in line with the actual situation.
When the adaptation output is greater than the average value of the baseline adaptation output, the climatic output is less than the average value of the baseline climatic output, if the absolute value of [the adaptation output–the average value of the baseline adaptation output] is less than the absolute value of [climatic yield–the average value of the baseline climatic output], the system becomes fragile, the actual value of the vulnerability is a positive value, the formula value is a positive value, and the formula is in line with the actual situation; if the absolute value of [the adaptation output–the average value of the baseline adaptation output] is greater than the absolute value of [climatic yield–the average value of the baseline climatic output], the system is not vulnerable, the actual value of the vulnerability is negative, and the value of the formula is negative. This formula is in line with the actual situation.
When the adaptation output is greater than the average value of the baseline adaptation output, then the climatic output is greater than the average value of the baseline climate output, the system is not vulnerable, the actual value of vulnerability is negative, and the formula value is negative and is in line with the actual situation.
When the adaptation output is less than the average value of the baseline adaptation output, the climatic output is greater than the average value of the baseline climatic output, if the absolute value of [the adaptation output–the average value of the baseline adaptation output] is less than the absolute value of [the climatic yield–the average value of the baseline climatic output], the system is not vulnerable, the actual value of the vulnerability is negative, the formula value is negative, the formula is in line with the actual situation; if the absolute value of [the adaptation output–the average value of the baseline adaptation output] is greater than the absolute value of [the climatic yield–the average value of the baseline climatic output], the system is fragile, the actual value of the vulnerability is a positive value, and the formula value is a positive value, which is in line with the actual situation.
The analysis above shows that the quantitative assessment method of vulnerability is feasible. Next, this study used the improved vulnerability assessment method to assess the vulnerability of wheat production in Inner Mongolia, China.
2.3. Climate Yield Calculation Based on the APSIM-Wheat Model
The APSIM model has great similarity to other models in crop yield assessment. Unlike other models, its core aim is to highlight soil rather than crops. It can predict crop growth process and yield.
In this study, the climate yield and the adaptation yield are obtained using the APSIM model. First, the APSIM model is driven only by weather conditions, and the climate yield, i.e., the sensitive yield could be obtained. Then, tillage measures, including technical measures, such as irrigation and fertilization, are added to the model, and the output simulated by superimposed climatic conditions is the total output. The total yield minus the sensitive yield was the adaptation yield. The vulnerability index is calculated by substituting the sensitive yield and the adaption yield into the above-determined formula for the vulnerability.
2.4. Research Area Overview
In this study, Inner Mongolia is chosen as an example to demonstrate the availability of the improved method for evaluation of the vulnerability of agricultural production to climate change. Inner Mongolia is located in Northern China at approximately 97°10′–126°29′ E longitude, 37°30′–53°20′ N latitude; it measures 2400 km from east to west and 1700 km from north to south, and has a total area of 118.3 × 10⁶ hectares, of which 5.5 × 10⁶ hectares of arable land can be used. Inner Mongolia is an important ecological barrier in northern China. This region has an arid and semi-arid climate. The area of effective irrigation is 3.0 × 10⁶ hectares, the majority of which is water-saving irrigation, such as drip tubes, pipe irrigation, and channel lining.
2.5. Data Sources
The meteorological data were obtained from the China Meteorological Data Network (
http://data.cma.cn/), a daily dataset of China’s surface climate data, including average temperature, average wind speed, sunshine hours, average station pressure, average vapor pressure, daily maximum temperature, daily minimum temperature, average relative humidity, and precipitation. It was mainly used to analyze the climate change characteristics of Inner Mongolia and the data input of the APSIM model from 1981 to 2015.
The crop data used in this article were obtained from the National Meteorological Information Center and the Inner Mongolia Ecological and Agricultural Meteorological Center; the data included the spring wheat development period, sown density, yield structure, and main fieldwork records from the Agricultural Meteorological Station of Inner Mongolia from 1981 to 2015. These were mainly used for the verification of the parameters of the APISM model and the calculation of sensitivity and adaptability. The planting area was obtained from the Inner Mongolia Economic and Social Survey Yearbook and the Plant Management Division of the Ministry of Agriculture.
3. Results
3.1. Climate Change Characteristics and Determination of Base Period in Inner Mongolia
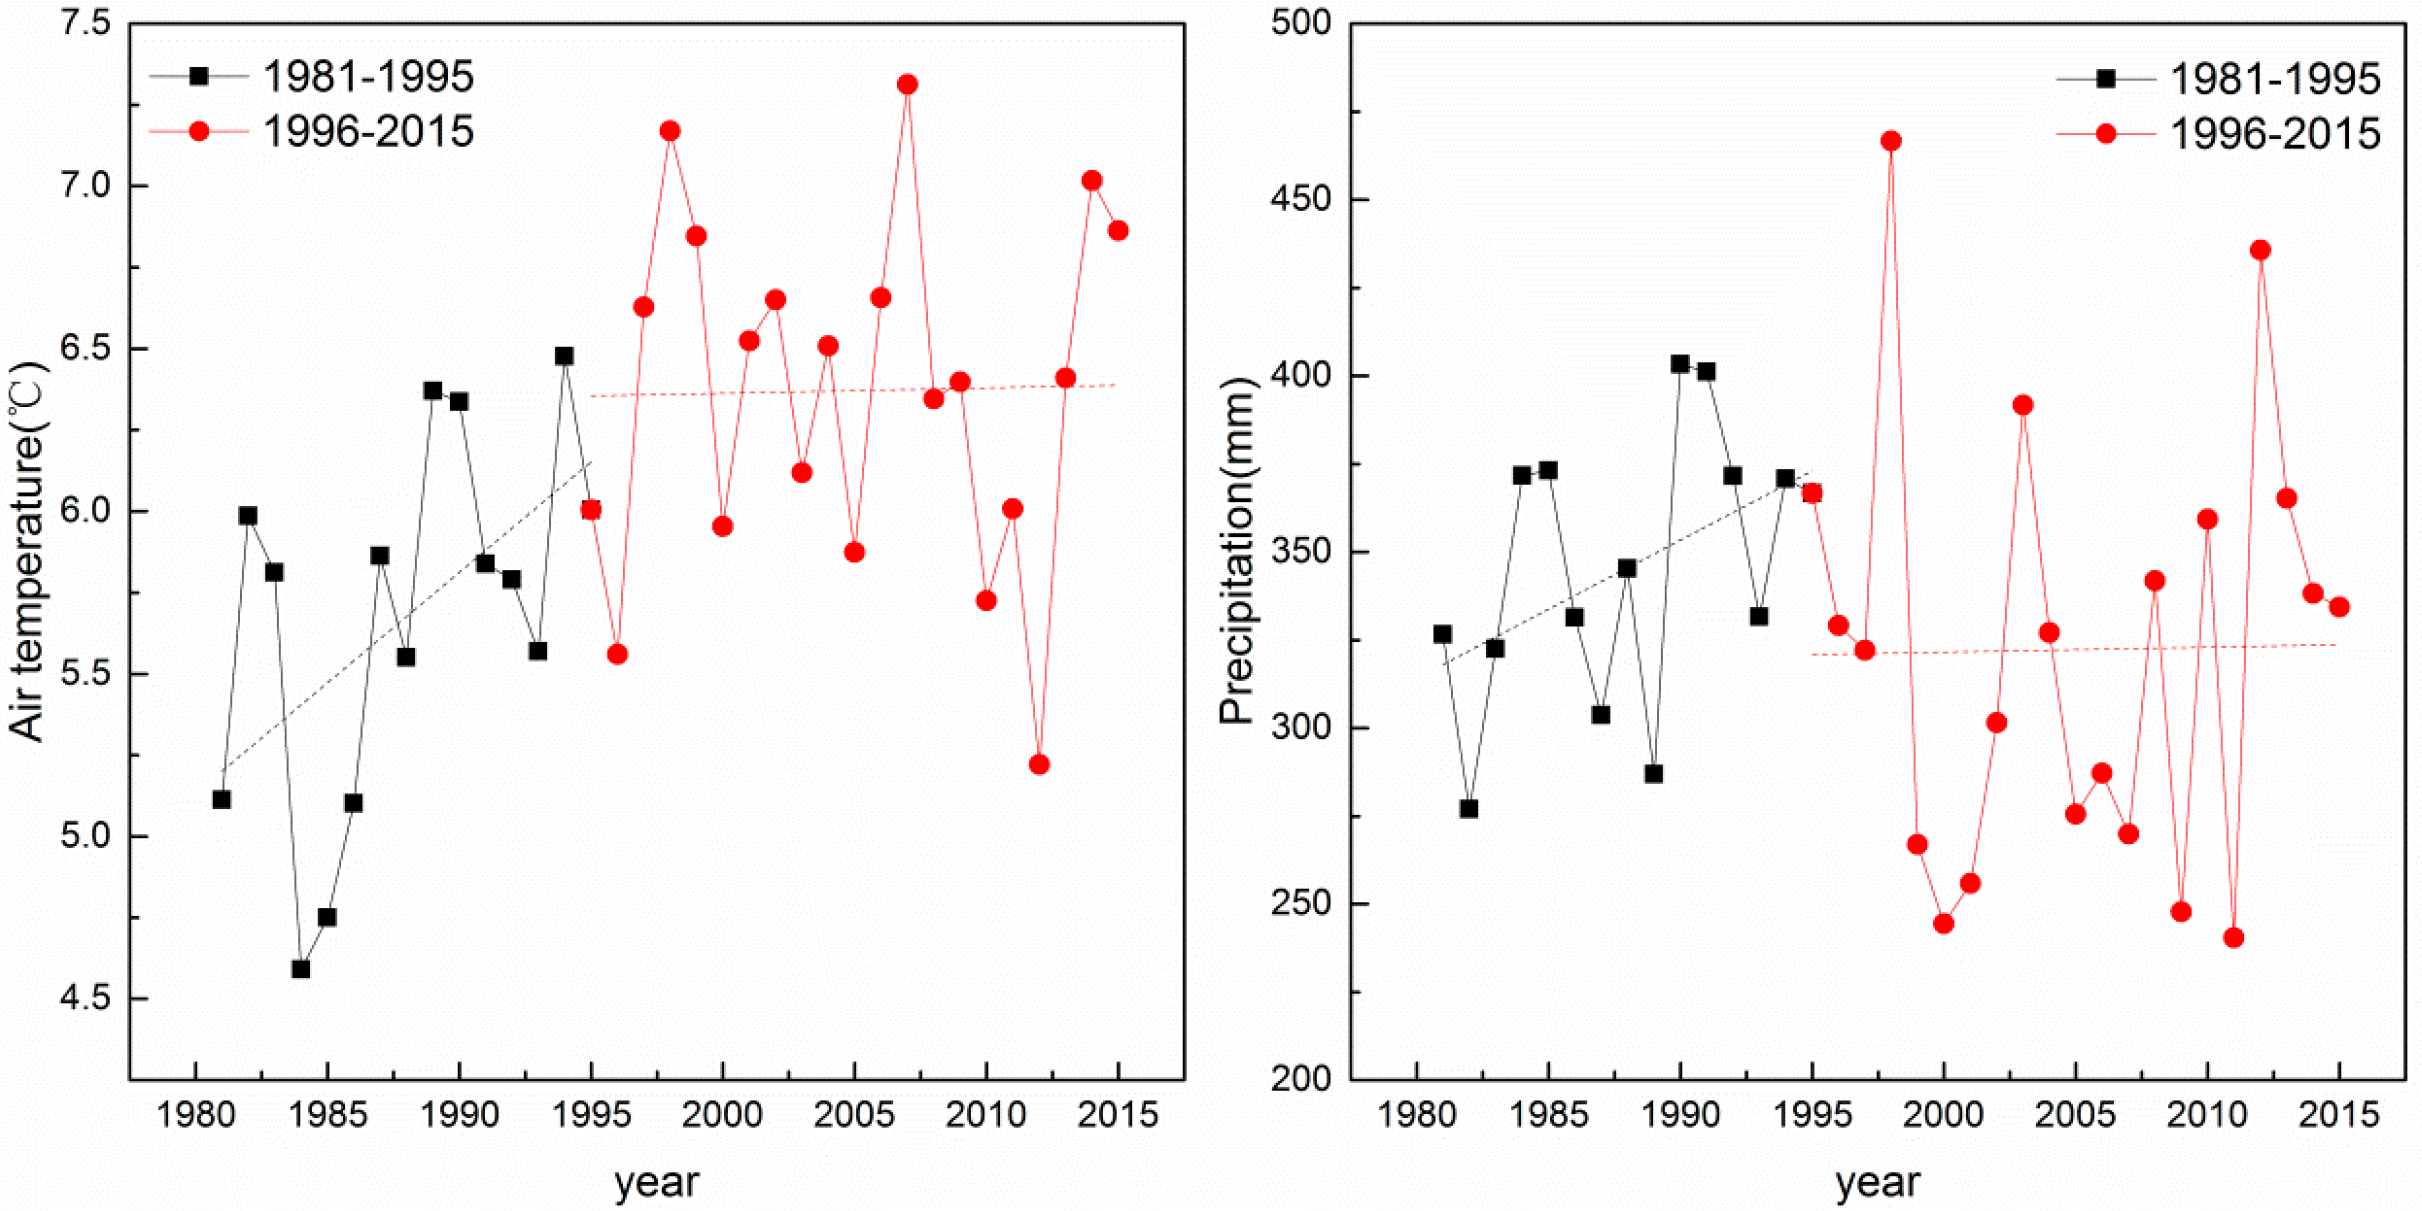
The change trends of temperature and precipitation in Inner Mongolia are shown in
Figure 1. From 1981 to 1995, the average daily temperature in Inner Mongolia was 5.68 °C and the average annual precipitation was 345.5 mm. From 1996 to 2015, the daily average temperature in Inner Mongolia was 6.39 °C and the average annual precipitation was 320.1 mm. Based on the Mann–Kendall method, the average temperature in Inner Mongolia mutated in 1996. Based on this, the period from 1981 to 1995 was used as the base period and 1996–2015 was used as the study period.
3.2. Parametric Verification and Simulation of the APSIM Model
The experimental data of spring wheat varieties from six typical agro-meteorological experimental stations in Inner Mongolia were selected (
Table 3) for debugging and validation of the model parameters. Zhalantun represents the eastern region of Inner Mongolia, Taipusi Banner and Chayouzhong Banner represent the central region of Inner Mongolia, and Tumote Left Banner, Guyang, and Linhe represent the western region of Inner Mongolia. The “trial and error method” was applied to debug the parameters of all representative varieties and the parameters of the representative varieties of each site were finally determined (
Table 3). The spring chemical sensitivity photoperiod sensitivity and grouting temperature were used to adjust the growth period of spring wheat. The number of grains per unit stalk was used to adjust the biomass and yield of the aboveground part of spring wheat.
Table 3 shows the crop parameters of 10 spring wheat cultivars at six representative sites in Inner Mongolia. From this table, it can be seen that vernalization sensitivity was between 1.7 and 2.4, photoperiod sensitivity was between 2.0 and 3.7, the accumulated temperature from grouting to mature was between 420 and 620 °C·d, and the grain number per stem was between 18.0 and 33.0. These parameter values are within reasonable limits [
35].
Table 4 shows that in the 10 simulated spring wheat varieties, the root mean square error (RMSE) of the observed days and the measured days of from sowing to emergence, from sowing to flowering, and from sowing to maturity were 0–1.7 d, 0.8–4.1 d, and 1.0–2.8 d, respectively. The normalized root mean square error (NRMSE) of partial biomass simulation and measurement was 12–24%, and the NRMSE of yield was 2–26%. The difference between the simulated value and the measured value was within a reasonable range [
36], indicating that the APSIM model can better simulate the aboveground biomass and yield of spring wheat.
In summary, the APSIM-wheat model has a good adaptability in Inner Mongolia and can be applied to simulate the spring wheat production in Inner Mongolia.
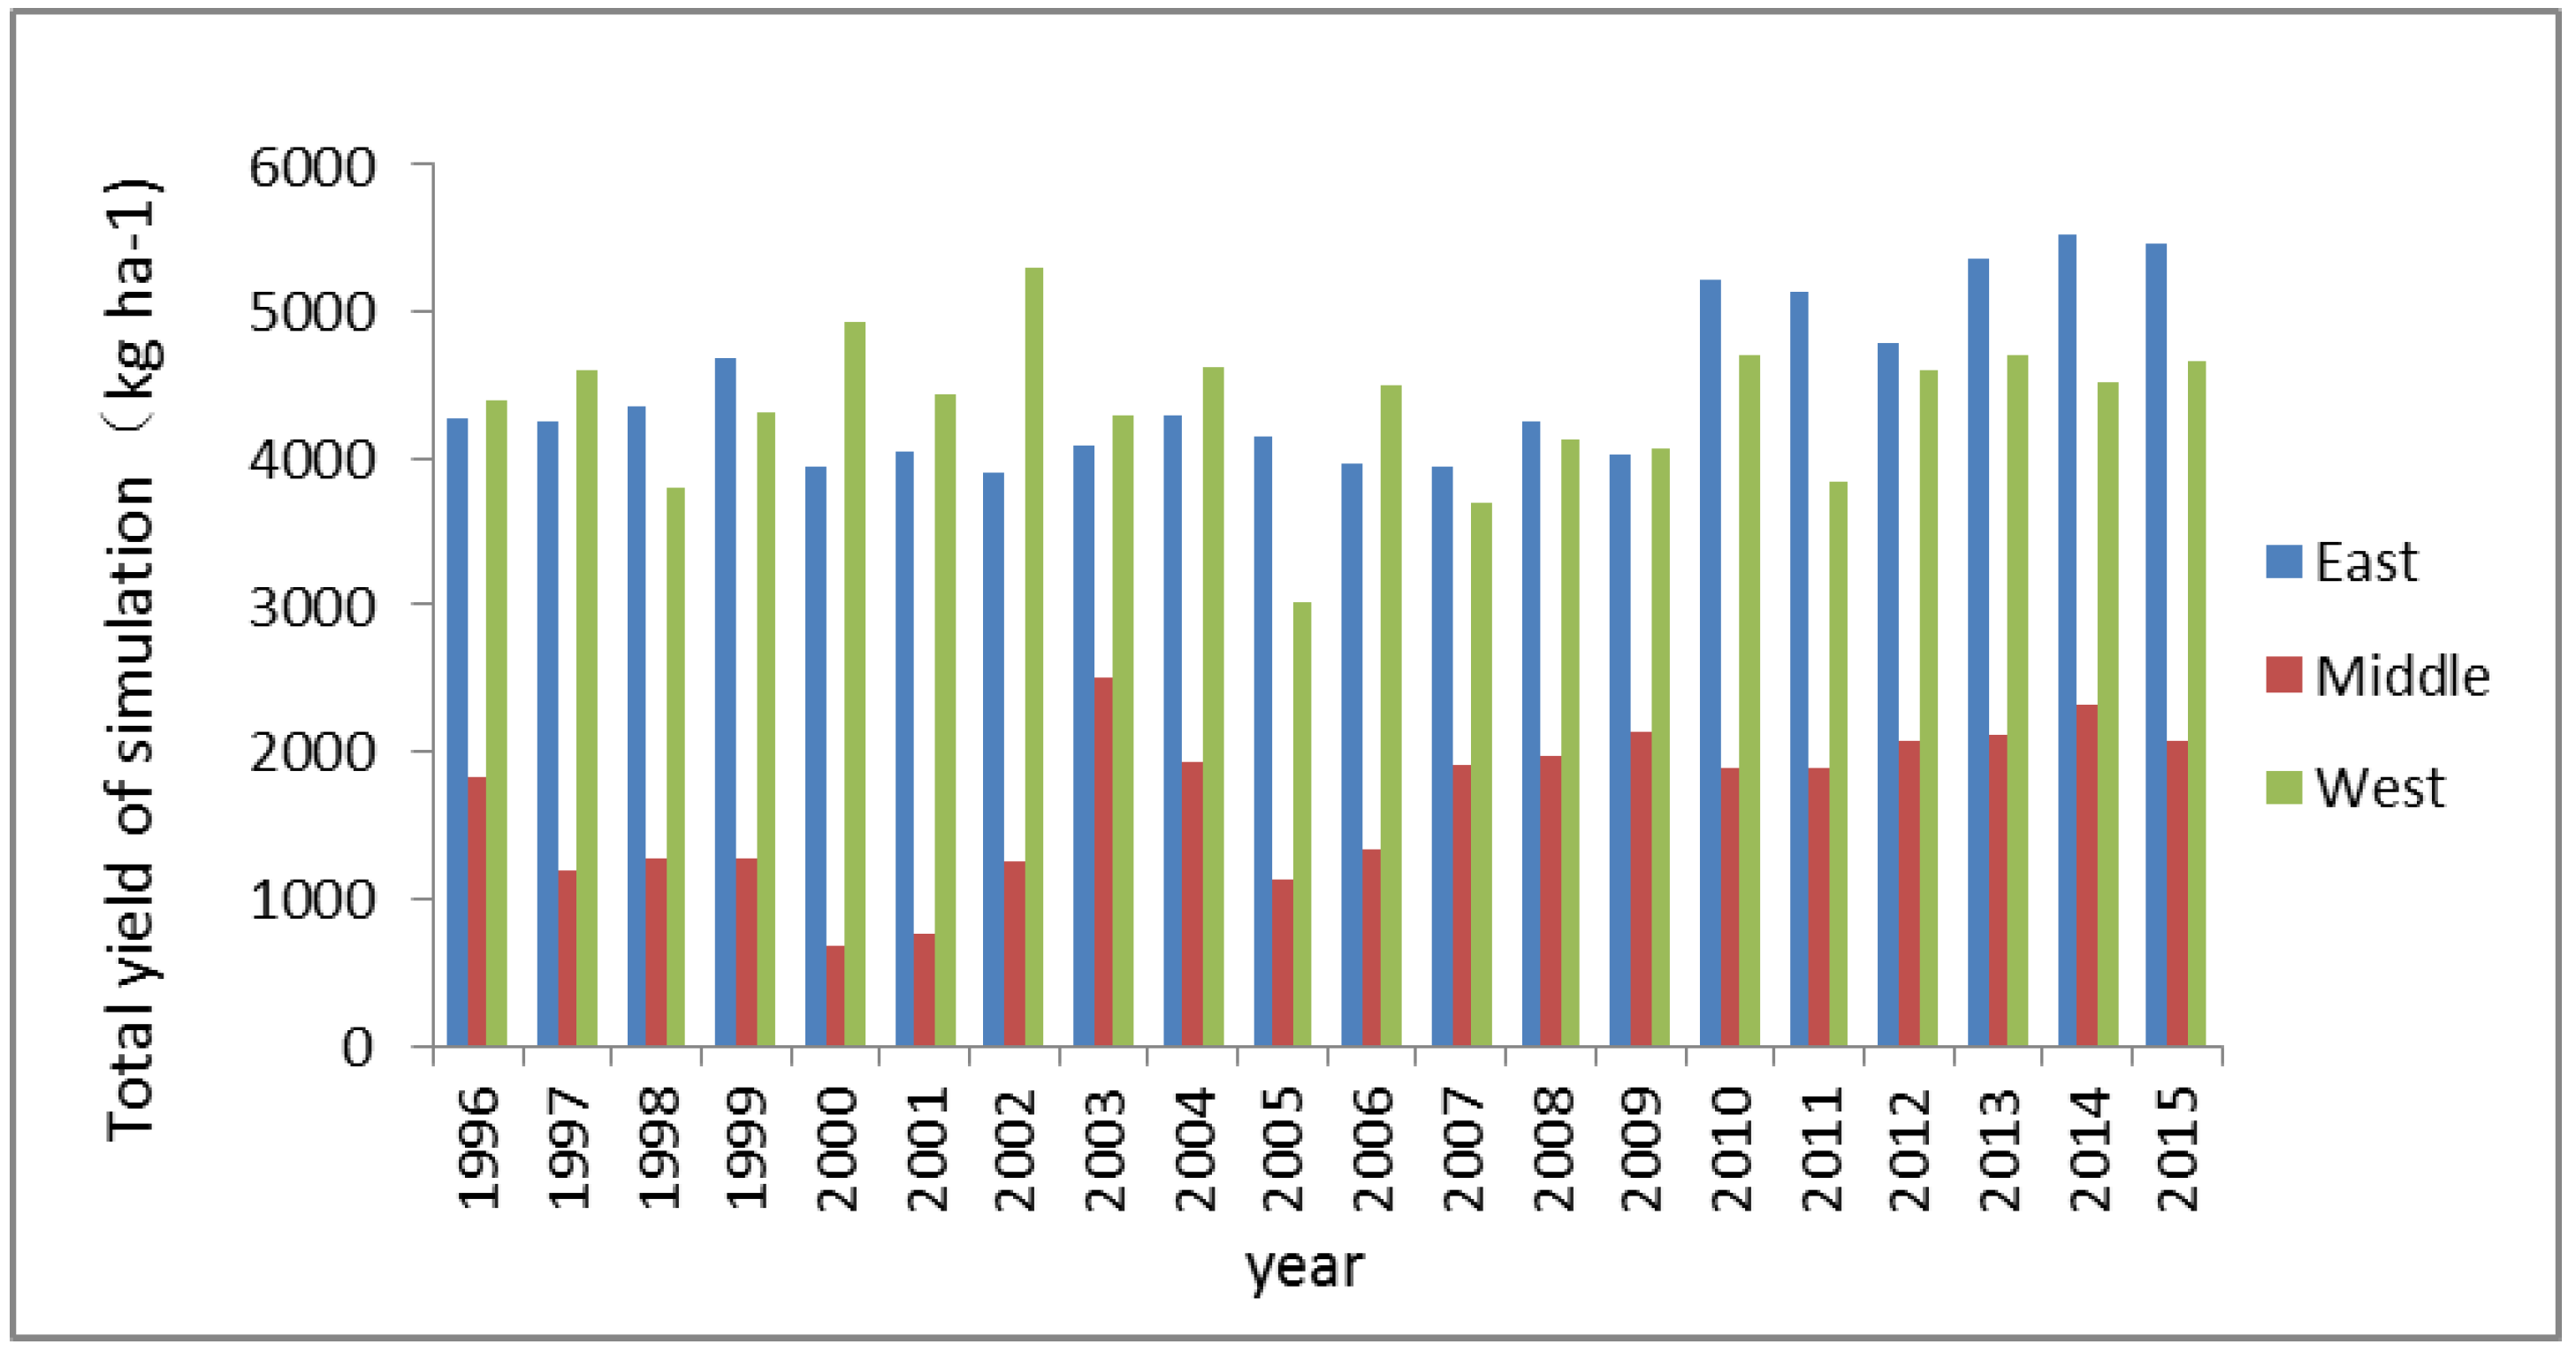
Based on this, we can use the model to simulate the sensitive yields and total yields of spring wheat in the study area. Through simulation, the sensitive production of the research site from 1996 to 2015 was obtained (
Figure 2). When agronomic measures (also known as adaptation measures) were added to the model, the total output of climate and adaptation measures were obtained (
Figure 3). The total output minus the sensitive production yields the adaptation output, which is calculated separately to obtain the components in the vulnerability assessment.
3.3. Vulnerability Assessment
We conducted vulnerability assessments for three sites in Inner Mongolia: Zhalantun, representing the eastern part, Chayouzhong Banner and Taipusi Banner, representing the central region, and Guyang, Tumote Left Banner, and Linhe, representing the western area.
The vulnerability of the eastern region is shown in
Figure 4. From 1996 to 2015, the average sensitivity in the eastern region was 0.03, showing a significant downward trend (
P < 0.001); the trend rate was 0.23/10a, indicating that the climatic conditions were increasingly detrimental to the yield of spring wheat. The sensitivity is positive, indicating that the impact of climate change on the yield per unit area of spring wheat is positive, but the degree of favorableness decreased. After 2006, the sensitivity was negative, and the impact of climate change on wheat yield began to show an increasingly negative effect. The average adaptability was 0.50 from 1996 to 2015; all are positive, showing a significant upward trend (
P < 0.001) of 0.33/10a, indicating that during the study period the adaptation output increased compared with the reference period. The unit vulnerability first showed an increasing trend and then a decreasing trend. From 1996 to 2009, the average vulnerability of the unit vulnerability was −0.44, showing a significant upward trend (
P < 0.001). From 2009–2015 the trend rate was 0.29/10a. The average unit vulnerability was −0.68, showing a significant decreasing trend (
P < 0.05) of 0.72/10a. Regional vulnerability was the same as the unit vulnerability. From 1996 to 2009, regional vulnerability showed a significant upward trend (
P < 0.001) of 0.63/10a. From 2009 to 2015, unit vulnerability significantly reduced (
P < 0.05); the trend rate was 0.52/10a.
The vulnerability in the central region is shown in
Figure 5. From 1996 to 2015, the average sensitivity of the central region was −0.22, with no obvious change trend. As a whole, the impact of climate change on the unit yield of spring wheat was negative. The average adaptability was 0.53, showing a significant increasing trend (
P < 0.001) of 0.67/10a. The adaptation yields during 1997–2001 and in 2005 were lower than in the base period. In the remaining years, the adaptation yields were higher than in the base period, and the adaptability was positive. Overall, the adaptability during the research period was higher than during the base period, and significantly increased. The average unit vulnerability was −0.30, showing a significant decreasing trend (
P < 0.05) of 0.55/10a. The average regional vulnerability was −0.08, showing a significant decreasing trend (
P < 0.05) of 0.13/10a.
The vulnerability of the western region is shown in
Figure 6. From 1996 to 2015, the average sensitivity of the western region was 0.28, showing a significant downward trend (
P < 0.001) of −0.23/10a, which means that climate change was increasingly detrimental to the yield of spring wheat. The average adaptability was 0.27, and the trend of change was not significant. The average unit vulnerability was −0.30, and the trend of change was not significant. The average regional vulnerability was −0.23, showing a significant increasing trend (
P < 0.01).
4. Discussion
The above analysis shows:
In the eastern region of Inner Mongolia, the vulnerability showed a significant increase during 1996–2008, but a significant downward trend during 2009–2015, mainly due to the fact that during 1996–2008 the absolute value of sensitivity was higher than the adaptability, which means that the negative impact of climate on spring wheat was greater than the positive impact of adaptation measures. In 2009–2015, the absolute value of sensitivity was lower than that of adaptability, which means that the positive impact of adaptation measures on spring wheat was greater than the negative impact of climate on spring wheat. This result is consistent with the actual.
In the central region, the vulnerability showed a significant downward trend from 1996 to 2015, mainly because the adaptability was greater than the absolute value of sensitivity, which means that the positive impact of adaptation measures on spring wheat was greater than the negative impact of climate change.
In the western region, the vulnerability showed a significant increasing trend, mainly due to the low adaptability and the high absolute value of sensitivity. In general, the negative impact of climate on spring wheat was greater than the positive impact of adaptation measures on spring wheat.
Comparing the eastern, central, and western regions of Inner Mongolia, we found that the sensitivity of the western region was greatest, followed by the eastern region and the central region; this indicates that the climate was most favorable for spring wheat production in the western region, followed by the eastern region, and that the central region was the most disadvantageous for spring wheat production. Studies have shown that in recent years the rainfall in the eastern and western regions has gradually increased, while the rainfall in the central region has gradually decreased. This may be one of the reasons for the research results. The adaptability of the central region was the highest, followed by the eastern region and western region; this indicates that, comparing with the adaptability in the base period, the improving degree of adaptation abilities in the central and eastern regions were higher than that in the western regions, which is consistent with real situation of Inner Mongolia’s economic development [
38,
39]. It is known that, in general, the better the economy, the better the farmland water conservancy and the agricultural disaster prevention and mitigation, so the adaptability is better in the vulnerability evaluation [
39,
40,
41]. The vulnerabilities of the central and western regions are close to each other, and are both larger than that of the eastern region; this indicates that the agricultural production of spring wheat in the central and western regions is more fragile, both in terms of climate and of non-climatic factors. If the agricultural production is to be expanded in the central and western regions in the future, the government should pay more attention to overcoming the adverse effects of climate on agriculture, and increase investment in the economy.
Through the evaluation of the improved vulnerability assessment method, and using the improved method to evaluate the vulnerability of spring wheat in Inner Mongolia, we found that the improved vulnerability assessment method makes up for the disadvantage of the original vulnerability assessment method and can more scientifically and reasonably reflect the vulnerability of spring wheat production in Inner Mongolia under the background of climate change. This paper creatively introduces the APSIM crop model as an important tool in the vulnerability assessment method which can distinguish the climate yield and the adaptation yield more simply, scientifically, and reasonably. The research results also show the superiority of the crop model. However, there are still some problems with the improved vulnerability assessment method. For example, the functional representation of sensitivity and adaptability may not have a simple linear relationship, but may have a more complex trajectory. Therefore, determining how to more accurately quantify sensitivity and adaptability remains a subject for major research in the future.
5. Conclusions
This study modifies the framework of vulnerability assessment and considers vulnerability to be the sum of sensitivity and adaptability. Most of the current vulnerability studies are functional models or statistical methods. This study attempts to use crop models for vulnerability assessment. Additionally, we take the spring wheat of Inner Mongolia, China, as a case study for vulnerability assessment. The results show that the adaptability of three regions in Inner Mongolia has been increasing. Among them, the adaptability of the eastern and central regions increased significantly during the study period. This shows that agronomic measures have played a positive role in the vulnerability of wheat production. The sensitivity of the three regions has been decreasing, with the sensitivity of the eastern and western regions significantly decreasing. This shows that climatic conditions have a negative effect on the vulnerability of wheat production. The fragility of the eastern region first increased and then decreased, turning around in 2009. From 1996 to 2009, because the percentage of adaptive growth was less than the percentage of sensitivity reduction, the vulnerability of spring wheat production in Inner Mongolia showed a highly significant increase. From 2009 to 2015, the percentage of adaptive growth was greater than the decrease in sensitivity; the percentage showed a significant decrease. From 1996 to 2015, the vulnerability of spring wheat production in the central region showed a significant downward trend. From 1996 to 2015, due to the significant decrease in sensitivity and the lack of adaptability, the unit vulnerability of the western region increased. With the increase in exposure, the regional vulnerability showed a significant increase.
This method is more scientifically constructed to establish a relationship between sensitivity and adaptability. The above results are consistent with the actual situation, indicating that this method is feasible and more practical than previous methods. Based on the results, this method can play a positive role in assessing the quantitative impact of climate change on agricultural production. The impact of climate change is very complex. For dry land agriculture, not only do climatic factors have an important impact on crop production, but human activities also occupy an important position in production. Determining how to distinguish climatic elements from human activities is one of the most important, yet most difficult, points for vulnerability research. This study uses crop models to separate the two, and can effectively distinguish the impact of climatic factors and human activities on agricultural production. At the same time, this paper also hopes to reveal the theoretical basis of the impact of climate change on agriculture.
Author Contributions
Conceptualization, Z.P. and D.F.; Methodology, D.F. and Z.P.; Software, D.F.; Validation, D.F., Z.P. and F.Y.; Formal Analysis, D.F.; Investigation, D.F., X.S., Y.P., G.H., J.W., D.W. and Z.D.; Resources, Z.P., D.F. and F.Y.; Data Curation, D.F.; Writing-Original Draft Preparation, D.F.; Writing-Review & Editing, Z.P., X.S. and D.F.; Visualization, D.F. and X.S.; Supervision, X.S. and F.Y.; Project Administration, F.Y.; Funding Acquisition, F.Y.
Funding
This paper is supported by the national key R&D program of China (No. 2018YFA0606303), the Public Welfare Industry (Meteorological) Research Project (No. GYHY201506001) and the Non-profit Research Foundation for Meteorology of China (No. GYHY201506016).
Acknowledgments
I would like to thank the reviewers and academic editors for their valuable suggestions, thanks to my editor for her hard work, and thanks to my family, friends and colleagues for their encouragement, support and help. The help and support of all of you has made me a successful ending in this year.
Conflicts of Interest
The authors declare no conflicts of interest.
References
- Yun, X. Analysis of sensitivity of crop yields to climate resource function in China. Resour. Sci. 1999, 6, 004. [Google Scholar]
- Zhang, Q.; Deng, Z.Y.; Zhao, Y.D.; Qiao, J. The impacts of global climatic change on the agriculture in northwest China. Acta Ecol. Sin. 2008, 28, 1210–1218. [Google Scholar]
- Pan, S.; Tian, H.; Dangal, S.R.; Zhang, C.; Yang, J.; Tao, B.; Ouyang, Z.; Wang, X.; Lu, C.; Ren, W.; et al. Complex spatiotemporal responses of global terrestrial primary production to climate change and increasing atmospheric CO2 in the 21st century. PLoS ONE 2014, 9, e112810. [Google Scholar] [CrossRef] [PubMed]
- Wang, J.; Feng, J.; Yang, L.; Guo, J.; Pu, Z. Runoff-denoted drought index and its relationship to the yields of spring wheat in the arid area of Hexi corridor, Northwest China. Agric. Water Manag. 2015, 96, 666–676. [Google Scholar] [CrossRef]
- Xiao, G.; Zhang, Q.; Wang, J. Research progress of global climate change on agro-ecosystems. Chinese Chin. J. Appl. Ecol. 2007, 18, 1877–1885. [Google Scholar]
- Lobell, D.B.; Field, C.B. Global scale climate–crop yield relationships and the impacts of recent warming. Environ. Res. Lett. 2007, 2, 014002. [Google Scholar] [CrossRef]
- Roberts, M.G.; Heesterbeek, J.A.P. A new method for estimating the effort required to control an infectious disease. Proc. Biol. Sci. 2003, 270, 1359–1364. [Google Scholar] [CrossRef]
- Lobell, D.B.; Burke, M.B.; Tebaldi, C.; Mastrandrea, M.D.; Falcon, W.P.; Naylor, R.L. Prioritizing Climate Change Adaptation Needs for Food Security in 2030. Science 2008, 319, 607–610. [Google Scholar] [CrossRef]
- Luers, A.L.; Lobell, D.B.; Sklar, L.S.; Addams, C.L.; Matson, P.A. A method for quantifying vulnerability, applied to the agricultural system of the Yaqui Valley, Mexico. Glob. Environ. Chang. 2003, 13, 255–267. [Google Scholar] [CrossRef]
- Zhang, D.J.; Gao, H.; Yang, J. Assessment for the ecological vulnerability of Nansihu wetland based on GIS technology. Resour. Sci. 2014, 36, 874–882. [Google Scholar]
- Lobell, D.B.; Schlenker, W.; Costa-Roberts, J. Climate Trends and Global Crop Production Since 1980. Science 2011, 333, 616–620. [Google Scholar] [CrossRef] [PubMed]
- Lahsen, M.; Sanchez-Rodriguez, R.; Lankao, P.R.; Dube, P.; Leemans, R.; Gaffney, O.; Mirza, M.; Pinho, P.; Osman-Elasha, B.; Smith, M.S. Impacts, adaptation and vulnerability to global environmental change: Challenges and pathways for an action-oriented research agenda for middle-income and low-income countries. Curr. Opin. Environ. Sustain. 2010, 2, 364–374. [Google Scholar] [CrossRef]
- Thirumalaivasan, D.; Karmegam, M.; Venugopal, K. AHP-DRASTIC: Software for specific aquifer vulnerability assessment using DRASTIC model and GIS. Environ. Model. Softw. 2003, 18, 645–656. [Google Scholar] [CrossRef]
- Ren, X.; Hu, G.; Dong, Z. Key laboratory of Desert and Desertification, Cold and Arid Regions Environmental and Engineering Research Institute; Chinese Academy of Sciences. The concept and assessment of desertification vulnerability. J. Desert Res. 2015, 1. [Google Scholar] [CrossRef]
- Janetos, A.; Leary, N.; Levy, M.A. Assessing Vulnerability to Global Environmental Risks. In Report of the Workshop on Vulnerability to Global Environmental Change: Challenges for Research; Harvard University: Cambridge, MA, USA, 2000. [Google Scholar]
- Timmerman, P. Vulnerability, Resilience and the Collapse of Society:A Review of Models and Possible. Climatic Applications; Institute for Environm ental Studies, University of Toronto: Toronto, ON, Canada, 1981. [Google Scholar]
- Turner, B.L.; Matson, P.A.; Mccarthy, J.J.; Corell, R.W.; Christensen, L.; Eckley, N.; Hovelsrud-Broda, G.K.; Kasperson, J.X.; Kasperson, R.E.; Luers, A.; et al. Illustrating the coupled human-environment system for vulnerability analysis: Three case studies. Proc. Natl. Acad. Sci. USA 2003, 100, 8080–8085. [Google Scholar] [CrossRef] [PubMed]
- Zheng, D.; Pan, Z.; Pan, X. 200 Questions on Climate Change Adaptation; China Meteorological Press: Beijing, China, 2016. [Google Scholar]
- IPCC. Technical Summary. In Climate Change 1995: Impacts, Adaptation, and Vulnerability. Contribution of Working Group II to the Second Assessment Report of the Intergovernmental Panel on Climate Change; Watson, R.T., Zinyowera, M.C., Moss, R.H., Eds.; Cambridge University Press: Cambridge, UK, 1995. [Google Scholar]
- IPCC. Technical Summary. In Climate Change 2001: Impacts, Adaptation, and Vulnerability. Contribution of Working Group II to the Third Assessment Report of the Intergovernmental Panel on Climate Change; White, K.S., Ahmad, Q.K., Anisimov, O., Eds.; Cambridge University Press: Cambridge, UK, 2001. [Google Scholar]
- IPCC. Technical Summary. In Climate Change 2007: Impacts, Adaptation, and Vulnerability. Contribution of Working Group II to the Fourth Assessment Report of the Intergovernmental Panel on Climate Change; Parry, M.L., Canziani, O.F., Palutikof, J.P., Eds.; Cambridge University Press: Cambridge, UK, 2007. [Google Scholar]
- IPCC. Approved Summary for Policymakers. In Climate Change 2013: The Physical Science Basis Summary for Policymakers. Contribution of Working Group I to the Fifth Assessment Report of the Intergovernmental Panel on Climate Change; Alexander, L., Allen, S., Bindoff, N.L., Eds.; Cambridge University Press: Cambridge, UK, 2013. [Google Scholar]
- Sioshansi, F.P. Global climate change: Here to stay. Util. Policy 2005, 13, 240–246. [Google Scholar] [CrossRef]
- Smith, E.R.; Mckinnis, P.; Tran, L.T.; et al. The effects of uncertainty on estimating the relative environmental quality of watersheds across a region. Landsc. Ecol. 2006, 21, 225–231. [Google Scholar] [CrossRef]
- Dong, Z.; Pan, Z.; An, P.; Wang, L.; Zhang, J.; He, D.; Han, H.; Pan, X. A novel method for quantitatively evaluating agricultural vulnerability to climate change. Ecol. Indic. 2015, 48, 49–54. [Google Scholar] [CrossRef]
- Turner, B.L.; Kasperson, R.E.; Matson, P.A.; McCarthy, J.J.; Corell, R.W.; Christensen, L.; Eckley, N.; Kasperson, J.X.; Luers, A.; Martello, M.L.; et al. A framework for vulnerability analysis in sustainability science. Proc. Natl. Acad. Sci. USA 2003, 100, 8074–8079. [Google Scholar] [CrossRef]
- Metzger, M.J.; Leemans, R.; SchrTer, D. A multidisciplinary multi-scale framework for assessing vulnerabilities to global change. Int. J. Appl. Earth Obs. Geoinf. 2005, 7, 267. [Google Scholar] [CrossRef]
- Parry, M.; Rosenzweig, C.; Livermore, M. Climate change, global food supply and risk of hunger. Philos. Trans. R. Soc. Lond. 2005, 360, 2125–2138. [Google Scholar] [CrossRef] [PubMed]
- Mccown, R.L.; Hammer, G.L.; Hargreaves, J.N.G.; Holzworth, D.; Huth, N.I. APSIM: An Agricultural Production System Simulation Model for Operational Research; Elsevier Science Publishers BV: Toowoomba, Australia, 1995; pp. 225–231. [Google Scholar]
- Asseng, S.; Keulen, H.V.; Stol, W. Performance and application of the APSIM Nwheat model in the Netherlands. Eur. J. Agron. Off. J. Eur. Soc. Agron. 2000, 12, 37–54. [Google Scholar] [CrossRef]
- Sinclair, T.R.; Seligman, N. Criteria for publishing papers on crop modeling. Field Crops Res. 2000, 68, 165–172. [Google Scholar] [CrossRef]
- Yuying, S.; Zhibiao, N.; Bellotti, B. Development and application of APSIM model. Chin. J. Appl. Ecol. 2002, 8, 1027–1032. [Google Scholar]
- Wang, E.; Robertson, M.J.; Hammer, G.L.; Carberry, P.S.; Holzworth, D.; Meinke, H.; Chapman, S.C.; Hargreaves, J.N.G.; Huth, N.I.; McLean, G. Development of a generic crop model template in the cropping system model APSIM. Eur. J. Agron. 2002, 18, 121–140. [Google Scholar] [CrossRef]
- Zhang, X.C. Calibration, refinement, and application of the WEPP model for simulating climatic impact on wheat production. Trans. ASAE 2004, 47, 1199–1202. [Google Scholar] [CrossRef]
- Fan, D.; Pan, Z.; Yang, F.; Zhang, J.; Dong, Z.; Pan, Y. Adaptability of APSIM-wheat model in arid and semi-arid regions: A case study in Inner Mongolia. J. Arid Land Resour. Environ. 2018, 6. Available online: http://www.cnki.com.cn/Article/CJFDTotal-GHZH201806015.htm (accessed on 30 October 2018).
- Keating, B.A.; Carberry, P.S.; Hammer, G.L.; Probert, M.E.; Robertson, M.J.; Holzworth, D.; Huth, N.I.; Hargreaves, J.N.; Meinke, H.; Hochman, Z.; et al. An overview of APSIM, a model designed for farming systems simulation. Eur. J. Agron. 2003, 18, 267–288. [Google Scholar] [CrossRef]
- Asseng, S.; Ritchie, J.T.; Smucker, A.J.M.; Robertson, M.J. Root growth and water uptake during water deficit and recovering in wheat. Plant Soil 1998, 201, 265–273. [Google Scholar] [CrossRef]
- Hai, S.; Wuyundalai, M. Research on the “Vulnerability” of Inner Mongolia Grassland Animal Husbandry in Natural Disasters—Taking the Xilingguolemeng Pastoral Area as an Example. J. Catastrophol. 2009, 24, 105–109. [Google Scholar]
- He, M. Quantitative Economic Analysis of Agricultural Input and Benefit in Inner Mongolia. J. North China Agric. Univ. 2002, 17, 140–144. [Google Scholar]
- Gao, P.; Dou, Z. Comparative Study on Agricultural Economic Development Level of Inner Mongolia Autonomous Region. J. Inner Mongol. Agric. Univ. Soc. Sci. Ed. 2006, 8, 39–40. [Google Scholar]
- Bao, H.; Zhang, Y. Present Situation, Problems Analysis and Corresponding Countermeasures for the Development of Agriculture and Animal Husbandry in Inner Mongolia; Inner Mongolia Science and Technology and Economy: Inner Mongolia, Chins, 2014; pp. 3–5. [Google Scholar]
© 2018 by the authors. Licensee MDPI, Basel, Switzerland. This article is an open access article distributed under the terms and conditions of the Creative Commons Attribution (CC BY) license (http://creativecommons.org/licenses/by/4.0/).


